Online Social Networks (OSN) Evolution Model Based on Homophily and Preferential Attachment


Abstract
1. Introduction
- We propose a novel SN evaluation model based on the principles of homophily combined with preferential attachments.
- We generated a synthetic dataset with the proposed model that can be used as an approximation of data from real-life SN and can be used for the evaluation of the SN models for different application domains.
2. Background and Related Work
2.1. Social Network Topology Based Evolution Modelling
2.2. Homophily Based Social Network Evolution Modeling
2.3. Social Network Synthetic Graph Generation
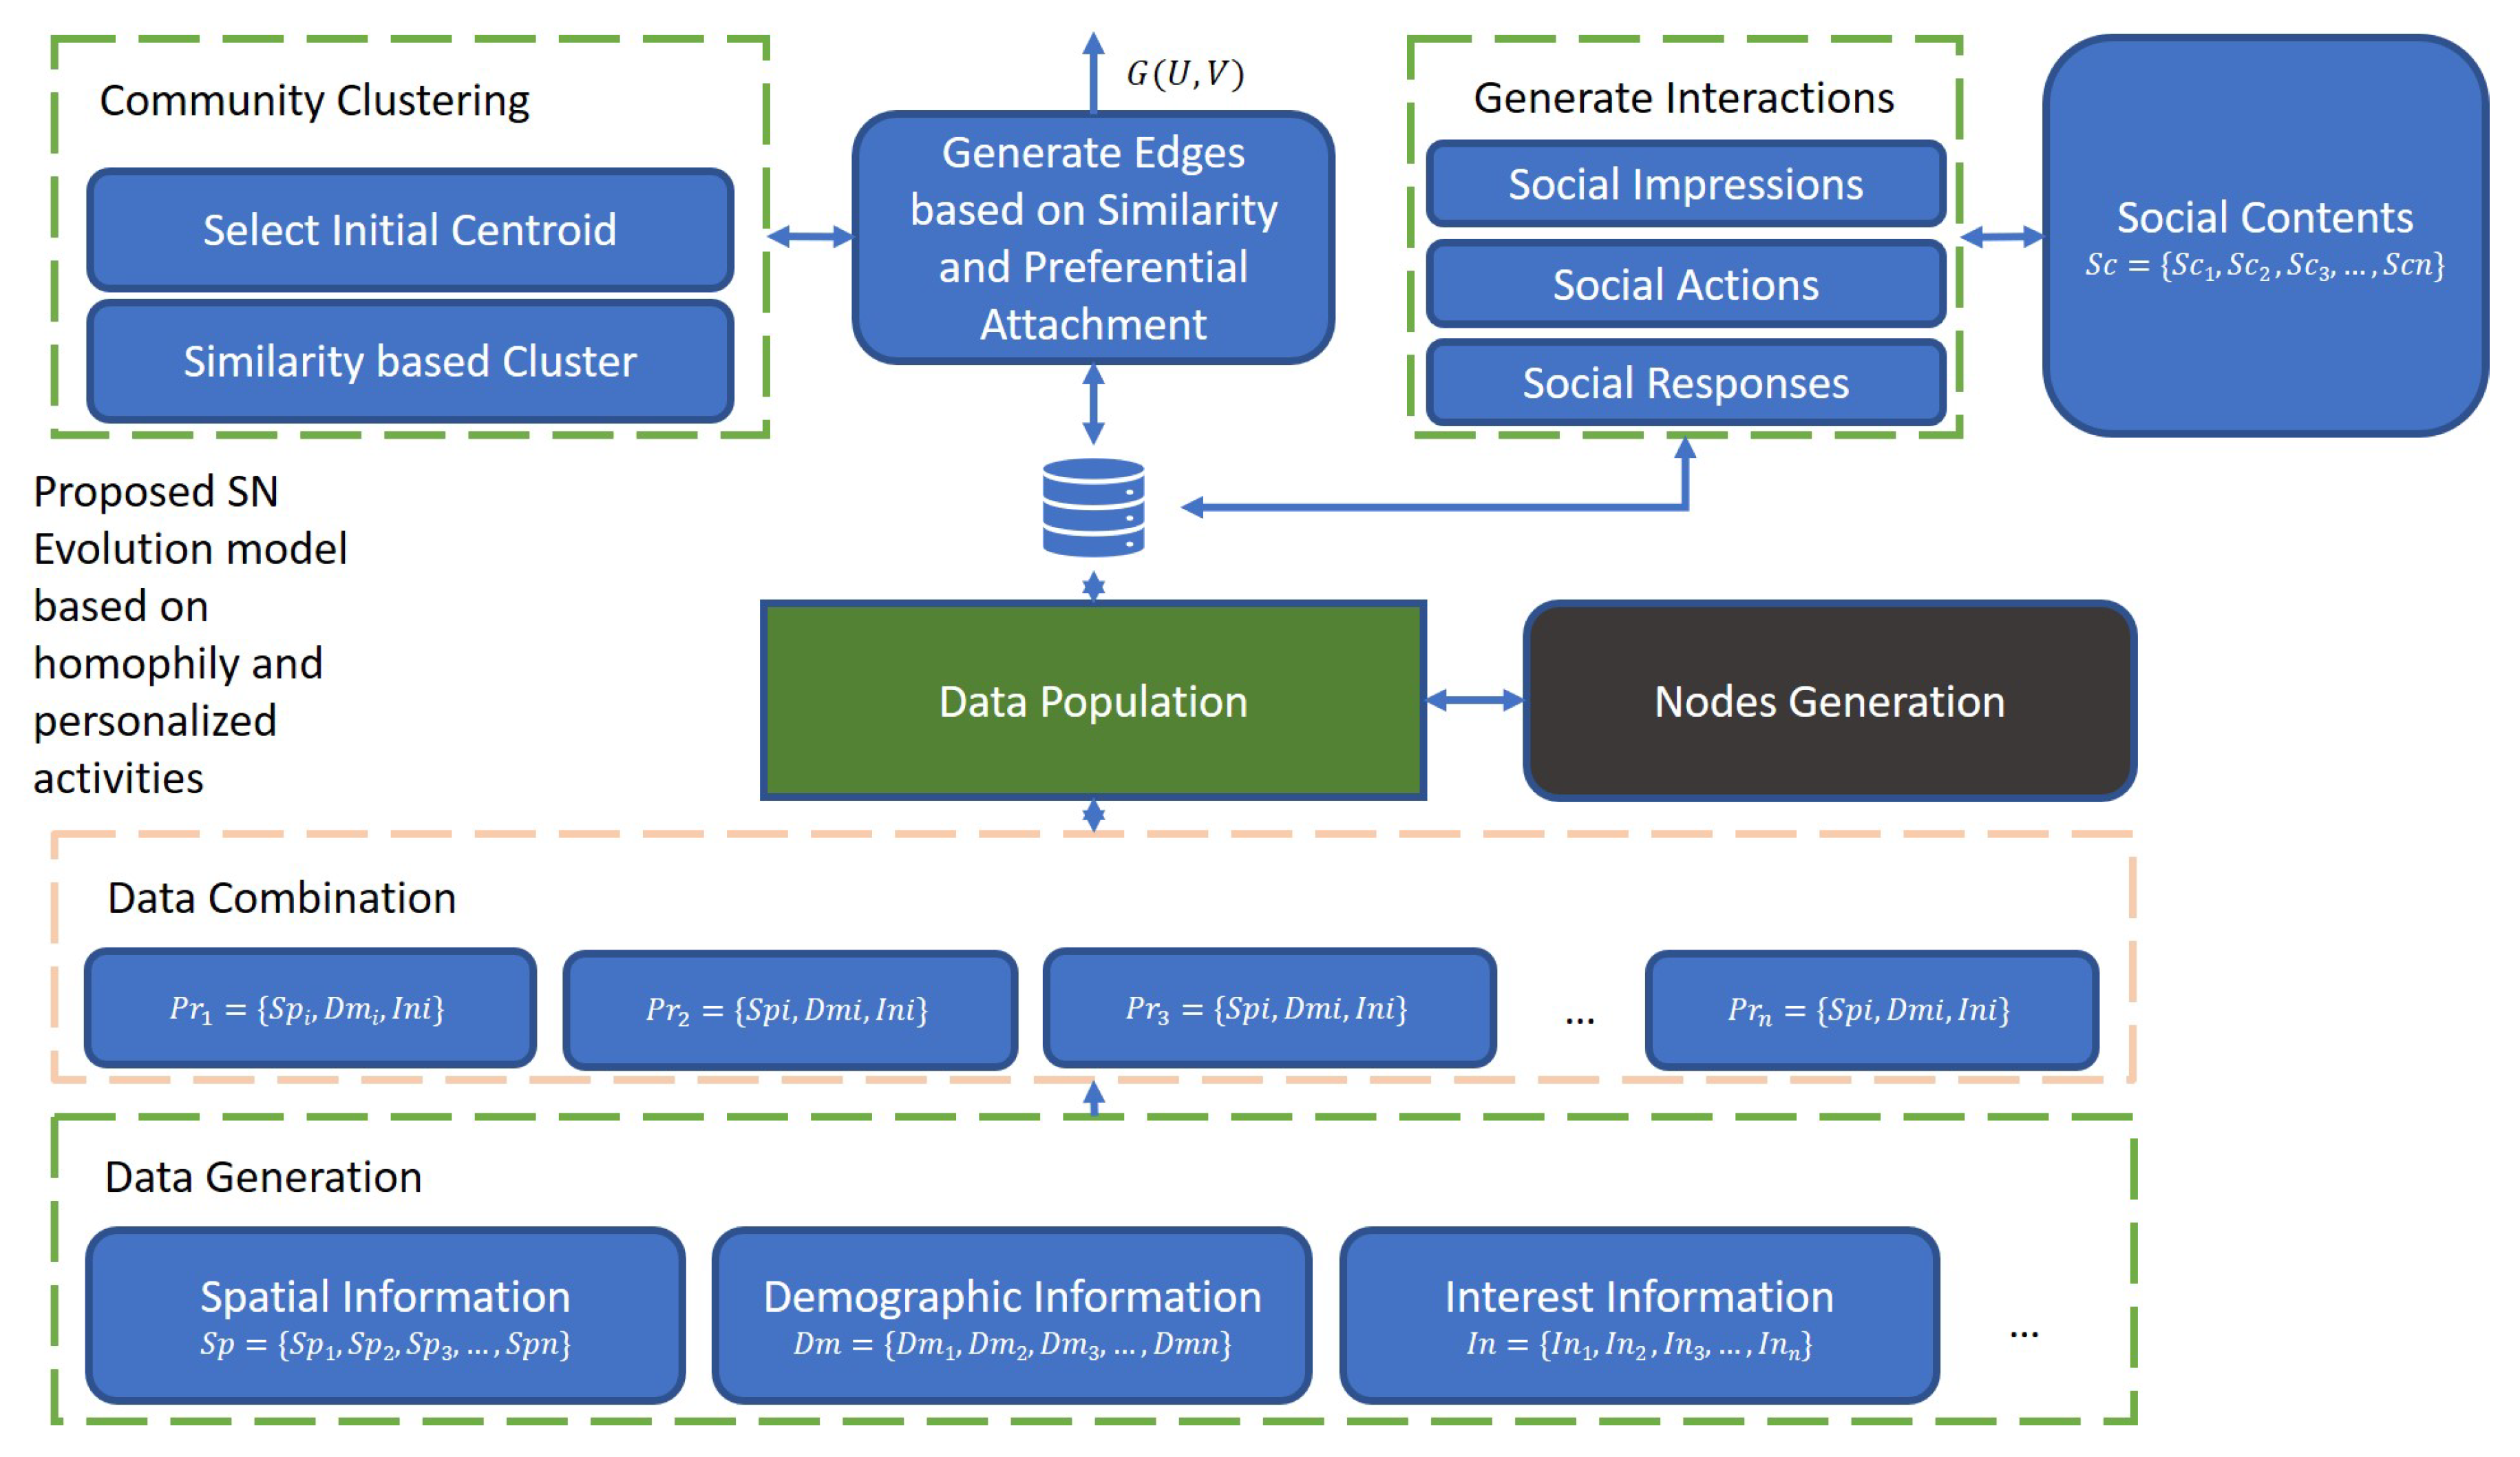
3. OSN Evalution Model Based on Homophily and Preferential Attachment
3.1. Challenges in Synthetic Network Generation
- Attributes distribution: What is the distribution of attribute values? In SN, the node attributes can have high diversity in values. Therefore, it is necessary to determine what the percentage of different values for each target attribute is. These percentages can be obtained from real-life SN datasets, and SN statistics, e.g., the attribute gender has two possible values—male and female, and their percentage on Facebook is and , respectively [74].
- Profile data distribution: What are the trends in the combination of user attributes to form different profiles? This is also an important factor that needs to be considered while generating synthetic SN data and graphs. In SNs, some node attributes can be used to predict the values of other attributes. These attributes are referred as inter-related attributes, e.g., if the age is in the range of , there is a high probability of having interest in news.
- Communities structure: What is the community structure? There are many bases to form communities in SN. These bases range from structural parameters to profile similarity. Selecting the basis for community formation is application dependent, such as with information spreading, where the connectivity can be the basis, while, for recommendation systems, the interest similarity is a better choice.
- Synthetic network topology: What is the topology? Many SN topologies are presented in the literature. SN topology can be obtained from real-life data sets. Previously, it was deduced from many studies that generally SNs have scale-free power-law degree distribution and have small world properties.
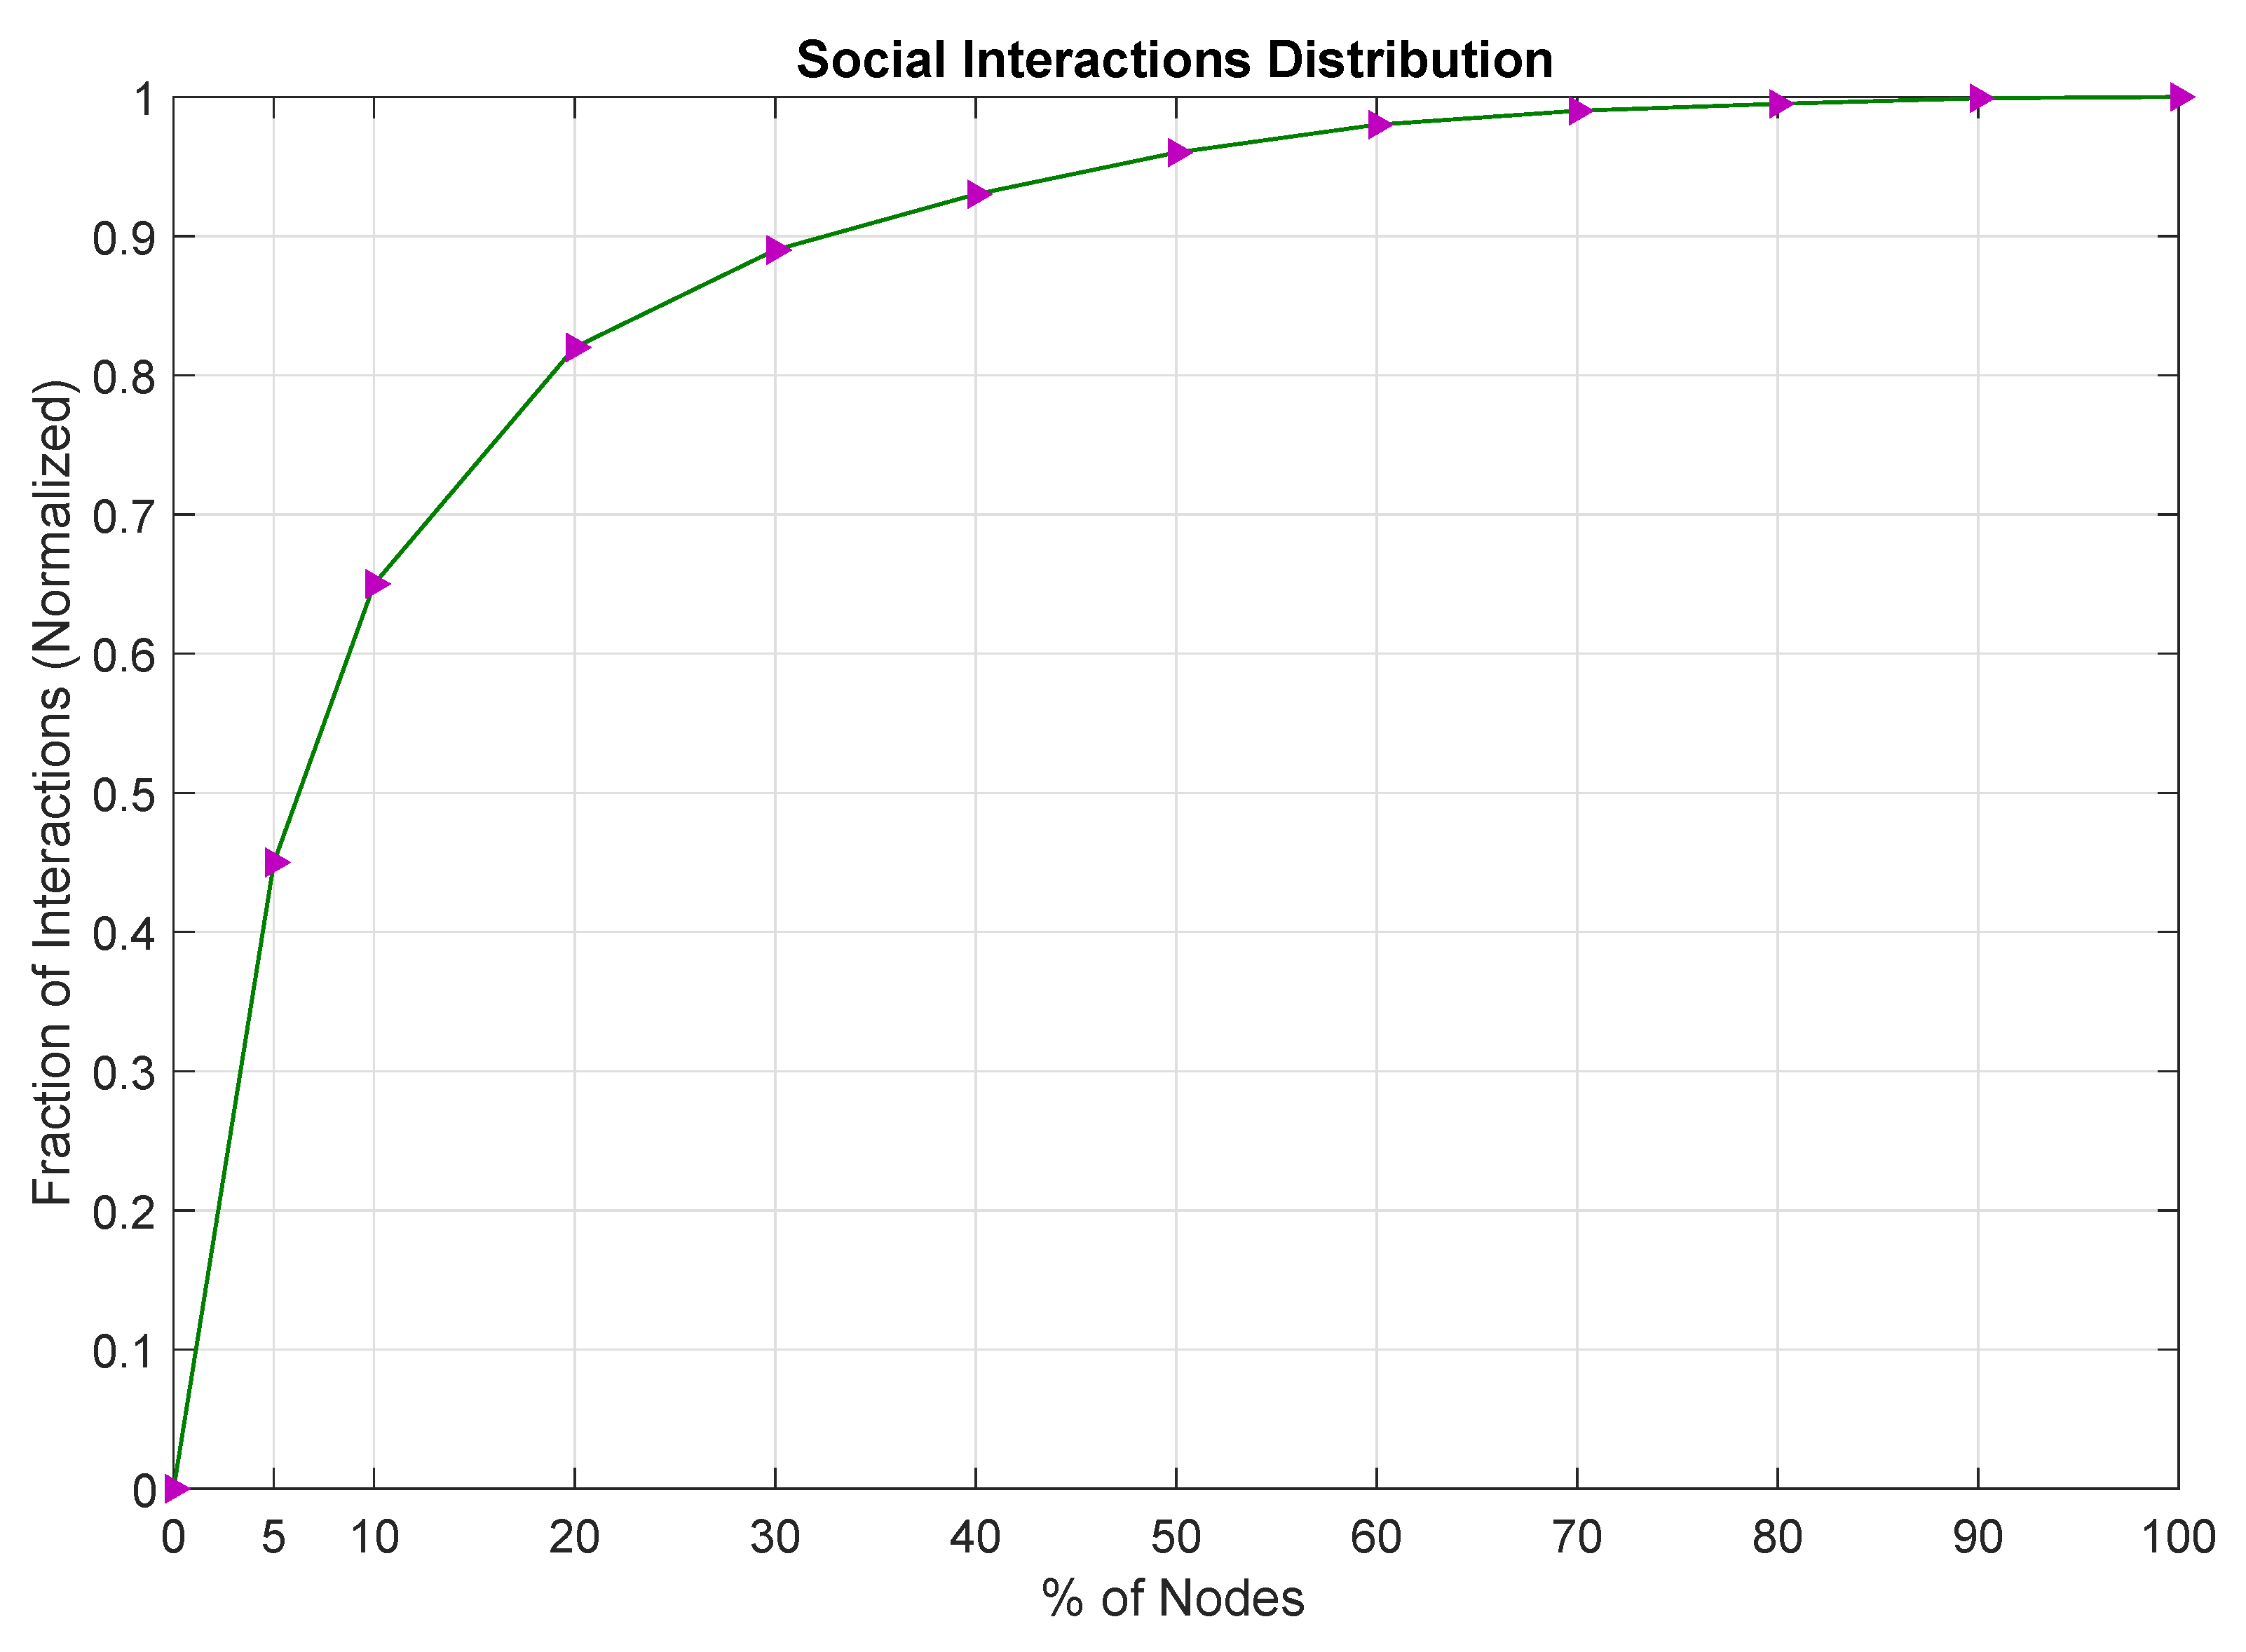
- Activities distribution: What are the activities distribution? From studies in SNA, it has been observed that the social activities obey the power-law distribution. In [9], it was concluded that, in SN, we do not need to follow all users in a group, and, out of all, only a proportion of users generate about of activities. These trends in activities’ generation can be extracted from SN datasets, previous research, and surveys.
- Correlation between attributes distribution: What is the correlation between these distributions? These distributions are associated with one another. These correlations can be deduced from SN datasets and surveys.
3.2. Preliminaries
3.3. Proposed SN Evaluation Model
4. Evaluation and Simulation Results
5. Conclusions
Author Contributions
Funding
Conflicts of Interest
References
- Rose, D.E.; Bornstein, J.J.; Tiene, K.; Ponceleón, D.B. System for Ranking the Relevance of Information Objects Accessed by Computer Users. U.S. Patent Application 10/388,362, 26 October 2010. [Google Scholar]
- Mui, L. Computational Models of Trust and Reputation: Agents, Evolutionary Games, and Social Networks. Ph.D. Thesis, Massachusetts Institute of Technology, Cambridge, MA, USA, 2002. [Google Scholar]
- Yu, H.; Kaminsky, M.; Gibbons, P.B.; Flaxman, A. Sybilguard: Defending against sybil attacks via social networks. ACM SIGCOMM Comput. Commun. Rev. 2006, 36, 267–278. [Google Scholar] [CrossRef]
- Girvan, M.; Newman, M.E. Community structure in social and biological networks. Proc. Natl. Acad. Sci. USA 2002, 99, 7821–7826. [Google Scholar] [CrossRef] [PubMed]
- Lancichinetti, A.; Fortunato, S. Community detection algorithms: A comparative analysis. Phys. Rev. E 2009, 80, 056117. [Google Scholar] [CrossRef] [PubMed]
- Ullah, F.; Lee, S. Community clustering based on trust modeling weighted by user interests in online social networks. Chaos Solitons Fractals 2017, 103, 194–204. [Google Scholar] [CrossRef]
- Ahmad, K.; Pogorelov, K.; Riegler, M.; Conci, N.; Halvorsen, P. Social media and satellites. Multimed. Tools Appl. 2018, 1–39. [Google Scholar] [CrossRef]
- Radicchi, F.; Castellano, C.; Cecconi, F.; Loreto, V.; Parisi, D. Defining and identifying communities in networks. Proc. Natl. Acad. Sci. USA 2004, 101, 2658–2663. [Google Scholar] [CrossRef] [PubMed]
- Wilson, C.; Sala, A.; Puttaswamy, K.P.; Zhao, B.Y. Beyond social graphs: User interactions in online social networks and their implications. ACM Trans. Web (TWEB) 2012, 6, 17. [Google Scholar] [CrossRef]
- Durr, M.; Protschky, V.; Linnhoff-Popien, C. Modeling social network interaction graphs. In Proceedings of the 2012 International Conference on Advances in Social Networks Analysis and Mining (ASONAM 2012), Istanbul, Turkey, 26–29 August 2012; IEEE Computer Society: Washington, DC, USA, 2012; pp. 660–667. [Google Scholar]
- Newman, M.E. Modularity and community structure in networks. Proc. Natl. Acad. Sci. USA 2006, 103, 8577–8582. [Google Scholar] [CrossRef] [PubMed]
- Kempe, D.; Kleinberg, J.; Tardos, É. Maximizing the spread of influence through a social network. In Proceedings of the Ninth ACM SIGKDD International Conference on Knowledge Discovery and Data Mining, Washington, DC, USA, 24–27 August 2006; ACM: New York, NY, USA, 2003; pp. 137–146. [Google Scholar]
- Guille, A.; Hacid, H.; Favre, C.; Zighed, D.A. Information diffusion in online social networks: A survey. ACM Sigmod Rec. 2013, 42, 17–28. [Google Scholar] [CrossRef]
- Ullah, F.; Lee, S. Social content recommendation based on spatial-temporal aware diffusion modeling in social networks. Symmetry 2016, 8, 89. [Google Scholar] [CrossRef]
- Al Qundus, J.; Paschke, A. Investigating the Effect of Attributes on User Trust in Social Media. In Proceedings of the International Conference on Database and Expert Systems Applications, Regensburg, Germany, 3–6 September 2018; Springer: Berlin, Germany, 2018; pp. 278–288. [Google Scholar]
- Bai, Y.; Deng, G.; Zhang, L.; Wang, Y. A Measuring Method for User Similarity based on Interest Topic. Int. J. Perform. Eng. 2018, 14, 691–698. [Google Scholar] [CrossRef]
- Sampson, S. A Novitiate in a Period of Change: An Experimental and Case Study of Social Relationships. Ph.D. Thesis, Cornell University, Ithaca, NY, USA, 1968. [Google Scholar]
- Burt, M.R. Cultural myths and supports for rape. J. Personal. Soc. Psychol. 1980, 38, 217. [Google Scholar] [CrossRef]
- Johnson, J.C. Social networks and innovation adoption: A look at Burt’s use of structural equivalence. Soc. Netw. 1986, 8, 343–364. [Google Scholar] [CrossRef]
- Johnsen, E.C. Structure and process: Agreement models for friendship formation. Soc. Netw. 1986, 8, 257–306. [Google Scholar] [CrossRef]
- Kumar, R.; Novak, J.; Raghavan, P.; Tomkins, A. Structure and evolution of blogspace. Commun. ACM 2004, 47, 35–39. [Google Scholar] [CrossRef]
- Liben-Nowell, D.; Novak, J.; Kumar, R.; Raghavan, P.; Tomkins, A. Geographic routing in social networks. Proc. Natl. Acad. Sci. USA 2005, 102, 11623–11628. [Google Scholar] [CrossRef] [PubMed]
- Dodds, P.S.; Muhamad, R.; Watts, D.J. An experimental study of search in global social networks. Science 2003, 301, 827–829. [Google Scholar] [CrossRef] [PubMed]
- Adamic, L.; Adar, E. How to search a social network. Soc. Netw. 2005, 27, 187–203. [Google Scholar] [CrossRef]
- Wasserman, S.; Faust, K. Social Network Analysis: Methods and Applications; Cambridge University Press: Cambridge, UK, 1994; Volume 8. [Google Scholar]
- Strogatz, S.H. Exploring complex networks. Nature 2001, 410, 268–276. [Google Scholar] [CrossRef] [PubMed]
- Albert, R.; Barabási, A.L. Statistical mechanics of complex networks. Rev. Mod. Phys. 2002, 74, 47. [Google Scholar] [CrossRef]
- Newman, M.E. The structure and function of complex networks. SIAM Rev. 2003, 45, 167–256. [Google Scholar] [CrossRef]
- Dorogovtsev, S.N.; Mendes, J.F. Evolution of networks. Adv. Phys. 2002, 51, 1079–1187. [Google Scholar] [CrossRef]
- Dorogovtsev, S.N.; Mendes, J.F. Evolution of Networks: From Biological Nets to the Internet and WWW; OUP Oxford: Oxford, UK, 2013. [Google Scholar]
- Kleinberg, J. Complex networks and decentralized search algorithms. In Proceedings of the International Congress of Mathematicians (ICM), Madrid, Spain, 22–30 August 2006; Volume 3, pp. 1019–1044. [Google Scholar]
- Kumar, R.; Novak, J.; Raghavan, P.; Tomkins, A. On the bursty evolution of blogspace. World Wide Web 2005, 8, 159–178. [Google Scholar] [CrossRef]
- Fetterly, D.; Manasse, M.; Najork, M.; Wiener, J.L. A large-scale study of the evolution of Web pages. Softw. Pract. Exp. 2004, 34, 213–237. [Google Scholar] [CrossRef]
- Ntoulas, A.; Cho, J.; Olston, C. What’s new on the web? The evolution of the web from a search engine perspective. In Proceedings of the 13th International Conference on World Wide Web, New York, NY, USA, 17–20 May 2004; ACM: New York, NY, USA, 2004; pp. 1–12. [Google Scholar]
- Newman, M.E.; Watts, D.J.; Strogatz, S.H. Random graph models of social networks. Proc. Natl. Acad. Sci. USA 2002, 99, 2566–2572. [Google Scholar] [CrossRef] [PubMed]
- Erdds, P.; Rényi, A. On random graphs I. Publ. Math. Debr. 1959, 6, 290–297. [Google Scholar]
- Bollobás, B.; Fulton, W.; Katok, A.; Kirwan, F.; Sarnak, P. Cambridge Studies in Advanced Mathematics; Random Graphs; Cambridge University Press: New York, NY, USA, 2001; Volume 73. [Google Scholar]
- Watts, D.J.; Strogatz, S.H. Collective dynamics of ‘small-world’networks. Nature 1998, 393, 440–442. [Google Scholar] [CrossRef] [PubMed]
- Barabási, A.L.; Albert, R. Emergence of scaling in random networks. Science 1999, 286, 509–512. [Google Scholar] [PubMed]
- Barabási, A.L. Scale-free networks: A decade and beyond. Science 2009, 325, 412–413. [Google Scholar] [CrossRef] [PubMed]
- Chakrabarti, D.; Zhan, Y.; Faloutsos, C. R-MAT: A recursive model for graph mining. In Proceedings of the 2004 SIAM International Conference on Data Mining, Lake Buena Vista, FL, USA, 22–24 April 2004; pp. 442–446. [Google Scholar]
- Lancichinetti, A.; Fortunato, S.; Radicchi, F. Benchmark graphs for testing community detection algorithms. Phys. Rev. E 2008, 78, 046110. [Google Scholar] [CrossRef] [PubMed]
- Kleinberg, J.M. Authoritative sources in a hyperlinked environment. J. ACM 1999, 46, 604–632. [Google Scholar] [CrossRef]
- Chung, F.; Lu, L. Connected components in random graphs with given expected degree sequences. Ann. Comb. 2002, 6, 125–145. [Google Scholar] [CrossRef]
- Chung, F.; Lu, L. The average distance in a random graph with given expected degrees. Internet Math. 2004, 1, 91–113. [Google Scholar] [CrossRef]
- Waxman, B.M. Routing of multipoint connections. IEEE J. Sel. Areas Commun. 1988, 6, 1617–1622. [Google Scholar] [CrossRef]
- Redner, S. How popular is your paper? An empirical study of the citation distribution. Eur. Phys. J. B-Condens. Matter Complex Syst. 1998, 4, 131–134. [Google Scholar] [CrossRef]
- Menczer, F. Evolution of document networks. Proc. Natl. Acad. Sci. USA 2004, 101, 5261–5265. [Google Scholar] [CrossRef] [PubMed]
- McPherson, M.; Smith-Lovin, L.; Cook, J.M. Birds of a feather: Homophily in social networks. Annu. Rev. Sociol. 2001, 27, 415–444. [Google Scholar] [CrossRef]
- Şimşek, Ö.; Jensen, D. Navigating networks by using homophily and degree. Proc. Natl. Acad. Sci. USA 2008. [Google Scholar] [CrossRef]
- Ugander, J.; Karrer, B.; Backstrom, L.; Marlow, C. The anatomy of the facebook social graph. arXiv, 2011; arXiv:1111.4503. [Google Scholar]
- Papadopoulos, F.; Kitsak, M.; Serrano, M.Á.; Boguná, M.; Krioukov, D. Popularity versus similarity in growing networks. Nature 2012, 489, 537–540. [Google Scholar] [CrossRef] [PubMed]
- Huber, G.A.; Malhotra, N. Political homophily in social relationships: Evidence from online dating behavior. J. Politics 2017, 79, 269–283. [Google Scholar] [CrossRef]
- Neyer, F.J.; Lang, F.R. Blood is thicker than water: Kinship orientation across adulthood. J. Personal. Soc. Psychol. 2003, 84, 310. [Google Scholar] [CrossRef]
- Doherty, N.A.; Feeney, J.A. The composition of attachment networks throughout the adult years. Pers. Relationsh. 2004, 11, 469–488. [Google Scholar] [CrossRef]
- Gerich, J.; Lehner, R. Collection of ego-centered network data with computer-assisted interviews. Methodology 2006, 2, 7–15. [Google Scholar] [CrossRef]
- Van Tilburg, T. Losing and gaining in old age: Changes in personal network size and social support in a four-year longitudinal study. J. Gerontol. Ser. B Psychol. Sci. Soc. Sci. 1998, 53, S313–S323. [Google Scholar] [CrossRef]
- Said, A.; De Luca, E.W.; Albayrak, S. How social relationships affect user similarities. In Proceedings of the 2010 International Conference on Intelligent User Interfaces Workshop on Social Recommender Systems, Hong Kong, China, 7–10 February 2010. [Google Scholar]
- Hanani, U.; Shapira, B.; Shoval, P. Information filtering: Overview of issues, research and systems. User Model. User-Adapt. Interact. 2001, 11, 203–259. [Google Scholar] [CrossRef]
- Bobadilla, J.; Ortega, F.; Hernando, A.; Gutiérrez, A. Recommender systems survey. Knowl.-Based Syst. 2013, 46, 109–132. [Google Scholar] [CrossRef]
- Xie, J.; Li, X. Make best use of social networks via more valuable friend recommendations. In Proceedings of the 2012 2nd International Conference on Consumer Electronics, Communications and Networks (CECNet), Yichang, China, 21–23 April 2012; IEEE: Piscataway, NJ, USA, 2012; pp. 1112–1115. [Google Scholar]
- Chin, A.; Xu, B.; Wang, H. Who should I add as a friend? A study of friend recommendations using proximity and homophily. In Proceedings of the 4th International Workshop on Modeling Social Media, Prague, Czech Republic, 23 September 2013; ACM: New York, NY, USA, 2013; p. 7. [Google Scholar]
- Pouli, V.; Kafetzoglou, S.; Tsiropoulou, E.E.; Dimitriou, A.; Papavassiliou, S. Personalized multimedia content retrieval through relevance feedback techniques for enhanced user experience. In Proceedings of the 2015 13th International Conference on Telecommunications (ConTEL), Graz, Austria, 13–15 July 2015; IEEE: Piscataway, NJ, USA, 2015; pp. 1–8. [Google Scholar]
- Stai, E.; Kafetzoglou, S.; Tsiropoulou, E.E.; Papavassiliou, S. A holistic approach for personalization, relevance feedback & recommendation in enriched multimedia content. Multimed. Tools Appl. 2018, 77, 283–326. [Google Scholar]
- Gauch, S.; Speretta, M.; Chandramouli, A.; Micarelli, A. User profiles for personalized information access. In The Adaptive Web; Springer: Berlin, Germany, 2007; pp. 54–89. [Google Scholar]
- Ajrouch, K.J.; Blandon, A.Y.; Antonucci, T.C. Social networks among men and women: The effects of age and socioeconomic status. J. Gerontol. Ser. B Psychol. Sci. Soc. Sci. 2005, 60, S311–S317. [Google Scholar] [CrossRef]
- Quinn, D.; Chen, L.; Mulvenna, M. Does age make a difference in the behaviour of online social network users? In Proceedings of the Internet of Things (iThings/CPSCom), 2011 International Conference on and 4th International Conference on Cyber, Physical and Social Computing, Dalian, China, 19–22 October 2011; IEEE: Piscataway, NJ, USA, 2011; pp. 266–272. [Google Scholar]
- Cornwell, B.; Laumann, E.O.; Schumm, L.P. The social connectedness of older adults: A national profile. Am. Sociol. Rev. 2008, 73, 185–203. [Google Scholar] [CrossRef] [PubMed]
- Cornwell, B. Age trends in daily social contact patterns. Res. Aging 2011, 33, 598–631. [Google Scholar] [CrossRef]
- Marcum, C.S. Age differences in daily social activities. Res. Aging 2013, 35, 612–640. [Google Scholar] [CrossRef] [PubMed]
- Pérez-Rosés, H.; Sebé, F. Synthetic generation of social network data with endorsements. J. Simul. 2015, 9, 279–286. [Google Scholar] [CrossRef]
- Nettleton, D.F. A synthetic data generator for online social network graphs. Soc. Netw. Anal. Min. 2016, 6, 44. [Google Scholar] [CrossRef]
- Sagduyu, Y.E.; Grushin, A.; Shi, Y. Synthetic Social Media Data Generation. IEEE Trans. Comput. Soc. Syst. 2018, 5, 605–620. [Google Scholar] [CrossRef]
- Facebook Analytics. Available online: https://www.facebook.com/analytics/1701892993437661/?-section=people_demographics/ (accessed on 31 July 2018).
- Fan Page List. 2015. Available online: http://www.fanpagelist.com/category/top_users/ (accessed on 6 August 2018).
- Koren, Y.; Bell, R.; Volinsky, C. Matrix factorization techniques for recommender systems. Computer 2009, 42, 30–37. [Google Scholar] [CrossRef]
- Han, X.; Wang, L.; Park, S.; Cuevas, A.; Crespi, N. Alike people, alike interests? A large-scale study on interest similarity in social networks. In Proceedings of the 2014 IEEE/ACM International Conference on Advances in Social Networks Analysis and Mining, Beijing, China, 17–20 August 2014; IEEE Press: Piscataway, NJ, USA, 2014; pp. 491–496. [Google Scholar]
- Dillon, M. Introduction to modern information retrieval: G. Salton and M. McGill; McGraw-Hill: New York, NY, USA, 1983; pp. 491–496. ISBN 0-07-054484-0. [Google Scholar]
- Sinnott, R.W. Virtues of the Haversine. Sky Telesc. 1984, 68, 159. [Google Scholar]
- Palmer, M.C. Calculation of distance traveled by fishing vessels using GPS positional data: A theoretical evaluation of the sources of error. Fish. Res. 2008, 89, 57–64. [Google Scholar] [CrossRef]
- Jaccard, P. Distribution de la flore alpine dans le bassin des Dranses et dans quelques régions voisines. Bull. Soc. Vaud. Sci. Nat. 1901, 37, 241–272. [Google Scholar]
- Huberman, B.A.; Romero, D.M.; Wu, F. Social networks that matter: Twitter under the microscope. arXiv, 2008; arXiv:0812.1045. [Google Scholar]
- Leskovec, J.; Krevl, A. {SNAP Datasets}:{Stanford} Large Network Dataset Collection; Stanford University: Stanford, CA, USA, USA, 2014; Available online: http://snap.stanford.edu/data (accessed on 19 November 2018).
- Zafarani, R.; Liu, H. Social Computing Data Repository at ASU [“http://socialcomputing. asu. edu/”]. Tempe, AZ: Arizona State University, School of Computing. Inform. Decis. Syst. Eng. 2009.
- Yang, J.; Leskovec, J. Defining and evaluating network communities based on ground-truth. Knowl. Inf. Syst. 2015, 42, 181–213. [Google Scholar] [CrossRef]
- Leskovec, J.; Mcauley, J.J. Learning to discover social circles in ego networks. In Advances in Neural Information Processing Systems; Neural Information Processing Systems (NIPS) Foundation, Inc.: La Jolla, CA, USA, 2012; pp. 539–547. [Google Scholar]
- Zachary, W.W. An information flow model for conflict and fission in small groups. J. Anthropol. Res. 1977, 33, 452–473. [Google Scholar] [CrossRef]
- Knuth, D.E. The Stanford GraphBase: A Platform for Combinatorial Computing; ACM Press: New York, NY, USA, 1993. [Google Scholar]
- Klimt, B.; Yang, Y. Introducing the Enron Corpus. In Proceedings of the 2004 CEAS, Mountain View, CA, USA, 30–31 July 2004. [Google Scholar]
- Leskovec, J.; Lang, K.J.; Dasgupta, A.; Mahoney, M.W. Community structure in large networks: Natural cluster sizes and the absence of large well-defined clusters. Internet Math. 2009, 6, 29–123. [Google Scholar] [CrossRef]
- Panzarasa, P.; Opsahl, T.; Carley, K.M. Patterns and dynamics of users’ behavior and interaction: Network analysis of an online community. J. Am. Soc. Inf. Sci. Technol. 2009, 60, 911–932. [Google Scholar] [CrossRef]
- Stehlé, J.; Voirin, N.; Barrat, A.; Cattuto, C.; Isella, L.; Pinton, J.F.; Quaggiotto, M.; Van den Broeck, W.; Régis, C.; Lina, B.; et al. High-resolution measurements of face-to-face contact patterns in a primary school. PLoS ONE 2011, 6, e23176. [Google Scholar] [CrossRef] [PubMed]


| Notations | Description |
|---|---|
| Graph with users/nodes V and edges E | |
| Set of Spatial information | |
| Spatial information of user i | |
| Set of demograpic information | |
| Demograpic information of user i | |
| Set of Interest information | |
| Interest information of user i | |
| ith profile | |
| Set of social contents | |
| Social interaction from user i to j | |
| Social contents to user i from j | |
| Probability of attachment based on degree (preferential attachment) | |
| kth community in the network | |
| Degree of node j |
| Attribute | Values |
|---|---|
| Age | “18–24” (15%), “25–34” (24%), “35–44” (19%), “45–54“ (16%), “55–64” (13%), “65+” (11%) [74] |
| Gender | male (46%), female (54%) [74] |
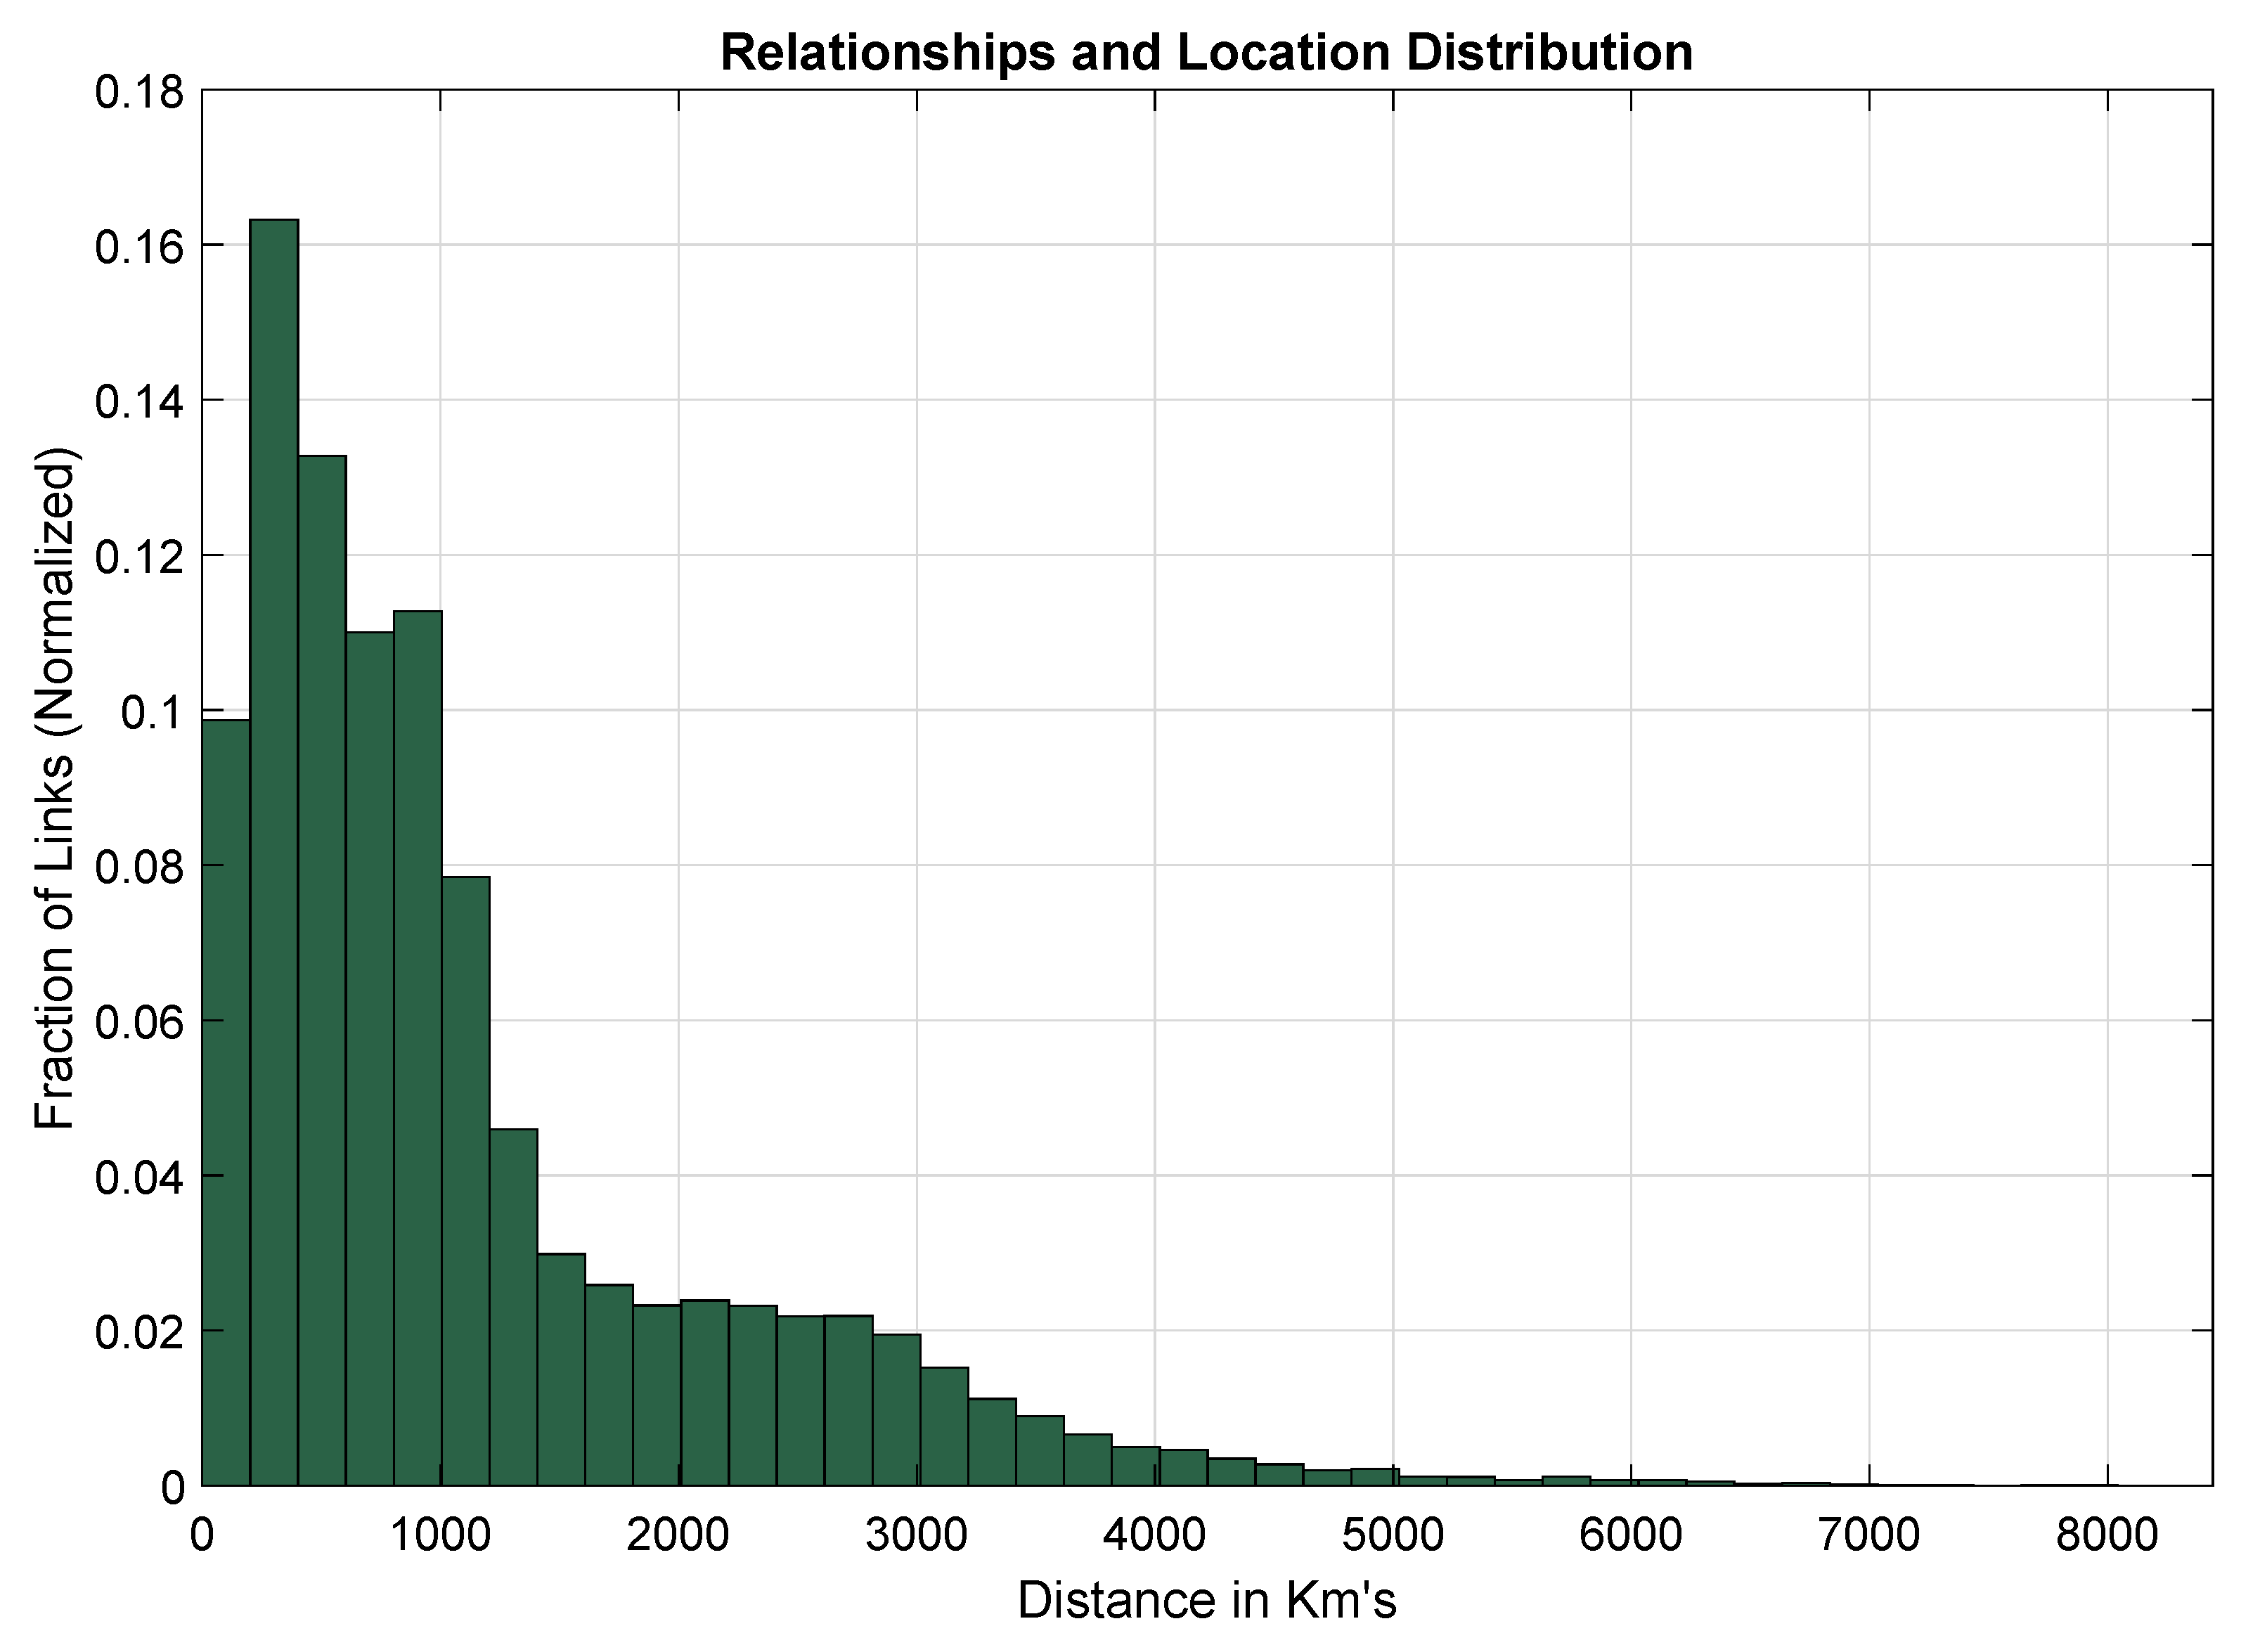
| Location | Random latitudes and longnitudes generated in North-American region; shown in Figure 3 |
| Religion | “Christian” (31.9%), “Hindu” (14.8%), “Jewish” (0.2%), “Muslim” (27.1%), “Sikh” (0.3%), “Traditional Spirituality” (0.1%), “Other Religions” (12.9%), “No religious affiliation” (12.7%) [72] |
| Language | “English” (64%), “Spanish” (17%), “Portuguese” (15%), “French” (11%), “German” (9.9%), “Indonesian” (7.7%), “Japanese” (6.6%), “Vietnamese” (6.5%), “Arabic” (6.4%), “Hindi” (6.2%) [74] |
| Marital status | “Single” (31.5%), “Married” (51.4%), “Divorced” (10.5%), “Widowed” (6.6%) [72] |
| Profession | “Manager” (12.2%), “Professional” (17.1%), “Service” (13.9%), “Sales and office” (17.8%), |
| (ISCO-08 structure) | “Student” (23%), “Natural resources construction and maintenance” (7.0%), “Production transportation and material moving” (9.0%) [72] |
| Political orientation | “Far Left” (9.4%), “Left” (34.7%),“Center Left” (18.1%), “Center” (18.0%), “Center Right” (10.5%), “Right” (8.0%), “Far Right” (1.3%) [72] |
| Interests | Brands, Celebrities, Sports Teams, Movies, Tv Show, Games, News, Organizations [75] |
| Network | # Nodes | # Edges | Average Degree | Average Path Length | Average Clustering Coefficient | Modularity | Graph Density | Graph Diameter | User Attributes | User-Items Ratings | User Interactions | |
|---|---|---|---|---|---|---|---|---|---|---|---|---|
| Datasets | Livejournal [85] | 3,997,962 | 34,681,189 | 8.67 | 6.5 | 0.28 | 0.15 | 0... | 17 | No | No | No |
| Facebook [86] | 4,039 | 88,234 | 43.69 | 3.69 | 0.617 | 0.83 | 0.011 | 8 | Yes | No | No | |
| Twitter [84] | 472,753 | 1,048,575 | 2.21 | 5.991 | 0.012 | 0.606 | 0... | 16 | No | No | No | |
| Friendster [85] | 65,608,366 | 1,806,067,135 | 27.52 | 5.8 | 0.16 | 0.24 | 0... | 32 | No | No | No | |
| Amazone [85] | 334,863 | 925,872 | 2.73 | 15 | 0.39 | 0.06 | 0... | 44 | No | No | No | |
| Douban [84] | 154,908 | 327,162 | 4.22 | 57.81 | 0.048 | 0.57 | 0... | 9 | No | No | No | |
| Digg [84] | 256,092 | 1,019,033 | 7.96 | 138.47 | 0.138 | 0.574 | 0... | 22 | No | No | No | |
| Karate club [87] | 34 | 78 | 2.29 | 2.40 | 0.58 | 0.415 | 0.139 | 5 | No | No | No | |
| Lesmeserible [88] | 77 | 254 | 6.59 | 2.64 | 0.74 | 0.57 | 0.087 | 5 | No | No | No | |
| Netsciences [11] | 1,589 | 2,742 | 3.45 | 5.82 | 0.878 | 0.955 | 0.002 | 17 | No | No | Yes | |
| Enron Email [89,90] | 36,692 | 183,831 | 5.01 | 3.99 | 0.49 | 0.34 | 0... | 11 | No | No | Yes | |
| CollegeMsg [91] | 1,899 | 20,296 | 21.37 | 3.05 | 0.138 | 0.356 | 0.011 | 8 | No | No | Yes | |
| Contact Network [92] | 236 | 5,899 | 49.99 | 1.86 | 0.50 | 0.37 | 0.21 | 3 | No | No | No | |
| Previous Models | Random Graph [35] | 1,000 | 47,791 | 47.79 | 1.90 | 0.10 | 0.08 | 0.096 | 3 | No | No | No |
| ER Model [36] | 1,000 | 49,903 | 49.90 | 1.9 | 0.10 | 0.083 | 0.010 | 3 | No | No | No | |
| SW Model [38] | 1,000 | 74,999 | 74.99 | 1.85 | 0.15 | 0.063 | 0.015 | 2 | No | No | No | |
| RMAT [41] | 1,000 | 50,397 | 50.397 | 2.16 | 0.119 | 0.175 | 0.051 | 4 | No | No | No | |
| BA Model [40] | 1,000 | 45,875 | 45.87 | 1.92 | 0.127 | 0.132 | 0.092 | 3 | No | No | No | |
| Propsed Model | PM1000 | 1,000 | 46,780 | 46.78 | 2.49 | 0.49 | 0.53 | 0.094 | 6 | Yes | Yes | Yes |
| PM2000 | 2,000 | 98,725 | 49.36 | 2.32 | 0.51 | 0.55 | 0.098 | 6 | Yes | Yes | Yes | |
| PM5000 | 5,000 | 249,950 | 49.99 | 2.29 | 0.53 | 0.56 | 0.099 | 5 | Yes | Yes | Yes | |
| PM10000 | 10,000 | 485,539 | 48.55 | 2.39 | 0.50 | 0.53 | 0.096 | 6 | Yes | Yes | Yes |
| Average Degree | Min. Degree | # Edges |
|---|---|---|
| 100 | No Limit | 49,919 |
| 10 | 46,780 | |
| 20 | 49,590 | |
| 50 | 55,870 | |
| 150 | No Limit | 83,810 |
| 10 | 64,238 | |
| 20 | 69,569 | |
| 50 | 71,330 | |
| 200 | No Limit | 89,711 |
| 10 | 61,958 | |
| 20 | 63,290 | |
| 50 | 83,891 | |
| No Limit | No Limit | 101,158 |
| 10 | 49,191 | |
| 20 | 64,429 | |
| 50 | 83,442 |
| # Nodes | K | Time in sec. | |
|---|---|---|---|
| Pre-Computed Similarity Matrix Provided to the Model | 1000 | 10 | 2.45 |
| 100 | 2.07 | ||
| 2000 | 10 | 22.48 | |
| 100 | 18.97 | ||
| 5000 | 10 | 297.56 | |
| 100 | 292.34 | ||
| 10,000 | 10 | 2693.58 | |
| 100 | 2335.60 | ||
| With Similarity Computation | 1000 | 10 | 103.96 |
| 100 | 98.24 | ||
| 2000 | 10 | 1589.87 | |
| 100 | 1509.53 | ||
| 5000 | 10 | 18,190.87 | |
| 100 | 18,011.72 | ||
| 10,000 | 10 | 234,481.23 | |
| 100 | 234,392.65 |
© 2018 by the authors. Licensee MDPI, Basel, Switzerland. This article is an open access article distributed under the terms and conditions of the Creative Commons Attribution (CC BY) license (http://creativecommons.org/licenses/by/4.0/).
Share and Cite
Khan, J.; Lee, S. Online Social Networks (OSN) Evolution Model Based on Homophily and Preferential Attachment. Symmetry 2018, 10, 654. https://doi.org/10.3390/sym10110654
Khan J, Lee S. Online Social Networks (OSN) Evolution Model Based on Homophily and Preferential Attachment. Symmetry. 2018; 10(11):654. https://doi.org/10.3390/sym10110654
Chicago/Turabian StyleKhan, Jebran, and Sungchang Lee. 2018. "Online Social Networks (OSN) Evolution Model Based on Homophily and Preferential Attachment" Symmetry 10, no. 11: 654. https://doi.org/10.3390/sym10110654
APA StyleKhan, J., & Lee, S. (2018). Online Social Networks (OSN) Evolution Model Based on Homophily and Preferential Attachment. Symmetry, 10(11), 654. https://doi.org/10.3390/sym10110654