1. Introduction
One of the most important problems faced every day by both companies and individuals is the protection of sensitive data stored in computer systems. These data can be very valuable assets for thieves, who use them in widely understood cybercrime. Cyberattacks can be carried out remotely, i.e., from outside of the premises of the company being attacked; however, a large percentage of intrusions is initiated when the criminal stays inside the company [
1]. This type of attack occurs, for example, when users go away from their computers, forgetting to log out, and thus allow the intruder to access the computer. The aforementioned threat causes the necessity to develop methods that allow detecting and effectively neutralize the attacks [
2,
3].
The threats described cause a need to develop methods that enable quick detection of an attack, thanks to which it will be possible to neutralize it effectively. In most of the security systems known so far, user verification is carried out once the user starts work. The use of one-time login causes the detection of an attack, in which the intruder takes over the access to the computer, is practically impossible. An effective solution to this problem can be the use of continuous verification. Such verification is carried out repeatedly at certain short time intervals or when there is a suspicion that an unauthorized person is at the computer. The verification systems known so far are based mainly on the use of passwords, PIN codes or ID cards. Unfortunately, such solutions do not always guarantee the compliance with relevant safety standards. This is mainly due to the imperfections of human nature—passwords or cards can be lost, forgotten or stolen. In addition, there is a nuisance consisting in the necessity to enter the password many times, which causes such solutions to not be popular in continuous verification systems.
Biometrics is a tool, the usefulness of which for detection of intruders trying to gain unauthorized access to computer systems has been demonstrated recently [
4,
5]. Biometric verification/identification methods are based on the analysis of popular physical features (e.g., iris, retina, friction ridges, fingerprints, blood vessel pattern, ear shape, etc.) [
6,
7,
8,
9,
10].
The usefulness of a feature in a biometric system depends on the fact, which of the following assumptions are fulfilled by it [
11]:
versatility—each person should have a given feature;
uniqueness—no two persons should have the same feature;
durability—invariability of the feature in time;
measurability—a possibility of measuring with the use of a practical device;
storability—features can be registered and stored;
acceptability and convenience of use along with the adequacy of the size of the device.
Continuous verification requires frequent acquisition of biometric data. That is why it is so important that the biometric feature to be used, in addition to its uniqueness and versatility, should also be convenient in acquisition and acceptable. Otherwise, the use of a given biometric feature will be just as troublesome as the use of a password or an ID card. Unfortunately, in the case of the vast majority of physical features, the convenience of their acquisition is not satisfactory. For example, when acquiring fingerprints, the user must stop working and put his/her finger against the scanner. A similar rule applies when acquiring a vein or retina image. In addition, the acquisition of retina images is characterized by a low level of acceptability. Despite the lack of physical contact with the scanner, some users are worried about their health when scanning the eye. Another example of a physical feature, which is not very convenient in acquisition and thus, in use, is the image of the knuckle. The use of this feature consists of allowing the analysis of skin furrows visible on the surface of a knuckle. Examples of methods used for analysing a knuckle can be found in [
12,
13,
14,
15]. Unfortunately, also in the case of this feature, the acquisition requires putting a hand in a special scanner. This work was aimed at developing such a method of acquiring a physical feature that would be convenient and, very importantly, non-absorbing for the user. Such a method has not been developed so far. The result of the work is a new method of automatic acquisition of knuckle images. In the new approach, the camera continuously observes the user’s hands during the use of the keyboard. If there is a need to acquire an image, a method developed especially for this purpose locates the index finger in the image and a photo of its knuckle is taken. Then, another method evaluates the quality of the photo taken. Blurred images are not used in further stages of the verification. Such an approach, in which the image of a knuckle can be registered during the normal course of user’s work, does not require the user to interrupt the work and put their hand in the scanner. All these factors increase the possibilities of the practical use of images of the knuckle in biometric systems very significantly. The effectiveness of the new method of acquisition was determined experimentally. The usefulness of the proposed method was examined by determining the speed of its operation. The research also included its implementation as an element of two biometric methods. The first one is a method of verification based on the image of a knuckle, while the second one is a multi-biometric method, combining the analysis of the knuckle with the analysis of the dynamics of typing on the keyboard. The outcomes of the experiments, the results of which are presented in the research part, showed a high level of usability of the proposed method of acquisition.
To sum up, the scientific contribution of this work includes:
developing a method of automatic acquisition of knuckle images that enables continuous verification of the user without the necessity to interrupt the user’s work,
developing a method of evaluating the quality of the image obtained as a result of the acquisition,
demonstrating the high effectiveness and speed of operation of the method,
proposing the implementation of the method as an element of a biometric or multi-biometric system,
2. A Method of Automatic Acquisition of Finger Knuckle Images
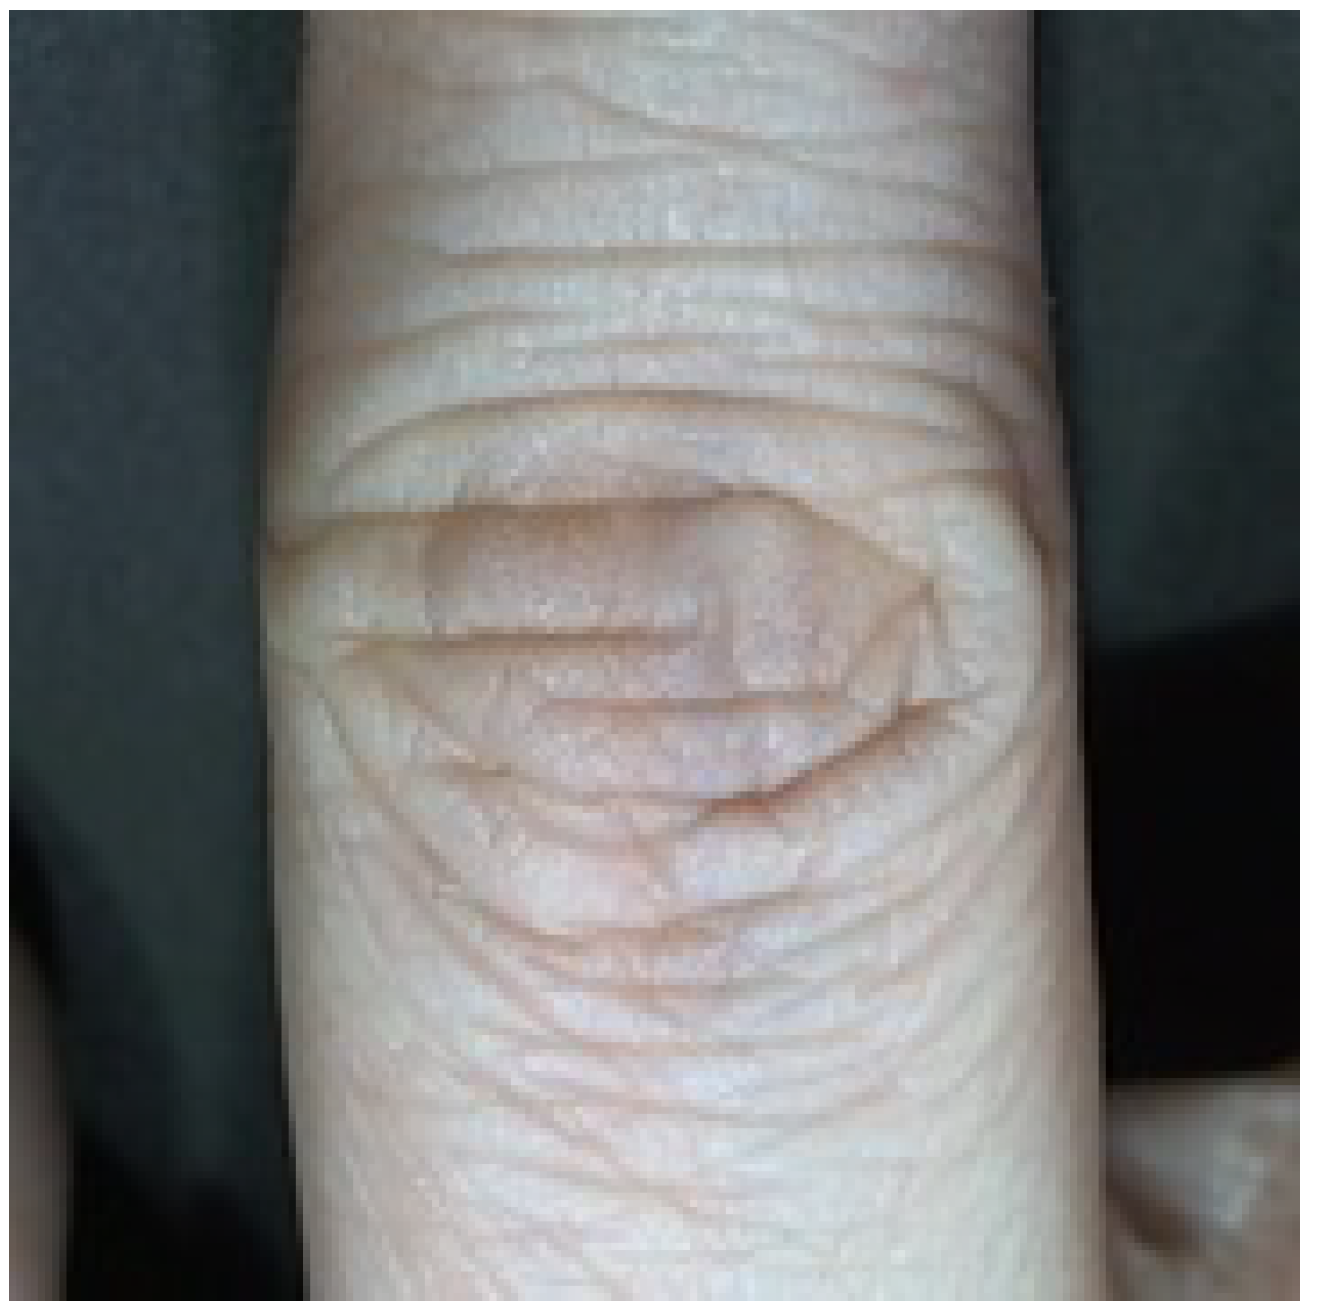
Person verification based on the knuckle image consists of the analysis of the skin furrows located on the knuckle between the middle phalanx and the proximal phalanx. The analysis includes the comparison of the shapes and locations of individual furrows in the reference and verified images. The sample photo of finger knuckle is shown in
Figure 1.
In order to carry out the analysis of furrows, the knuckle image has to be acquired. A significant disadvantage of the currently known acquisition methods is that the users have to put their hand inside a special rig where the image recording device is located. An example of such a rig is presented in
Figure 2.
Such method of acquisition requires interruption of a user’s work for the time of acquisition. The average time a user needs to complete the entire acquisition process is about eight seconds. It should be noted that the acquisition procedure is repeated each time when there is a suspicion that an unauthorized person is working on the computer. In order to eliminate this inconvenience, in this study, a method was proposed in which the acquisition is performed automatically, i.e., without interrupting the user’s work. A new approach assumes that the acquisition will be performed with the use of a camera located in such a way that the user’s hands can be observed all the time when the user is using the keyboard. The device takes a photo of the hand. Image processing methods are used to locate the right hand in the image and then the index finger on the hand itself. The specific character of the method proposed assumes that the photos are taken when the hands are moving, which may result in their blurring. For this reason, the method assesses the quality of the image. A detailed description of the stages of the method is presented in the following subsections.
2.1. Taking a Photo of the Hand
The aim of the first stage of the method is to take a photo of the hand of the user. The photo is taken using a camera or a video camera installed in the central part of the keyboard. In this study, a small tripod was used for this purpose. Such a rig can be used to register images of keyboards both of desktop computers and laptops. The method requires that the camera is always located at the same distance from the computer keyboard. As a result, the hands visible in the photo always have a similar size, thanks to which the image does not have to be scaled. The rig used in the studies is shown in
Figure 3. Number (1) indicates the laptop, while (2) indicates the video camera on the tripod.
Initially, a reference photo without a user’s hands on the keyboard should be taken. Only after taking the reference photo, the camera takes a photo of the hand typing on the keyboard. Both the reference keyboard photo and the photo of the hand are saved in grayscale and designated respectively as and , , , where M is the width and height of the images.
2.2. Exposing the Hand on the Keyboard
In the next step, the contour of the user’s hand in the image
I should be exposed. This task is carried out using the
foreground detection technique [
16,
17]. It is a very simple and fast operation, while its outcome is sufficient to ensure a correct course of further stages of the method. It is possible to subtract images thanks to taking a reference image
of the keyboard itself. The image
resulting from the subtraction of images is obtained using the operation (
1):
In order to reduce the influence of external factors (e.g., lighting) on the operation, the image
is subjected to binarization, where the binarization threshold is selected using the Otsu method [
18]. The result of the operations of image subtraction and binarization is shown in
Figure 4.
2.3. Location of Patterns in the Image
After exposing the contour of the hand, the right-hand index finger in the image is searched using the Template Matching
technique [
19,
20,
21]. This technique is used to indicate the part of the image matching the pattern searched for. The input for the Template Matching technique is the image
with the size of
and the pattern
T with the size of
, where
. Furthermore, the operation of searching for the pattern
T in the image
using the Template Matching technique will be designated as
. The result of the operation of the Template Matching technique is the
matrix
. Elements of the matrix
will be designated as
and can be determined based on different metrics of the function of matching of the images being compared [
22]. Below, the definitions of some measures that were used during the experiments are given, the results of which are described in the section “Experimental verification”. The following methods have been selected because of the ease of their implementation and a high effectiveness:
- -
- -
Square Difference Normed(
SDN)
- -
- -
Determining the coordinates (row and column) of the maximum value in the matrix
allows for determining the location of the pattern
T searched for in the image
.
Figure 5 shows the image
, pattern
T and the matrix
created on their base. In the image
, the location of the pattern
T, determined with the use of
method, was marked with a square.
The operation of locating the user’s finger in the image is performed in two stages. The aim of the first stage is to limit the area of searching for a finger to the part of the image with the right hand of the user. Only in the second stage, in the limited fragment of a image, the index finger is searched. The two-stage localization of a finger gives better effectiveness compared to the methods, where a finger pattern was determined directly in the entire image. It has been shown in the experimental section.
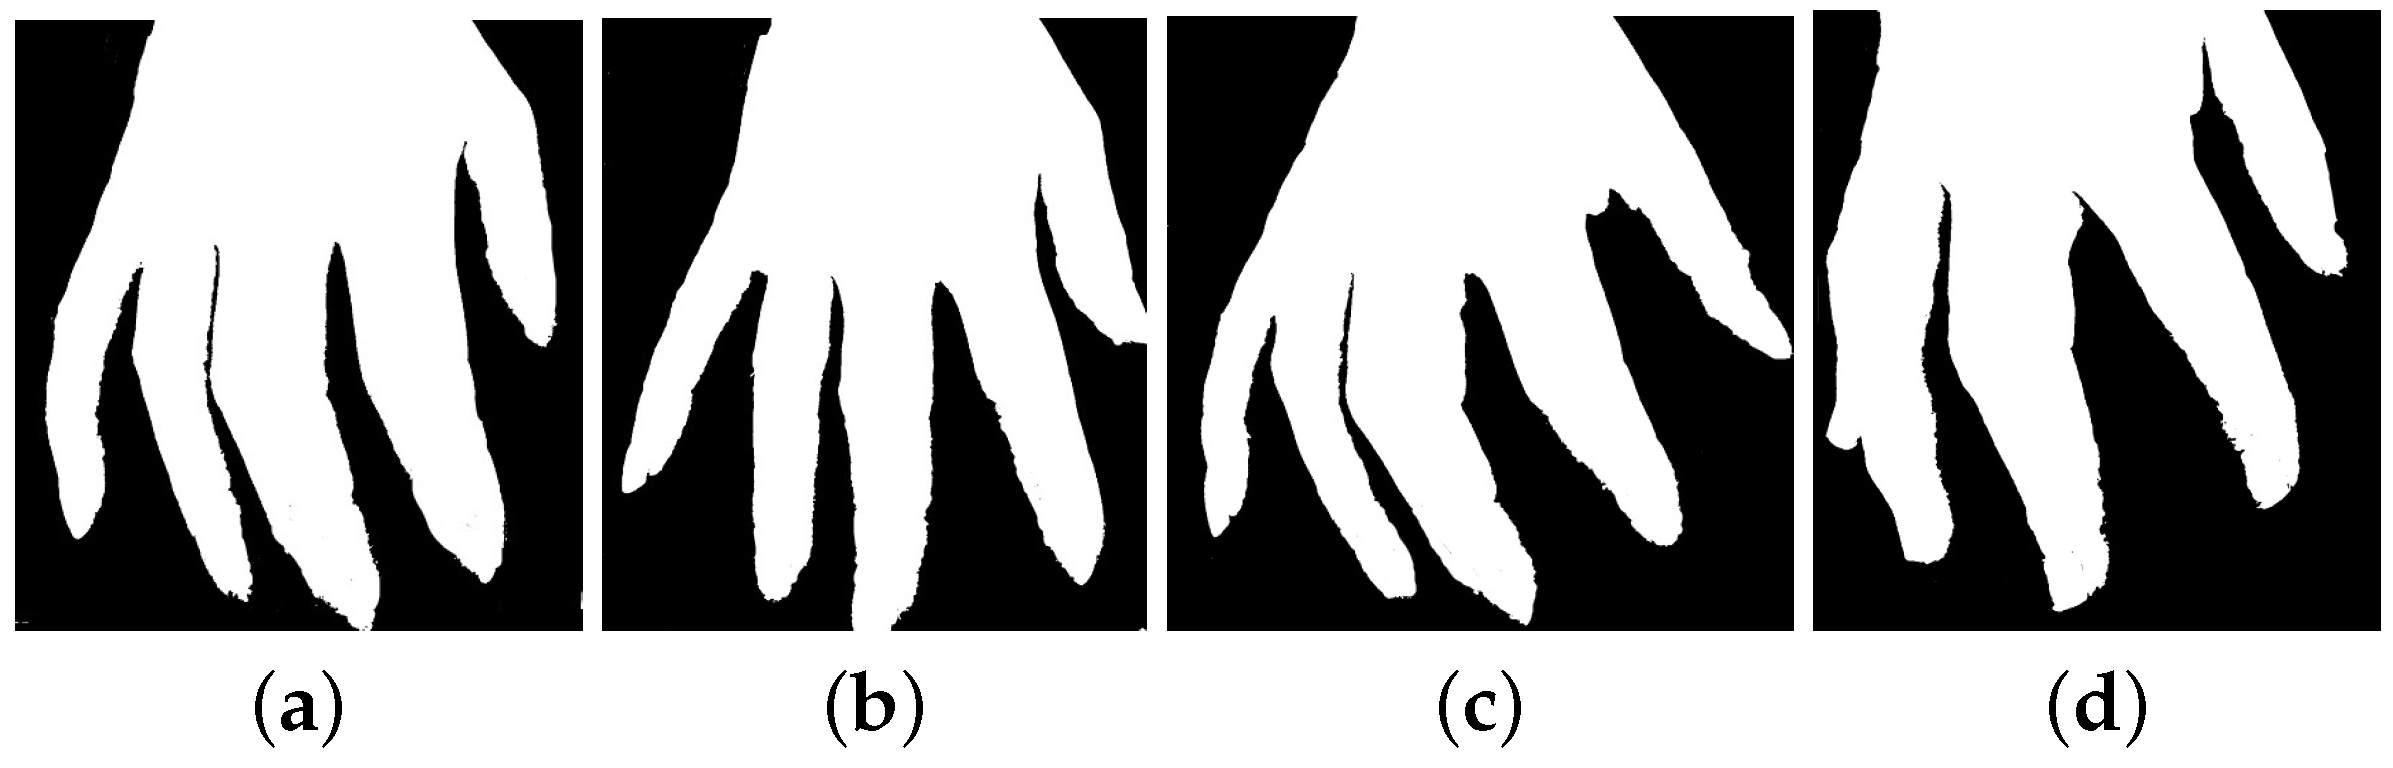
In the course of work on the method, it appeared that each user put their hands on the keyboard in a slightly different manner. As a result, the hands, and thus the fingers, are put at a different angle in a relation to the keyboard. In addition, the distance between fingers may vary between individuals. This hinders and sometimes simply prevents a correct localization of the index finger. Therefore, in the proposed method, searching for the hand and the index finger in the analyzed image takes place by using the
n patterns
from the set
consisting of hands or index fingers patterns, respectively. The patterns represent the hands of different people and differ from each other. Examples of the hand and finger patterns used are shown in
Figure 6 where the mentioned differences in positions of hands and fingers are clearly visible.
The general way of locating n patterns using the method was presented with the use of Algorithm 1. The input for the algorithm is the image and the set W containing the patterns searched for in the image. The result of the operation of the Algorithm 1 is the set P containing n points. The coordinates of each of these points indicate the center of a given pattern from the set W in the image .
| Algorithm 1: Location of n patterns in the image |
 |
In the next stage of the method, the coordinates of all points from the set
P are averaged. As a result of this operation, we obtain the coordinates of one point
. It should be remembered that individual patterns in the set
W were selected in such a way so that they differ from each other. This increases the probability that one of the patterns will be similar to objects (hand or finger) in the image analyzed. Unfortunately, the diversity of patterns is a reason that some of them may have a shape very different from the shape of the object currently searched for. In this case, the technique
may perform localization incorrectly, i.e., indicate a location of the pattern that deviates significantly from its actual location. An example of such a situation can be seen in
Figure 7, where two points were incorrectly located. Such indications should be treated as outliers. To eliminate outliers, a method described in [
23] was used. In this method, for each point
, its parameter
is determined. This allows assessing how far from the other points it is located. Determination of the measure
begins with the determination of cumulative distribution functions
and
:
where
is a Euclidean distance between
and
, the value
is a length of the diagonal of a image
I and
is an indicator function:
Next, for each point
, we define the value
as the maximum distance between
and
, so:
A small value of
indicates that point
is located near the other points and should not be treated as an outlier. Outliers should not be taken into account when determining the average value. In the proposed method, the point
is removed from the set
P, if the value
determined for this point is greater than 0.39 [
23]. All remaining points are put into set
O.
Determination of the point
, based on the points from the set
O, takes place on the basis of the following formulas:
where
and
m is the number of points in set
O.
Then, based on the coordinates
and
, an image fragment
with a centre in these coordinates and dimensions
is cut out:
The values w and h parameters should be selected so that the entire hand or the entire knuckle is visible in the cut out image. As a result of this assumption, the cut out image showing the hand has the size of the hand pattern searched for, i.e., , , where W and H are the width and the height of the hand pattern, respectively. In the case of the finger pattern, the knuckle covers only a small part of it. Taking this into consideration, the average size of knuckles was determined experimentally and compared to the size of the whole finger pattern. Based on the measurements, it has been assumed that, for finger pattern , , where W and H are the width and the height of the finger pattern, respectively.
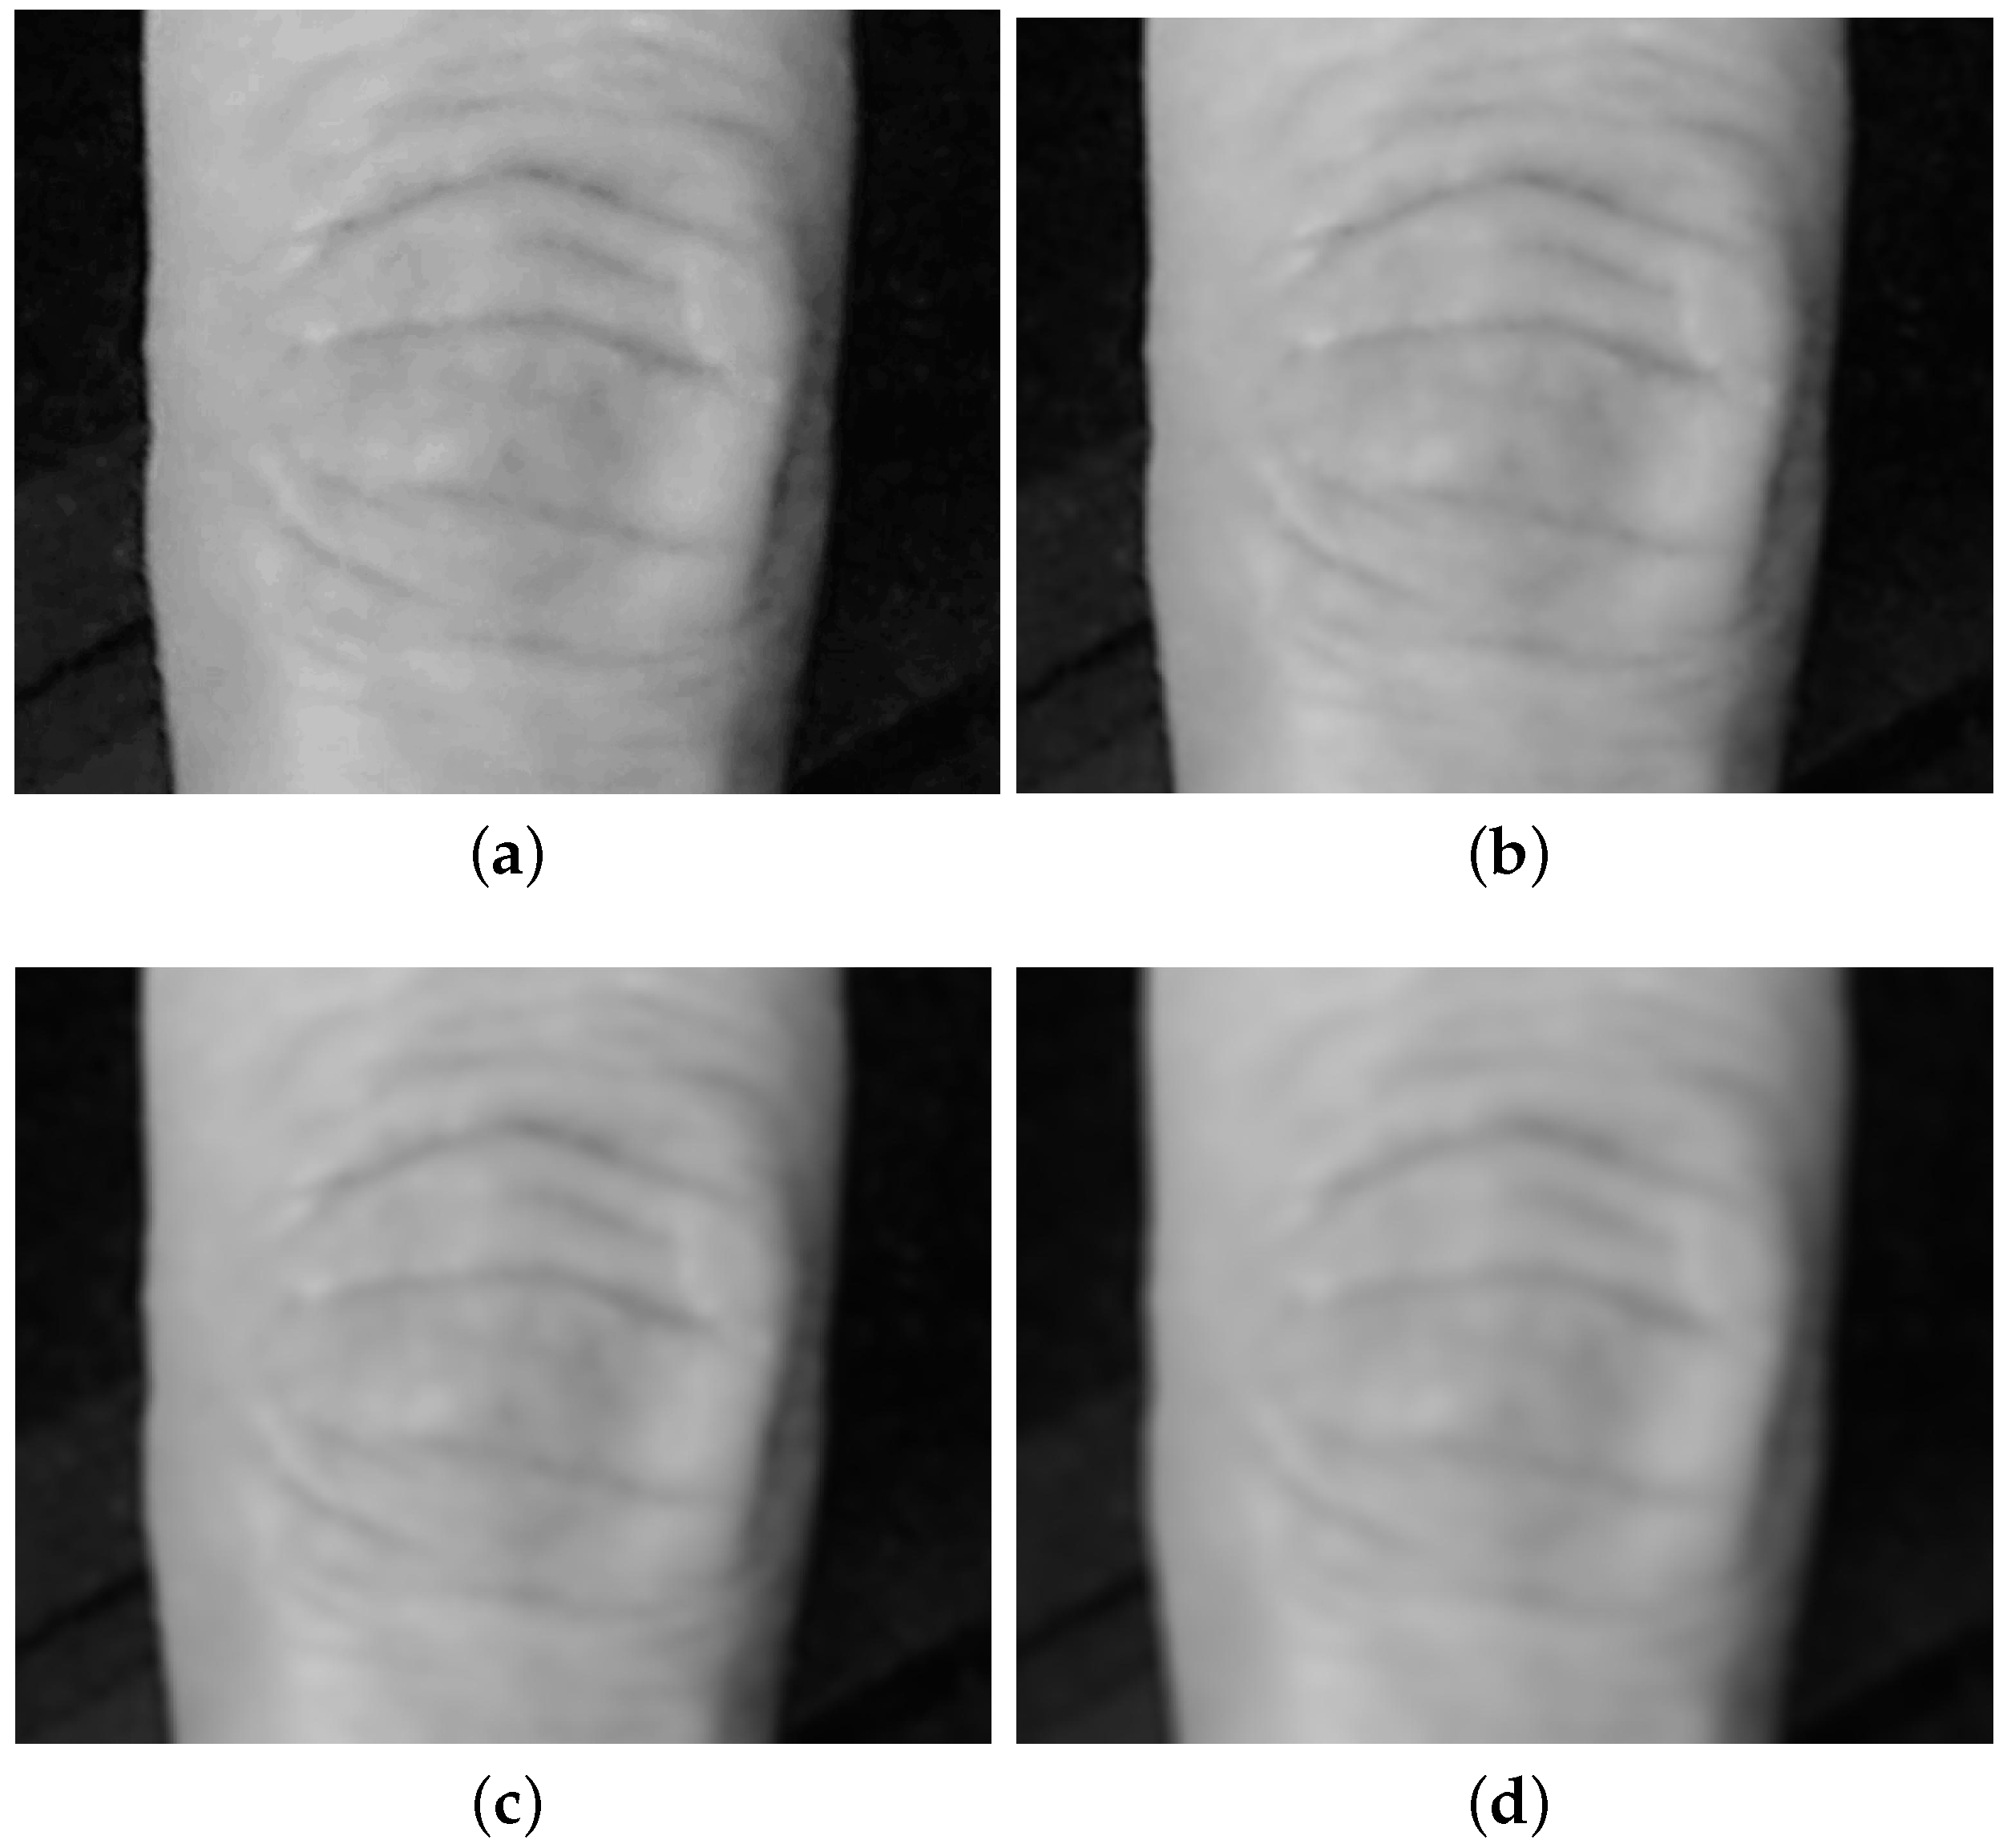
2.4. Assessment of Finger Image Quality
The proposed method assumes that the photos of the knuckle will be taken during normal work of the user. A photo of a moving object can be blurred or noised. It may be not possible to determining furrows in low quality images. Therefore, in the proposed method, each determined image
of the knuckle is subjected to quality assessment. For assessing the quality of the image
, there was used the measure
, which is based on determination of components of the gradient of the edge in the horizontal and vertical directions, i.e., along rows and columns, respectively:
where
is the image gradient matrix in the
x direction,
is the image gradient matrix in the
y direction,
w and
h are height and width of image
, • is Hadamard product of two matrices.
The values
, determined for four degrees of image blurring, are shown in
Figure 8.
If the determined value of the quality measure
of the image is lower than the assumed threshold
Q, then the image
is rejected and the process of localizing the finger image starts from the beginning, i.e., from the stage of taking a photo of the hand:
As already mentioned, the presented method is a two-stage method. The above stages, carried out in the right order, apply both for hand and finger patterns. In order to illustrate the operation of the method in a better way, its course was presented in a flowchart form shown in
Figure 9.
The final result of the method is an image showing the furrows located on the knuckle.
4. Experimental Verification
The effectiveness of the proposed method has been verified in a series of experiments. The tests were carried out in real conditions. A group of 50 users participated in the tests. For the tests, there was used Logitech c920 Pro Webcam camera, which takes photos in Full HD resolution. This camera is characterized by high quality of photos and has a built-in AutoFocus function. Its additional advantage is the integrated function of automatic correction of light intensity.
Initially, the parameter
Q in the Formula (
13) should be established. Images with quality
lower than the threshold
Q are considered to be useless and are eliminated from further analysis. To determine the value
Q, a set of images showing a knuckle, obtained with the use of the camera, was prepared. The set was prepared manually and was composed of 200 images. The images were of different quality, i.e., they were characterized by a different degree of blurring. The images were verified using the method described in
Section 3. During the experiment, the value of the parameter was changed in the range of
, with a step of 0.1. For each value
Q, the Accuracy (ACC) value was determined. The results of computations are shown in
Figure 10.
Based on
Figure 10, the value
was determined in further tests. After determining the value of the parameter
Q, the evaluation of the effectiveness of the proposed method was started. This time, finger knuckle images were registered automatically. The scenario of the next experiments assumed that each user would work with a computer using a computer keyboard. Every 5 min, the users moved away from their computers. Then, they either returned to their workstations or switched workstations with other users. The cases when users sat at computers of other users were treated as attack attempts. In such situations, the method should block access to the computer. In total, the tests included 400 cases of switching computers and 400 cases where users returned to their own computers. Such a test scenario enabled determination of popular measures: FAR (False Acceptance Rate), FRR (False Rejection Rate) and ACC (Accuracy) [
30].
Following this, the average values and standard deviations in each experiment have been calculated.
The experiment allowed for determining how the effectiveness of the method is affected by the different metrics of the image matching function which were used in the template matching method:
Square Difference(
SD),
Square Difference Normed (
SDN),
Correlation (
C), and
Correlation Normed (
CN). The impact of sizes of the images registered by the camera was also determined on the effectiveness of the method. The size of the image was defined by the parameter
M, which specifies the height and width of the image. The experiments were carried out using
patterns in the set
W. The results are presented in
Table 1.
Table 1 shows that the selection of the metrics of the image matching function affects the effectiveness of the method. The smallest values of FAR and FRR errors were obtained using the
Correlation (
C) measure. The resulting values of errors were as follows: FAR = 4.18%, FRR = 7.85%, and ACC = 94.81%. When analyzing the impact of the size of the image
I registered by the camera, we can see that the minimum resolution that allows for obtaining a high efficiency of recognition is 400 × 400 (px). An increase in the resolution does not significantly improve the effectiveness of the method. The deterioration in the effectiveness was caused by problems with a proper detection of furrows in the images. Based on the results obtained, in the subsequent experiments, there was used the
Correlation measure, while the resolution of the analyzed images was 400 × 400 (px).
An important element of the studies was determination of the impact of the number of the patterns used to locate both the hand and the index finger in order to assess the effectiveness of the method. In the previous experiment, the number of patterns was
. In order to check whether a reduction in the number of patterns will negatively affect the effectiveness of the method, in the next experiment, the number of patterns was being changed in the range of
. The FAR, FRR and ACC values obtained for individual values of
n are presented in
Table 2.
The results presented in
Table 2 show that, in order to obtain the highest possible effectiveness of the method, a set composed of
patterns is sufficient. The use of a larger number of patterns does not significantly improve the effectiveness of the method.
In addition, the validity of the approach, in which many patterns are searched for in the image, was examined in the next experiment. In this experiment, the set W contained only one pattern. Of course, in such a scenario, the stage of eliminating outliers was omitted because only one point was determined in the image. The tests were repeated ten times and each time a different pattern was searched for. The average values obtained were as follows: FAR = 15.84%, FRR = 26.41% and ACC = 79.50%. The results are significantly worse than those obtained in the method based on searching for multiple patterns. This unambiguously confirms that the developed method of locating the object with the use of multiple patterns is effective.
To confirm the validity of using a two-stage method of searching for patterns in the image (see
Section 2.3), its effectiveness was compared with results obtained using only one stage of searching for patterns. In this stage, a knuckle was searched for straight away in the entire image, i.e., the search area had not been previously narrowed down to the area of the right hand. In this case, the effectiveness obtained was only FAR = 23.46%, FRR = 32.31% and ACC = 71.74% and was definitely worse than that in the approach with the use of two stages.
An increase in the number of patterns results in a better effectiveness of the method but also results in extension of the time of the image analysis. In order to fully evaluate the impact of the parameter
n, its influence on the time of execution of Algorithm 1 was also measured. The measurements are important because the extent of the input data in Algorithm 1 depends directly or indirectly on the number
n of the patterns used. The patterns of hands are larger than those of fingers, so the tests for Algorithm 1 were carried out separately for each type of pattern. In our experiments, the measurement time was obtained on a PC class computer equipped with an Intel Xeon E5440 processor running at 2.83 GHz, with 8 GB of RAM and a Windows 7 x64 operating system. The results are presented in
Table 3.
When analyzing the results, it can be seen that the dependence between the algorithm’s execution time and the number
n is close to linear. Finding a single pattern using the TM method takes about 110 ms for the hand pattern and about 75 ms for the finger pattern. When determining the optimal parameter value of
n on the basis of results from
Table 2 and
Table 3, achievement of a high effectiveness of the method was set as a priority. Therefore, in further experiments, the value
n was established as
Table 2. The time complexity was also determined for individual stages of the proposed method—from the stage of image acquisition to the stage of verification of the image by the classifier. The results are presented in
Table 4.
In the case of the tests carried out by the author, the duration of the entire verification process based on the image of the knuckle was 1.8 s.
The last stage of the studies was to determine the suitability of the proposed method in single and multi-biometric person continuous verification systems [
31]. The studies included both the determination of the effectiveness of single method used separately and the assessment of the effectiveness of the method combining two methods.
For the tests of continuous multi-biometric system, there were selected systems combining the analysis of dynamics of typing on the keyboard with the analysis of the image of the knuckle. The methods were developed by the Author and described in detail in [
12,
13,
15]. In the proposed methods, the verification of user’s identity is performed in two stages. The purpose of the first stage of the method is verification based on the analysis of the dynamics of typing on the keyboard. If the verification of the user’s identity is successful, the user can continue the work. If the verification is unsuccessful, there is a suspicion that the current user is an intruder. In such a situation, the user is subjected to additional verification—this time based on an analysis of the image of the finger knuckles. A positive result of the additional verification means that the user can continue the work, and the verification procedure returns to the stage of analyzing the dynamics of typing on the keyboard. However, if additional verification is not successful, the user’s access to the computer’s resources will be blocked. The obtained results are presented in
Table 5. Additionally,
Table 5 includes values describing of the effectiveness of the used multi-biometric continuous verification method when acquisition of knuckles images took place in a traditional way, i.e., by putting the hand in a special device.
When analyzing the results from
Table 5, it can be seen that the proposed automatic acquisition method gives comparable results compared to the methods in which acquisition of knuckles images took place in a traditional way (by putting a hand into the scanner). However, it should be emphasized that the proposed method has an indisputable advantage—fully automatic acquisition of finger image, which is not offered by competing methods.


