Abstract
Railway special line shunting safety is a complicated systemic topic, which is full of uncertainty and dynamic; safety is determined by numerous aspects, including human, management, environmental, and equipment factors. Many railway risk assessment techniques currently used are comparatively mature tools. However, in many circumstances, the application of these tools gives unsatisfactory results because the risk data are incomplete or involve high levels of uncertainty. Because risk assessment technology has its own applicability that it may not suitable for the three sub-processes of risk assessment, it is difficult to obtain ideal effects by using a single tool in the risk assessment process. This paper presents an integrated approach for conducting special-line shunting risk assessment, using fishbone diagram analysis, fuzzy reasoning approaches, and a fuzzy analytical hierarchy tool, which can evaluate both qualitative and quantitative risk data efficiently and effectively. The outcomes of risk assessment are represented as risk degrees and risk levels, providing railway safety risk managers and engineers with tools to improve their safety management standards. A case study is used to demonstrate the proposed methodology. The results reveal that the proposed model can effectively and efficiently assess risks associated with a special-line shunting system, yielding more reliable and realistic solutions.
1. Introduction
Railway special lines are branch lines that are managed by enterprises or other units that connect to national railway lines [1,2]. Special line shunting safety involves many kinds of work and multiple operation links, such as transportation, electric locomotives, maintenance, electric service and vehicles. The operation coordination degree is high and the dynamic control of safety risk is difficult; carelessness can cause collision, derailment, and other accidents [3]. Therefore, risk assessment of special line shunting should be examined to improve railway safety management.
At present, many mature risk assessment technologies have been promoted and applied in many industries with good practical results, such as fault tree analysis, event tree analysis, and Monte Carlo simulations [4]. However, the results of such technologies rely heavily on the availability and accuracy of the risk data. In many circumstances, risk events have never occurred, occurred with low historical frequency, or had varying problems in data collection. Thus, data cannot effectively support risk measurement or the modeling and estimation of related risk parameters, obviously, these methods cannot obtain reliable and realistic results. Furthermore, various factors influence the selection of an approach to risk assessment, such as the availability of resources, the nature and degree of uncertainty in the data and information available, and the complexity of the application [5]. Different assessment tools and techniques have their own applicability, and it is difficult to achieve ideal assessment effects with a single technique. To solve this problem, An et al. [4] proposed an improved fuzzy hierarchical analysis method for decision-making in the railway risk assessment process. An et al. [6] used fuzzy theory and fuzzy analytic hierarchical processing (FAHP) to evaluate railway safety risks. Hakan et al. [7] used a fuzzy theory based method to analysis cargo vessel safety. Abbas et al. [8] constructed an integrated fuzzy hierarchical risk assessment model for water supply systems, while Samanta et al. [9] proposed an integrated risk assessment route in relation to metropolitan construction projects based on the fuzzy set theory. Ajit et al. [10] used the fuzzy c-means algorithm, which works according to the fuzzy membership between data points and cluster centers to handle volumes of data. Other methods can be found in the references.
In this study, an integrated risk assessment method for special line shunting is introduced to assess risks in complex shunting systems based on fuzzy theory. This model not only uses fishbone diagrams to identify system risk factors qualitatively, but also addresses incomplete or redundant safety information by a fuzzy reasoning approach (FRA) and can confirm the weight of the contribution of each risk factor in a hierarchical structure through FAHP, so that the risk assessment can be progressed from the indicator level to the criteria level and finally to the target level. Finally, three risk parameters are used to rank the risks and thereby select appropriate risk response measures. Outcomes of the proposed risk assessment approach are represented as the risk degrees and the defined risk categories of risk levels with a belief of percentage, which provide very useful risk information to decision makers.
The structure of the remaining part of the paper has been described below. Section 2 presents a new risk model, and discusses the application of fishbone diagram, FRA, and FAHP in detail. A case study on risk assessment of special line shunting at the Yujialiang coal mine is presented in Section 3 to demonstrate the application of the proposed risk assessment methodology. Finally, Section 4 gives conclusions and a summary of the main benefits of using the proposed approach in the risk assessment process.
2. Risk Assessment Model
Risk assessment is the overall process of risk identification, analysis, and evaluation [11,12]. As an important part of risk management, risk assessment is not a stand-alone activity; it should be fully integrated into the other components of the risk management process [5,12]. The risk assessment model constructed in this paper divides risk assessment activities into five stages: context establishment, risk identification, risk analysis, risk evaluation, and risk treatment, as shown in Figure 1.
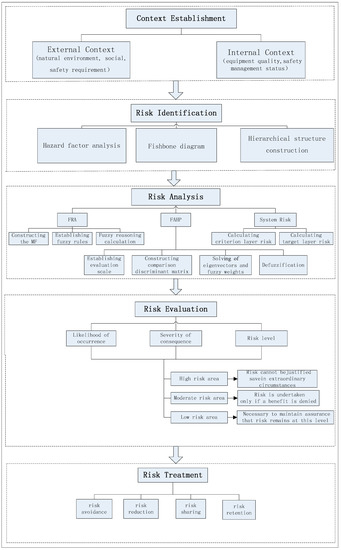
Figure 1.
Railway special-line shunting risk-assessment model. FRA: fuzzy reasoning approach; FAHP: fuzzy analytic hierarchical processing.
2.1. Context Establishment
This stage mainly states the internal and external challenges faced by the operation of special line shunting. These challenges include cultural, social, legal, and regulatory factors, as well as the nature environment, safety requirements, equipment quality, and so on [12]. The context establishment assists in identifying the natures and types of risk causes, determining disaster-causing factors, and setting the scope and criteria for risk assessment.
2.2. Risk Identification
Risk identification is the process of finding, recognizing, and describing risks [11,12,13,14]. In this paper, we use fishbone diagram analysis to qualitatively identify hazard factors in railway special line shunting. The fishbone diagram is a model of suggestive presentation for the correlations between an event and its multiple possible causes. The structure provided by the diagram helps decision makers to think systematically. The proposed risk assessment method utilizes hazard factor analysis, the fishbone diagram, and hierarchical structure construction as inputs [15,16].
2.3. Risk Analysis
Risk analysis is the process of comprehending the nature of a risk and to determine the level of risk [11,12]. In this stage, we obtain the indicator layer risk level by FRA, and then we use FAHP to calculate the relative importance of the risk factors to process the risk assessment from the indicator level to the criteria layer and finally to the target level.
2.3.1. Fuzzy Reasoning Analysis
Fuzzy reasoning analysis can convert risk information, such as expert knowledge, engineering experience judgement, and historical data, into a mathematical model in the form of fuzzy language, which encompasses fuzziness and uncertainty from different sources. The resulting model can quantify and materialize risk information [8,17]. Through the likelihood of occurrence and severity of consequence, the risk size of a single hazard factor can be obtained by the model. The specific steps are as follows:
(1) Constructing the Membership Function (MF)
● Step1: Likelihood of occurrence MF
According to “Railway applications—The specification and demonstration of Reliability, Availability, Maintainability and Safety”, we can obtain the likelihood of occurrence MF combined with FRA, as specified in Table 1 and Figure 2.

Table 1.
Likelihood of occurrence membership function (MF).
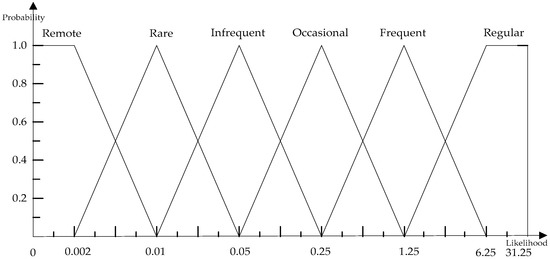
Figure 2.
Likelihood of occurrence MF.
● Severity of consequence MF
According to “Railway applications—The specification and demonstration of Reliability, Availability, Maintainability and Safety”, we can obtain the severity of consequence MF combined with FRA as specified in Table 2 and Figure 3.

Table 2.
Severity of consequence MFs.
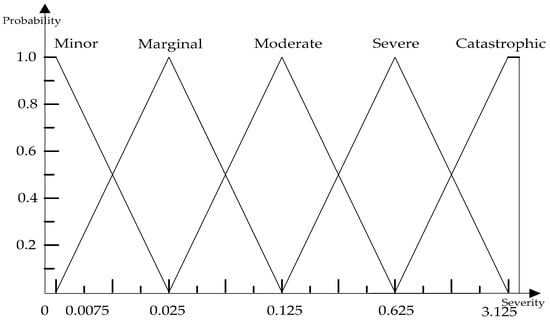
Figure 3.
Severity of consequence MF.
● Risk-level MF
According to the “as low as reasonably practicable” (ALARP) principle, as practiced in the UK, special-line shunting risks are classified into four categories: intolerable, undesirable, tolerable, and negligible [6]. Combined with fuzzy theory, different risk levels are assigned different risk values to establish the MF of risk levels as shown in Table 3 and Figure 4.

Table 3.
Risk level MF.
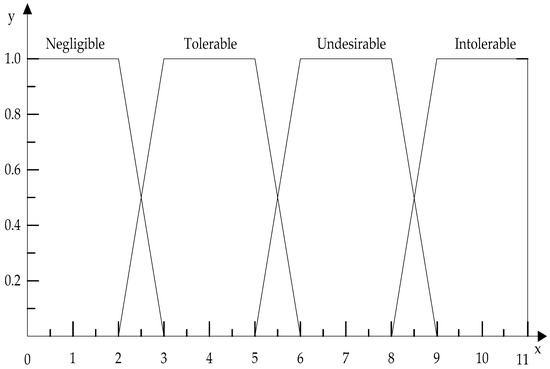
Figure 4.
Risk level MF.
(2) Establishing fuzzy rules
Fuzzy rules consist of a series of “if–then” rules, which are the core of the fuzzy reasoning approach [8,18]. The form is as follows:
where An and Bn are the input and output fuzzy sets, x = (x1, x2, ..., xn)T ∈ U, y ∈ V, x and y are input and output fuzzy vectors, U and V are the domains of the input and output variables, k = 1, 2, ..., m, and m is the total number of fuzzy rules. Fuzzy rules are determined by expert experience and engineering knowledge; the number of fuzzy rules is determined by the classification of the two inputs of fuzzy reasoning of “likelihood of occurrence” and “severity of consequences.” In this paper, the likelihood of occurrence has six categories of qualitative description, and the severity of consequence has five categories of qualitative description, so thirty fuzzy rules can be established in total. The specific content is shown in Table 4:

Table 4.
Risk fuzzy rules.
(3) Fuzzy Reasoning Calculation
Fuzzy reasoning calculation is the process of transforming fuzzy input values into output values. In order to obtain the specific output value, the fuzzy set must be solved. The specific steps are as follows:
● Step 1: Input language fuzziness
Input language fuzziness refers to the process of transforming the known risk information into a risk level with a certain degree of membership, according to the MF and fuzzification. For example, the likelihood of occurrence of “psychological abnormality” is 0.015, the severity of consequence is 0.02, and the result of fuzziness can be expressed as {(remote, 0), (rare, 0.875), (infrequent, 0.125), (occasional, 0), (frequent, 0), (regular, 0)}; {(minor, 0.25), (marginal, 0.75), (moderate, 0), (severe, 0), (catastrophic, 0)}.
● Step 2: Fuzzy mapping
After the input language is fuzzified, the activated fuzzy rules are found against the fuzzy rule matrix. The MFs in the active rules are analyzed and calculated, and the fuzzy degree of the conclusion is obtained [19].
For fuzzy inference rules composed of two input variables and one output variable, such as “if x is A, and y is B, then z is C”, the input language value is (x0, y0), according to FRA. To obtain the output language value z0, the excitation intensity (representing the extent to which the first half of the rule is satisfied) aq must be determined. aq can be obtained by the Cartesian product of the fuzzy set sum.
Assuming that the input language (x0, y0) is fuzzified, the membership degree to which x0 belongs to the fuzzy subset Ai is , and the membership degree to which y0 belongs to the fuzzy subset Bi is , the fuzzy rules that are activated are: “if x is Ai and y is Bi, then z is Ck,” and the excitation intensity aq obtained by fuzzy rules Rq can be obtained by Equation (1):
After obtaining the excitation intensity aq, we can use aq to obtain the MF of Ck, receiving the mapping of the first half to conclusion, and obtain the inference results Ck# under fuzzy rules Rq, cutting can be expressed by Equation (2). This method is often referred to as the clipping method. See Figure 5 for the FRA process.

Figure 5.
Fuzzy inference.
● Step 3: Fuzzy aggregation operation
From Figure 5, we can see that for x0 belonging to two different fuzzy sets Ai and Ai+1, besides activating the fuzzy rules Rq, it can also activate other fuzzy rules. Fuzzy aggregation is the process of integrating the mapping results obtained under all activated fuzzy rules. The integrated result represents the output fuzzy set of the whole fuzzy reasoning conclusion, corresponding to the union set of fuzzy relations of each fuzzy rule, as represented by Equation (3) [19]. The process is shown in Figure 6.
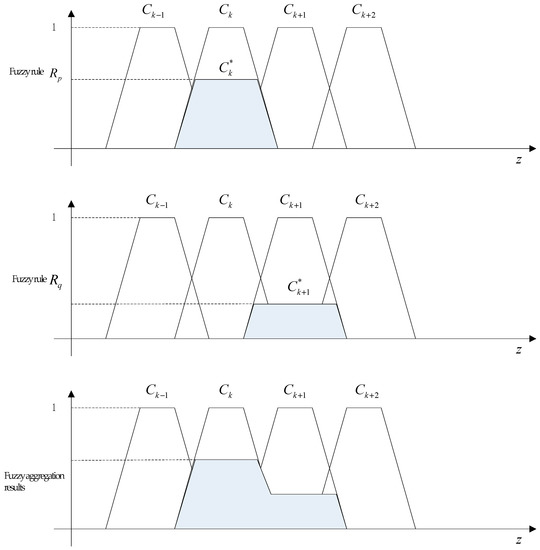
Figure 6.
Fuzzy inference aggregation.
● Step 4: Defuzzification
In the process of FRA, the activated fuzzy rules are analyzed and calculated, and then the MFs of the output fuzzy sets are obtained by combining the results of inferences obtained by calculation. In this paper, the method of the circumference centroid is used to solve the fuzziness [9]. The formula is as follows:
where zc represents the output value of the FRA conclusion. Substituting this value into the initial MF, we can complete the qualitative transformation of fuzzy reasoning results. As can be seen from Figure 7, the membership degree to which the output value belongs to Ck is u(zc1); that to which it belongs to Ck+1 is u(zc2) [20].
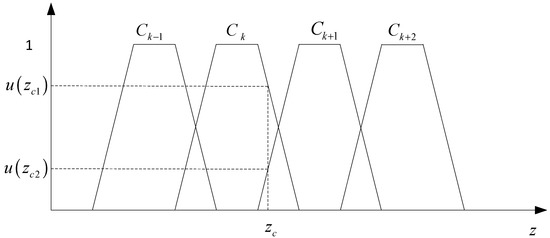
Figure 7.
Defuzzification.
2.3.2. Fuzzy Analytic Hierarchical Process
Because of human thinking, cognitive fuzziness, and the uncertainty of risk information, the traditional hierarchical analysis method is unable to provide precise numerical description of these fuzzy problems, so it is difficult to help decision makers to evaluate the fuzzy decision-making problems in real life. FAHP is combined fuzzy theory with AHP, thereby allowing more flexible variation of the expression form of an assessment scale comparison, and can better express expert opinions [21,22,23].
(1) Establishing evaluation scale
In the process of pairwise comparison, FAHP uses triangular fuzzy numbers as the evaluation scale for estimation in the following form: aij = (lij, mij, uij) where aij is the score given by experts on the importance of the item element i relative to the item element j, and lij, mij, and uij are evaluation scales from 1 to 9 satisfying the relationship lij ≤ mij ≤ uij. lij and uij respectively represent the minimum and maximum values of the fuzzy range and mij is the value considered by experts as the most representative of the relative importance of the two elements [20,21,24]. The meanings expressed by different score ranges are shown in Table 5 and Figure 8.

Table 5.
Evaluation scale.
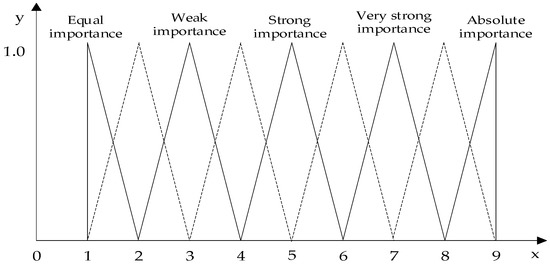
Figure 8.
Evaluation scale score diagram.
(2) Constructing comparison discriminant matrix
For a hierarchical structure containing n individual elements, the following comparison judgment matrix can be constructed by comparing the two elements in the layer and using the scores aij obtained by the experts according to the evaluation scale table.
The matrix element aij = (lij, mij, uij) should satisfy the following two conditions:
(3) Solving of eigenvectors and fuzzy weights
Suppose ap = (lp, mp, up) and aq = (lq, mq, uq), representing two different triangular fuzzy numbers respectively [24,25]. The fuzzy operation rules of the two numbers are as follows:
In this paper, the geometric average method is used to integrate the evaluation results of several experts; see [20] for details.
where fi is the geometric average of the judgment matrix row i and wi is the weight of the risk factor i.
(4) Defuzzification
As the obtained characteristic value wi is a fuzzy value, the fuzzy value must be transformed into a non-fuzzy value by defuzzification. In this study, the inverse triangulation fuzzy number formula is adopted [20]. Assuming the triangulation fuzzy number wi = (li, mi, ui), the defuzzification calculation formula is as follows:
In order to compare the relative importance of different evaluation indices, the fuzzy weight value is normalized according to the following formula:
2.3.3. System Risk
(1) Calculating criterion layer risk
The risk size of the criterion layer can be obtained by Formula (16), with specific references [6]:
(2) Calculating target layer risk
The risk size of the target layer can be obtained by Formula (17), with specific references [6]:
2.4. Risk Evaluation
Risk evaluation is the process of comparing the results of risk analysis with risk criteria to determine whether the risk is acceptable or tolerable [11,12]. After the system risk was obtained through the above steps, we should use “ALARP” principle to analyze “likelihood of occurrence”, “severity of consequence” and “risk level”, to determine which risk area the risk events belong to and what measures should be taken [26,27].
2.5. Risk Treatment
Risk treatment is an important sub-process of the risk management process and one of the purposes of risk assessment [11,28]. As the output of risk assessment, risk treatment is implemented according to the priority of risk response. According to the results of risk evaluation, special line shunting risk can be addressed in four ways, including risk avoidance, risk reduction, risk sharing, and risk retention [29].
3. Case Application
3.1. Context Establishment
The Yujialiang coal mine special line is located in the Huangyangcheng station of the ShenShuo Railway. It is used for coal transportation by the ShenDong Group. Because of the heavy transportation tasks, complex topography, regional landforms, harsh climate, and environment, the operation quality of the equipment and the ability to resist natural disasters are obviously inadequate. Furthermore, shunting safety involves multiple jobs and work links, such as vehicles, electric locomotives, power, etc. The dynamic control of safety risk is quite difficult, and insufficient control may easily induce collisions, derailments, and other inertial vehicle adjustment accidents, which will affect railway transportation safety.
3.2. Risk Identification
3.2.1. Hazard Factor Analysis
According to “Classification and code for the hazardous and harmful factors in process” (GB/T 13861-2009), the Yujialiang coal mine special line shunting hazard factors can be divided into human, management, environmental, and equipment factors, details are shown in Table 6.

Table 6.
Hazard factor analysis.
3.2.2. Fishbone Diagram
The fishbone diagram for the Yujialiang Coal Mine special line, constructed according to the classification and analysis of the hazard factors, is shown in Figure 9.
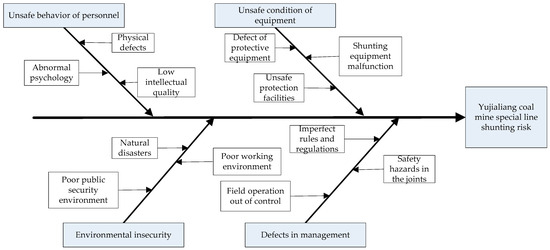
Figure 9.
Hazard factor identification.
3.2.3. Hierarchical Structure Construction
According to the fishbone diagram of the hazard factors, the hierarchical structure of “target layer–criterion layer–indicator layer” is constructed as shown in Figure 10:
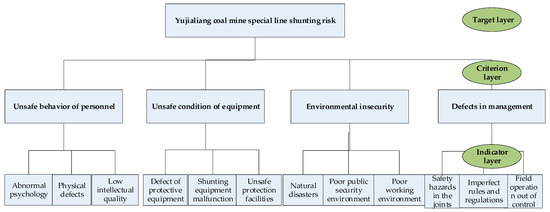
Figure 10.
Staircase substructure.
3.3. Risk Analysis
3.3.1. Risk of Indicator Layer Hazard Factors
According to the historical data and expert opinions on the operation of special line of the Yujialiang coal mine, the likelihood of occurrence and severity of consequence about the risk events of hazard factors in the indicator layer are obtained comprehensively, and then the risk of hazard factors in the indicator layer is obtained using FRA. Details are shown in Table 7.

Table 7.
Yujialiang coal mine special line shunting risks of indicator layer.
3.3.2. Relative Weights of Indicator Layer Hazard Factors
The relative weights of indicator layer hazard factors are assigned by consulting experts on the site and combining their opinions with the actual safety situation, yielding the following matrices:
The relative weight of each hazard factor in the indicator layer can be obtained by defuzzification, as shown in Table 8.

Table 8.
The index layer hazard factor weight.
3.3.3. Relative Weights of Hazard Factors in Criterion Layer
The relative weights of hazard factors in the criterion layer are assigned by consulting experts and combining their opinions with the actual safety situation, forming the following matrix:
The relative weight of each index in the criterion layer can be obtained by defuzzification.
3.3.4. System Risk Calculation
According to Equation (16), the risk of each hazard factor in the criterion layer can be obtained:
According to Formula (17), the risk size of the target layer can be obtained:
3.4. Risk Evaluation
We can find that the system risk is 6.00 by the above calculation and 100% is an “undesirable” risk. Therefore, further analysis should be made. In this stage, we use the likelihood of occurrence, the severity of consequences, and the risk level to analyze the system risk. The left of Figure 11 sorts the results of risk likelihood of occurrence, the right sorts the results of severity of consequences, and the center sorts the results of risk level. The following conclusions can be drawn:
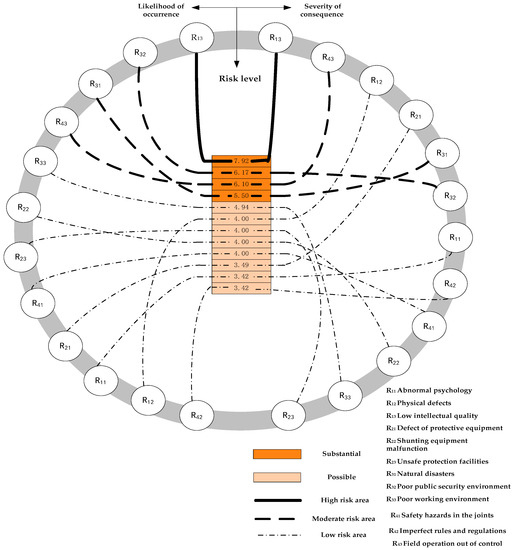
Figure 11.
The order of hazard factor risk.
(1) “Low knowledge quality” hazard factors have the characteristics of high occurrence rates, serious consequences, and high risk; the risk level thus obtained falls into the high-risk area. Therefore, control measures should be taken before, during, and after such risks occur to reduce the likelihood of occurrence of similar events and losses. Risk levels must be reduced to the “ALARP” region. Similar characteristics apply to the “poor public security environment,” “inadequate safety inspection,” and other factors.
(2) The risk event probability of hazard factors such as “poor operating environment” and “unreliable protection facilities” is high; while the risk loss is relatively small, they remain “undesirable” risks. In order to reduce the likelihood of occurrence of such risk events, it is necessary to improve the operating environment and strengthen the quality of protective facilities.
(3) The likelihood of occurrence of risk events such as “physical defects” is relatively low, but the risk loss is relatively serious; the risk is thus tolerable. To address such risks, we should strengthen medical examinations, prevent occupational diseases, and minimize possible casualties and property losses to reduce the risk.
(4) The likelihood of occurrence and losses caused by “imperfection of laws and regulations” are relatively low, and the risk level is tolerable. Such risks should be monitored and controlled within acceptable limits, considering the cost–benefit principle.
3.5. Risk Treatment
(1) Risk avoidance. In case of severe storms and snow, natural disasters such as landslides and mud-rock flows occur easily, causing casualties and property losses. In such cases, emergency plans should be initiated to strengthen the safety control of shunting. Shunting should be stopped when severe weather reaches a certain level to avoid risk.
(2) Risk reduction. For predicable hazard factors such as “incomplete safety inspection” and “low knowledge quality,” the source control should be strengthened, the quality of education training for employees should be improved, and the likelihood of occurrence of such risk events should be reduced. Simultaneously, emergency plans should be launched soon after events occur and handled in accordance with the “five determinations” principle to reduce the consequences of risk events. For unpredictable risks such as “poor security environment,” it is necessary to strengthen risk information collection and act to reduce the uncertainty of risk events.
(3) Risk sharing. Sharing is a common way to address risks. For the “safety hazard of the joint department,” the responsibilities of each type of professional work and personnel in each position can be clearly defined, and the joint department risk can be detailed and subcontracted to each type of work.
(4) Risk retention. For hazard factors such as “psychological abnormality” and “physical defects,” we should take the initiative to accept the adverse consequences and prepare funding in advance for risk events caused by these hazard factors, thereby strengthening the mental health education and rehabilitation training of employees to prevent the occurrence of such events.
4. Conclusions
Traditionally risk assessment techniques currently used in the railway industry heavily rely on the availability and accuracy of risk information, sometimes they are unable to deal with incomplete or uncertain data. This paper presents a new integrated railway special line shunting risk assessment model using fishbone diagrams, FRA, and FAHP, that addresses both quantitative and qualitative risk information. The model can also overcome the drawbacks of a single risk assessment technique, which cannot acquire reliable results in the risk assessment process. The model is applied to the special line shunting of the Yujialiang coal mine, the results reveal that by using the proposed model, risks associated with a special line shunting system can be assessed effectively and efficiently, and more reliable and realistic solutions can be obtained. It provides railway special line safety risk managers, engineers, and decision-makers with a tool to improve their safety management standards.
Author Contributions
H.Z. conceived and wrote the entire paper; Q.S. modified the article; All the work of this paper was done by both of them.
Funding
This research was funded by National Natural Science Foundation of China, grant number 51578057, and the Science and Technology Research and Development Major/Key Program of China Railway Corporation, grant number 2017T003-C.
Acknowledgments
Min An is a specialist at the Salford University in Railway Engineering with expertise in safety, risk and reliability modelling, particularly in the fields of railways, undergrounds, highways, oil and gas, and the nuclear industry, among others. This study presents a novel analysis of risks in the management of railway special lines; we gratefully acknowledge Professor An for his support in advising our technologies selection.
Conflicts of Interest
The authors declare no conflict of interest.
References
- Yang, B.; Jiao, X.U. Application of MATLAB on Safety Evaluation of Dangerous Goods Loading Area on Special Line. Railw. Transp. Econ. 2011, 3, 16. [Google Scholar]
- Zhe, W.; Wei, W. Anti-alliance Game Analysis on the Private Sharing of Railway Special Lines. In Proceedings of the 4th International Conference on Logistics and Supply Chain Management, Changsha, China, 18–22 July 2012. [Google Scholar]
- Guo, H.Y.; Shi, H.G.; Zhang, P.; Lei, Y.-H. Safety Evaluation of Railway Industrial Sidings based on Dynamic Fuzzy Theory. Railw. Transp. Econ. 2017, 39, 40–45. [Google Scholar]
- An, M.; Qin, Y.; Jia, L.M.; Chen, Y. Aggregation of group fuzzy risk information in the railway risk decision making process. Saf. Sci. 2016, 82, 18–28. [Google Scholar] [CrossRef]
- International Organization for Standardization/International Electrotechnical Organization. Risk Management–Risk Assessment Techniques: IEC 31010-2009; ISO: Geneva, Switzerland, 2009. [Google Scholar]
- An, M.; Chen, Y.; Baker, C.J. A fuzzy reasoning and fuzzy-analytical hierarchy process based approach to the process of railway risk information: A railway risk management system. Inf. Sci. 2011, 181, 3946–3966. [Google Scholar] [CrossRef]
- Akyildiz, H.; Mentes, A. An integrated risk assessment based on uncertainty analysis for cargo vessel safety. Saf. Sci. 2017, 92, 34–43. [Google Scholar] [CrossRef]
- Roozbahani, A.; Zahraie, B.; Tabesh, M. Integrated risk assessment of urban water supply systems from source to tap. Stoch. Environ. Res. Risk Assess. 2013, 27, 923–944. [Google Scholar] [CrossRef]
- Samantra, C.; Datta, S.; Mahapatra, S.S. Fuzzy based risk assessment module for metropolitan construction project: An empirical study. Eng. Appl. Artif. Intell. 2017, 65, 449–464. [Google Scholar] [CrossRef]
- Kumar, A.; Kumar, D.; Jarial, S.K. A hybrid clustering method based on improved artificial bee colony and fuzzy C-Means algorithm. Int. J. Artif. Intell. 2017, 15, 40–60. [Google Scholar]
- ISO. Risk Management Vocabulary: ISO Guide 73-2009; ISO: Geneva, Switzerland, 2009. [Google Scholar]
- Li, S. ISO Risk Management Standard Explanation; Posts & Telecom Press: Beijing, China, 2012; pp. 44–352. [Google Scholar]
- Dong, X.M. Safety Risk Management of Rail Transit; China Railway Publishing House: Beijing, China, 2014; pp. 231–277. [Google Scholar]
- Torabi, S.A.; Giahi, R.; Sahebjamnia, N. An enhanced risk assessment framework for business continuity management systems. Saf. Sci. 2016, 89, 201–218. [Google Scholar] [CrossRef]
- Luo, Y.M.; Huang, S.Y.; Cao, S.Y. Application of Improved Fishbone Diagram in the Operation Management. Ind. Eng. J. 2007, 10, 138–141. [Google Scholar]
- Luo, T.Y.; Chao, W.; Duan, L.X. Fishbone diagram and risk matrix analysis method and its application in safety assessment of natural gas spherical tank. J. Clean. Prod. 2018, 174, 296–304. [Google Scholar] [CrossRef]
- Nieto-Morote, A.; Ruz-Vila, F. A fuzzy approach to construction project risk assessment. Int. J. Proj. Manag. 2011, 29, 220–231. [Google Scholar] [CrossRef]
- Zeng, J.; An, M.; Smith, N.J. Application of a fuzzy based decision making methodology to construction project risk assessment. Int. J. Proj. Manag. 2007, 25, 589–600. [Google Scholar] [CrossRef]
- Xie, T. Research on Risk Assessment and Management of Railway Construction Projects. Master’s Thesis, Southwest Jiaotong University, Chengdu, Sichuan, China, 2014. [Google Scholar]
- Huang, S.; An, M.; Chen, Y.; Baker, C.J. Railway Safety Risk Assessment Using FRA and FAHP Approaches—A Case Study on Risk Analysis of Shunting at Waterloo Depot. In Proceedings of the 2007 2nd Institution of Engineering and Technology International Conference on System Safety, London, UK, 22–24 October 2007; pp. 181–186. [Google Scholar]
- Kutlu, A.C.; Ekmekçioğlu, M. Fuzzy failure modes and effects analysis by using fuzzy TOPSIS-based fuzzy AHP. Expert Syst. Appl. 2012, 39, 61–67. [Google Scholar] [CrossRef]
- Zyoud, S.H.; Kaufmann, L.G.; Shaheen, H.; Samhan, S.; Fuchs-Hanusch, D. A framework for water loss management in developing countries under fuzzy environment. Expert Syst. Appl. 2016, 61, 86–105. [Google Scholar] [CrossRef]
- Gul, M.; Guven, B.; Guneri, A.F. A new Fine-Kinney-based risk assessment framework using FAHP-FVIKOR incorporation. J. Loss Prev. Process Ind. 2018, 53, 3–18. [Google Scholar] [CrossRef]
- Sirisawat, P.; Kiatcharoenpol, T. Fuzzy AHP-TOPSIS approaches to prioritizing solutions for reverse logistics barriers. Comput. Ind. Eng. 2018, 117, 303–318. [Google Scholar] [CrossRef]
- Silva, M.M.; de Gusmão, A.P.H.; Poleto, T.; Costa, A.P.C.S. A multidimensional approach to information security risk management using FMEA and fuzzy theory. Int. J. Inf. Manag. 2014, 34, 733–740. [Google Scholar] [CrossRef]
- Abrahamsen, E.B.; Abrahamsen, H.B.; Milazzo, M.F.; Selvik, J.T. Using the ALARP principle for safety management in the energy production sector of chemical industry. Reliab. Eng. Syst. Saf. 2018, 169, 160–165. [Google Scholar] [CrossRef]
- Melchers, R.E. On the ALARP approach to risk management. Reliab. Eng. Syst. Saf. 2001, 71, 201–208. [Google Scholar] [CrossRef]
- Zhang, Y. Selecting risk response strategies considering project risk interdependence. Int. J. Proj. Manag. 2016, 34, 819–830. [Google Scholar] [CrossRef]
- Baker, S.; Ponniah, D.; Smith, S. Risk response techniques employed currently for major projects. Constr. Manag. Econ. 1999, 17, 205–213. [Google Scholar] [CrossRef]
© 2018 by the authors. Licensee MDPI, Basel, Switzerland. This article is an open access article distributed under the terms and conditions of the Creative Commons Attribution (CC BY) license (http://creativecommons.org/licenses/by/4.0/).