Fast Confirmation of Antibody Identity by MALDI-TOF MS Fingerprints


Abstract

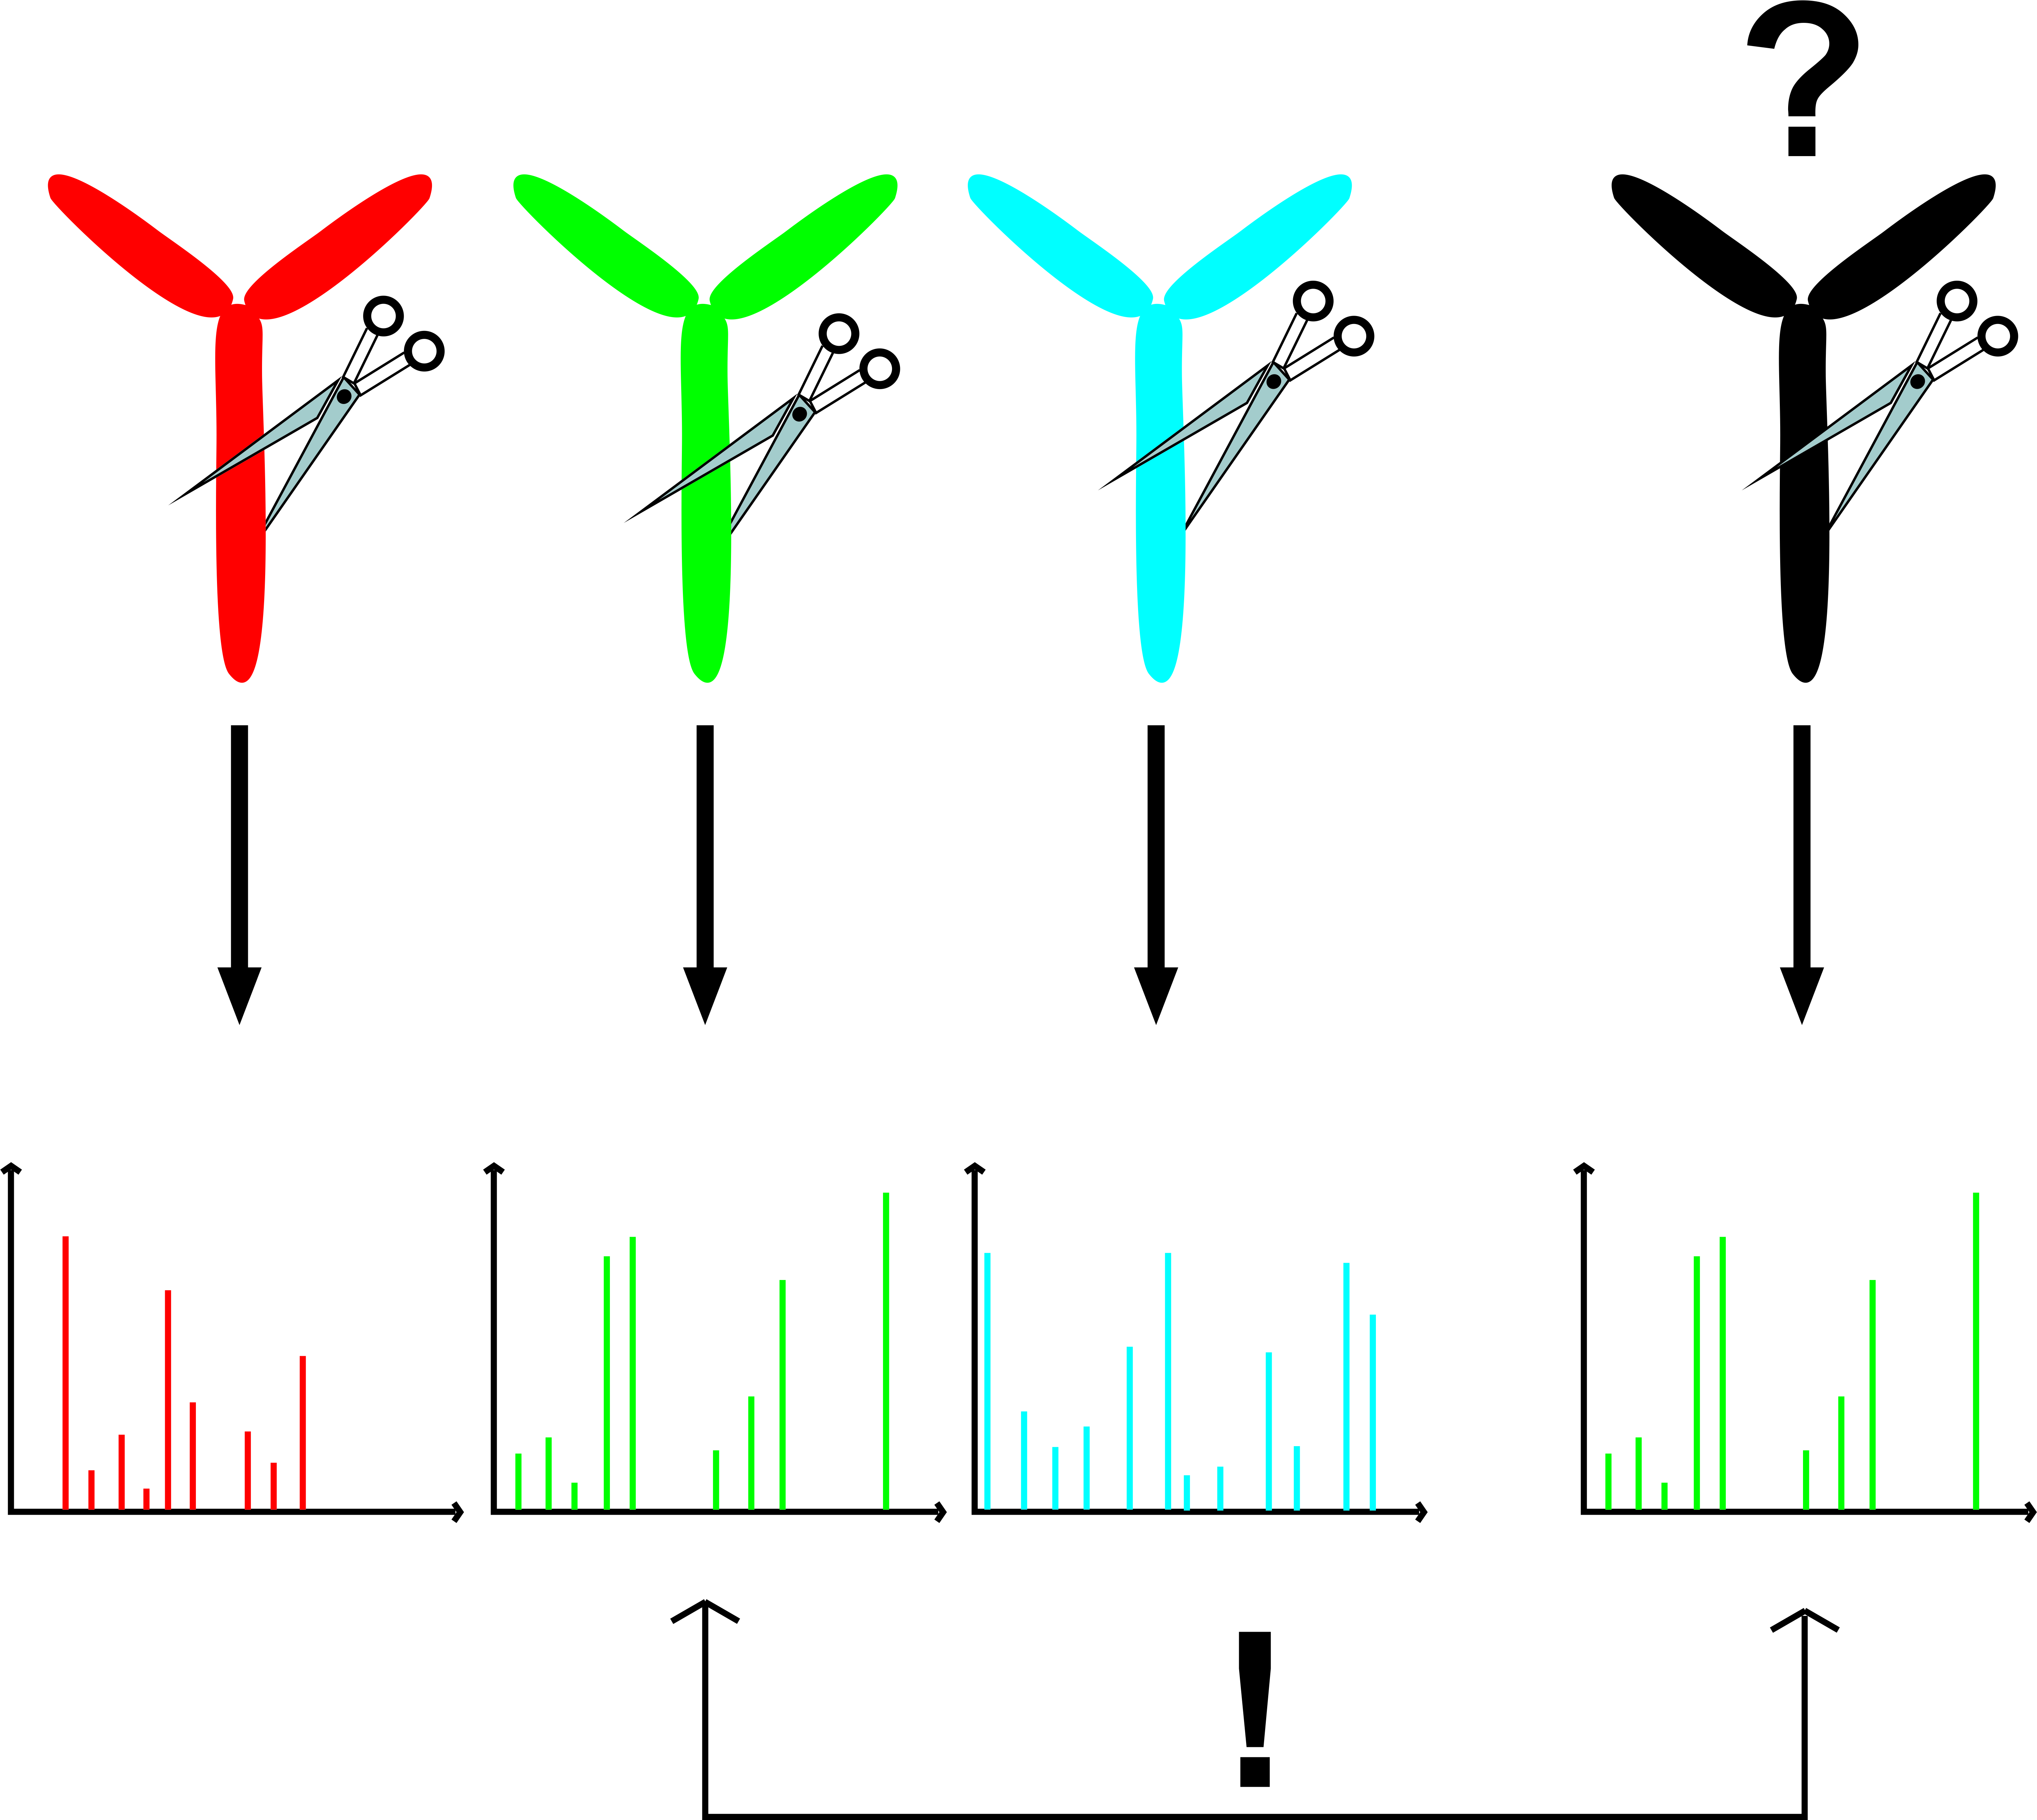
1. Introduction
2. Materials and Methods
2.1. Clean-Up and Enrichment of IgG
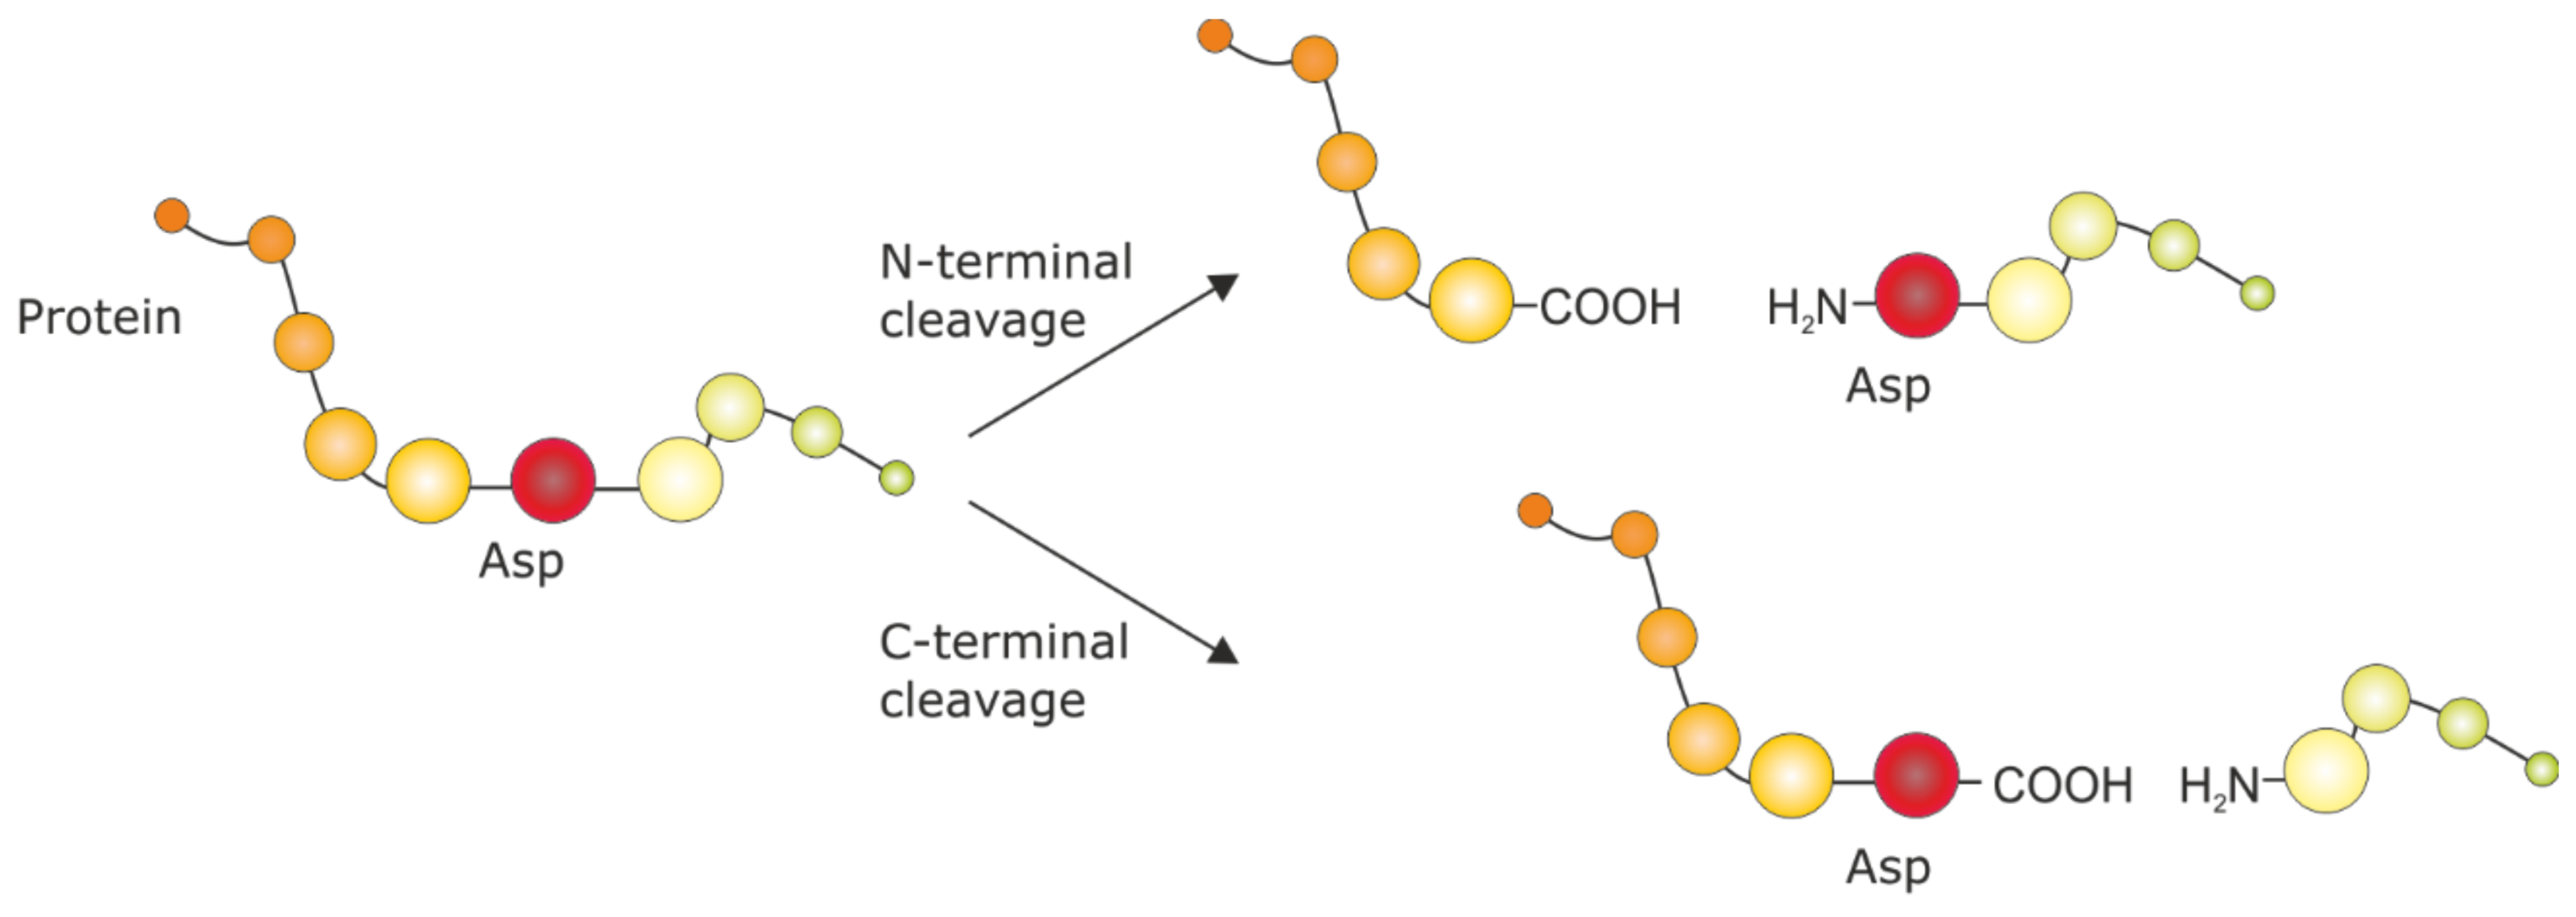
2.2. Protein Cleavage
2.3. Microscale Solid-Phase Extraction
2.4. MALDI-TOF-MS Calibration
2.5. General Protocol
3. Results
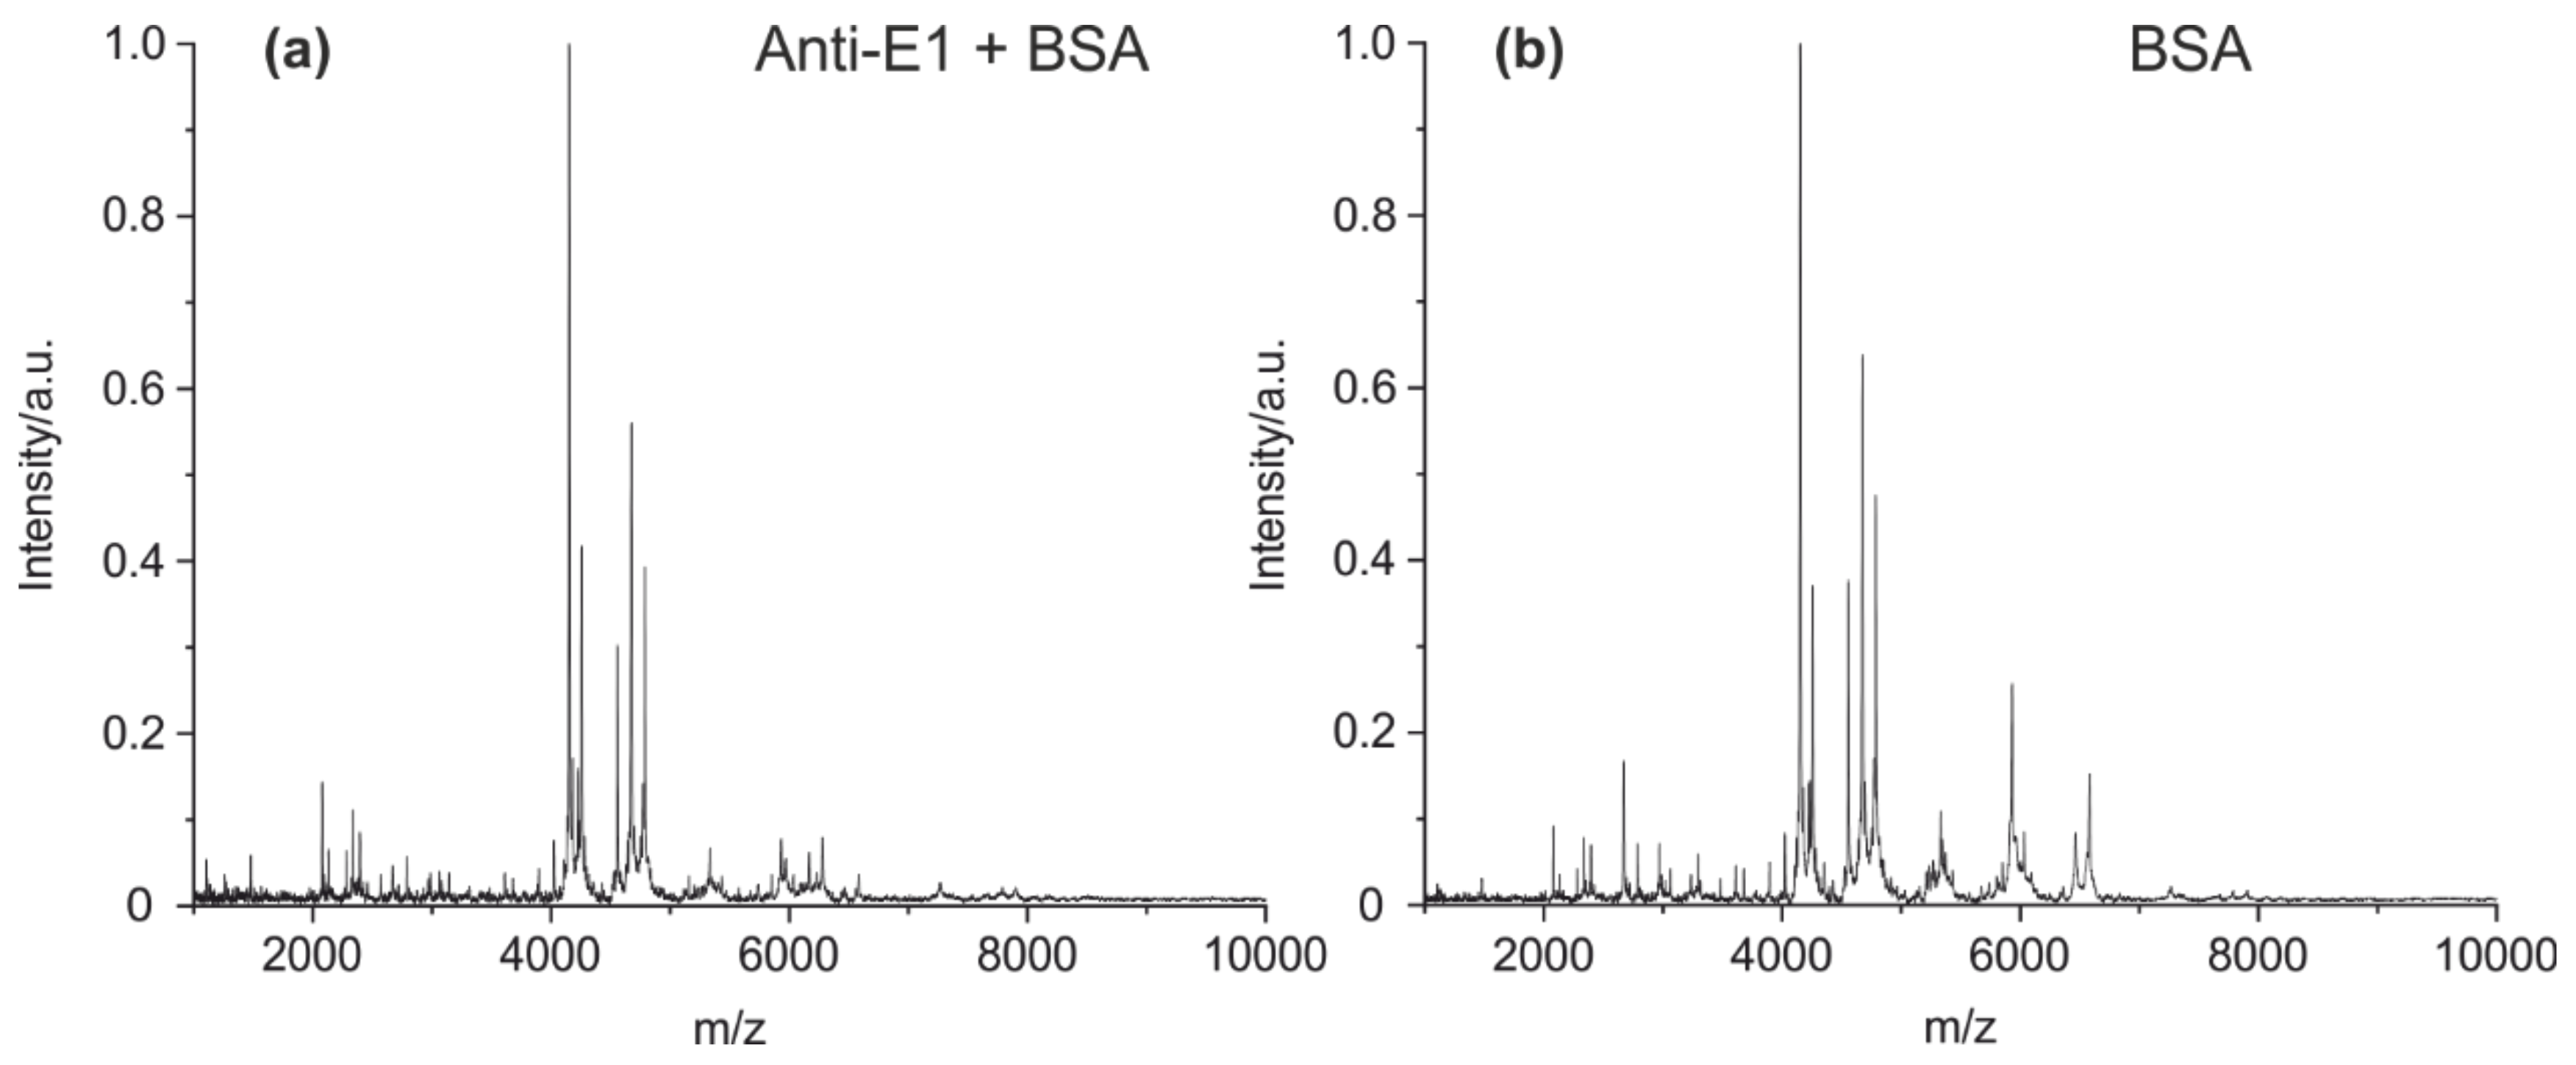
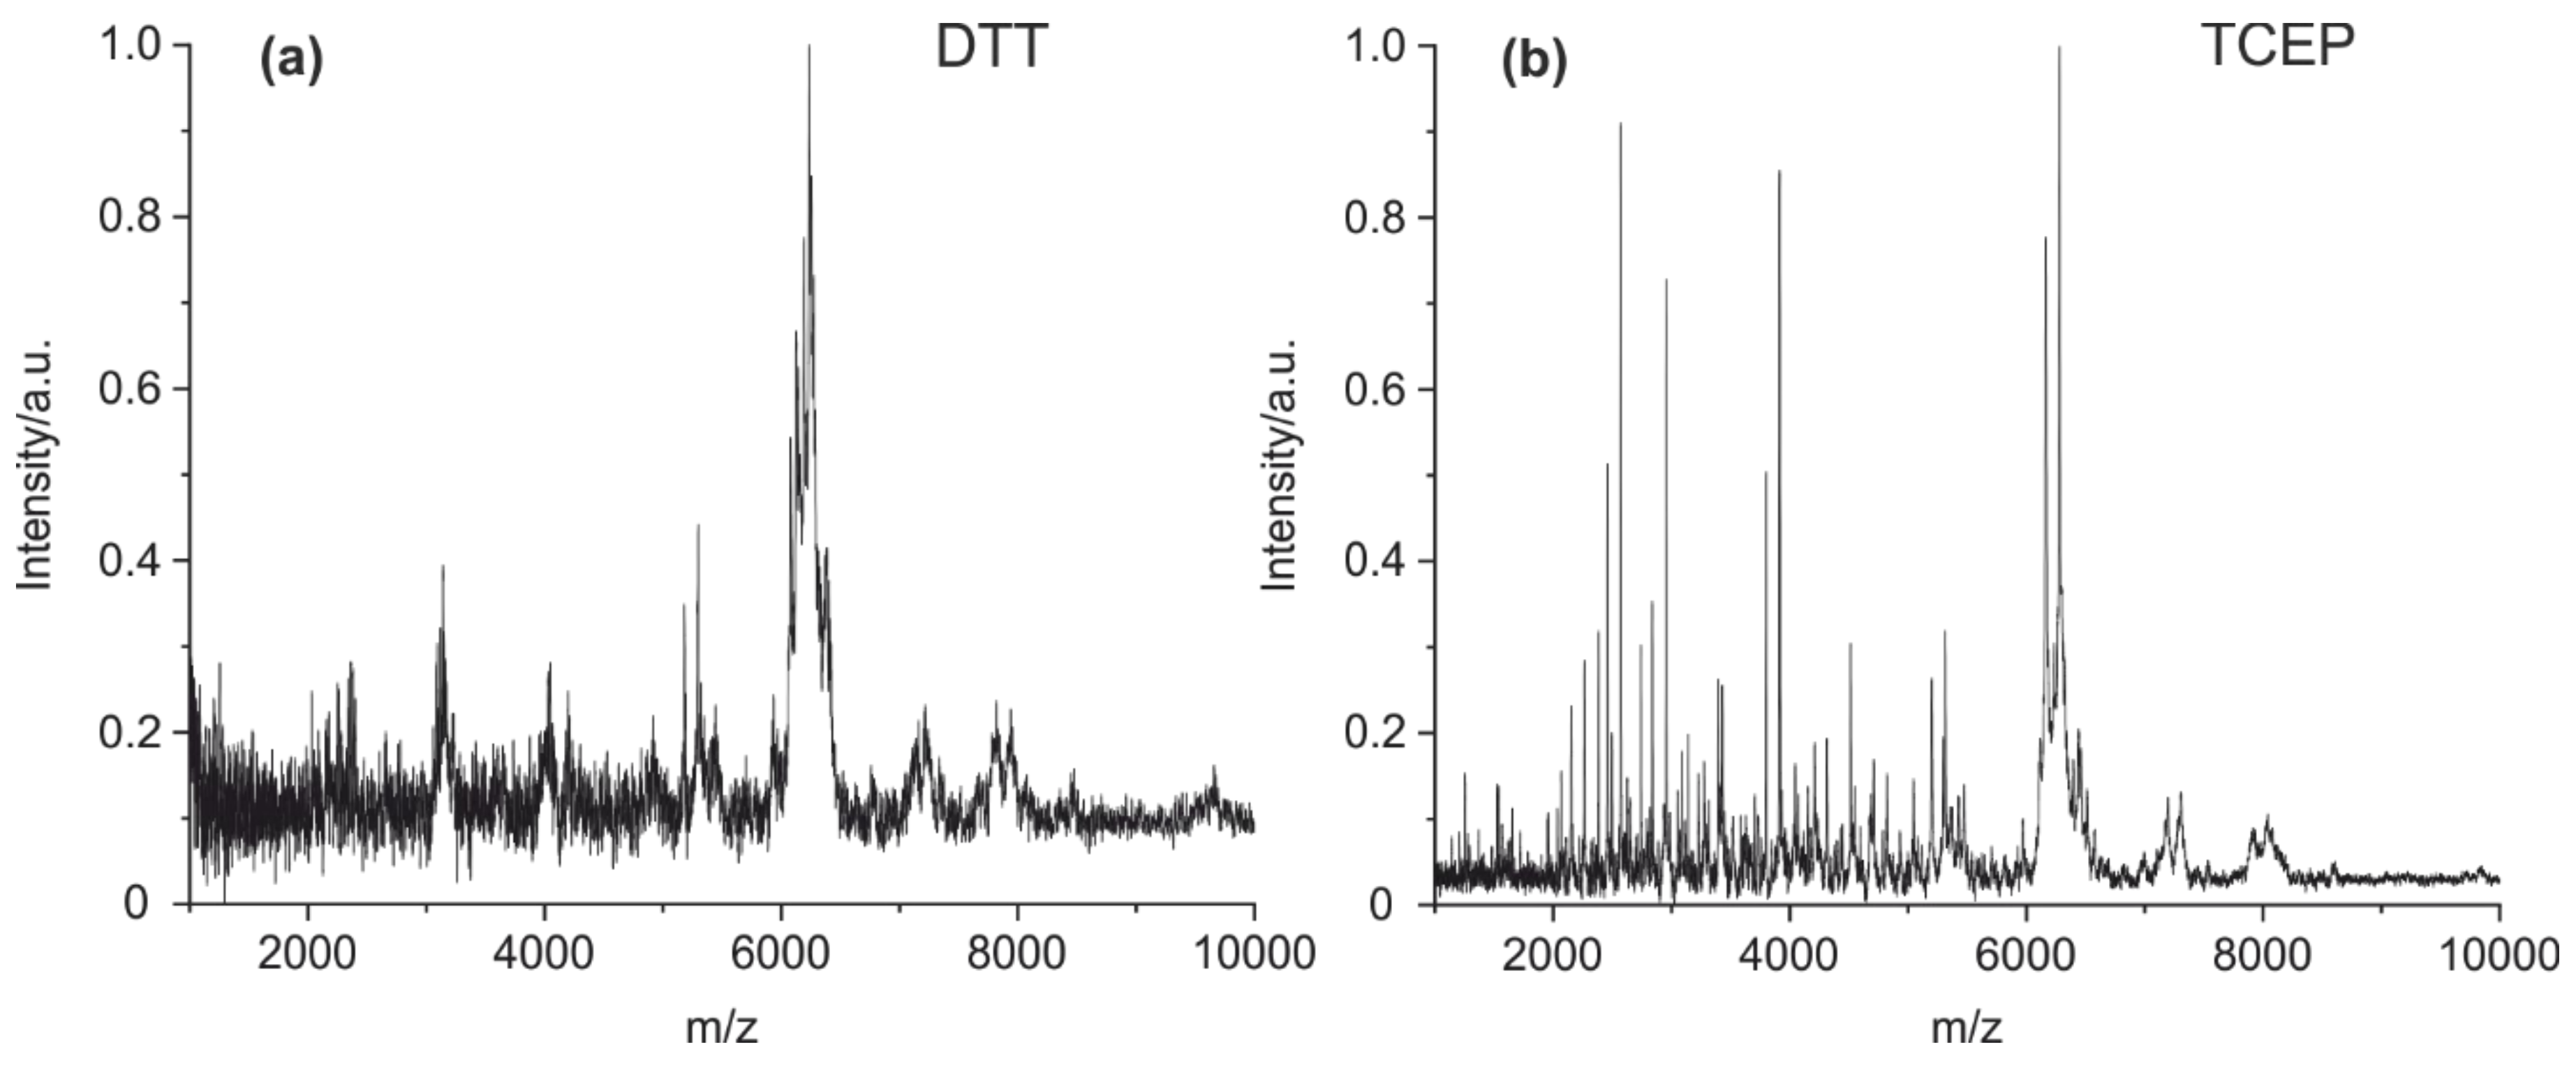
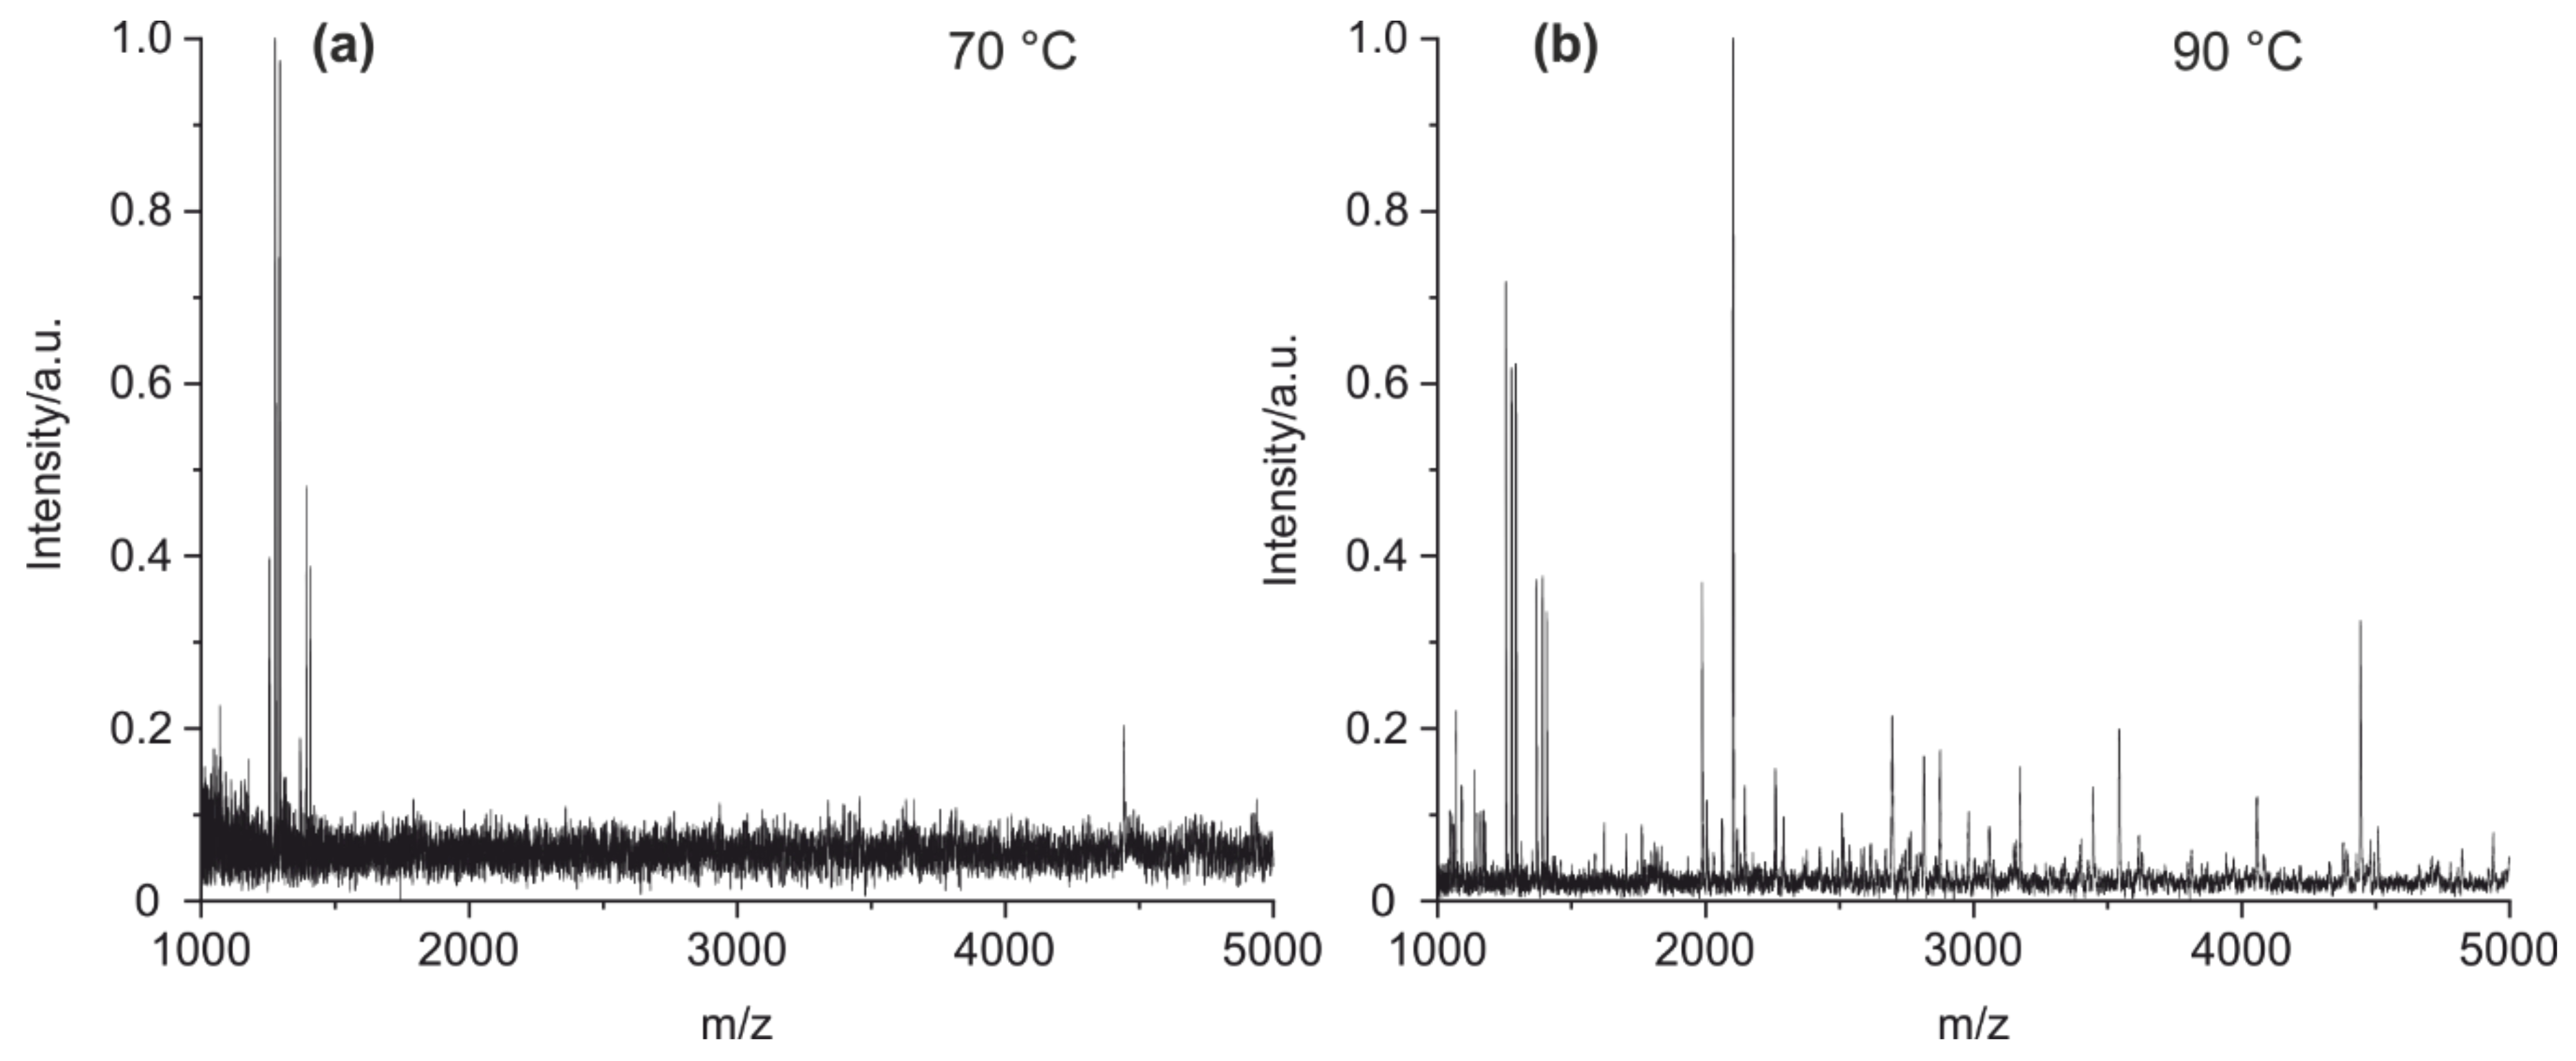
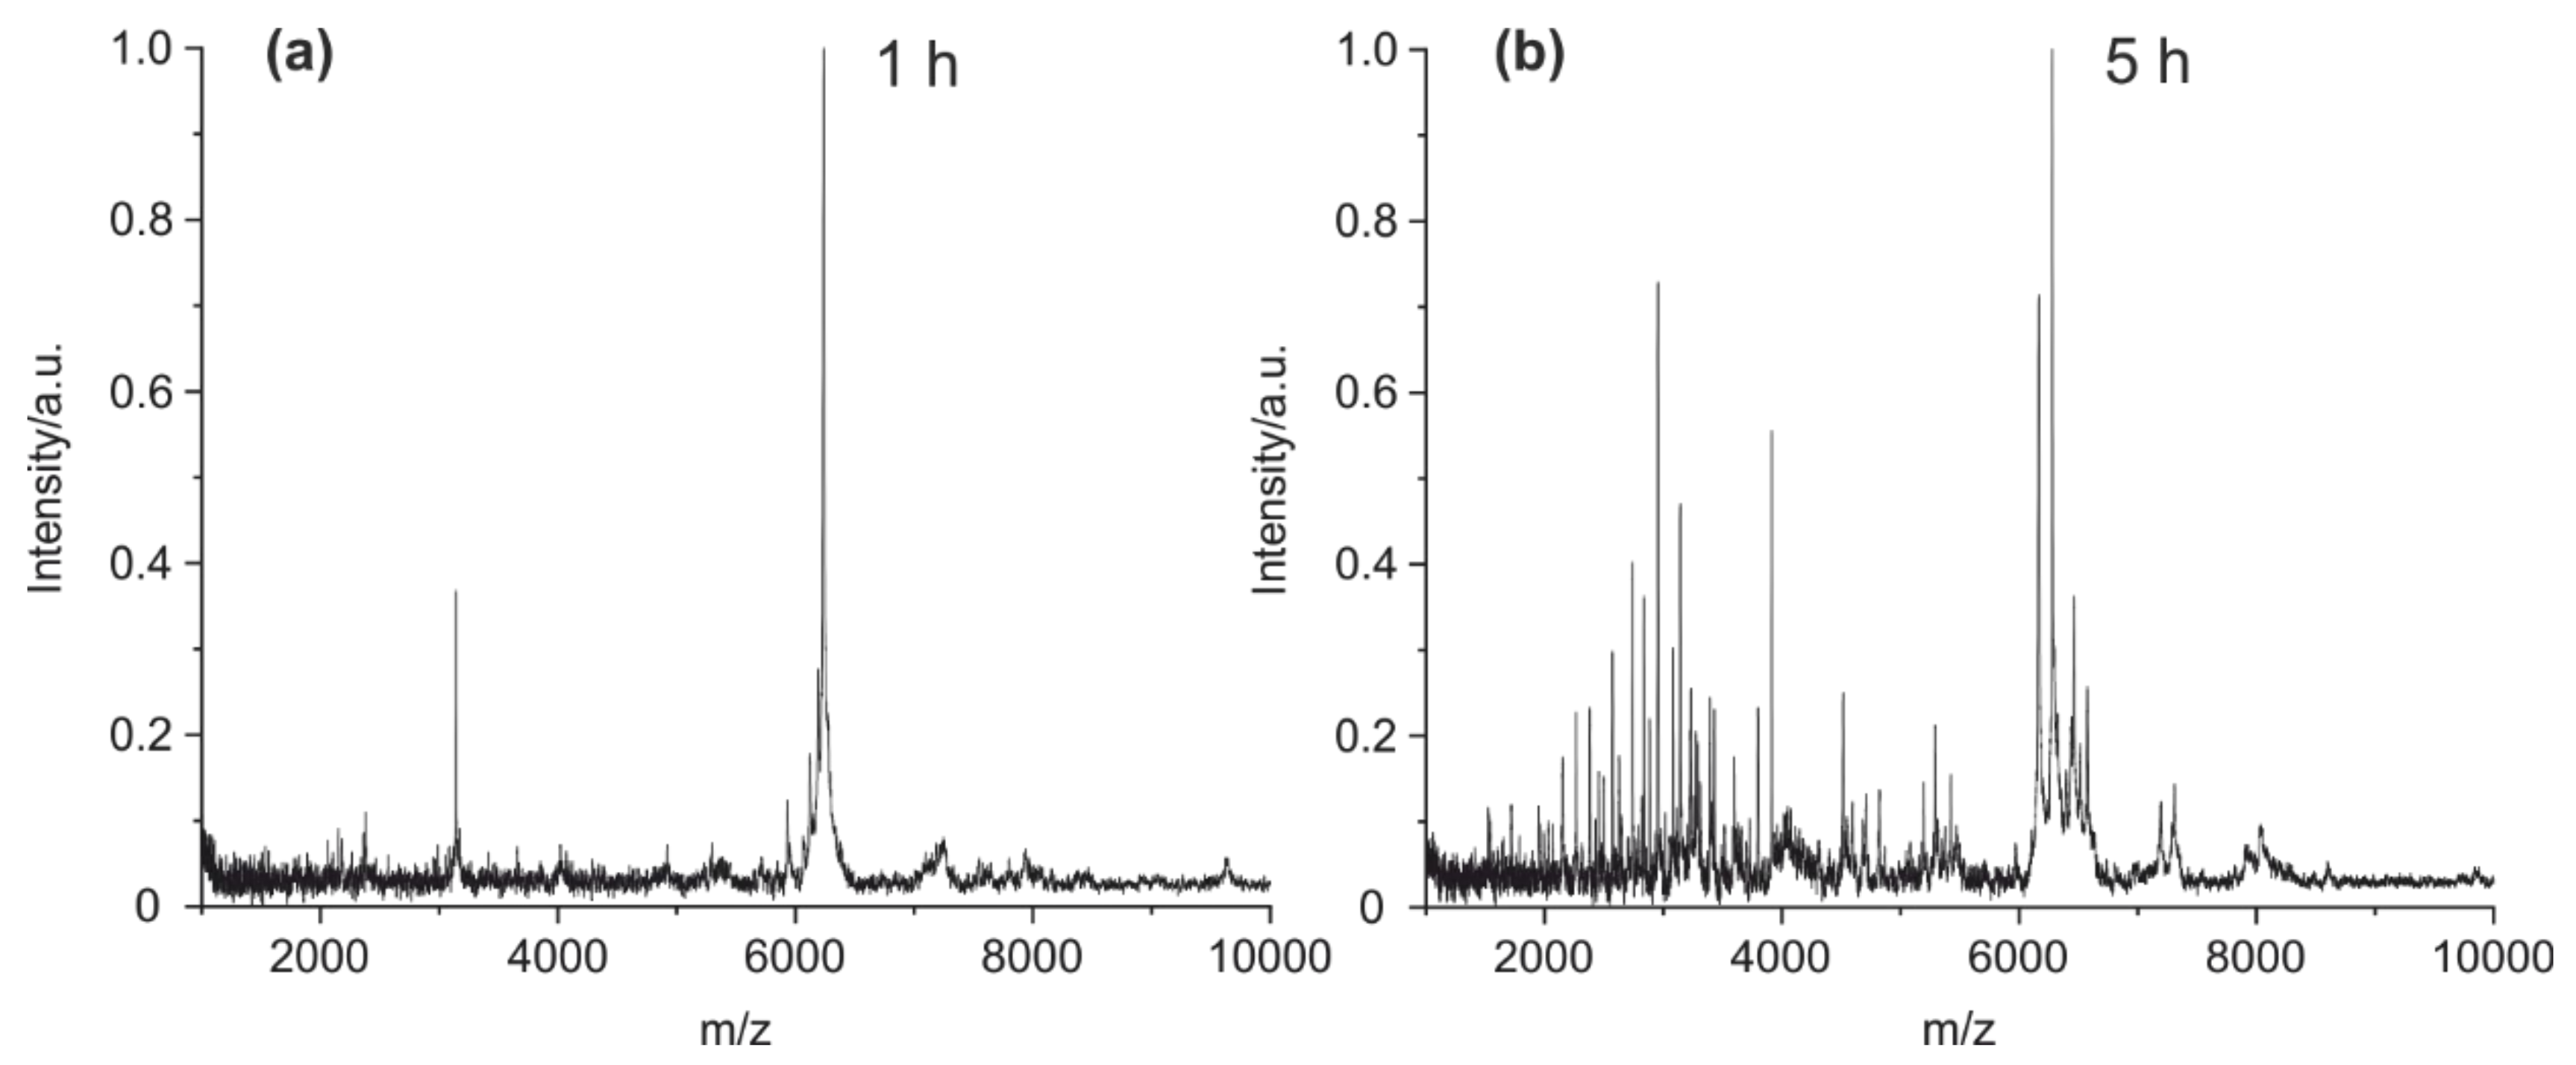
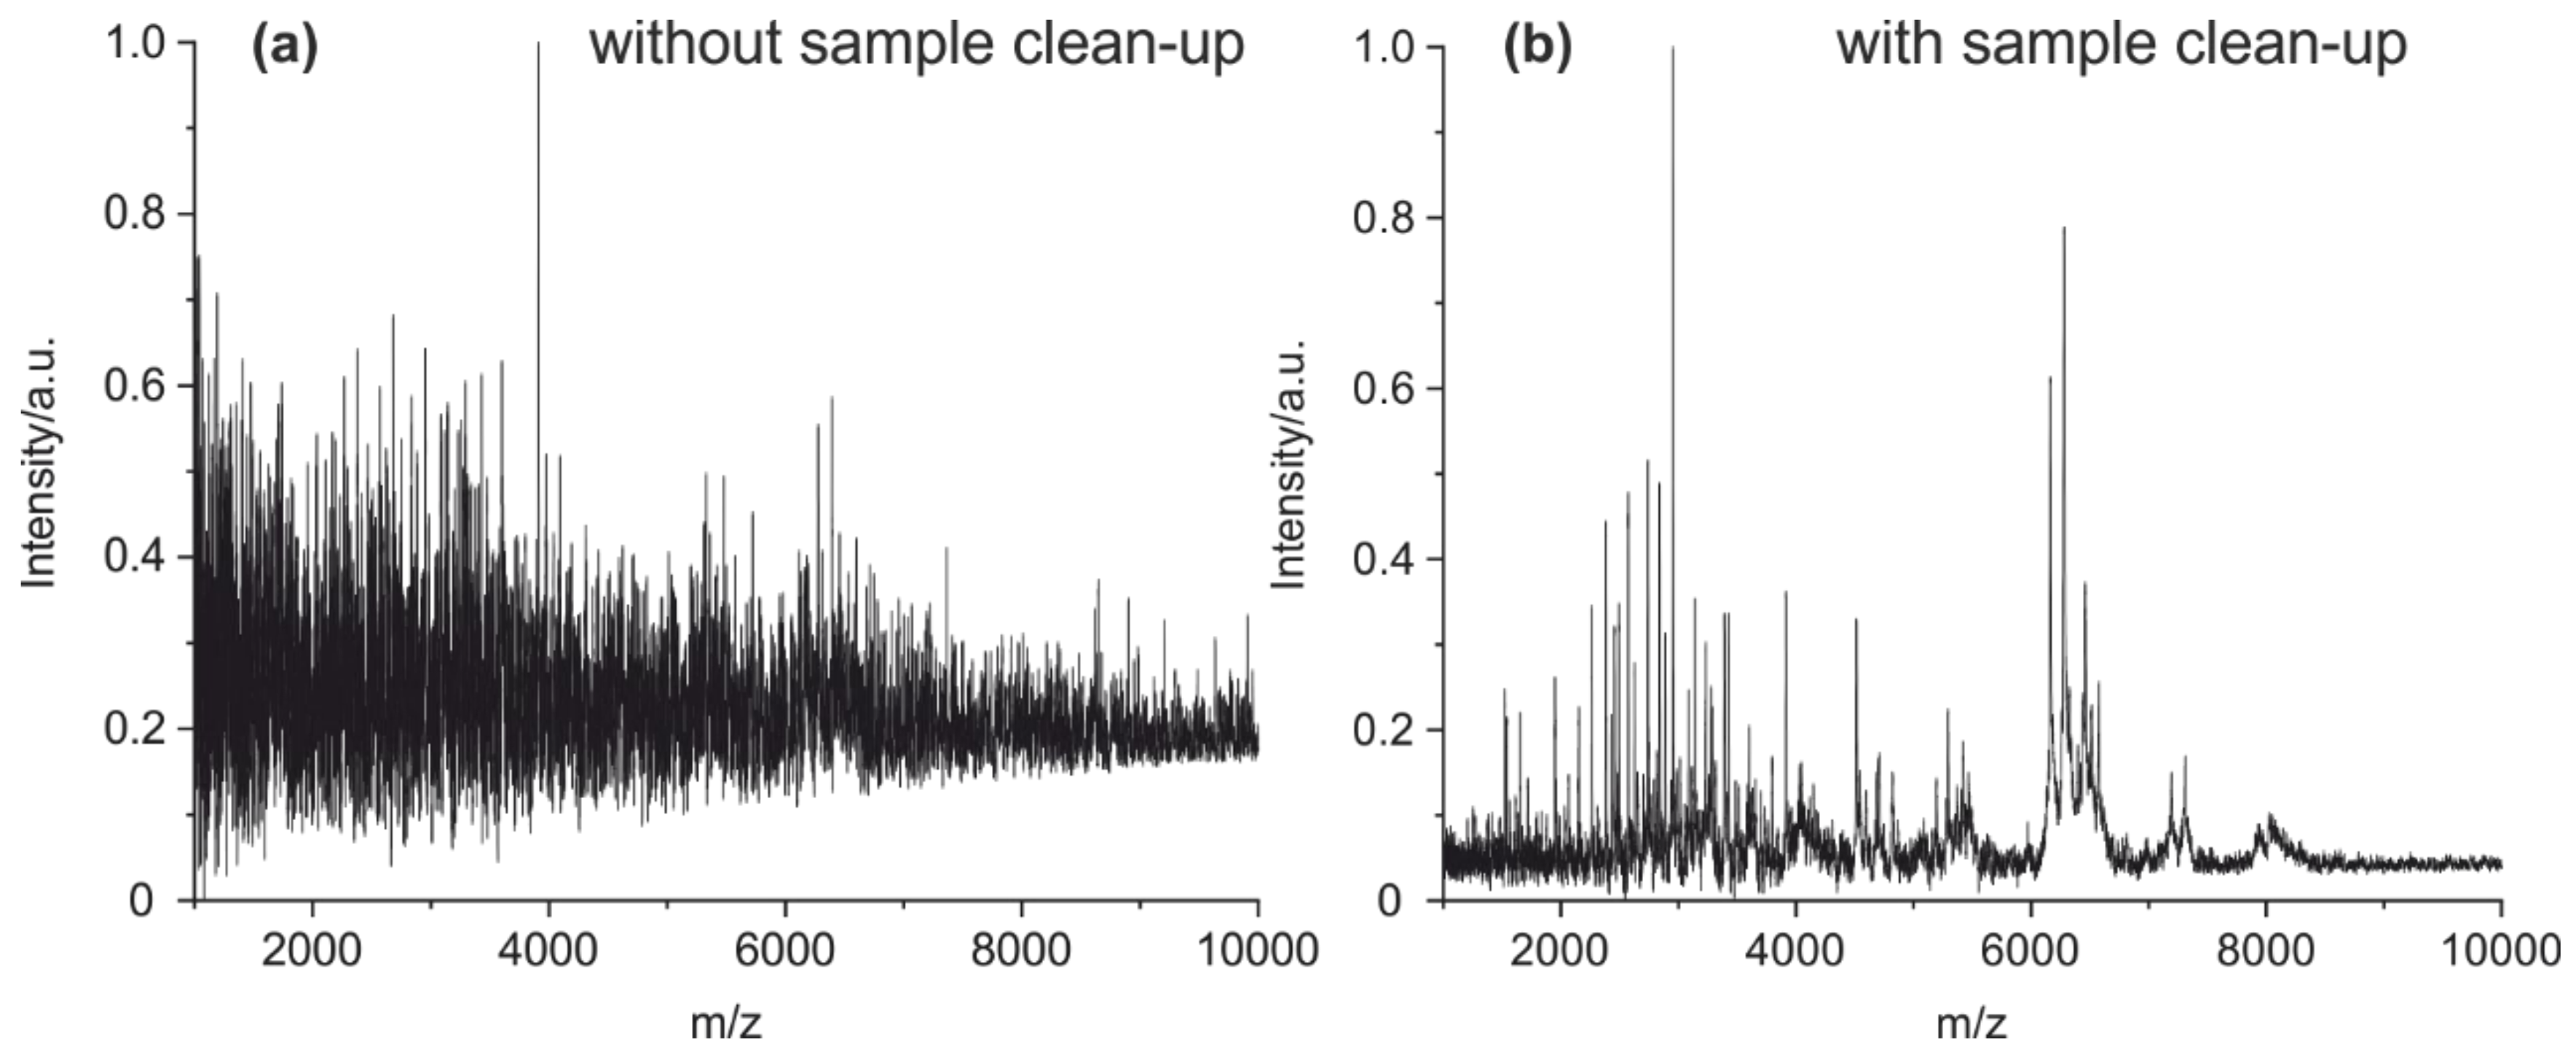
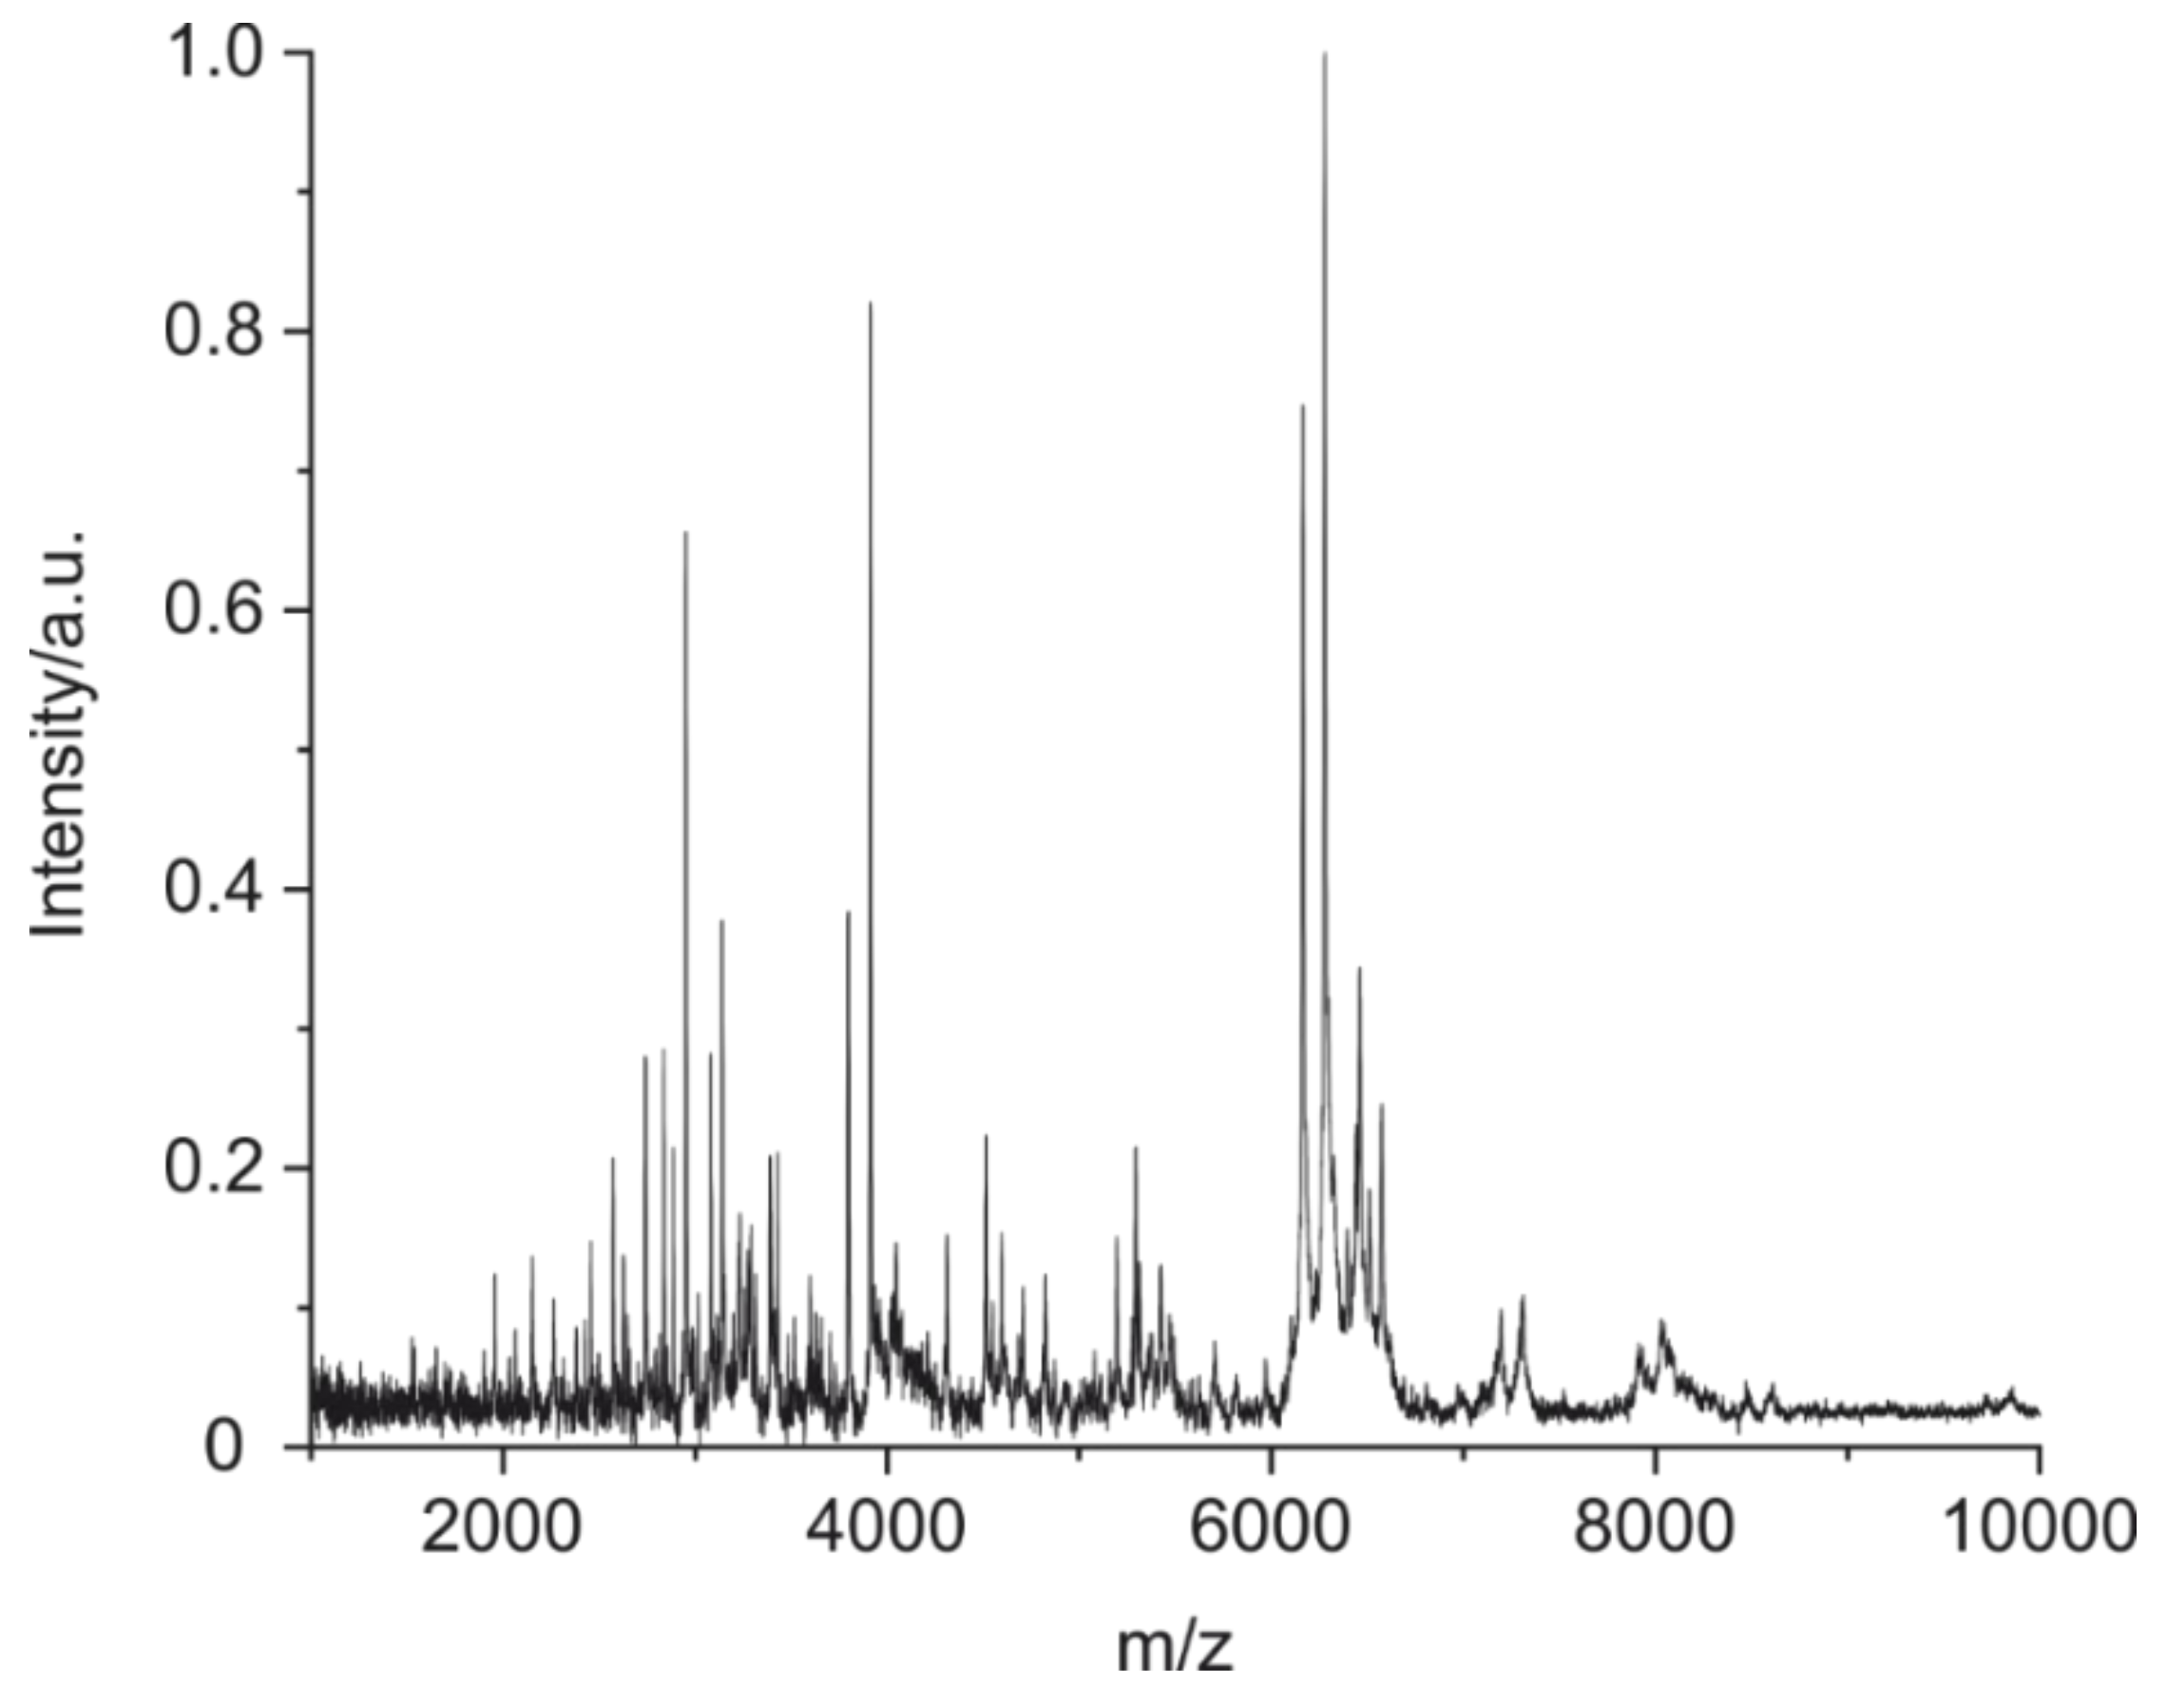
3.1. Optimized Method Parameters
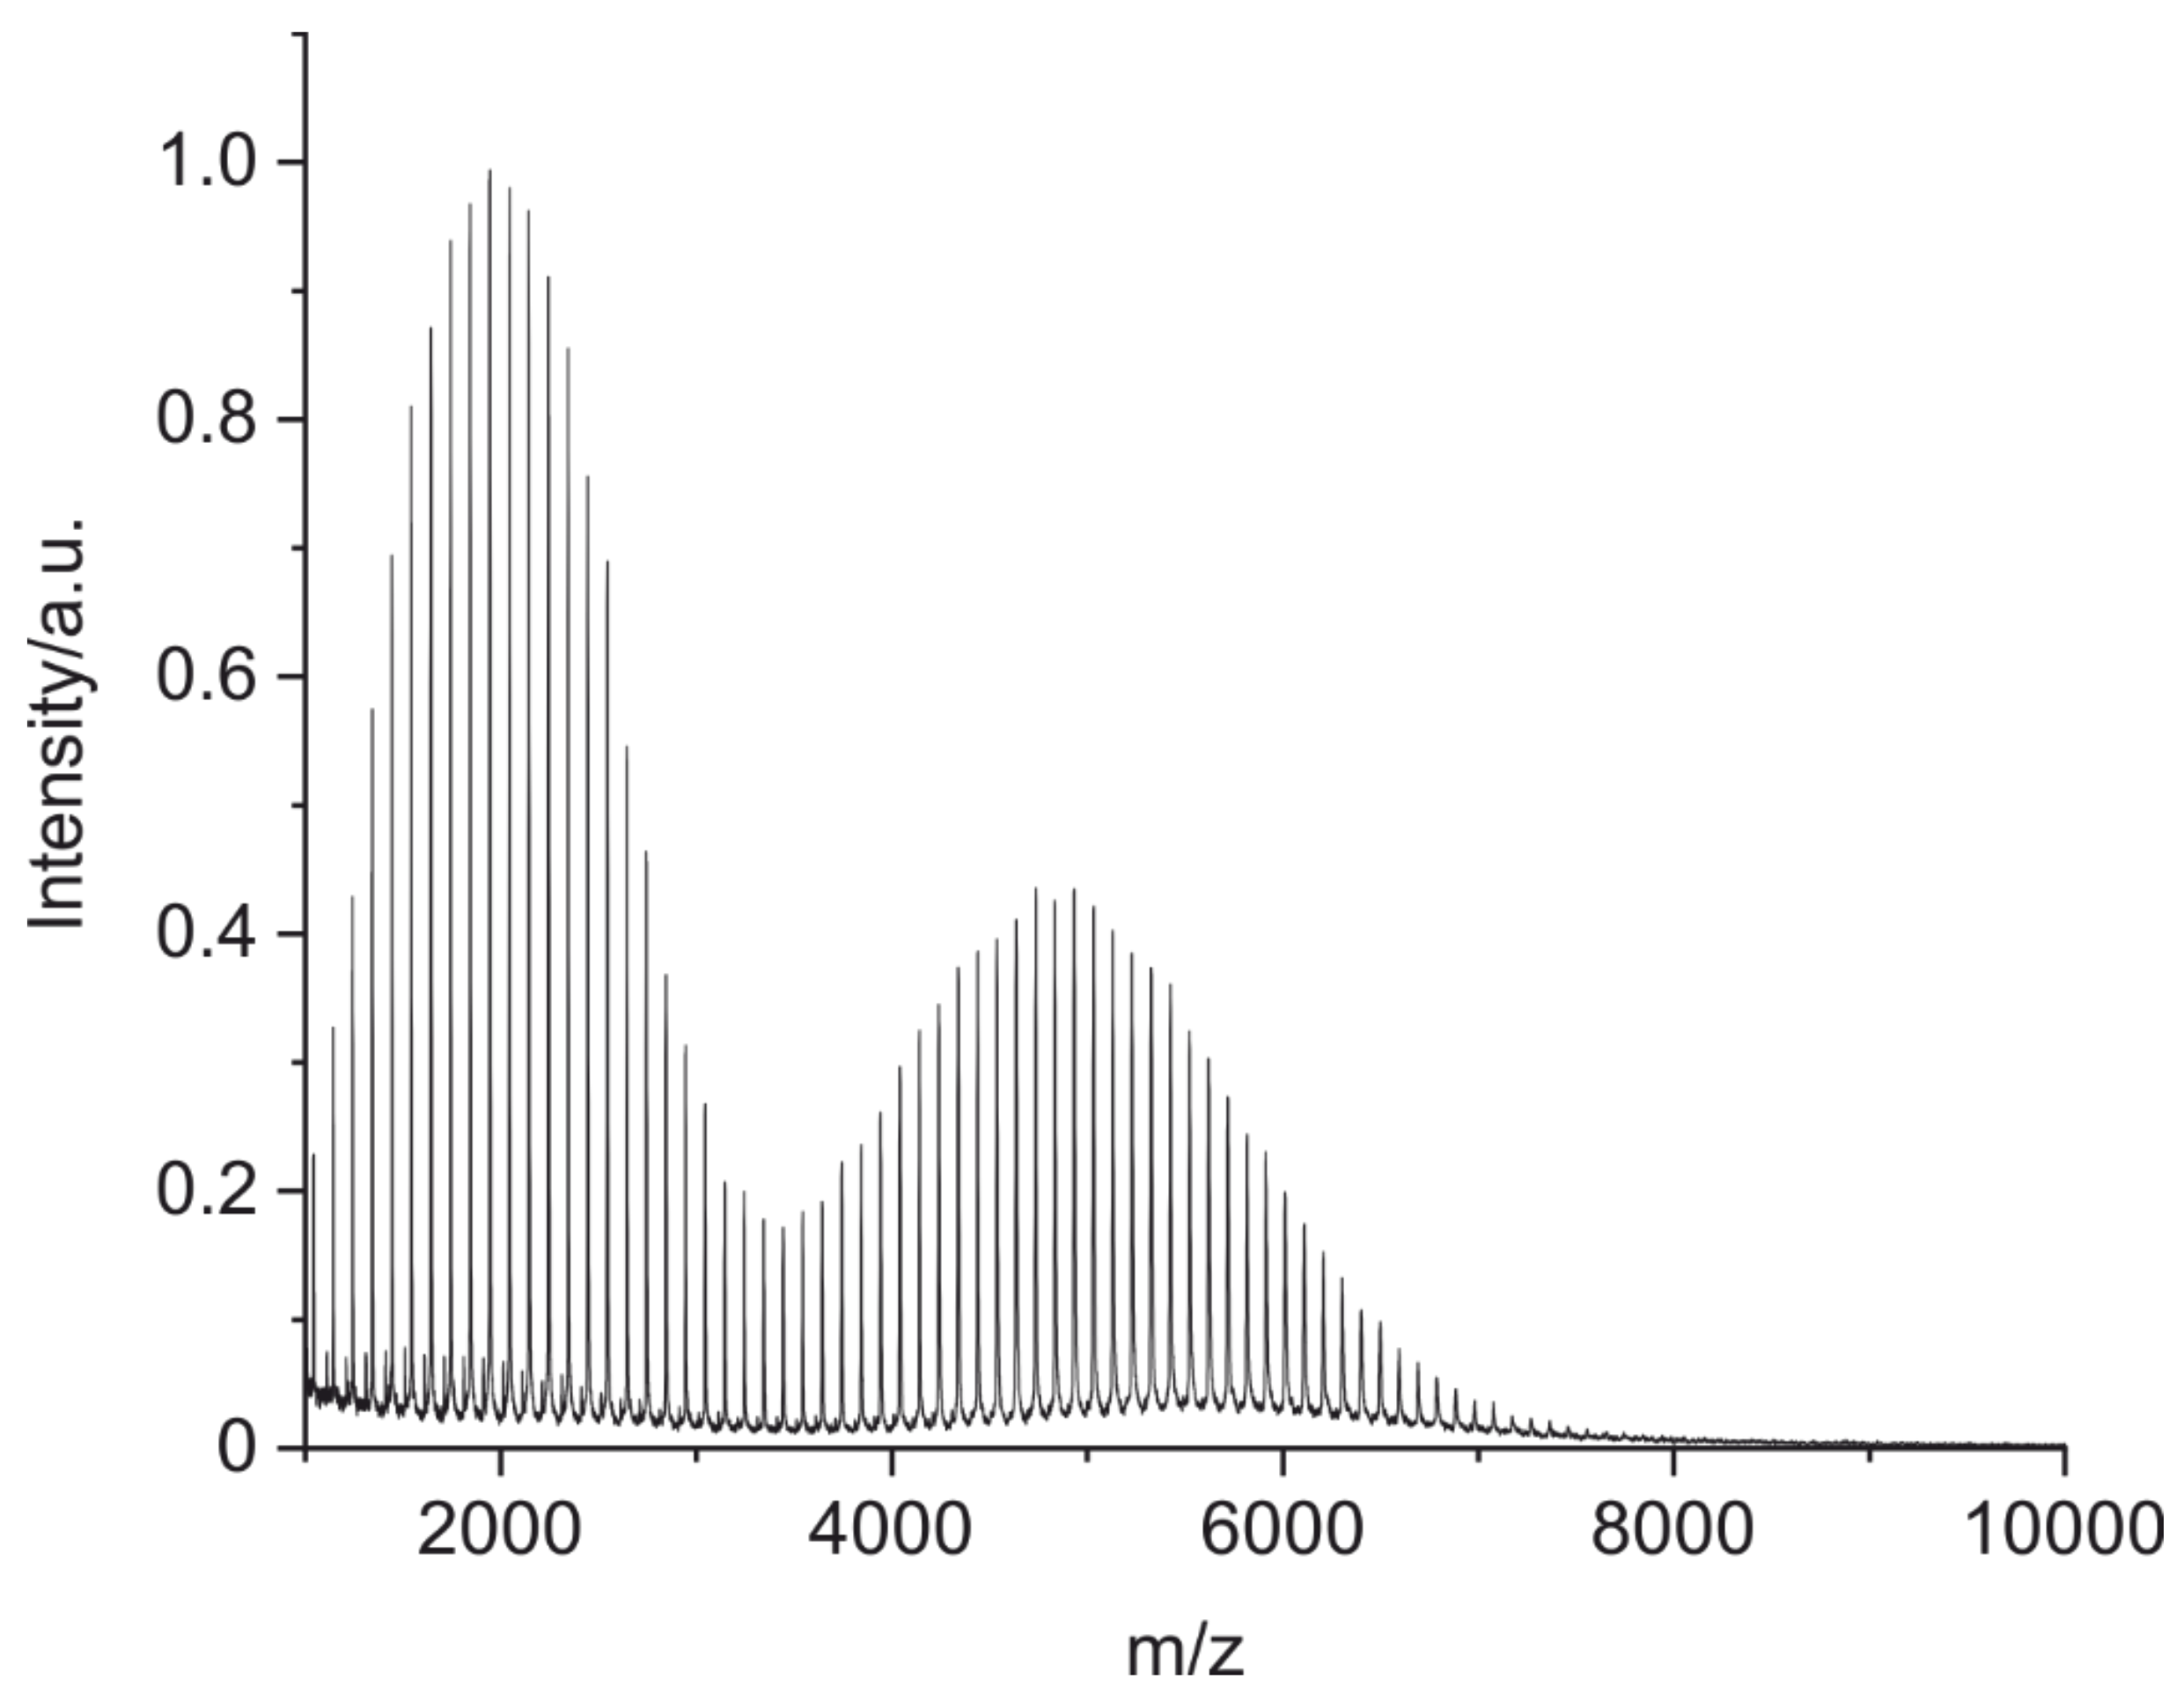
3.2. Fingerprints of Known Monoclonal Antibodies (IgG1 and IgG2)
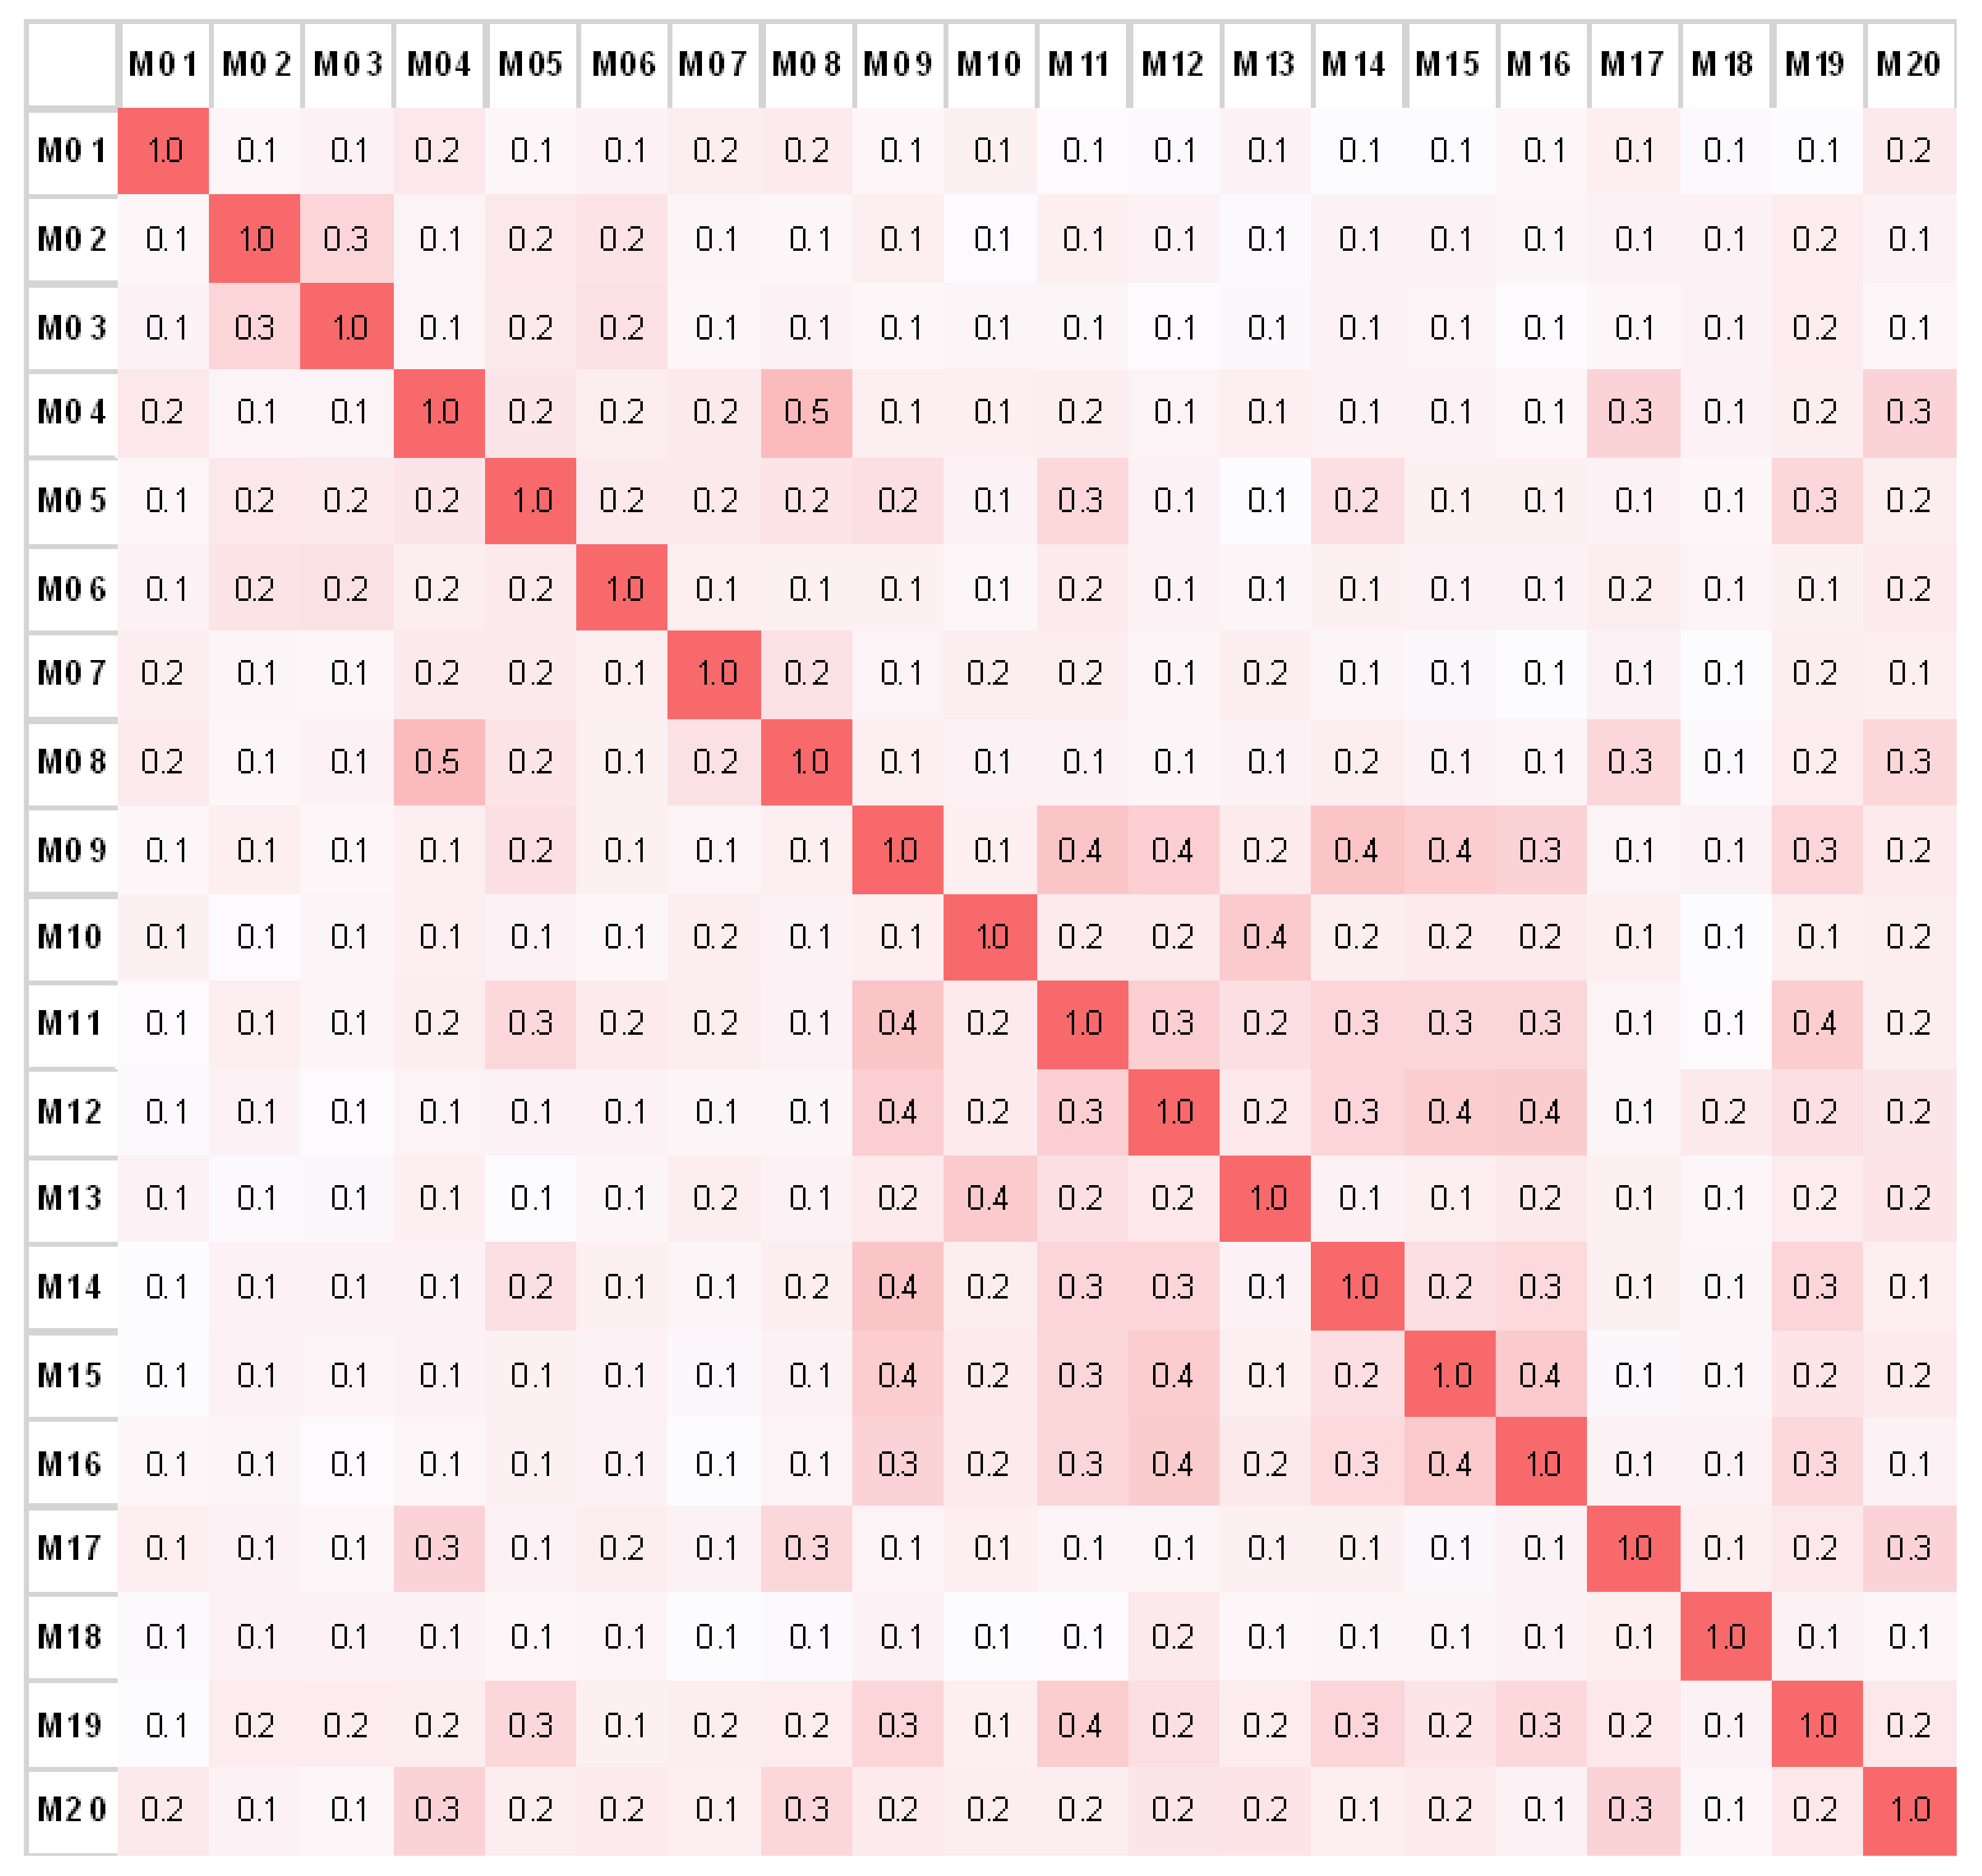
3.3. Validation with a Set of 89 Clones
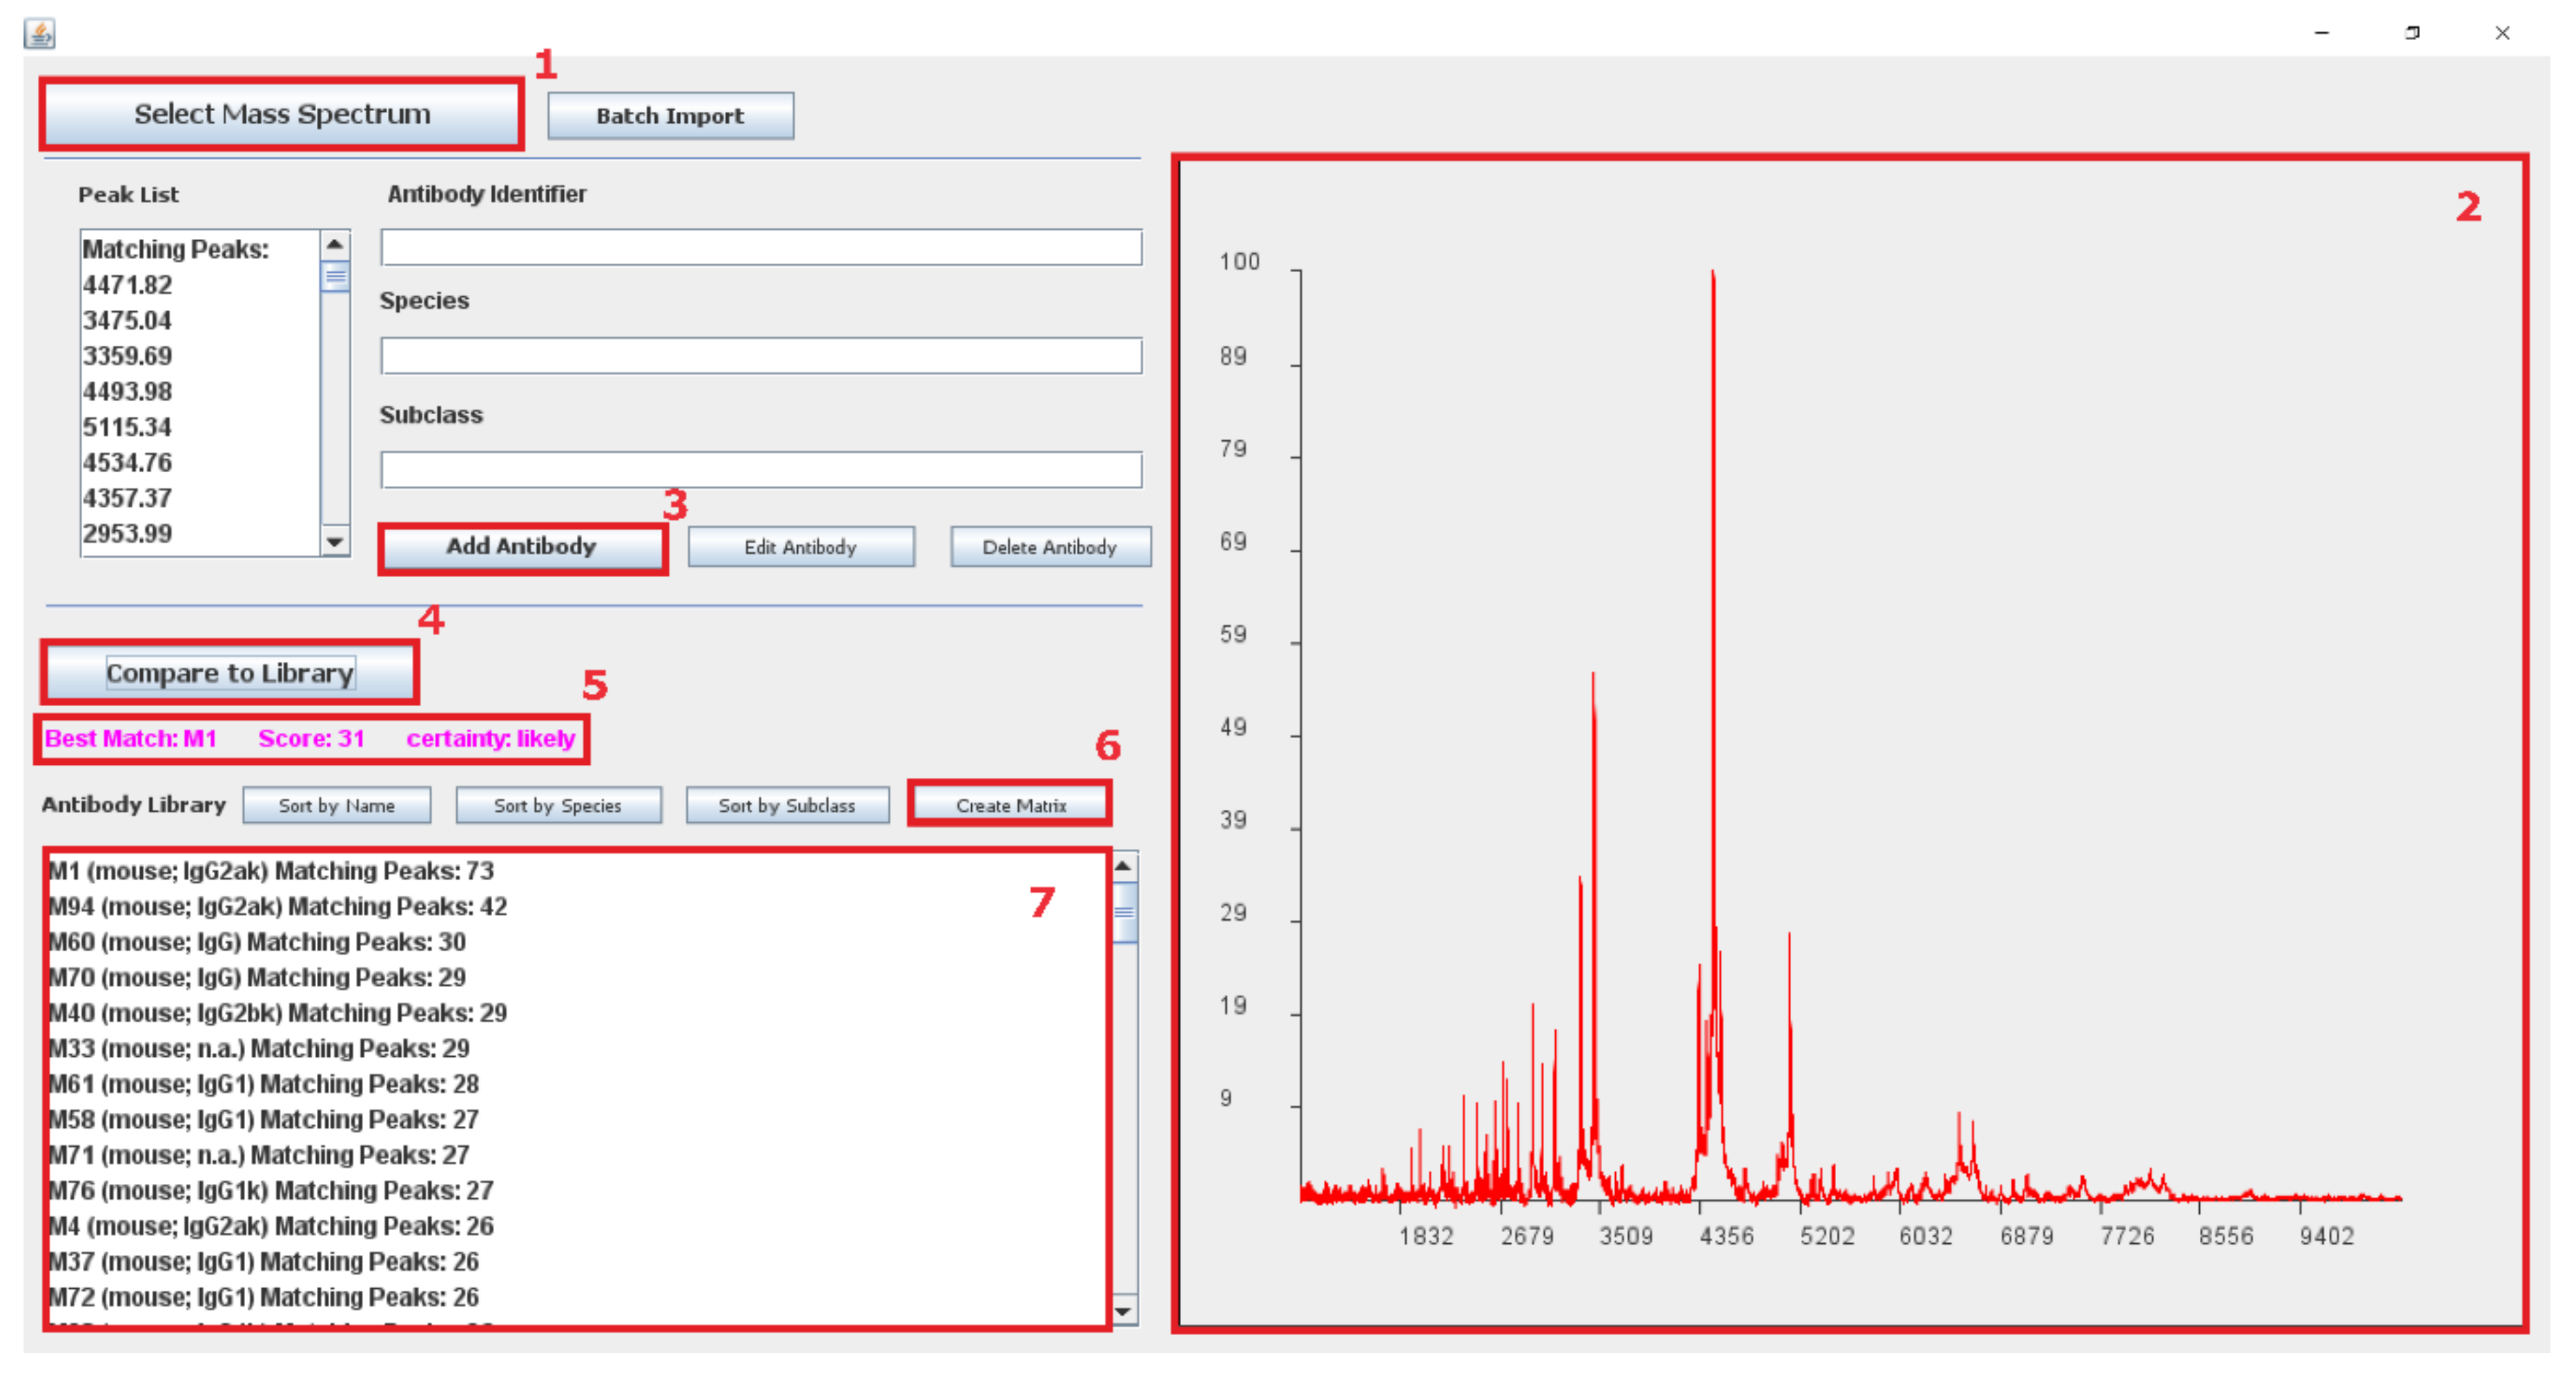
3.3.1. Software
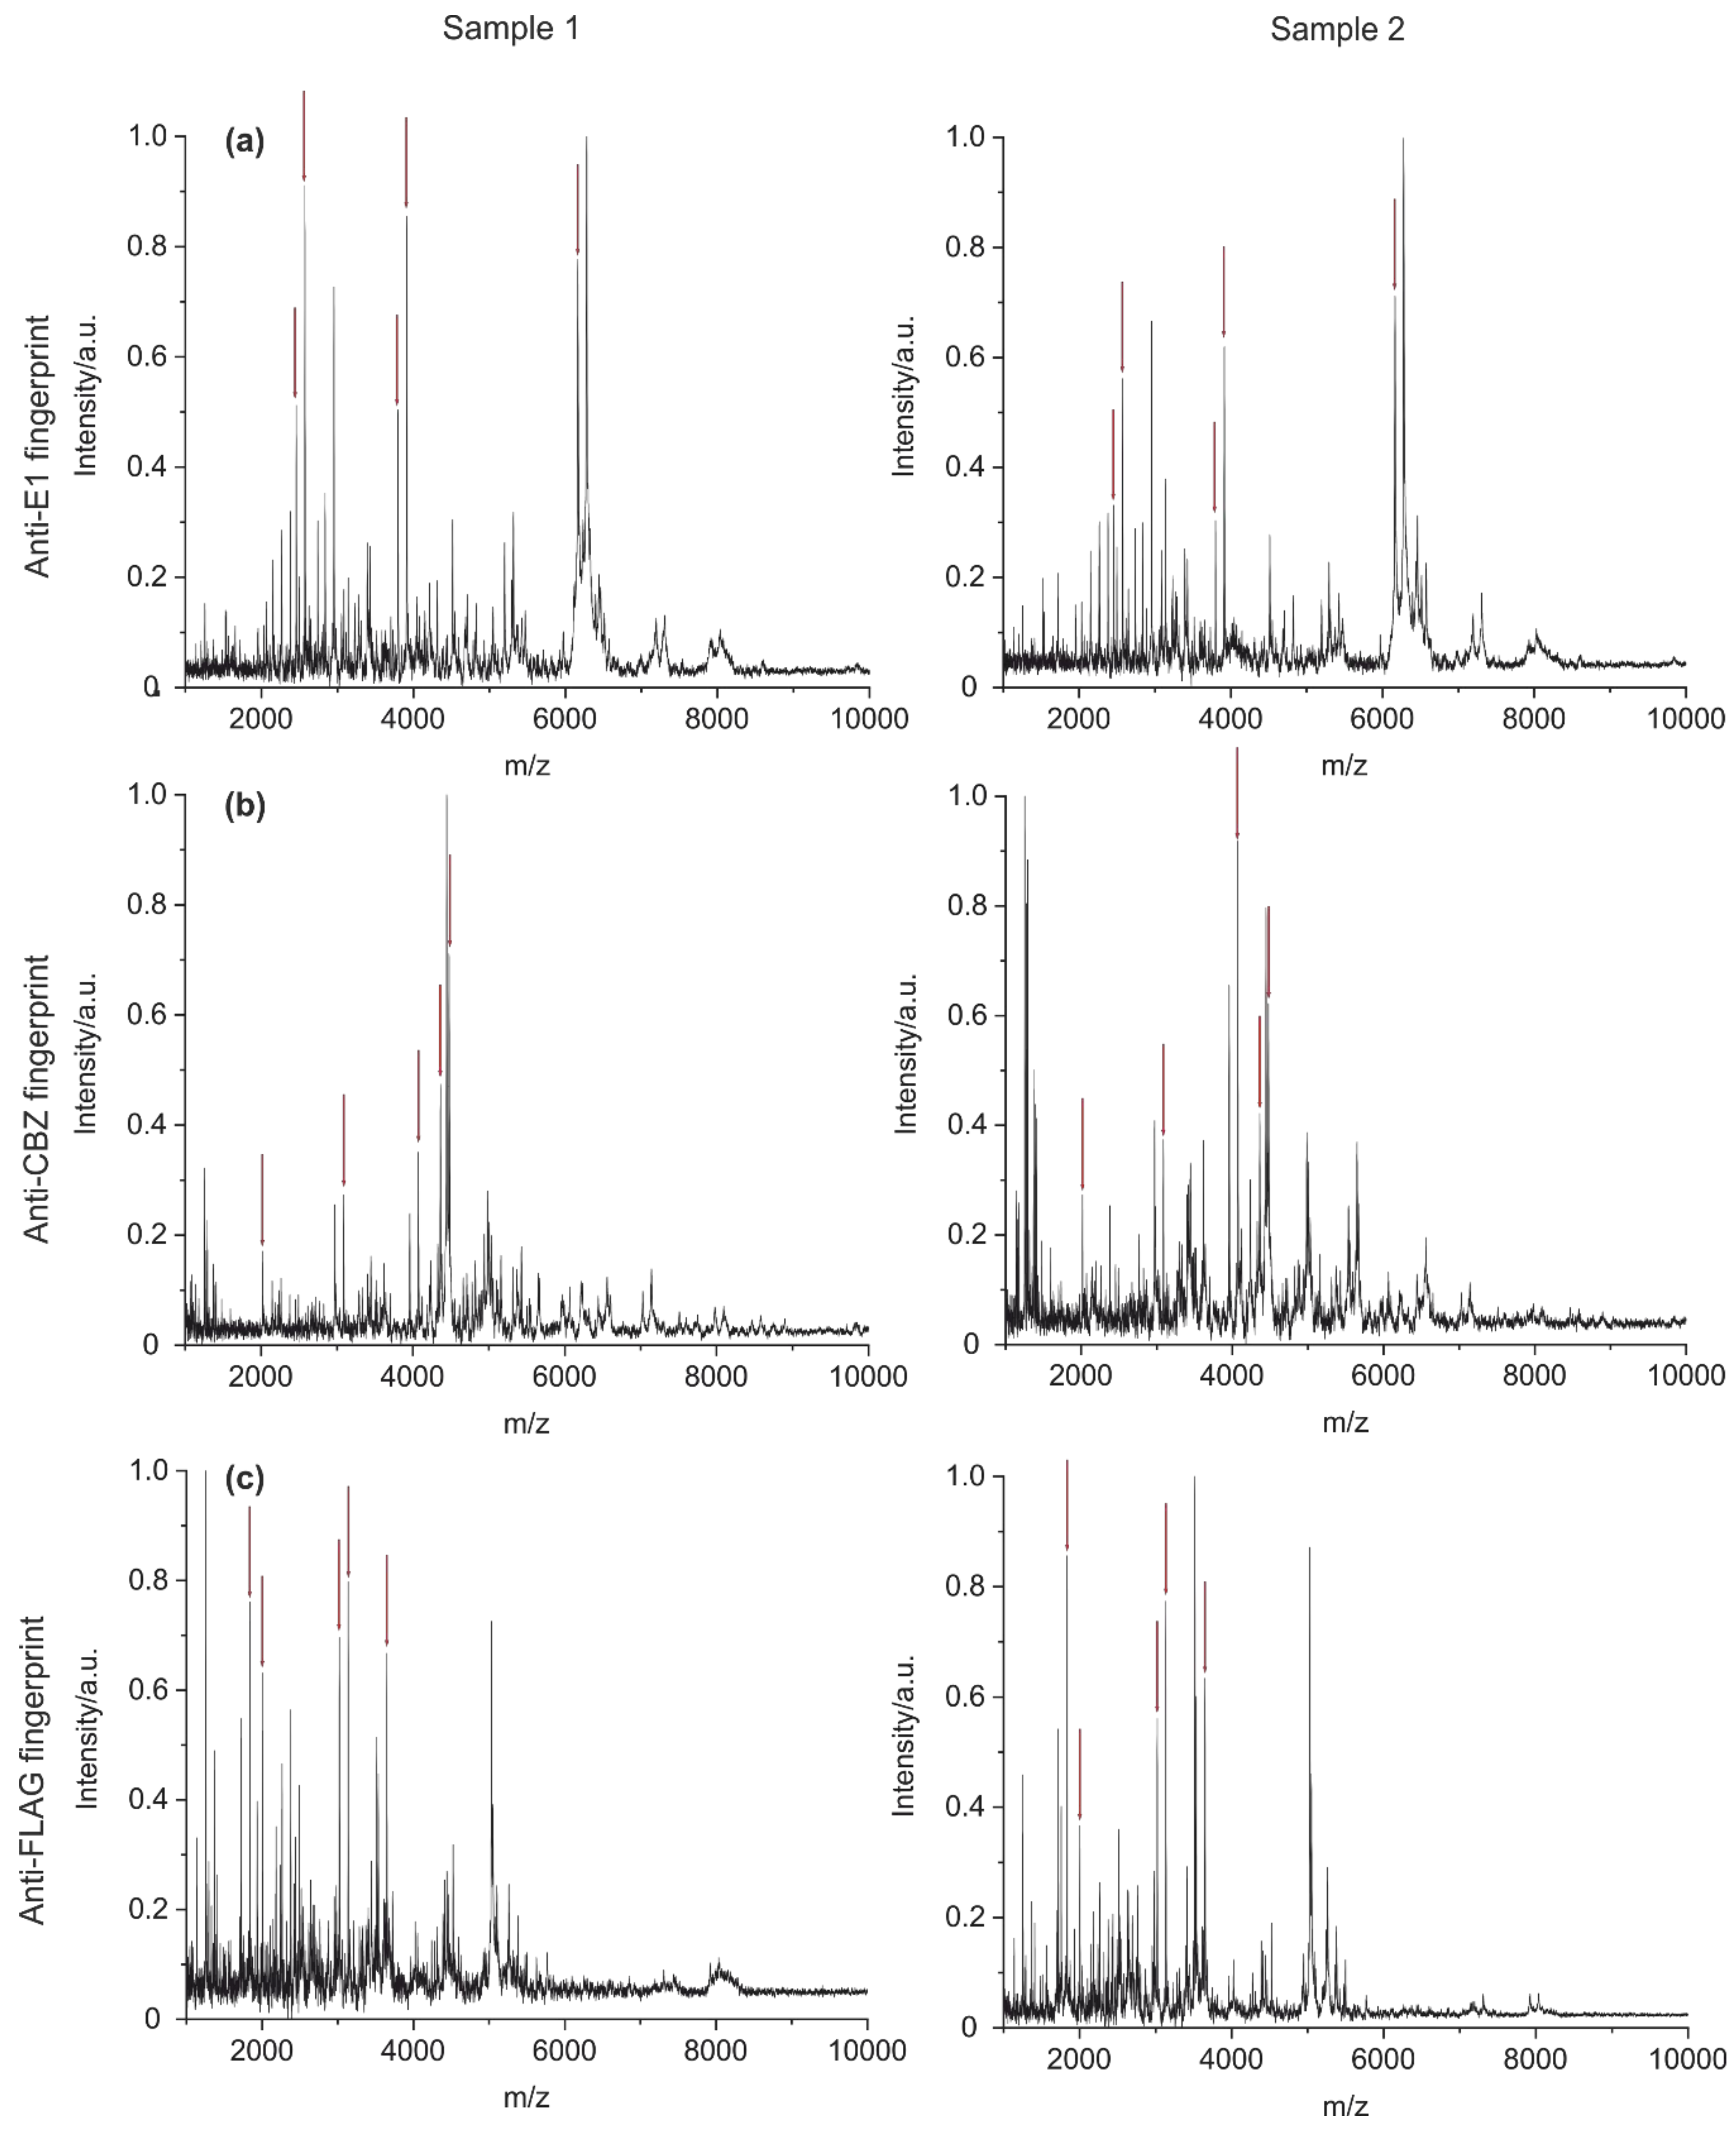
3.3.2. The Specificity of Antibody Fingerprints
3.3.3. Blinded Random Sampling
4. Discussion
4.1. Method Optimization
4.2. Validation of Antibody Identification
4.3. Advantages/Applications
4.4. Limitations
5. Conclusions
Supplementary Materials
Author Contributions
Funding
Acknowledgments
Conflicts of Interest
References
- Macleod, M.R.; Michie, S.; Roberts, I.; Dirnagl, U.; Chalmers, I.; Ioannidis, J.P.; Al-Shahi Salman, R.; Chan, A.W.; Glasziou, P. Biomedical research: Increasing value, reducing waste. Lancet 2014, 383, 101–104. [Google Scholar] [CrossRef]
- Baker, M. Reproducibility crisis: Blame it on the antibodies. Nature 2015, 521, 274–276. [Google Scholar] [CrossRef]
- Weller, M.G. Quality Issues of Research Antibodies. Anal. Chem. Insights 2016, 11, 21–27. [Google Scholar] [CrossRef]
- Freedman, L.P.; Cockburn, I.M.; Simcoe, T.S. The Economics of Reproducibility in Preclinical Research. PLoS Biol. 2015, 13, e1002165. [Google Scholar] [CrossRef]
- The PLoS Biology Staff. Correction: The Economics of Reproducibility in Preclinical Research. PLoS Biol. 2018, 16, e1002626. [Google Scholar] [CrossRef]
- Uhlen, M.; Bandrowski, A.; Carr, S.; Edwards, A.; Ellenberg, J.; Lundberg, E.; Rimm, D.L.; Rodriguez, H.; Hiltke, T.; Snyder, M.; et al. A proposal for validation of antibodies. Nat. Methods 2016, 13, 823–827. [Google Scholar] [CrossRef] [PubMed]
- Weller, M.G. Ten Basic Rules of Antibody Validation. Anal. Chem. Insights 2018, 13, 1177390118757462. [Google Scholar] [CrossRef] [PubMed]
- Vasilevsky, N.A.; Brush, M.H.; Paddock, H.; Ponting, L.; Tripathy, S.J.; Larocca, G.M.; Haendel, M.A. On the reproducibility of science: Unique identification of research resources in the biomedical literature. PeerJ 2013, 1, e148. [Google Scholar] [CrossRef]
- Bandrowski, A.; Brush, M.; Grethe, J.S.; Haendel, M.A.; Kennedy, D.N.; Hill, S.; Hof, P.R.; Martone, M.E.; Pols, M.; Tan, S.; et al. The Resource Identification Initiative: A cultural shift in publishing. F1000Research 2015, 4, 134. [Google Scholar] [CrossRef]
- Helsby, M.A.; Leader, P.M.; Fenn, J.R.; Gulsen, T.; Bryant, C.; Doughton, G.; Sharpe, B.; Whitley, P.; Caunt, C.J.; James, K.; et al. CiteAb: A searchable antibody database that ranks antibodies by the number of times they have been cited. BMC Cell Biol. 2014, 15, 6. [Google Scholar] [CrossRef]
- Lima, W.C.; Gasteiger, E.; Marcatili, P.; Duek, P.; Bairoch, A.; Cosson, P. The ABCD database: A repository for chemically defined antibodies. Nucleic Acids Res. 2020, 48, D261–D264. [Google Scholar] [CrossRef] [PubMed]
- Bradbury, A.; Plückthun, A. Reproducibility: Standardize antibodies used in research. Nature 2015, 518, 27–29. [Google Scholar] [CrossRef] [PubMed]
- Groff, K.; Brown, J.; Clippinger, A.J. Modern affinity reagents: Recombinant antibodies and aptamers. Biotechnol. Adv. 2015, 33, 1787–1798. [Google Scholar] [CrossRef] [PubMed]
- Bradbury, A.R.; Plückthun, A. Getting to reproducible antibodies: The rationale for sequenced recombinant characterized reagents. Protein Eng. Des. Sel. 2015, 28, 303–305. [Google Scholar] [CrossRef] [PubMed]
- Bradbury, A.M.; Plückthun, A. Antibodies: Validate recombinants once. Nature 2015, 520, 295. [Google Scholar] [CrossRef]
- Polakiewicz, R.D. Antibodies: The solution is validation. Nature 2015, 518, 483. [Google Scholar] [CrossRef]
- Freedman, L.P. Antibodies: Validate recombinants too. Nature 2015, 518, 483. [Google Scholar] [CrossRef]
- Voskuil, J.L. The challenges with the validation of research antibodies. F1000Research 2017, 6, 161. [Google Scholar] [CrossRef]
- Wolters, M.; Rohde, H.; Maier, T.; Belmar-Campos, C.; Franke, G.; Scherpe, S.; Aepfelbacher, M.; Christner, M. MALDI-TOF MS fingerprinting allows for discrimination of major methicillin-resistant Staphylococcus aureus lineages. Int. J. Med. Microbiol. 2011, 301, 64–68. [Google Scholar] [CrossRef]
- Bohme, K.; Fernandez-No, I.C.; Barros-Velazquez, J.; Gallardo, J.M.; Calo-Mata, P.; Canas, B. Species Differentiation of Seafood Spoilage and Pathogenic Gram-Negative Bacteria by MALDI-TOF Mass Fingerprinting. J. Proteome Res. 2010, 9, 3169–3183. [Google Scholar] [CrossRef]
- Bohme, K.; Fernandez-No, I.C.; Barros-Velazquez, J.; Gallardo, J.M.; Canas, B.; Calo-Mata, P. Rapid species identification of seafood spoilage and pathogenic Gram-positive bacteria by MALDI-TOF mass fingerprinting. Electrophoresis 2011, 32, 2951–2965. [Google Scholar] [CrossRef] [PubMed]
- Mahe, P.; Arsac, M.; Chatellier, S.; Monnin, V.; Perrot, N.; Mailler, S.; Girard, V.; Ramjeet, M.; Surre, J.; Lacroix, B.; et al. Automatic identification of mixed bacterial species fingerprints in a MALDI-TOF mass-spectrum. Bioinformatics 2014, 30, 1280–1286. [Google Scholar] [CrossRef] [PubMed]
- Wunschel, S.C.; Jarman, K.H.; Petersen, C.E.; Valentine, N.B.; Wahl, K.L.; Schauki, D.; Jackman, J.; Nelson, C.P.; White, E. Bacterial analysis by MALDI-TOF mass spectrometry: An inter-laboratory comparison. J. Am. Soc. Mass Spectrom. 2005, 16, 456–462. [Google Scholar] [CrossRef] [PubMed]
- Gaia, V.; Casati, S.; Tonolla, M. Rapid identification of Legionella spp. by MALDI-TOF MS based protein mass fingerprinting. Syst. Appl. Microbiol. 2011, 34, 40–44. [Google Scholar] [CrossRef]
- Krause, E.; Wenschuh, H.; Jungblut, P.R. The dominance of arginine-containing peptides in MALDI-derived tryptic mass fingerprints of proteins. Anal. Chem. 1999, 71, 4160–4165. [Google Scholar] [CrossRef]
- Henzel, W.J.; Watanabe, C.; Stults, J.T. Protein identification: The origins of peptide mass fingerprinting. J. Am. Soc. Mass Spectrom. 2003, 14, 931–942. [Google Scholar] [CrossRef]
- Thiede, B.; Hohenwarter, W.; Krah, A.; Mattow, J.; Schmid, M.; Schmidt, F.; Jungblut, P.R. Peptide mass fingerprinting. Methods 2005, 35, 237–247. [Google Scholar] [CrossRef]
- Sutton, C.W.; Pemberton, K.S.; Cottrell, J.S.; Corbett, J.M.; Wheeler, C.H.; Dunn, M.J.; Pappin, D.J. Identification of myocardial proteins from two-dimensional gels by peptide mass fingerprinting. Electrophoresis 1995, 16, 308–316. [Google Scholar] [CrossRef]
- Lee, K.; Bae, D.; Lim, D. Evaluation of parameters in peptide mass fingerprinting for protein identification by MALDI-TOF mass spectrometry. Mol. Cells 2002, 13, 175–184. [Google Scholar]
- Ghafouri, B.; Tagesson, C.; Lindahl, M. Mapping of proteins in human saliva using two-dimensional gel electrophoresis and peptide mass fingerprinting. Proteomics 2003, 3, 1003–1015. [Google Scholar] [CrossRef]
- Levander, F.; Rognvaldsson, T.; Samuelsson, J.; James, P. Automated methods for improved protein identification by peptide mass fingerprinting. Proteomics 2004, 4, 2594–2601. [Google Scholar] [CrossRef] [PubMed]
- Li, A.Q.; Sowder, R.C.; Henderson, L.E.; Moore, S.P.; Garfinkel, D.J.; Fisher, R.J. Chemical cleavage at aspartyl residues for protein identification. Anal. Chem. 2001, 73, 5395–5402. [Google Scholar] [CrossRef] [PubMed]
- Wu, C.Y.; Chen, S.T.; Chiou, S.H.; Wang, K.T. Specific Peptide-Bond Cleavage by Microwave Irradiation in Weak Acid-Solution. J. Protein Chem. 1992, 11, 45–50. [Google Scholar] [CrossRef] [PubMed]
- Joshi, A.B.; Sawai, M.; Kearney, W.R.; Kirsch, L.E. Studies on the mechanism of aspartic acid cleavage and glutamine deamidation in the acidic degradation of glucagon. J. Pharm. Sci. 2005, 94, 1912–1927. [Google Scholar] [CrossRef]
- Hua, L.; Low, T.Y.; Sze, S.K. Microwave-assisted specific chemical digestion for rapid protein identification. Proteomics 2006, 6, 586–591. [Google Scholar] [CrossRef]
- Swatkoski, S.; Gutierrez, P.; Wynne, C.; Petrov, A.; Dinman, J.D.; Edwards, N.; Fenselau, C. Evaluation of microwave-accelerated residue-specific acid cleavage for proteomic applications. J. Proteome Res. 2008, 7, 579–586. [Google Scholar] [CrossRef]
- Swatkoski, S.; Gutierrez, P.; Ginter, J.; Petrov, A.; Dinman, J.D.; Edwards, N.; Fenselau, C. Integration of residue-specific acid cleavage into proteomic workflows. J. Proteome Res. 2007, 6, 4525–4527. [Google Scholar] [CrossRef]
- Hauser, N.J.; Basile, F. Online microwave D-cleavage LC-ESI-MS/MS of intact proteins: Site-specific cleavages at aspartic acid residues and disulfide bonds. J. Proteome Res. 2008, 7, 1012–1026. [Google Scholar] [CrossRef]
- Bjorck, L.; Kronvall, G. Purification and Some Properties of Streptococcal Protein-G, A Novel IgG-Binding Reagent. J. Immunol. 1984, 133, 969–974. [Google Scholar]
- Gronenborn, A.M.; Filpula, D.R.; Essig, N.Z.; Achari, A.; Whitlow, M.; Wingfield, P.T.; Clore, G.M. A Novel, Highly Stable Fold of the Immunoglobulin Binding Domain of Streptococcal Protein-G. Science 1991, 253, 657–661. [Google Scholar] [CrossRef]
- Vermeer, A.W.P.; Norde, W. The thermal stability of immunoglobulin: Unfolding and aggregation of a multi-domain protein. Biophys. J. 2000, 78, 394–404. [Google Scholar] [CrossRef]
- Harn, N.; Allan, C.; Oliver, C.; Middaugh, C.R. Highly concentrated monoclonal antibody solutions: Direct analysis of physical structure and thermal stability. J. Pharm. Sci. 2007, 96, 532–546. [Google Scholar] [CrossRef]
- Oberleitner, L.; Dahmen-Levison, U.; Garbe, L.A.; Schneider, R.J. Improved strategies for selection and characterization of new monoclonal anti-carbamazepine antibodies during the screening process using feces and fluorescence polarization immunoassay. Anal. Methods 2016, 8, 6883–6894. [Google Scholar] [CrossRef]
- Han, J.C.; Han, G.Y. A Procedure for Quantitative Determination of Tris(2-Carboxyethyl)phosphine, an Odorless Reducing Agent More Stable and Effective Than Dithiothreitol. Anal. Biochem. 1994, 220, 5–10. [Google Scholar] [CrossRef]
- Brizzard, B.L.; Chubet, R.G.; Vizard, D.L. Immunoaffinity Purification of Flag Epitope-Tagged Bacterial Alkaline-Phosphatase Using a Novel Monoclonal-Antibody and Peptide Elution. Biotechniques 1994, 16, 730–735. [Google Scholar] [PubMed]
- Burkitt, W.I.; Giannakopulos, A.E.; Sideridou, F.; Bashir, S.; Derrick, P.J. Discrimination effects in MALDI-MS of mixtures of peptides—Analysis of the Proteome. Aust. J. Chem. 2003, 56, 369–377. [Google Scholar] [CrossRef]
- Ionescu, R.M.; Vlasak, J.; Price, C.; Kirchmeier, M. Contribution of variable domains to the stability of humanized IgG1 monoclonal antibodies. J. Pharm. Sci. 2008, 97, 1414–1426. [Google Scholar] [CrossRef]
- Weidner, S.; Kuhn, G.; Friedrich, J.; Lippitz, A. Plasmaoxidative degradation of polymers studied by matrix-assisted laser desorption/ionization mass spectrometry. Rapid Commun. Mass Spectrom. 1996, 10, 727–732. [Google Scholar] [CrossRef]
- Nielen, M.W.F. Maldi time-of-flight mass spectrometry of synthetic polymers. Mass Spectrom. Rev. 1999, 18, 309–344. [Google Scholar] [CrossRef]
- Montaudo, G.; Montaudo, M.S.; Puglisi, C.; Samperi, F. Determination of Absolute Mass Values in Maldi-Tof of Polymeric Materials by a Method of Self-Calibration of the Spectra. Anal. Chem. 1994, 66, 4366–4369. [Google Scholar] [CrossRef]
- Rosati, S.; Rose, R.J.; Thompson, N.J.; van Duijn, E.; Damoc, E.; Denisov, E.; Makarov, A.; Heck, A.J.R. Exploring an Orbitrap Analyzer for the Characterization of Intact Antibodies by Native Mass Spectrometry. Angew. Chem. Int. Ed. 2012, 51, 12992–12996. [Google Scholar] [CrossRef] [PubMed]
- Beck, A.; Sanglier-Cianferani, S.; Van Dorsselaer, A. Biosimilar, Biobetter, and Next Generation Antibody Characterization by Mass Spectrometry. Anal. Chem. 2012, 84, 4637–4646. [Google Scholar] [CrossRef]
- Zhang, Z.Q.; Pan, H.; Chen, X.Y. Mass Spectrometry for Structural Characterization of Therapeutic Antibodies. Mass Spectrom. Rev. 2009, 28, 147–176. [Google Scholar] [CrossRef] [PubMed]
- Beck, A.; Debaene, F.; Diemer, H.; Wagner-Rousset, E.; Colas, O.; Van Dorsselaer, A.; Cianferani, S. Cutting-edge mass spectrometry characterization of originator, biosimilar and biobetter antibodies. J. Mass Spectrom. 2015, 50, 285–297. [Google Scholar] [CrossRef] [PubMed]
- Harris, R.J.; Kabakoff, B.; Macchi, F.D.; Shen, F.J.; Kwong, M.; Andya, J.D.; Shire, S.J.; Bjork, N.; Totpal, K.; Chen, A.B. Identification of multiple sources of charge heterogeneity in a recombinant antibody. J. Chromatogr. B 2001, 752, 233–245. [Google Scholar] [CrossRef]
- Paul, M.; Weller, M.G. Antibody Screening by Microarray Technology-Direct Identification of Selective High-Affinity Clones. Antibodies 2020, 9, 1. [Google Scholar] [CrossRef]
- Molloy, J.C. The Open Knowledge Foundation: Open Data Means Better Science. PLoS Biol. 2011, 9, e1001195. [Google Scholar] [CrossRef]


| Random Sample | Best Match (# Matching Peaks) | Score (∆ Matching Peaks) |
|---|---|---|
| M01 | M01 (73) | 31 |
| M10 | M10 (97) | 35 |
| M36 | M36 (107) | 41 |
| M79 | M79 (89) | 27 |
| M82 | M82 (72) | 15 |
© 2020 by the authors. Licensee MDPI, Basel, Switzerland. This article is an open access article distributed under the terms and conditions of the Creative Commons Attribution (CC BY) license (http://creativecommons.org/licenses/by/4.0/).
Share and Cite
Tscheuschner, G.; Schwaar, T.; Weller, M.G. Fast Confirmation of Antibody Identity by MALDI-TOF MS Fingerprints. Antibodies 2020, 9, 8. https://doi.org/10.3390/antib9020008
Tscheuschner G, Schwaar T, Weller MG. Fast Confirmation of Antibody Identity by MALDI-TOF MS Fingerprints. Antibodies. 2020; 9(2):8. https://doi.org/10.3390/antib9020008
Chicago/Turabian StyleTscheuschner, Georg, Timm Schwaar, and Michael G. Weller. 2020. "Fast Confirmation of Antibody Identity by MALDI-TOF MS Fingerprints" Antibodies 9, no. 2: 8. https://doi.org/10.3390/antib9020008
APA StyleTscheuschner, G., Schwaar, T., & Weller, M. G. (2020). Fast Confirmation of Antibody Identity by MALDI-TOF MS Fingerprints. Antibodies, 9(2), 8. https://doi.org/10.3390/antib9020008