Engaging with Raman Spectroscopy to Investigate Antibody Aggregation


Abstract
1. Introduction
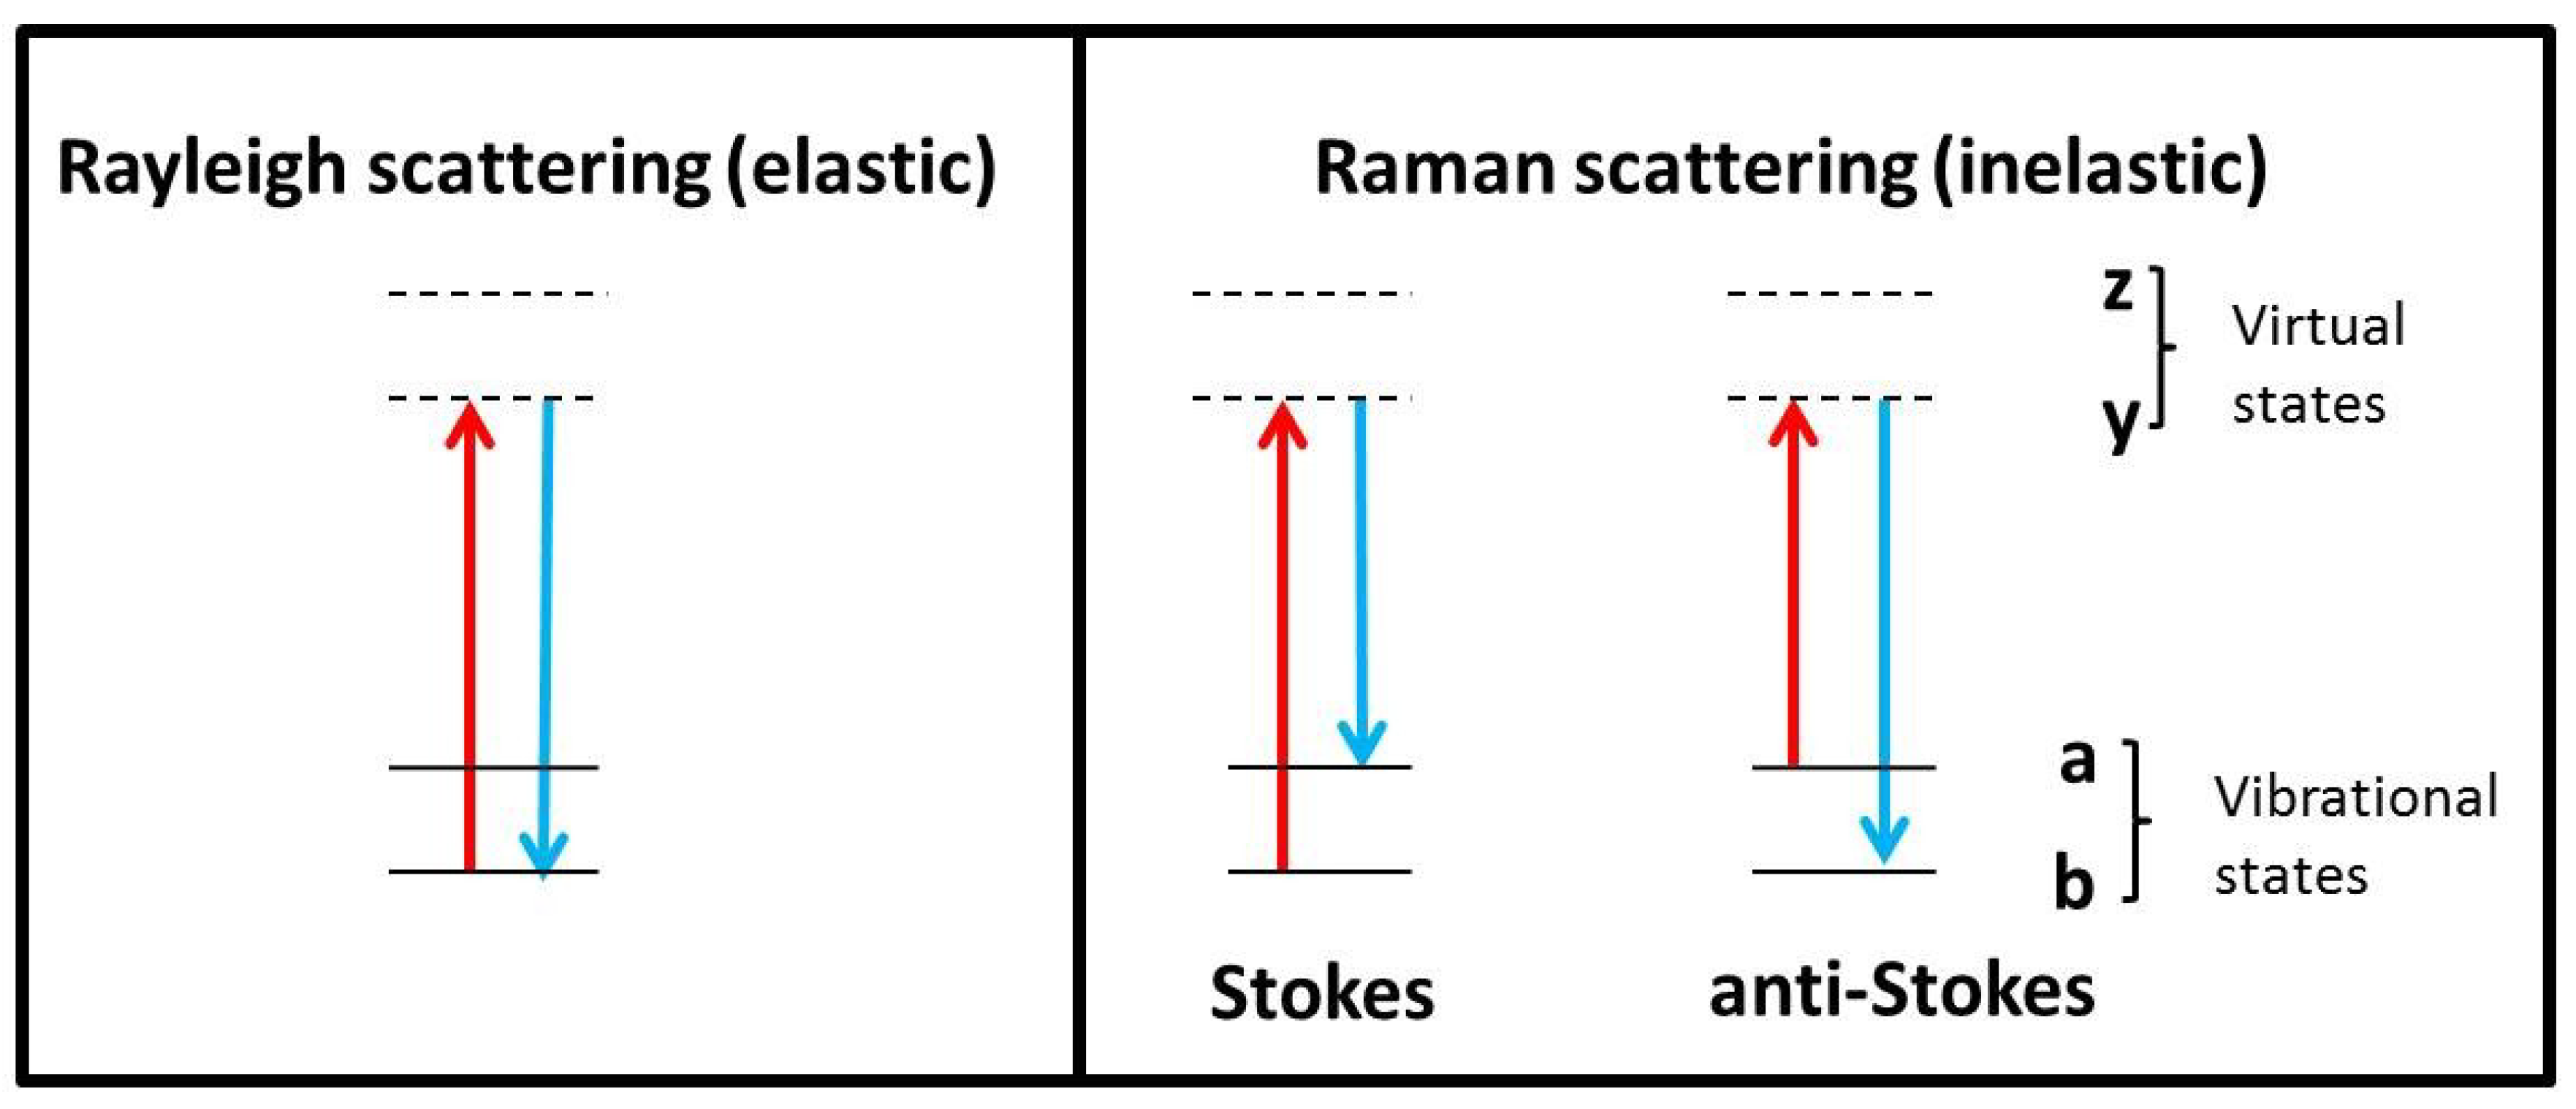
2. Raman Theory
3. Secondary and Tertiary Structure
4. Aggregation Mechanisms
5. Perturbation-Induced Aggregation
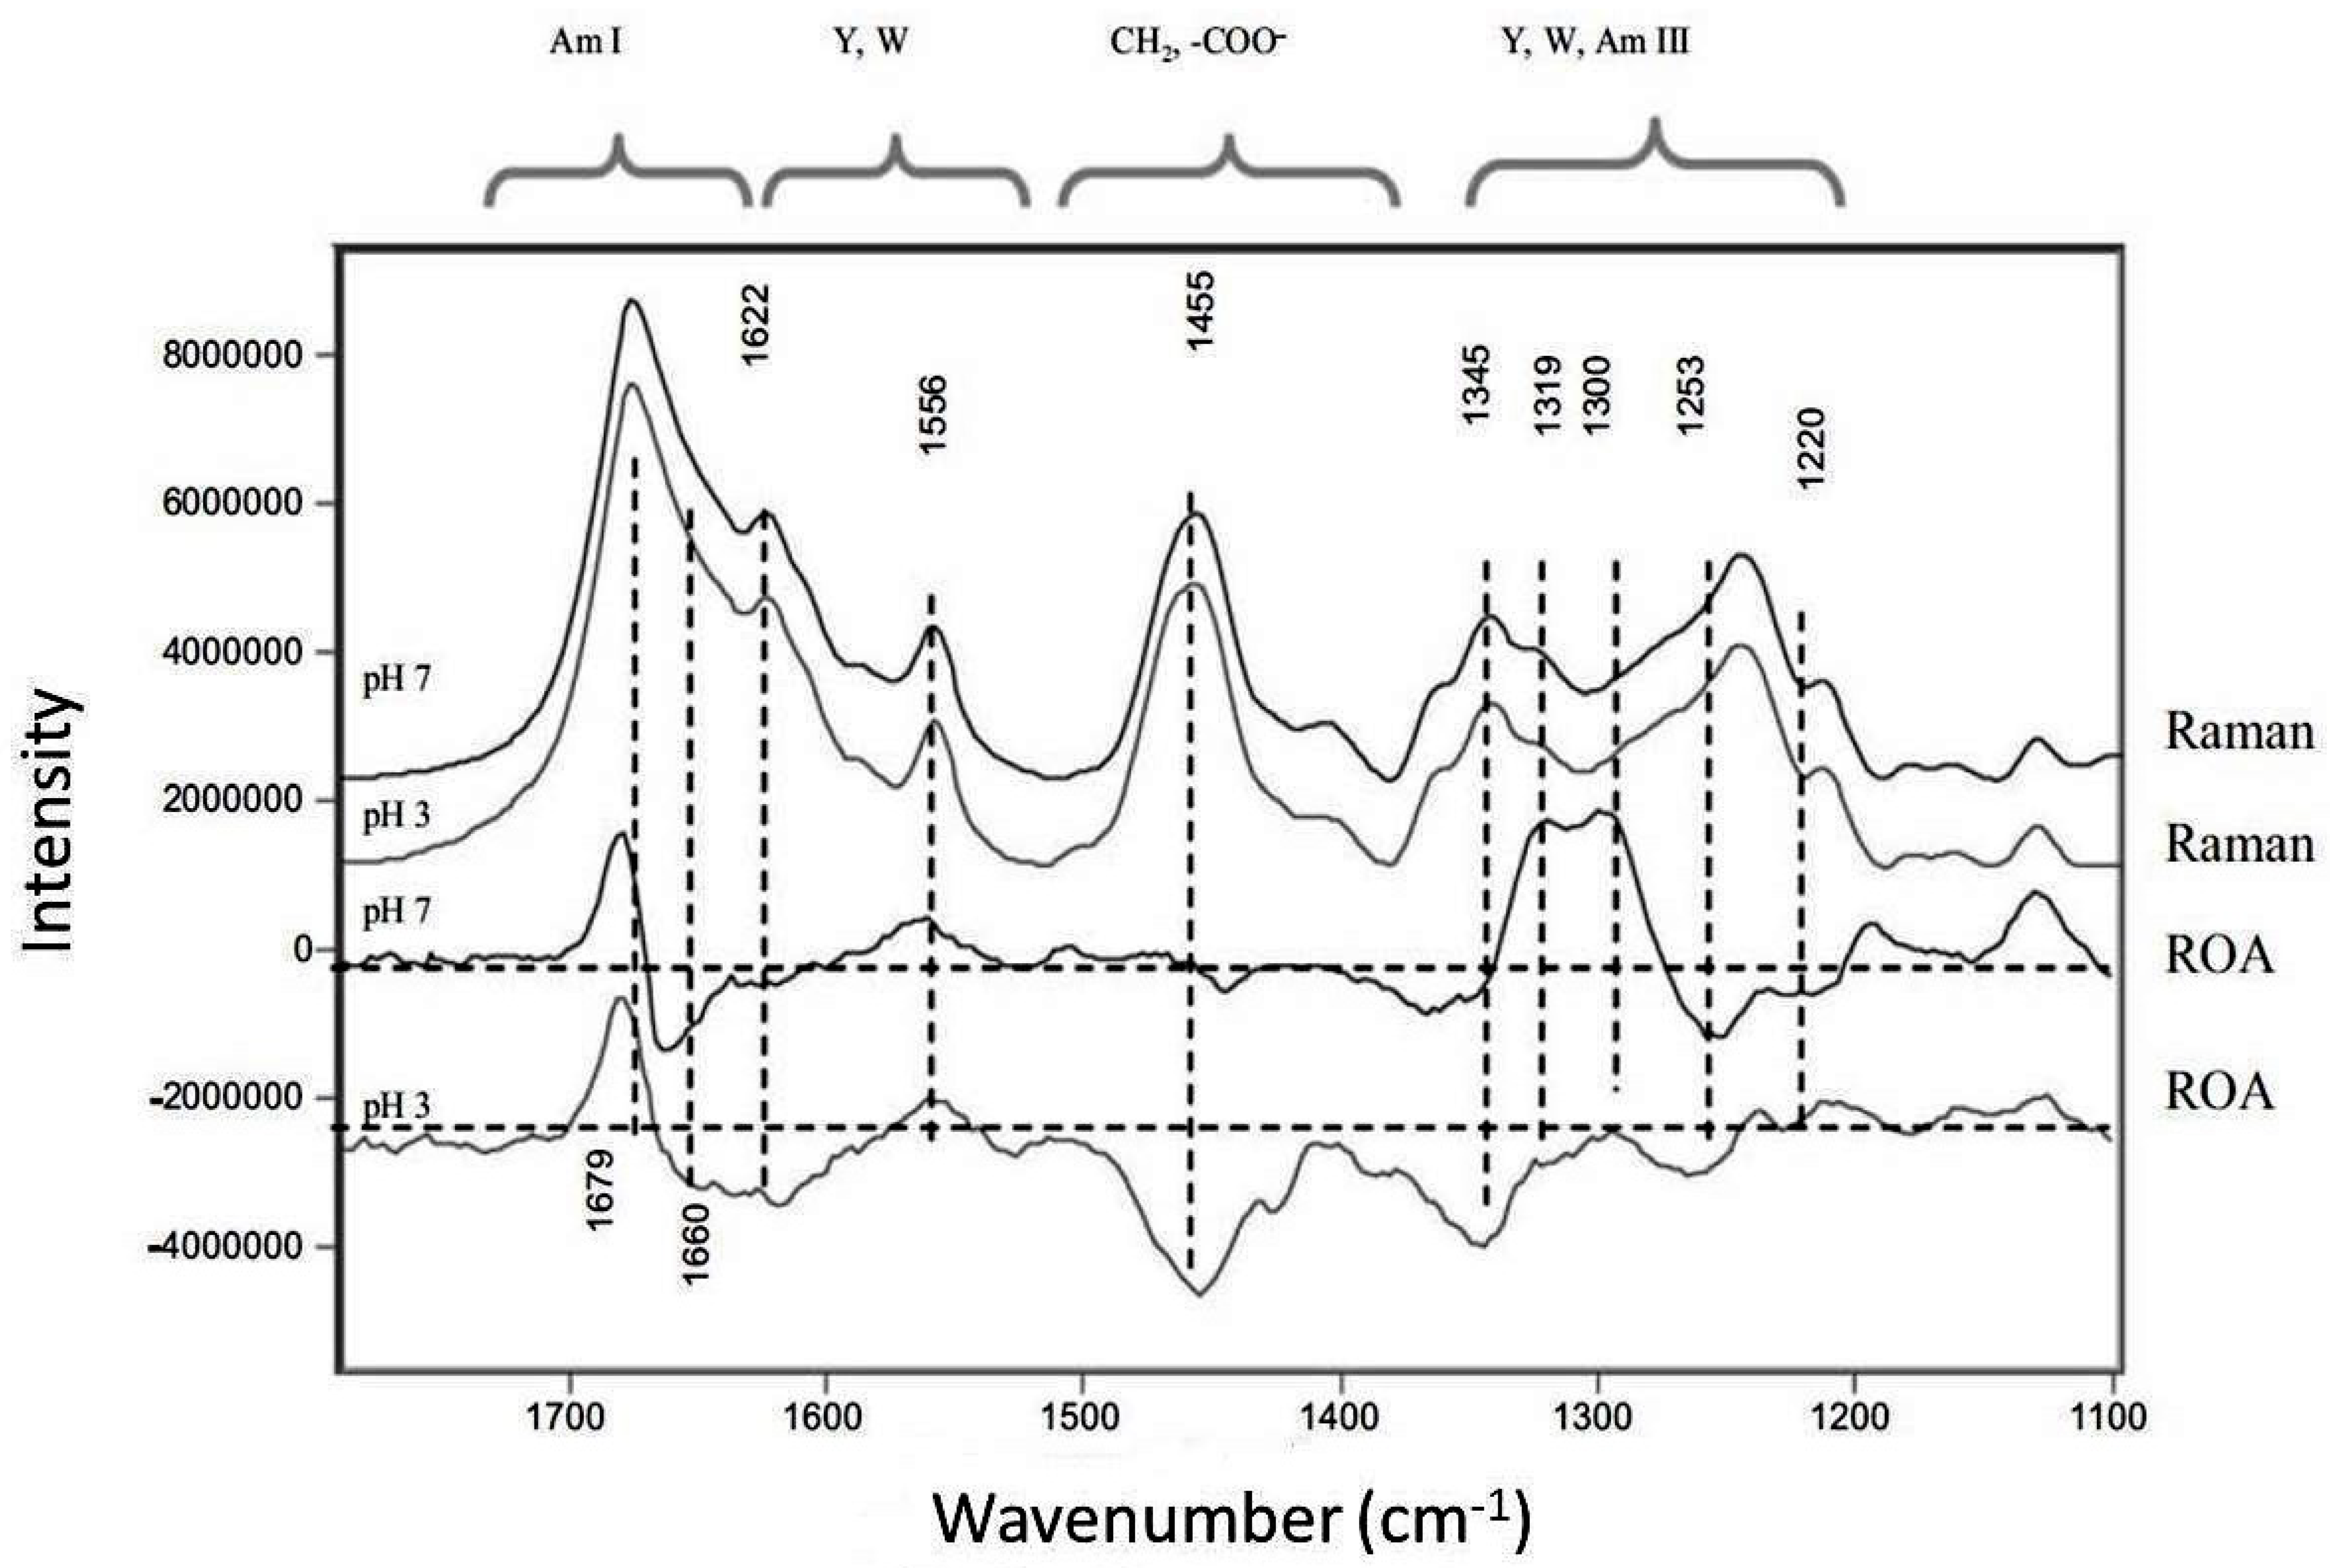
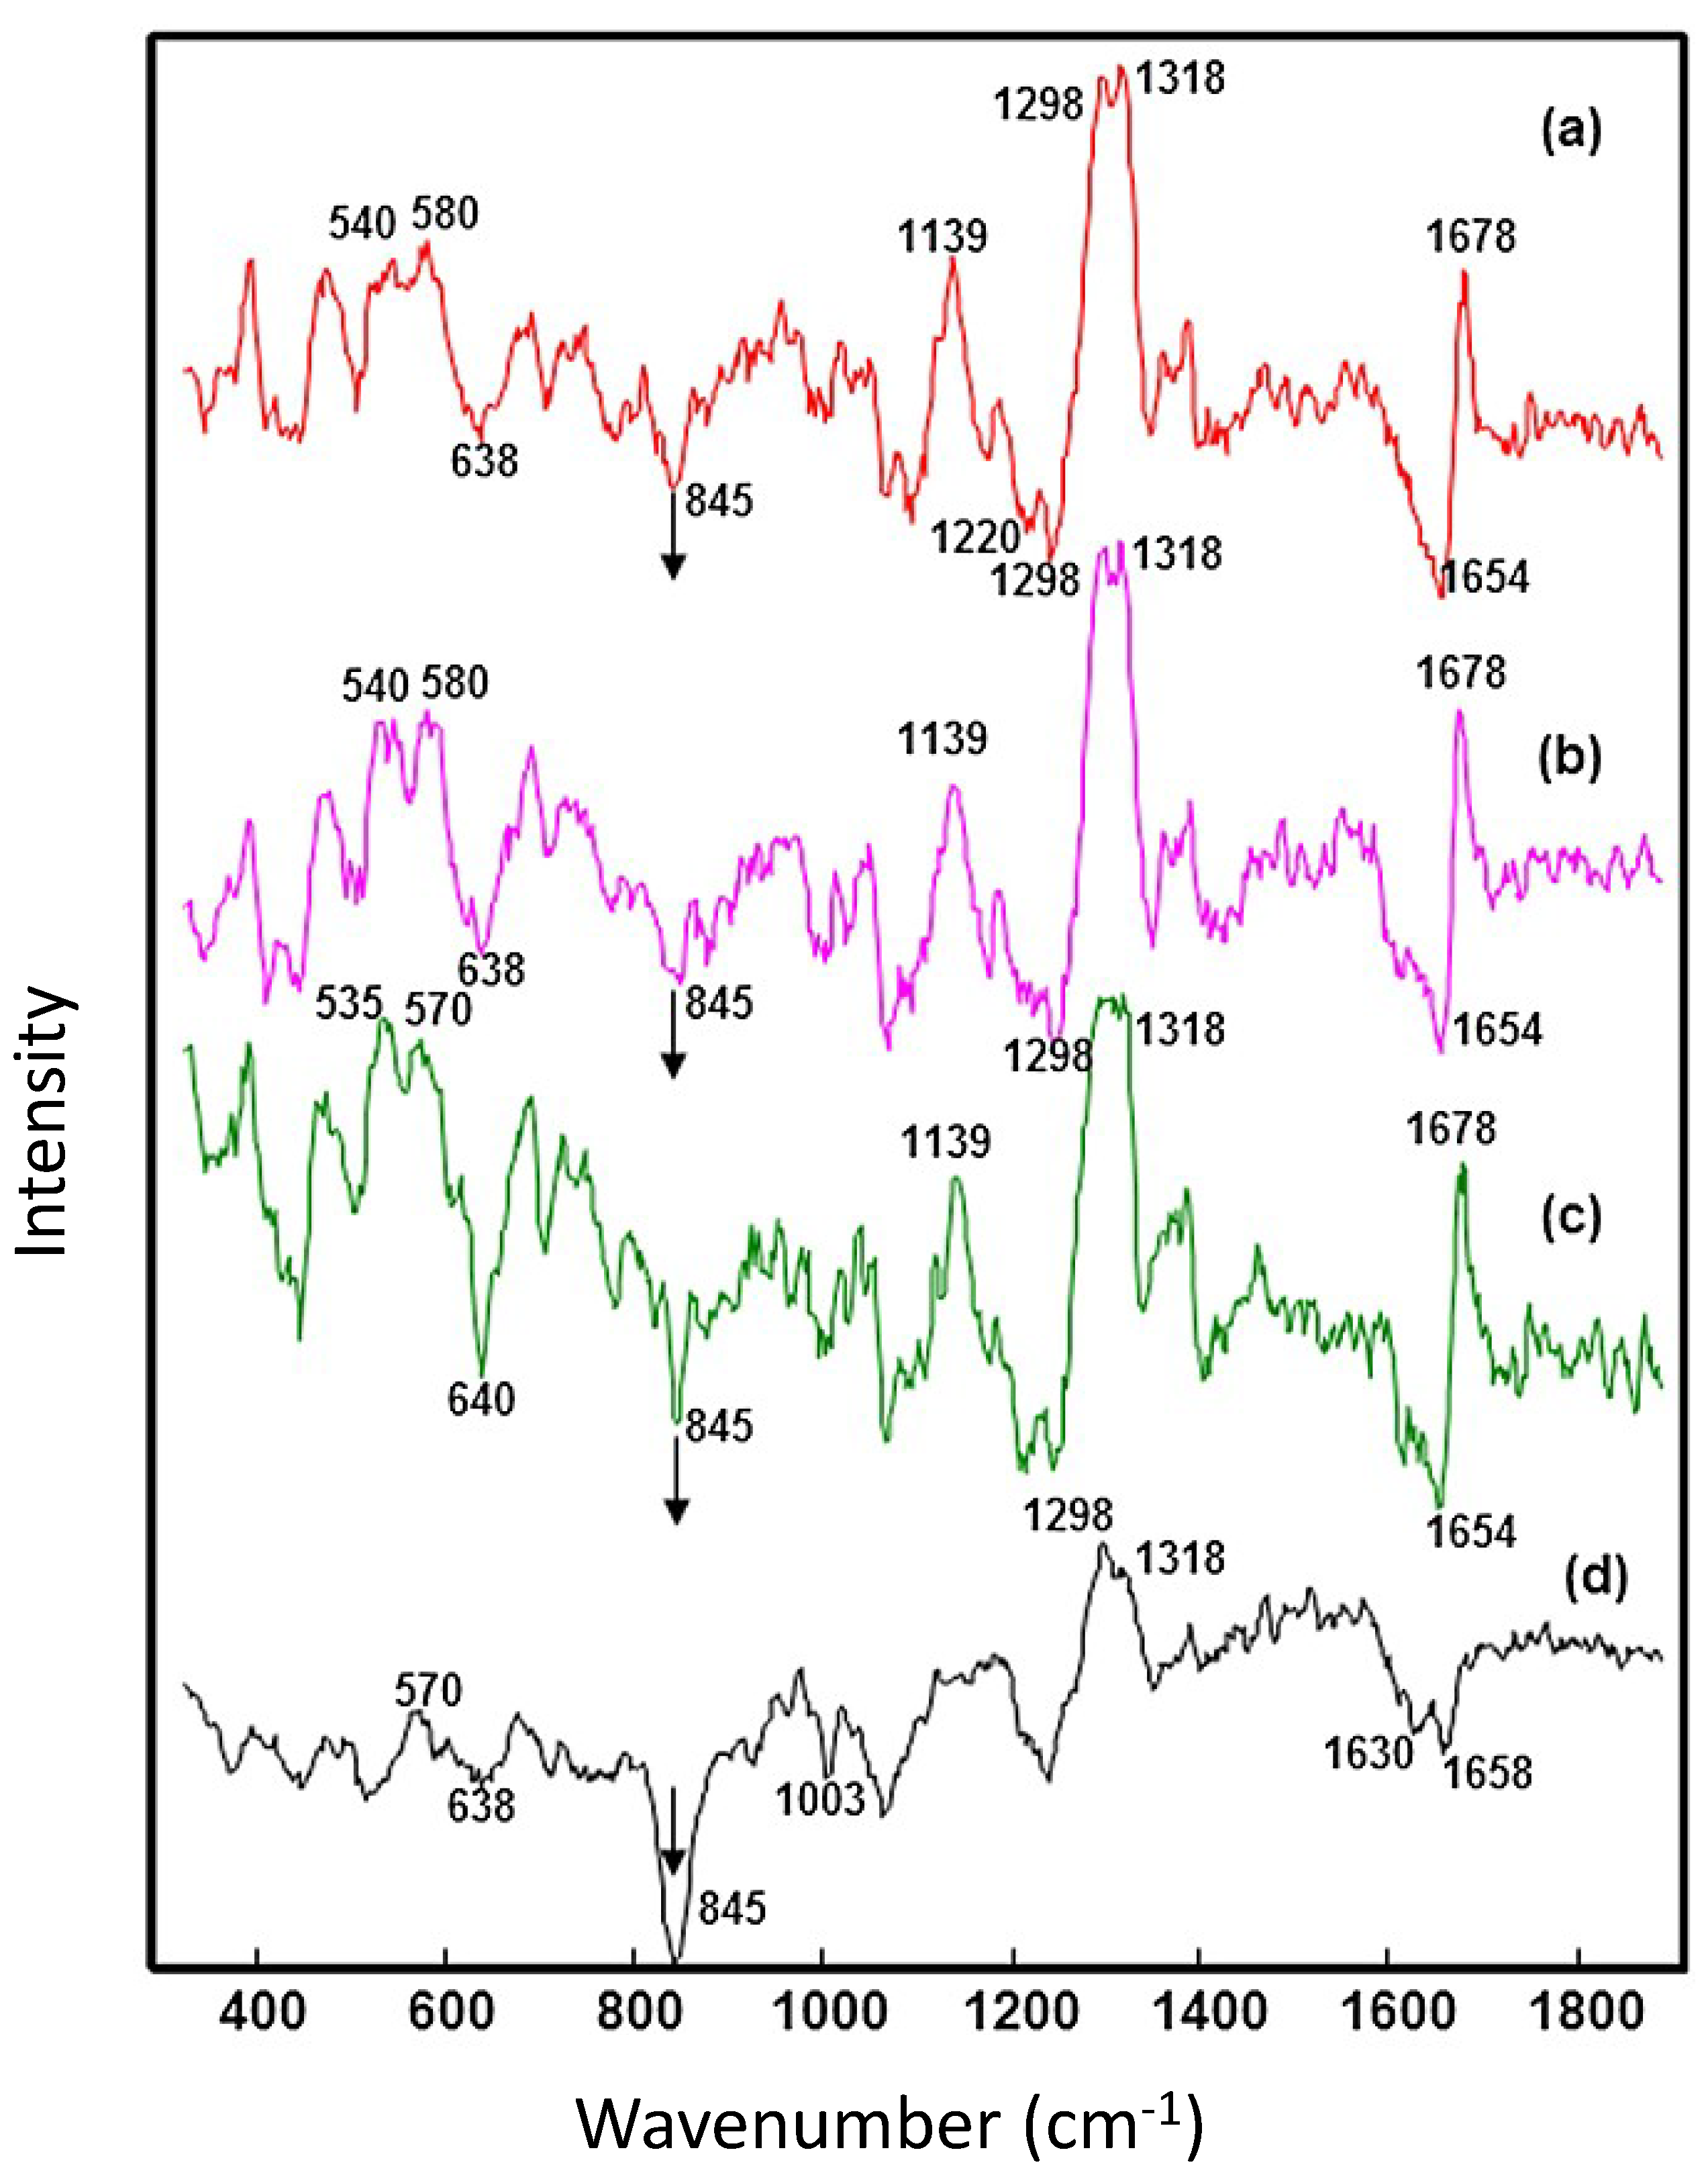
6. Raman Optical Activity
7. Deep UV Resonance Raman
8. Conclusions
Author Contributions
Funding
Acknowledgments
Conflicts of Interest
References
- Ecker, D.M.; Jones, S.D.; Levine, H.L. The therapeutic monoclonal antibody market. MAbs 2015, 7, 9–14. [Google Scholar] [CrossRef] [PubMed]
- Carter, P.J.; Lazar, G.A. Next generation antibody drugs: Pursuit of the ‘high-hanging fruit’. Nat. Rev. Drug Discov. 2018, 17, 197–223. [Google Scholar] [CrossRef] [PubMed]
- Reichert, J.M. Antibodies to watch in 2017. MAbs 2017, 9, 167–181. [Google Scholar] [CrossRef] [PubMed]
- Kaplon, H.; Reichert, J.M. Antibodies to watch in 2018. MAbs 2018, 10, 183–203. [Google Scholar] [CrossRef] [PubMed]
- Goswami, S.; Wang, W.; Arakawa, T.; Ohtake, S. Developments and challenges for mAb-based therapeutics. Antibodies 2013, 2, 452–500. [Google Scholar] [CrossRef]
- Hamrang, Z.; Rattray, N.J.; Pluen, A. Proteins behaving badly: Emerging technologies in profiling biopharmaceutical aggregation. Trends Biotechnol. 2013, 31, 448–458. [Google Scholar] [CrossRef] [PubMed]
- Roberts, C.J. Therapeutic protein aggregation: Mechanisms, design, and control. Trends Biotechnol. 2014, 32, 372–380. [Google Scholar] [CrossRef] [PubMed]
- Roberts, C.J. Protein aggregation and its impact on product quality. Curr. Opin. Biotechnol. 2014, 30, 211–217. [Google Scholar] [CrossRef] [PubMed]
- Rosenberg, A.S. Effects of protein aggregates: An immunologic perspective. AAPS J. 2006, 8, E501–E507. [Google Scholar] [CrossRef] [PubMed]
- Hermeling, S.; Crommelin, D.J.A.; Schellekens, H.; Jiskoot, W. Structure-immunogenicity relationships of therapeutic proteins. Pharm. Res. 2004, 21, 897–903. [Google Scholar] [CrossRef] [PubMed]
- Wang, W.; Roberts, C.J. Aggregation of Therapeutic Proteins; Wiley: Hoboken, NJ, USA, 2010. [Google Scholar]
- Roberts, C.J.; Das, T.K.; Sahin, E. Predicting solution aggregation rates for therapeutic proteins: Approaches and challenges. Int. J. Pharm. 2011, 418, 318–333. [Google Scholar] [CrossRef] [PubMed]
- Barnett, G.V.; Qi, W.; Amin, S.; Lewis, E.N.; Razinkov, V.I.; Kerwin, B.A.; Liu, Y.; Roberts, C.J. Structural changes and aggregation mechanisms for anti-streptavidin IgG1 at elevated concentration. J. Phys. Chem. B 2015, 119, 15150–15163. [Google Scholar] [CrossRef] [PubMed]
- Roberts, C.J. Non-native protein aggregation kinetics. Biotechnol. Bioeng. 2007, 98, 927–938. [Google Scholar] [CrossRef] [PubMed]
- Zhang, A.; Jordan, J.L.; Ivanova, M.I.; Weiss, W.F.; Roberts, C.J.; Fernandez, E.J. Molecular level insights into thermally induced α-chymotrypsinogen A amyloid aggregation mechanism and semiflexible protofibril morphology. Biochemistry 2010, 49, 10553–10564. [Google Scholar] [CrossRef] [PubMed]
- Chi, E.Y.; Krishnan, S.; Randolph, T.W.; Carpenter, J.F. Physical stability of proteins in aqueous solution: Mechanism and driving forces in nonnative protein aggregation. Pharm. Res. 2003, 20, 1325–1336. [Google Scholar] [CrossRef] [PubMed]
- Wen, Z.Q. Raman spectroscopy of protein pharmaceuticals. J. Pharm. Sci. 2007, 96, 2861–2878. [Google Scholar] [CrossRef] [PubMed]
- Mahler, H.-C.; Friess, W.; Grauschopf, U.; Kiese, S. Protein aggregation: Pathways, induction factors and analysis. J. Pharm. Sci. 2009, 98, 2909–2934. [Google Scholar] [CrossRef] [PubMed]
- Jiskoot, W.; Randolph, T.W.; Volkin, D.B.; Russell Middaugh, C.; Schöneich, C.; Winter, G.; Friess, W.; Crommelin, D.J.A.; Carpenter, J.F. Protein instability and immunogenicity: Roadblocks to clinical application of injectable protein delivery systems for sustained release. J. Pharm. Sci. 2012, 101, 946–954. [Google Scholar] [CrossRef] [PubMed]
- Buckley, K.; Ryder, A.G. Applications of Raman spectroscopy in biopharmaceutical manufacturing: A short review. Appl. Spectrosc. 2017, 71, 1085–1116. [Google Scholar] [CrossRef] [PubMed]
- Wang, W. Protein aggregation and its inhibition in biopharmaceutics. Int. J. Pharm. 2005, 289, 1–30. [Google Scholar] [CrossRef] [PubMed]
- Zhou, C.; Qi, W.; Neil Lewis, E.; Carpenter, J.F. Concomitant Raman spectroscopy and dynamic light scattering for characterization of therapeutic proteins at high concentrations. Anal. Biochem. 2015, 472, 7–20. [Google Scholar] [CrossRef] [PubMed]
- Ota, C.; Noguchi, S.; Tsumoto, K. The molecular interaction of a protein in highly concentrated solution investigated by Raman spectroscopy. Biopolymers 2015, 103, 237–246. [Google Scholar] [CrossRef] [PubMed]
- Lewis, E.N.; Qi, W.; Kidder, L.H.; Amin, S.; Kenyon, S.M.; Blake, S. Combined dynamic light scattering and Raman spectroscopy approach for characterizing the aggregation of therapeutic proteins. Molecules 2014, 19, 20888–20905. [Google Scholar] [CrossRef] [PubMed]
- Sane, S.U.; Wong, R.; Hsu, C.C. Raman spectroscopic characterization of drying-induced structural changes in a therapeutic antibody: Correlating structural changes with long-term stability. J. Pharm. Sci. 2004, 93, 1005–1018. [Google Scholar] [CrossRef] [PubMed]
- Li, W.; Prabakaran, P.; Chen, W.; Zhu, Z.; Feng, Y.; Dimitrov, D. Antibody aggregation: Insights from sequence and structure. Antibodies 2016, 5, 19. [Google Scholar] [CrossRef]
- Harn, N.; Allan, C.; Oliver, C.; Middaugh, C.R. Highly concentrated monoclonal antibody solutions: Direct analysis of physical structure and thermal stability. J. Pharm. Sci. 2007, 96, 532–546. [Google Scholar] [CrossRef] [PubMed]
- Amin, S.; Barnett, G.V.; Pathak, J.A.; Roberts, C.J.; Sarangapani, P.S. Protein aggregation, particle formation, characterization & rheology. Curr. Opin. Colloid Interface Sci. 2014, 19, 438–449. [Google Scholar]
- Long, D.A. The Raman Effect: A Unified Treatment of the Theory of Raman Scattering by Molecules; Wiley: Hoboken, NJ, USA, 2002. [Google Scholar]
- Smith, E.; Dent, G. Modern Raman Spectroscopy: A Practical Approach; Wiley: Hoboken, NJ, USA, 2005. [Google Scholar]
- Butler, H.J.; Ashton, L.; Bird, B.; Cinque, G.; Curtis, K.; Dorney, J.; Esmonde-White, K.; Fullwood, N.J.; Gardner, B.; Martin-Hirsch, P.L.; et al. Using Raman spectroscopy to characterize biological materials. Nat. Protoc. 2016, 11, 664–687. [Google Scholar] [CrossRef] [PubMed]
- Miyazawa, T.; Shimanouchi, T.; Mizushima, S.I. Normal vibrations of n-methylacetamide. J. Chem. Phys. 1958, 29, 611–616. [Google Scholar] [CrossRef]
- Lord, R.; Yu, N.-T. Laser-excited Raman spectroscopy of biomolecules: I. Native lysozyme and its constituent amino acids. J. Mol. Biol. 1970, 50, 509–524. [Google Scholar] [CrossRef]
- Spiro, T.G.; Gaber, B.P. Laser Raman scattering as a probe of protein structure. Annu. Rev. Biochem. 1977, 46, 553–570. [Google Scholar] [CrossRef] [PubMed]
- Chase, B. A new generation of Raman instrumentation. Appl. Spectrosc. 1994, 48, 14A–19A. [Google Scholar] [CrossRef]
- Adar, F.; Delhaye, M.; DaSilva, E. Evolution of instrumentation for detection of the Raman effect as driven by available technologies and by developing applications. J. Chem. Educ. 2007, 84, 50. [Google Scholar] [CrossRef]
- LaPlant, F. Lasers, spectrographs, and detectors. In Emerging Raman Applications and Techniques in Biomedical and Pharmaceutical Fields; Matousek, P., Morris, M.D., Eds.; Springer: Berlin/Heidelberg, Germany, 2010; pp. 1–24. [Google Scholar]
- Ramirez, F.J.; Nieto-Ortega, B.; Casado, J.; Lopez Navarrete, J.T. The first chiral Raman spectrum report of a protein: A perspective of 20 years. Chem. Commun. 2013, 49, 8893–8895. [Google Scholar] [CrossRef] [PubMed]
- Barron, L.D. The development of biomolecular Raman optical activity spectroscopy. Biomed. Spectrosc. Imaging 2015, 4, 223–253. [Google Scholar] [CrossRef]
- Gömez De La Cuesta, R.; Goodacre, R.; Ashton, L. Monitoring antibody aggregation in early drug development using raman spectroscopy and perturbation-correlation moving windows. Anal. Chem. 2014, 86, 11133–11140. [Google Scholar] [CrossRef] [PubMed]
- Reddy, R.K.; Bhargava, R. Chemometric methods for biomedical Raman spectroscopy and imaging. In Emerging Raman Applications and Techniques in Biomedical and Pharmaceutical Fields; Matousek, P., Morris, M.D., Eds.; Springer: Berlin/Heidelberg, Germany, 2010; pp. 179–213. [Google Scholar]
- Shashilov, V.A.; Lednev, I.K. Advanced statistical and numerical methods for spectroscopic characterization of protein structural evolution. Chem. Rev. 2010, 110, 5692–5713. [Google Scholar] [CrossRef] [PubMed]
- Li, C.H.; Li, T. Application of vibrational spectroscopy to the structural characterization of monoclonal antibody and its aggregate. Curr. Pharm. Biotechnol. 2009, 10, 391–399. [Google Scholar] [CrossRef] [PubMed]
- Ashton, L.; Blanch, E.W. pH-induced conformational transitions in α-lactalbumin investigated with two-dimensional Raman correlation variance plots and moving windows. J. Mol. Struct. 2010, 974, 132–138. [Google Scholar] [CrossRef]
- Barnett, G.V.; Razinkov, V.I.; Kerwin, B.A.; Laue, T.M.; Woodka, A.H.; Butler, P.D.; Perevozchikova, T.; Roberts, C.J. Specific-ion effects on the aggregation mechanisms and protein–protein interactions for anti-streptavidin immunoglobulin gamma-1. J. Phys. Chem. B 2015, 119, 5793–5804. [Google Scholar] [CrossRef] [PubMed]
- Li, Y.; Roberts, C.J. Lumry−Eyring nucleated-polymerization model of protein aggregation kinetics. 2. Competing growth via condensation and chain polymerization. J. Phys. Chem. B 2009, 113, 7020–7032. [Google Scholar] [CrossRef] [PubMed]
- Andrews, J.M.; Roberts, C.J. A Lumry−Eyring nucleated polymerization model of protein aggregation kinetics: 1. Aggregation with pre-equilibrated unfolding. J. Phys. Chem. B 2007, 111, 7897–7913. [Google Scholar] [CrossRef] [PubMed]
- Ackermann, K.R.; Koster, J.; Schlücker, S. Conformations and vibrational properties of disulfide bridges: Potential energy distribution in the model system diethyl disulfide. Chem. Phys. 2009, 355, 81–84. [Google Scholar] [CrossRef]
- Sugeta, H.; Go, A.; Miyazawa, T. S–S and C–S stretching vibrations and molecular conformations of dialkyl disulfides and cystine. Chem. Lett. 1972, 1, 83–86. [Google Scholar] [CrossRef]
- Van Wart, H.E.; Scheraga, H.A. Agreement with the disulfide stretching frequency-conformation correlation of Sugeta, Go, and Miyazawa. Proc. Natl. Acad. Sci. USA 1986, 83, 3064–3067. [Google Scholar] [CrossRef] [PubMed]
- Siamwiza, M.N.; Lord, R.C.; Chen, M.C.; Takamatsu, T.; Harada, I.; Matsuura, H.; Shimanouchi, T. Interpretation of the doublet at 850 and 830 cm-1 in the Raman spectra of tyrosyl residues in proteins and certain model compounds. Biochemistry 1975, 14, 4870–4876. [Google Scholar] [CrossRef] [PubMed]
- Ellepola, S.; Choi, S.-M.; Phillips, D.; Ma, C.-Y. Raman spectroscopic study of rice globulin. J. Cereal Sci. 2006, 43, 85–93. [Google Scholar] [CrossRef]
- Liang, M.; Chen, V.Y.; Chen, H.-L.; Chen, W. A simple and direct isolation of whey components from raw milk by gel filtration chromatography and structural characterization by Fourier transform Raman spectroscopy. Talanta 2006, 69, 1269–1277. [Google Scholar] [CrossRef] [PubMed]
- Chen, M.C.; Lord, R.C. Laser excited Raman spectroscopy of biomolecules. 13—conformational study of α-chymotrypsin and trypsin. J. Raman Spectrosc. 1980, 9, 304–307. [Google Scholar] [CrossRef]
- Webster, G.T.; Dusting, J.; Balabani, S.; Blanch, E.W. Detecting the early onset of shear-induced fibril formation of insulin in situ. J. Phys. Chem. B 2011, 115, 2617–2626. [Google Scholar] [CrossRef] [PubMed]
- Gryniewicz, C.M.; Kauffman, J.F. Multivariate calibration of covalent aggregate fraction to the Raman spectrum of regular human insulin. J. Pharm. Sci. 2008, 97, 3727–3734. [Google Scholar] [CrossRef] [PubMed]
- Barron, L.D.; Zhu, F.; Hecht, L.; Tranter, G.E.; Isaacs, N.W. Raman optical activity: An incisive probe of molecular chirality and biomolecular structure. J. Mol. Struct. 2007, 834-836, 7–16. [Google Scholar] [CrossRef]
- Smyth, E.; Syme, C.D.; Blanch, E.W.; Hecht, L.; Vašák, M.; Barron, L.D. Solution structure of native proteins with irregular folds from Raman optical activity. Biopolymers 2001, 58, 138–151. [Google Scholar] [CrossRef]
- Ashton, L.; Barron, L.D.; Hecht, L.; Hyde, J.; Blanch, E.W. Two-dimensional Raman and Raman optical activity correlation analysis of the α-helix-to-disordered transition in poly(l-glutamic acid). Analyst 2007, 132, 468–479. [Google Scholar] [CrossRef] [PubMed]
- Ashton, L.; Pudney, P.D.A.; Blanch, E.W.; Yakubov, G.E. Understanding glycoprotein behaviours using Raman and Raman optical activity spectroscopies: Characterising the entanglement induced conformational changes in oligosaccharide chains of mucin. Adv. Colloid Interface Sci. 2013, 199–200, 66–77. [Google Scholar] [CrossRef] [PubMed]
- McColl, I.H.; Blanch, E.W.; Gill, A.C.; Rhie, A.G.O.; Ritchie, M.A.; Hecht, L.; Nielsen, K.; Barron, L.D. A new perspective on β-sheet structures using vibrational Raman optical activity: From poly(l-lysine) to the prion protein. J. Am. Chem. Soc. 2003, 125, 10019–10026. [Google Scholar] [CrossRef] [PubMed]
- Blanch, E.W.; Morozova-Roche, L.A.; Cochran, D.A.E.; Doig, A.J.; Hecht, L.; Barron, L.D. Is polyproline IIhelix the killer conformation? A Raman optical activity study of the amyloidogenic prefibrillar intermediate of human lysozyme. J. Mol. Biol. 2000, 301, 553–563. [Google Scholar] [CrossRef] [PubMed]
- Blanch, E.W.; Hecht, L.; Syme, C.D.; Volpetti, V.; Lomonossoff, G.P.; Nielsen, K.; Barron, L.D. Molecular structures of viruses from Raman optical activity. J. Gen. Virol. 2002, 83, 2593–2600. [Google Scholar] [CrossRef] [PubMed]
- Hobro, A.J.; Rouhi, M.; Conn, G.L.; Blanch, E.W. Raman and Raman optical activity (ROA) analysis of RNA structural motifs. Vib. Spectrosc. 2008, 48, 37–43. [Google Scholar] [CrossRef]
- Thiagarajan, G.; Widjaja, E.; Heo, J.H.; Cheung, J.K.; Wabuyele, B.; Mou, X.; Shameem, M. Use of Raman and Raman optical activity for the structural characterization of a therapeutic monoclonal antibody formulation subjected to heat stress. J. Raman Spectrosc. 2015, 46, 531–536. [Google Scholar] [CrossRef]
- Xu, M.; Ermolenkov, V.V.; Uversky, V.N.; Lednev, I.K. Hen egg white lysozyme fibrillation: A deep-UV resonance Raman spectroscopic study. J. Biophotonics 2008, 1, 215–229. [Google Scholar] [CrossRef] [PubMed]
- Lednev, I.K.; Ermolenkov, V.V.; He, W.; Xu, M. Deep-UV Raman spectrometer tunable between 193 and 205 nm for structural characterization of proteins. Anal. Bioanal. Chem. 2005, 381, 431–437. [Google Scholar] [CrossRef] [PubMed]
- Xu, M.; Ermolenkov, V.V.; He, W.; Uversky, V.N.; Fredriksen, L.; Lednev, I.K. Lysozyme fibrillation: Deep UV Raman spectroscopic characterization of protein structural transformation. Biopolymers 2005, 79, 58–61. [Google Scholar] [CrossRef] [PubMed]
- Sikirzhytski, V.; Topilina, N.I.; Takor, G.A.; Higashiya, S.; Welch, J.T.; Uversky, V.N.; Lednev, I.K. Fibrillation mechanism of a model intrinsically disordered protein revealed by 2d correlation deep uv resonance raman spectroscopy. Biomacromolecules 2012, 13, 1503–1509. [Google Scholar] [CrossRef] [PubMed]
- Xiong, K.; Punihaole, D.; Asher, S.A. UV resonance Raman spectroscopy monitors polyglutamine backbone and side chain hydrogen bonding and fibrillization. Biochemistry 2012, 51, 5822–5830. [Google Scholar] [CrossRef] [PubMed]
- Shashilov, V.A.; Lednev, I.K. 2D correlation deep UV resonance Raman spectroscopy of early events of lysozyme fibrillation: Kinetic mechanism and potential interpretation pitfalls. J. Am. Chem. Soc. 2008, 130, 309–317. [Google Scholar] [CrossRef] [PubMed]
- Ramachandran, G.; Milán-Garcés, E.A.; Udgaonkar, J.B.; Puranik, M. Resonance Raman spectroscopic measurements delineate the structural changes that occur during tau fibril formation. Biochemistry 2014, 53, 6550–6565. [Google Scholar] [CrossRef] [PubMed]
- Bueno, J.; Long, D.; Kauffman, J.F.; Arzhantsev, S. Deep-ultraviolet resonance Raman (DUVRR) spectroscopy of therapeutic monoclonal antibodies subjected to thermal stress. Anal. Chem. 2015, 87, 7880–7886. [Google Scholar] [CrossRef] [PubMed]


| Peak (cm−1) | Spectral Change | Sample (Perturbation) | Structural Implication | Ref |
|---|---|---|---|---|
| 510/531/547 (S-S stretch) | Observable peaks at 510,531 & 545 in aggregate spectra vs. 531 for soluble Fc | Fc (unspecified) | GGG, TGG and TGT conformations present in aggregates vs mainly TGG in soluble Fc | [43] |
| Increased perturbation in (I510/540) for ND aggregates | Anti-streptavidin IgG1(temperature) | ND aggregation pathway showed greater sensitivity to this marker. | [13] | |
| 850/830 (Tyr) | No change | rhuMab * (Lyophilisation) | - | [25] |
| Downshift | IVIG * (temperature) | Change in tertiary structure | [22] | |
| Increased ratio | Rabbit IgG (concentration) | Increased molecular interaction | [23] | |
| 770/875 (Trp) | Increased/decreased intensity | IgG4 variant (temperature) | Less exposure to solvent/more exposure to solvent | [40] |
| 1000 (Phe) | Increased intensity | Rabbit IgG (storage) | Pre-aggregation | [23] |
| 1230 (β-sheet) | Broadening and shift to 1245 cm−1 | Human IgG1 (pH) | Formation of intermolecular β-sheet | [43] |
| I1340/I1360 (Trp) | Decreased ratio | IVIG (temperature) | Reduced hydrophobicity (change in tertiary structure) | [22] |
| 1555 (Trp) | Downshift | IVIG/temperature | Change in tertiary structure | [22] |
| Redshift | Anti-streptavidin IgG1(temperature) | Change in tertiary structure | [13] | |
| 1630 (β-structure) | Increased/decreased intensity | IgG4 variant (temperature) | Increase in intermolecular H-bonding of β-structure/Loss of bonding or loss of secondary structure | [40] |
| 1669 (β-sheet) | Decreased intensity | Human IgG1(pH) | Loss of Intramolecular β-sheet | [43] |
| 1686 (β-sheet) | Increased intensity | Human IgG1(pH) | Intermolecular β-sheet formation | [43] |
© 2018 by the authors. Licensee MDPI, Basel, Switzerland. This article is an open access article distributed under the terms and conditions of the Creative Commons Attribution (CC BY) license (http://creativecommons.org/licenses/by/4.0/).
Share and Cite
Ettah, I.; Ashton, L. Engaging with Raman Spectroscopy to Investigate Antibody Aggregation. Antibodies 2018, 7, 24. https://doi.org/10.3390/antib7030024
Ettah I, Ashton L. Engaging with Raman Spectroscopy to Investigate Antibody Aggregation. Antibodies. 2018; 7(3):24. https://doi.org/10.3390/antib7030024
Chicago/Turabian StyleEttah, Ilokugbe, and Lorna Ashton. 2018. "Engaging with Raman Spectroscopy to Investigate Antibody Aggregation" Antibodies 7, no. 3: 24. https://doi.org/10.3390/antib7030024
APA StyleEttah, I., & Ashton, L. (2018). Engaging with Raman Spectroscopy to Investigate Antibody Aggregation. Antibodies, 7(3), 24. https://doi.org/10.3390/antib7030024