
A New Method to Characterize Conformation-Specific Antibody by a Combination of Agarose Native Gel Electrophoresis and Contact Blotting

Abstract
1. Introduction
1.1. Antibody Production
1.1.1. Anti-PLXDC2 Rabbit Monoclonal Antibody
1.1.2. Anti-SARS-CoV-2 Spike RBD Humanized Monoclonal Antibody
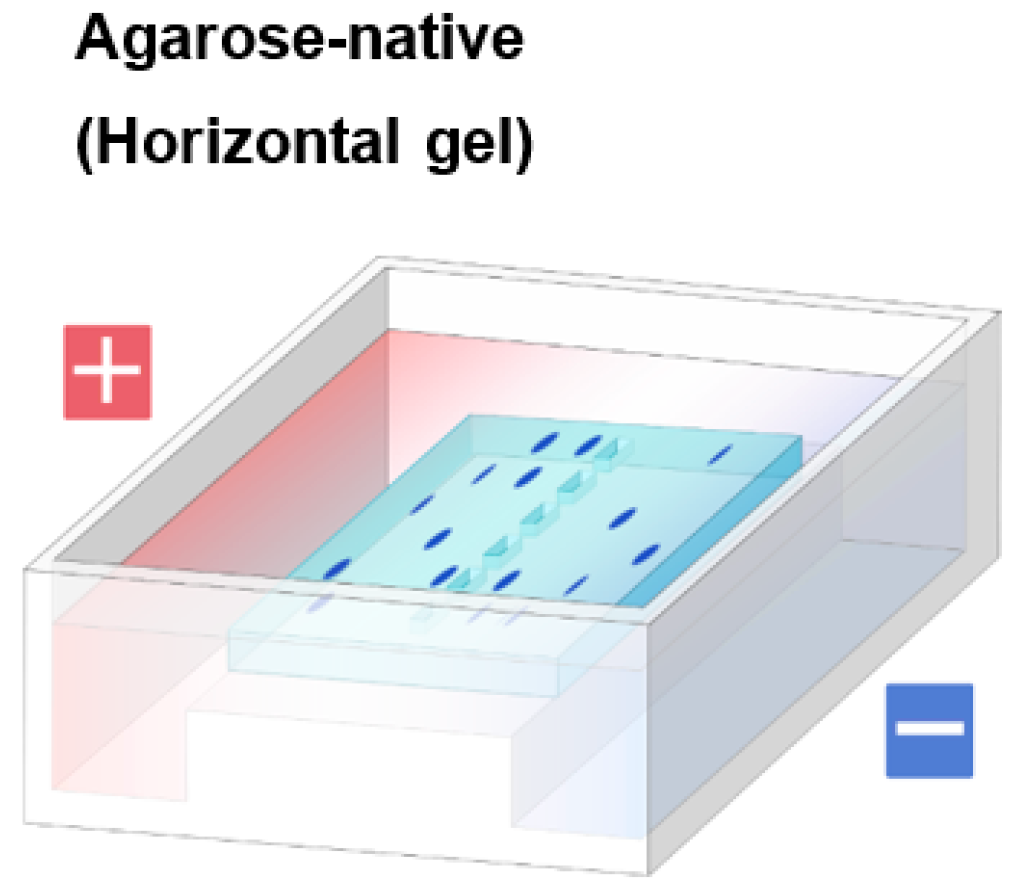
1.2. Agarose Native Gel Electrophoresis
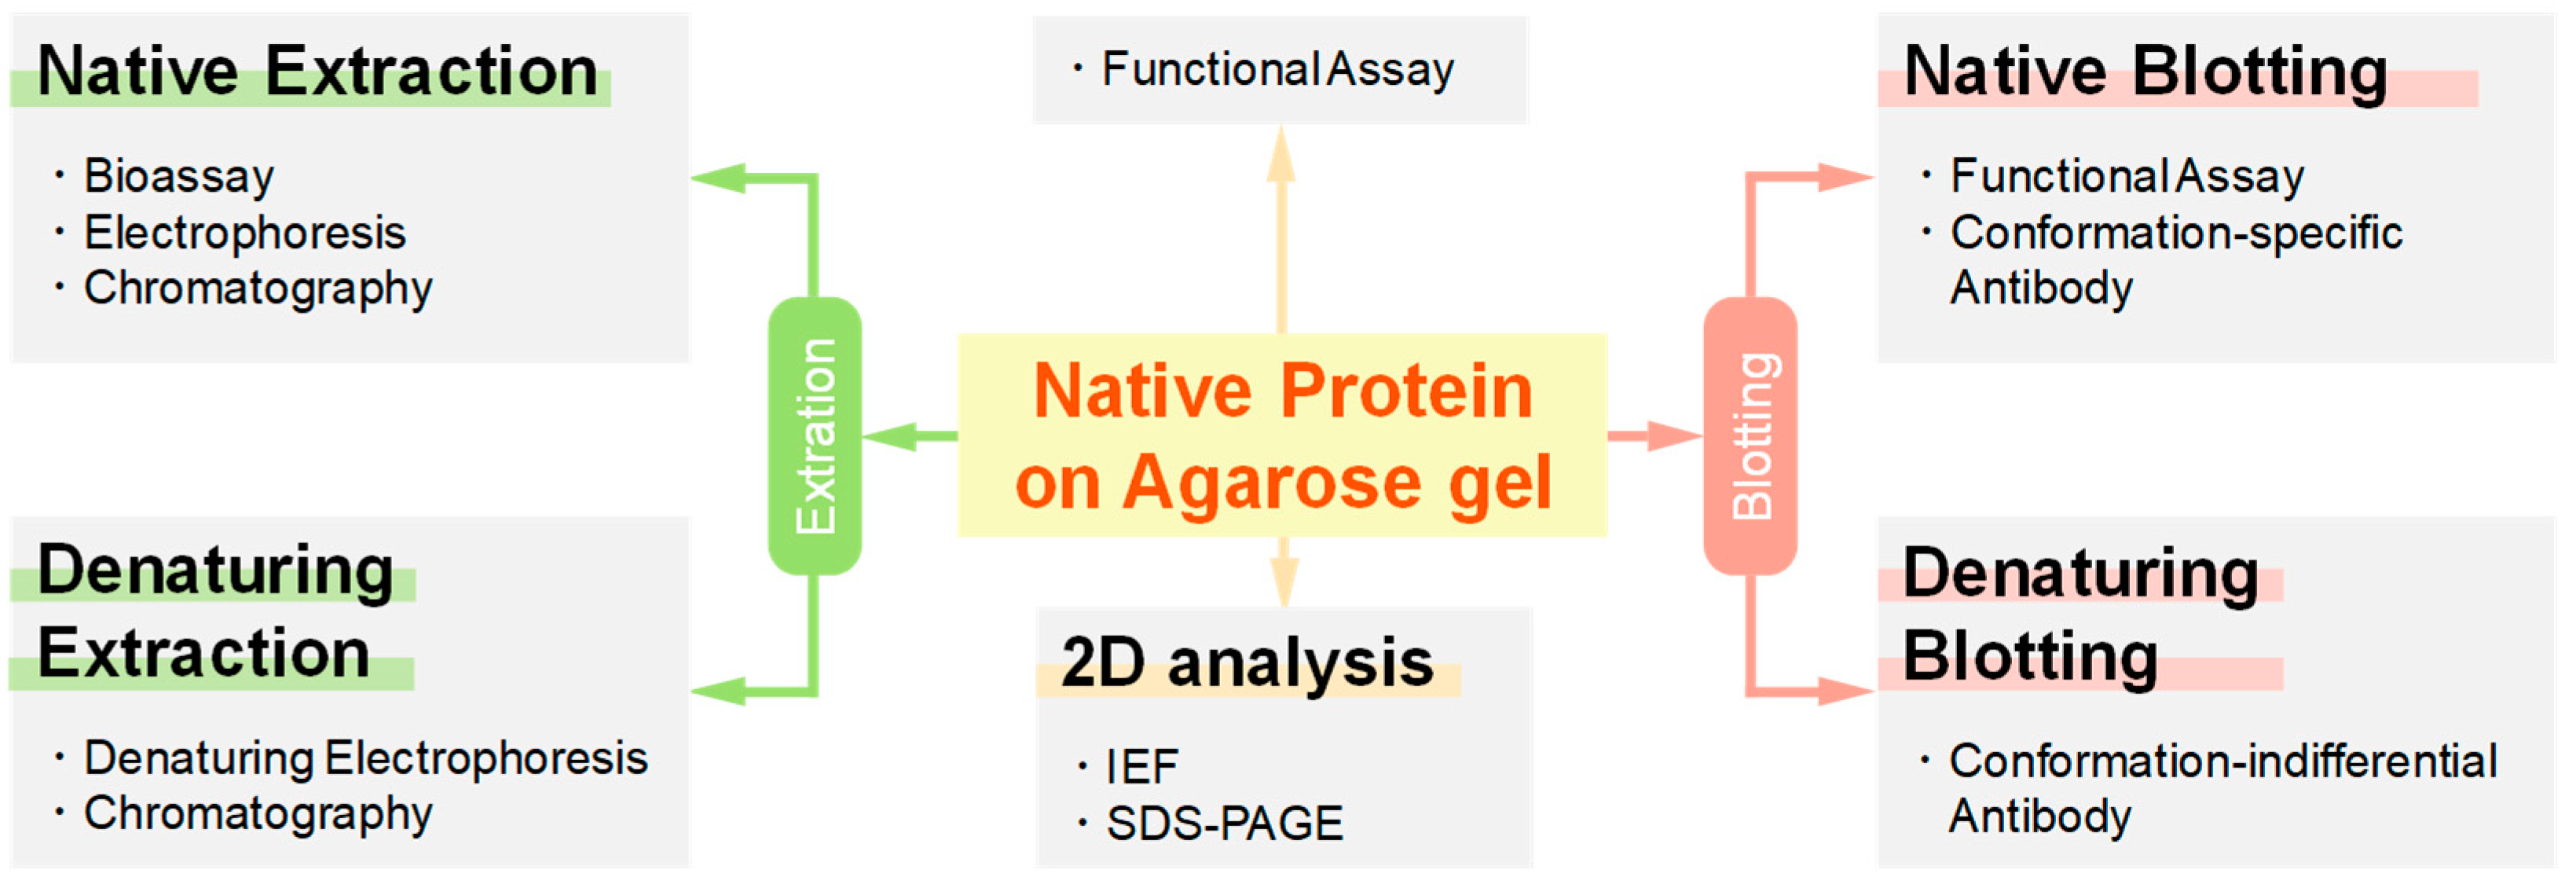
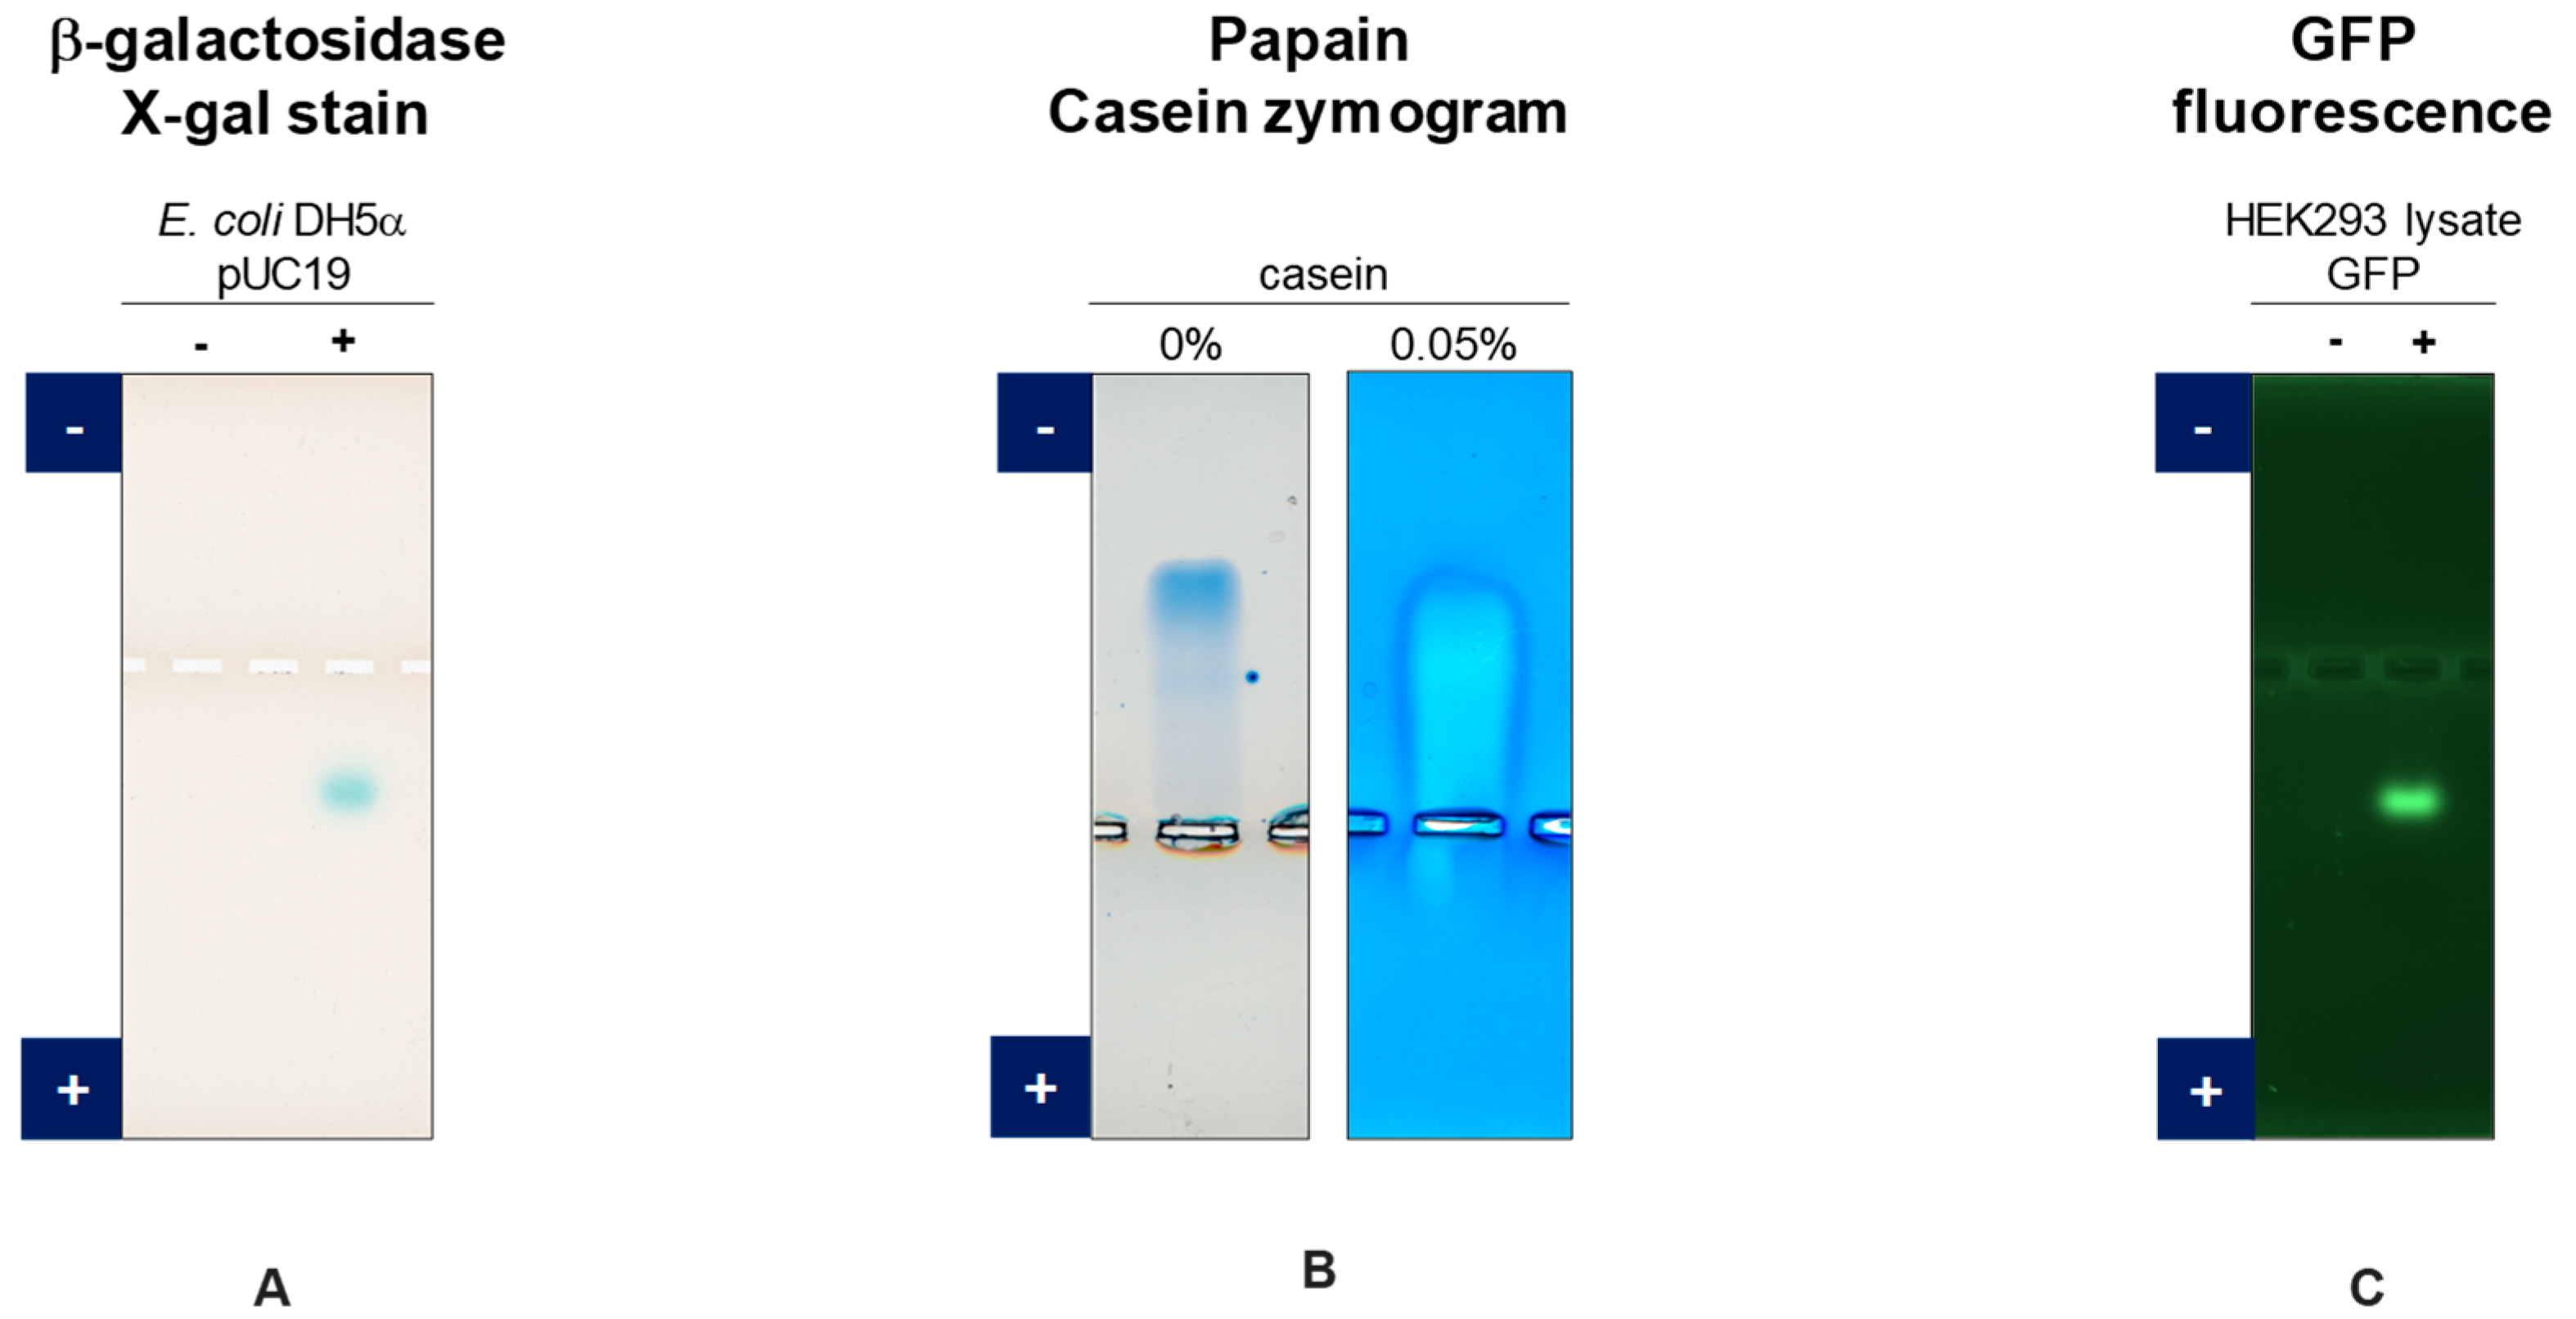
1.3. Potential Applications of Native Proteins on Agarose Gel
2. Blotting Methods
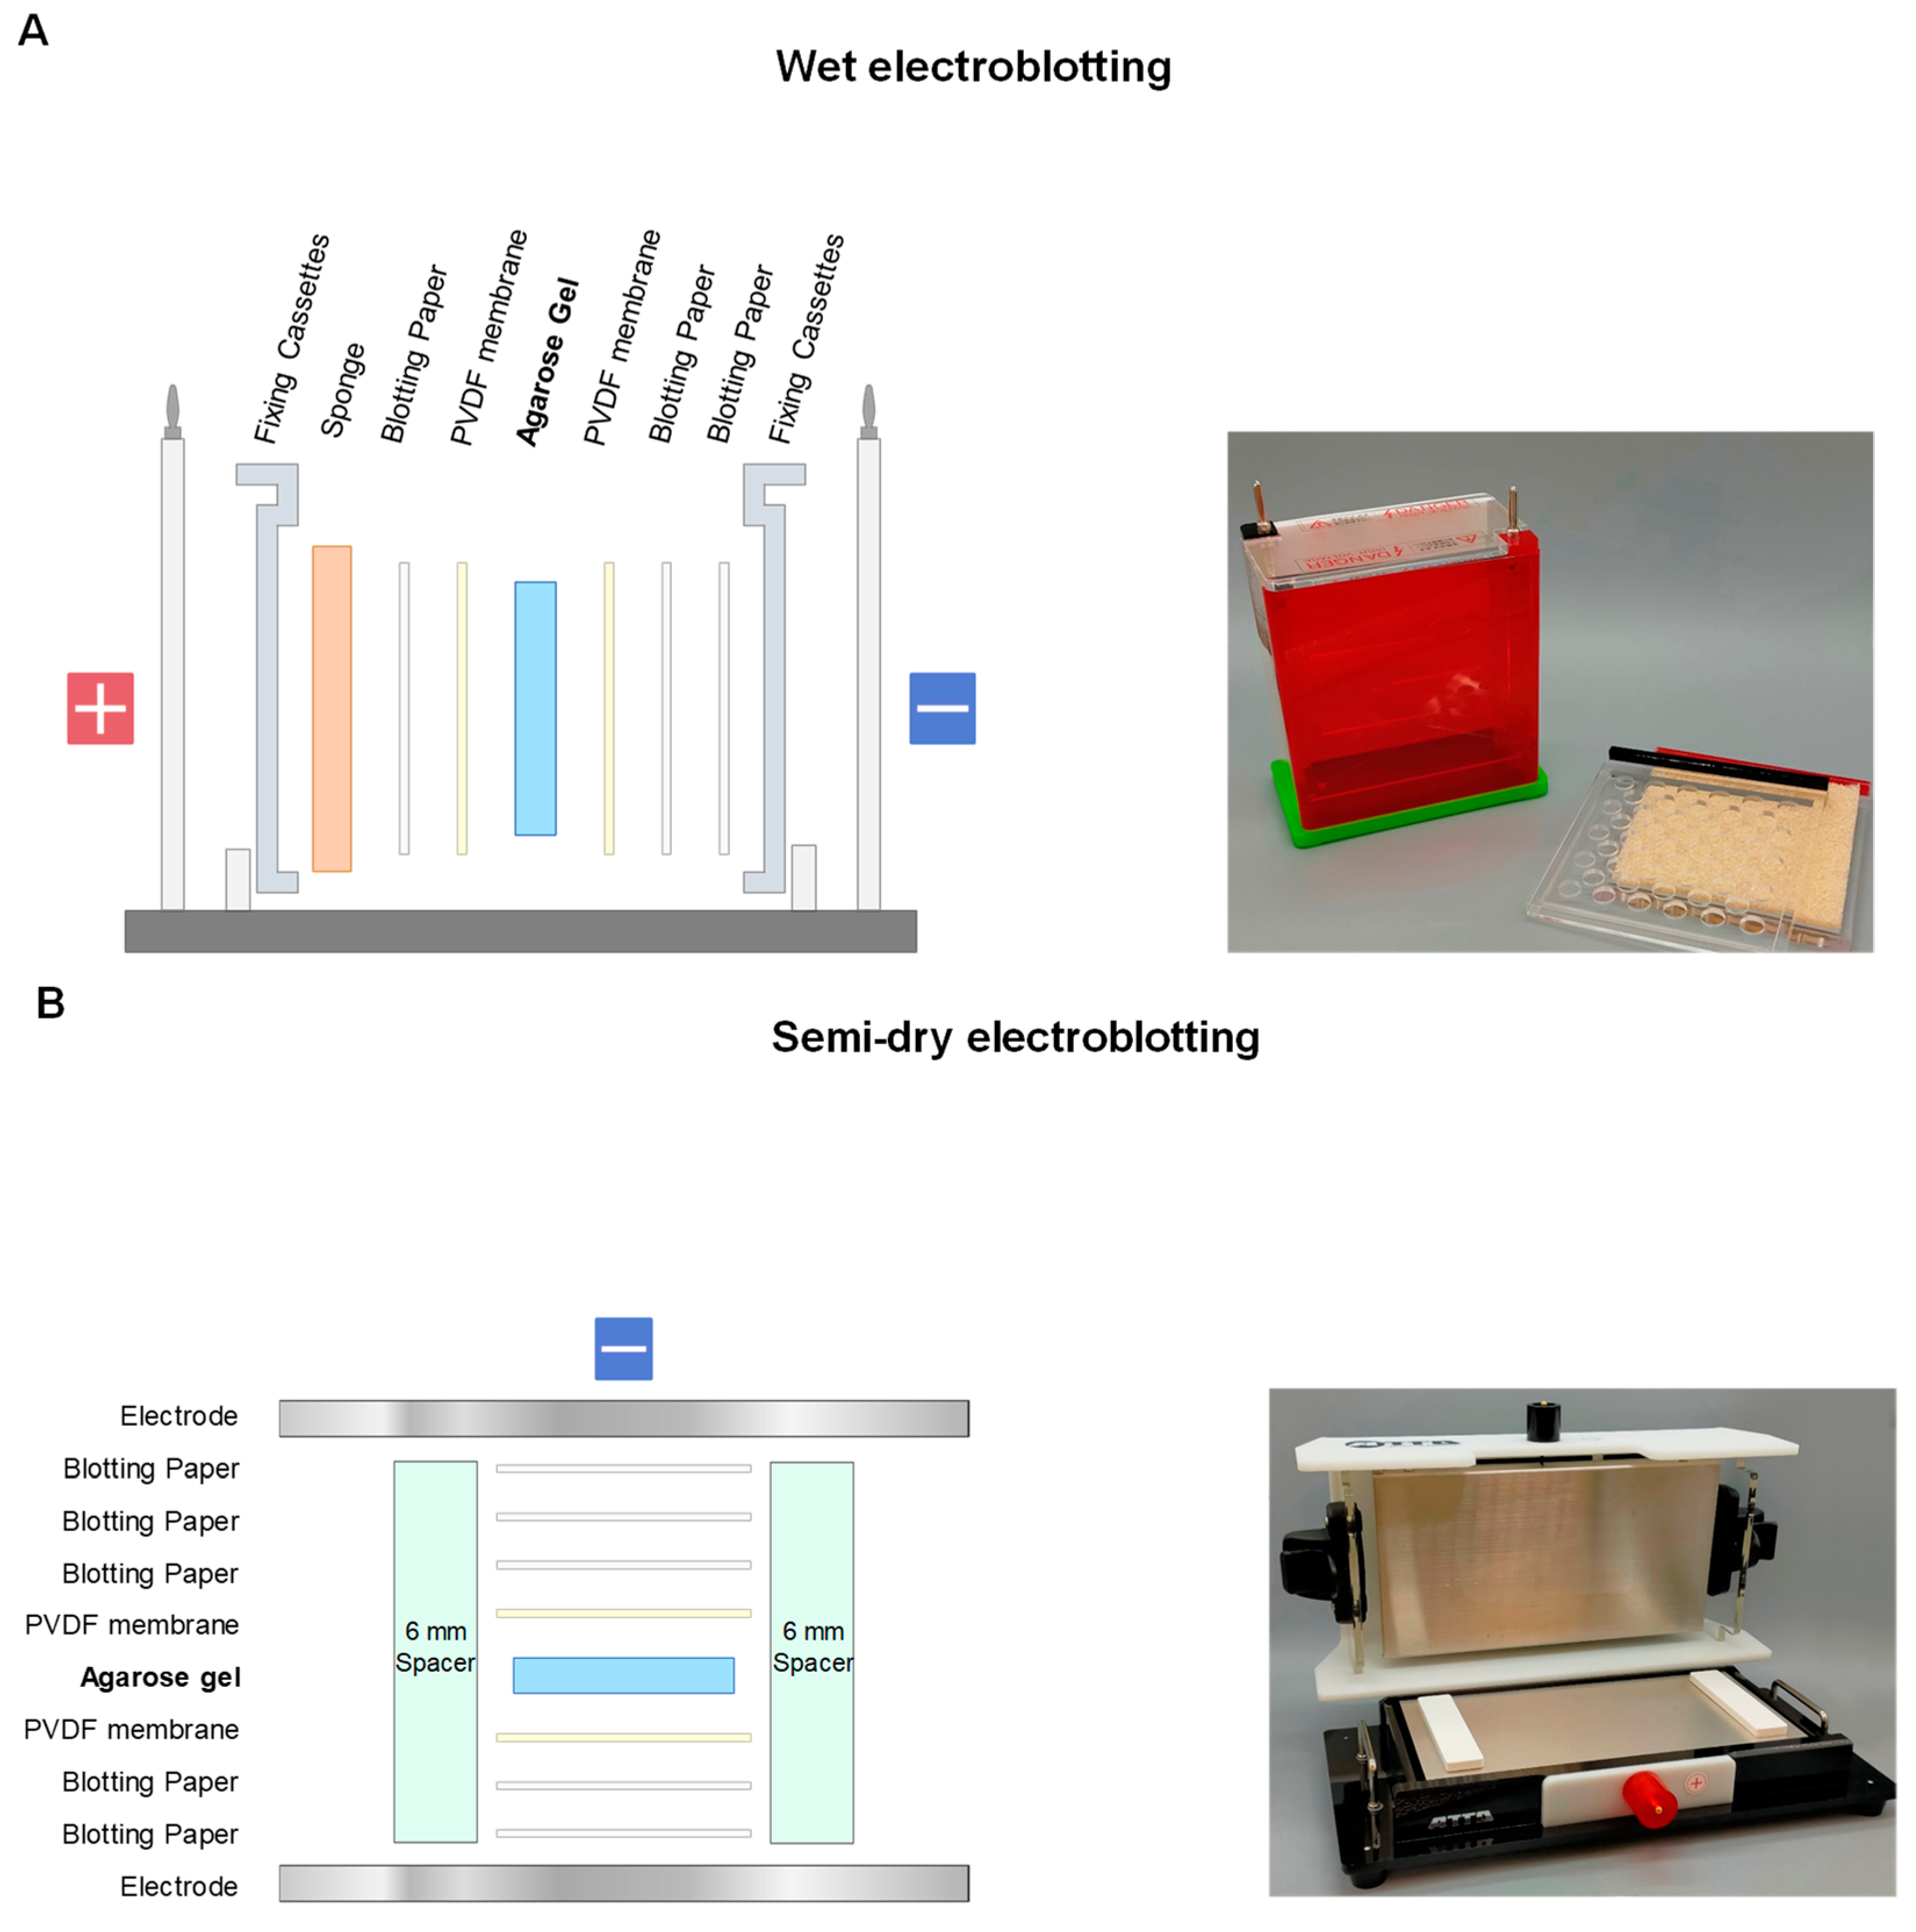
2.1. Electroblotting
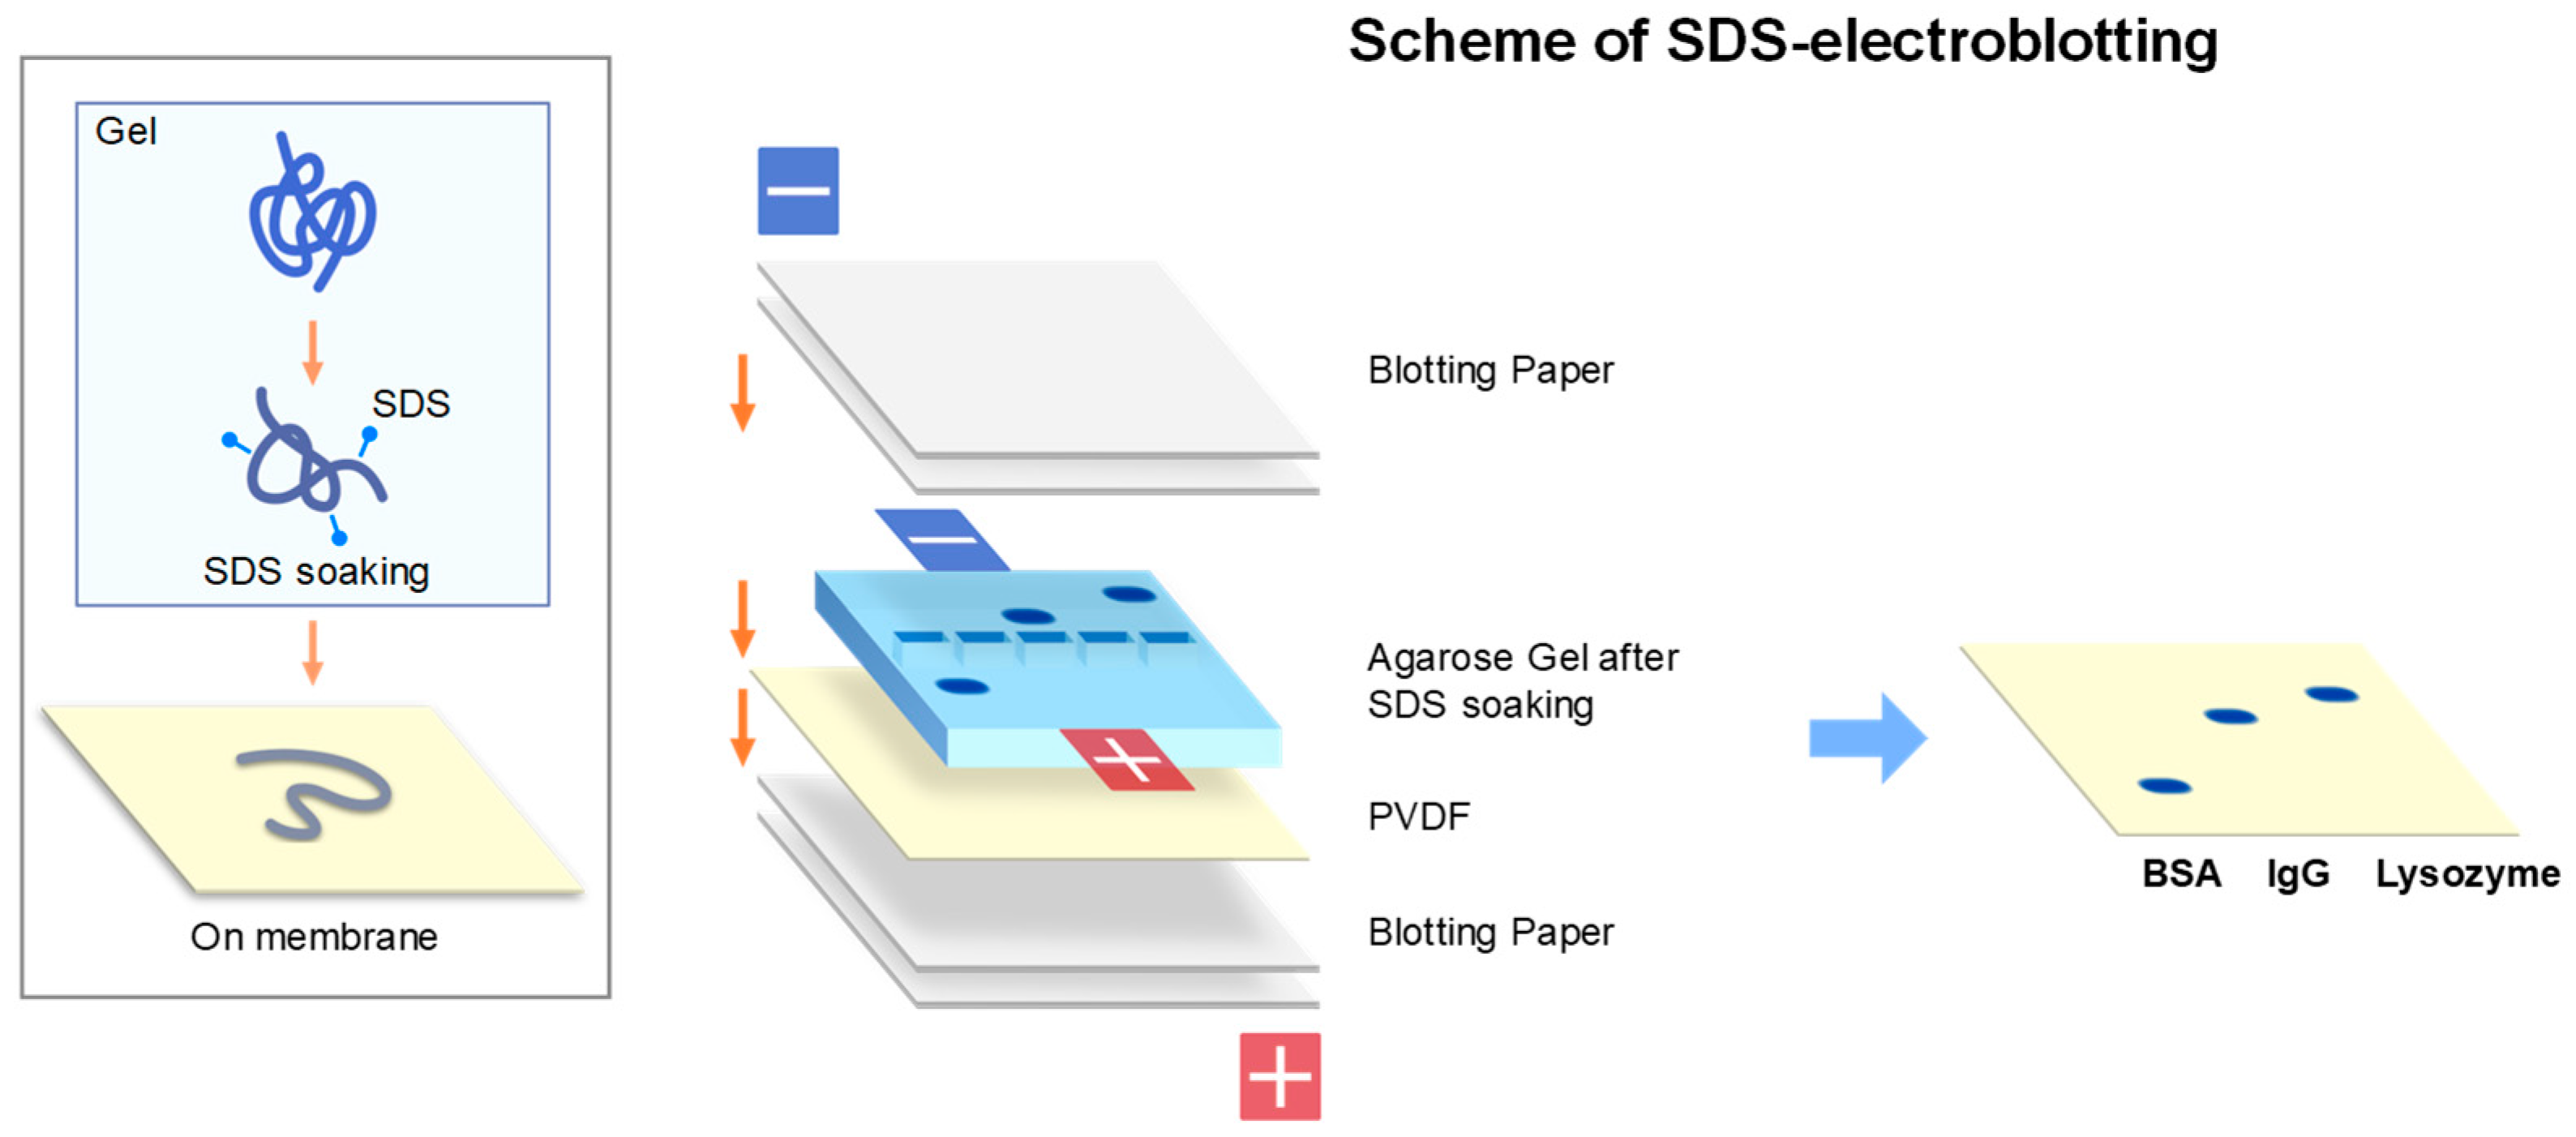
2.2. SDS-Electroblotting
2.3. Contact Blotting
2.4. Comparison of Different Blotting
3. Blotting Examples
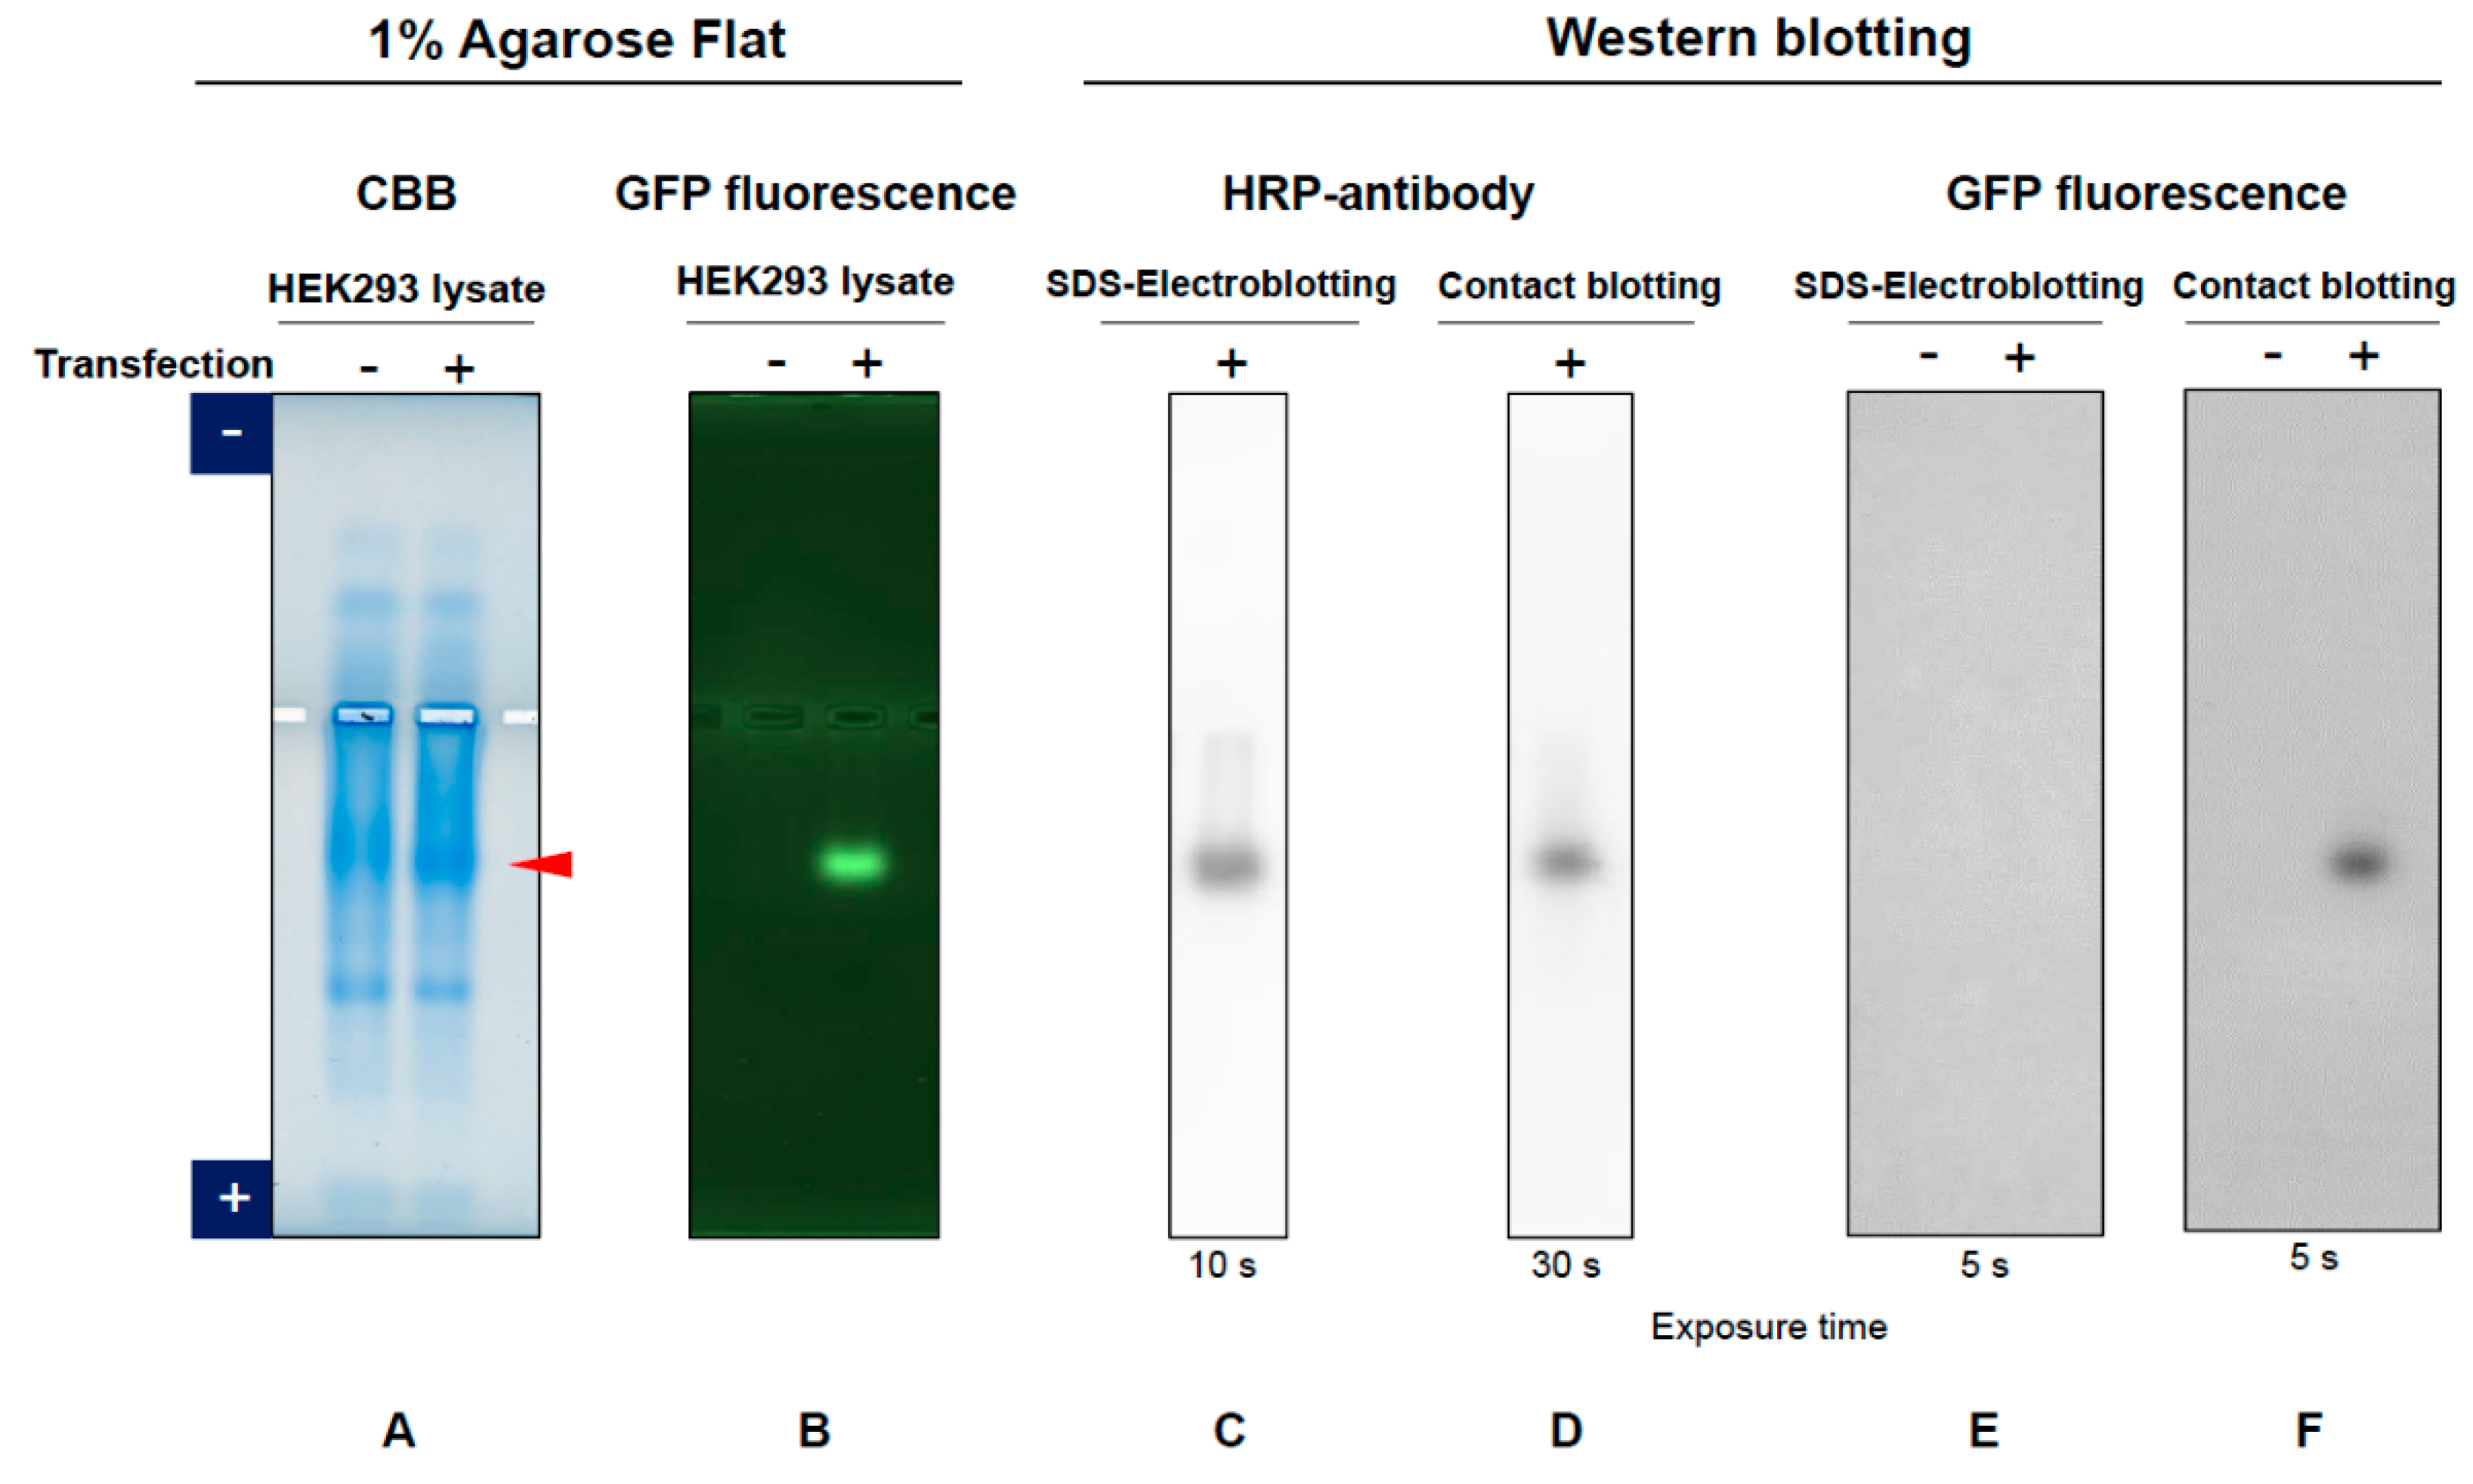
3.1. GFP
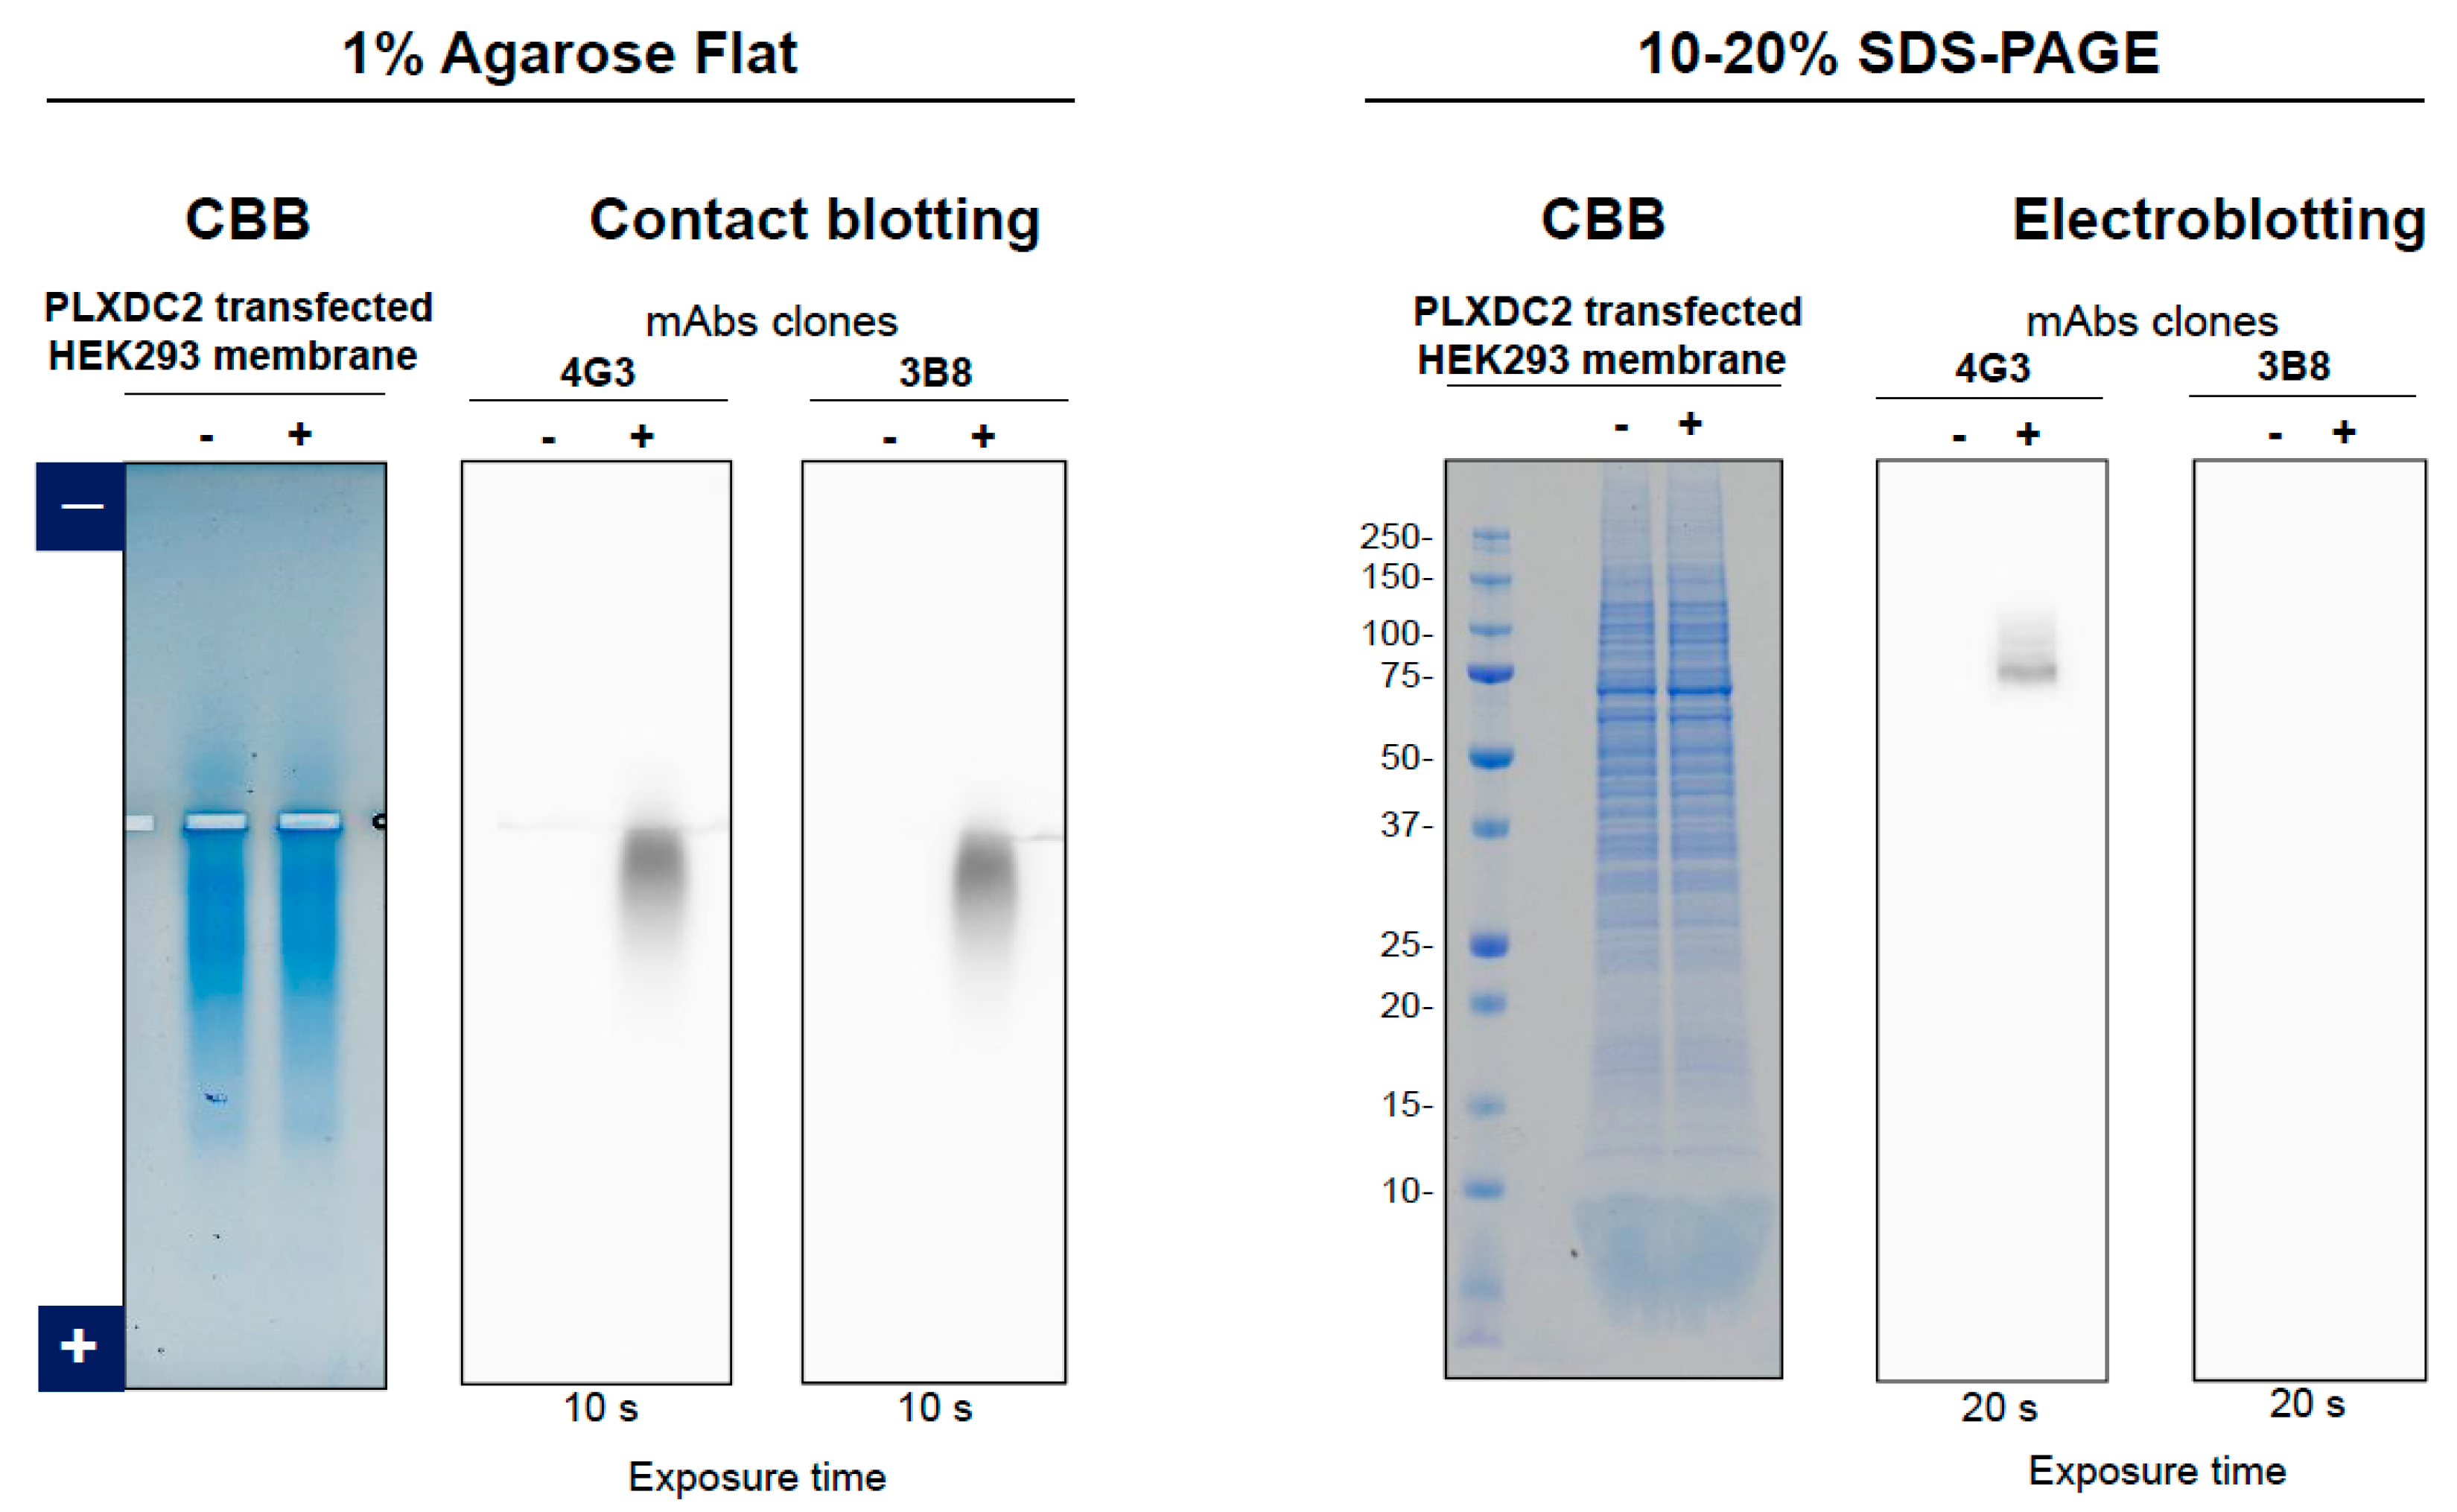
3.2. Anti-PLXDC2
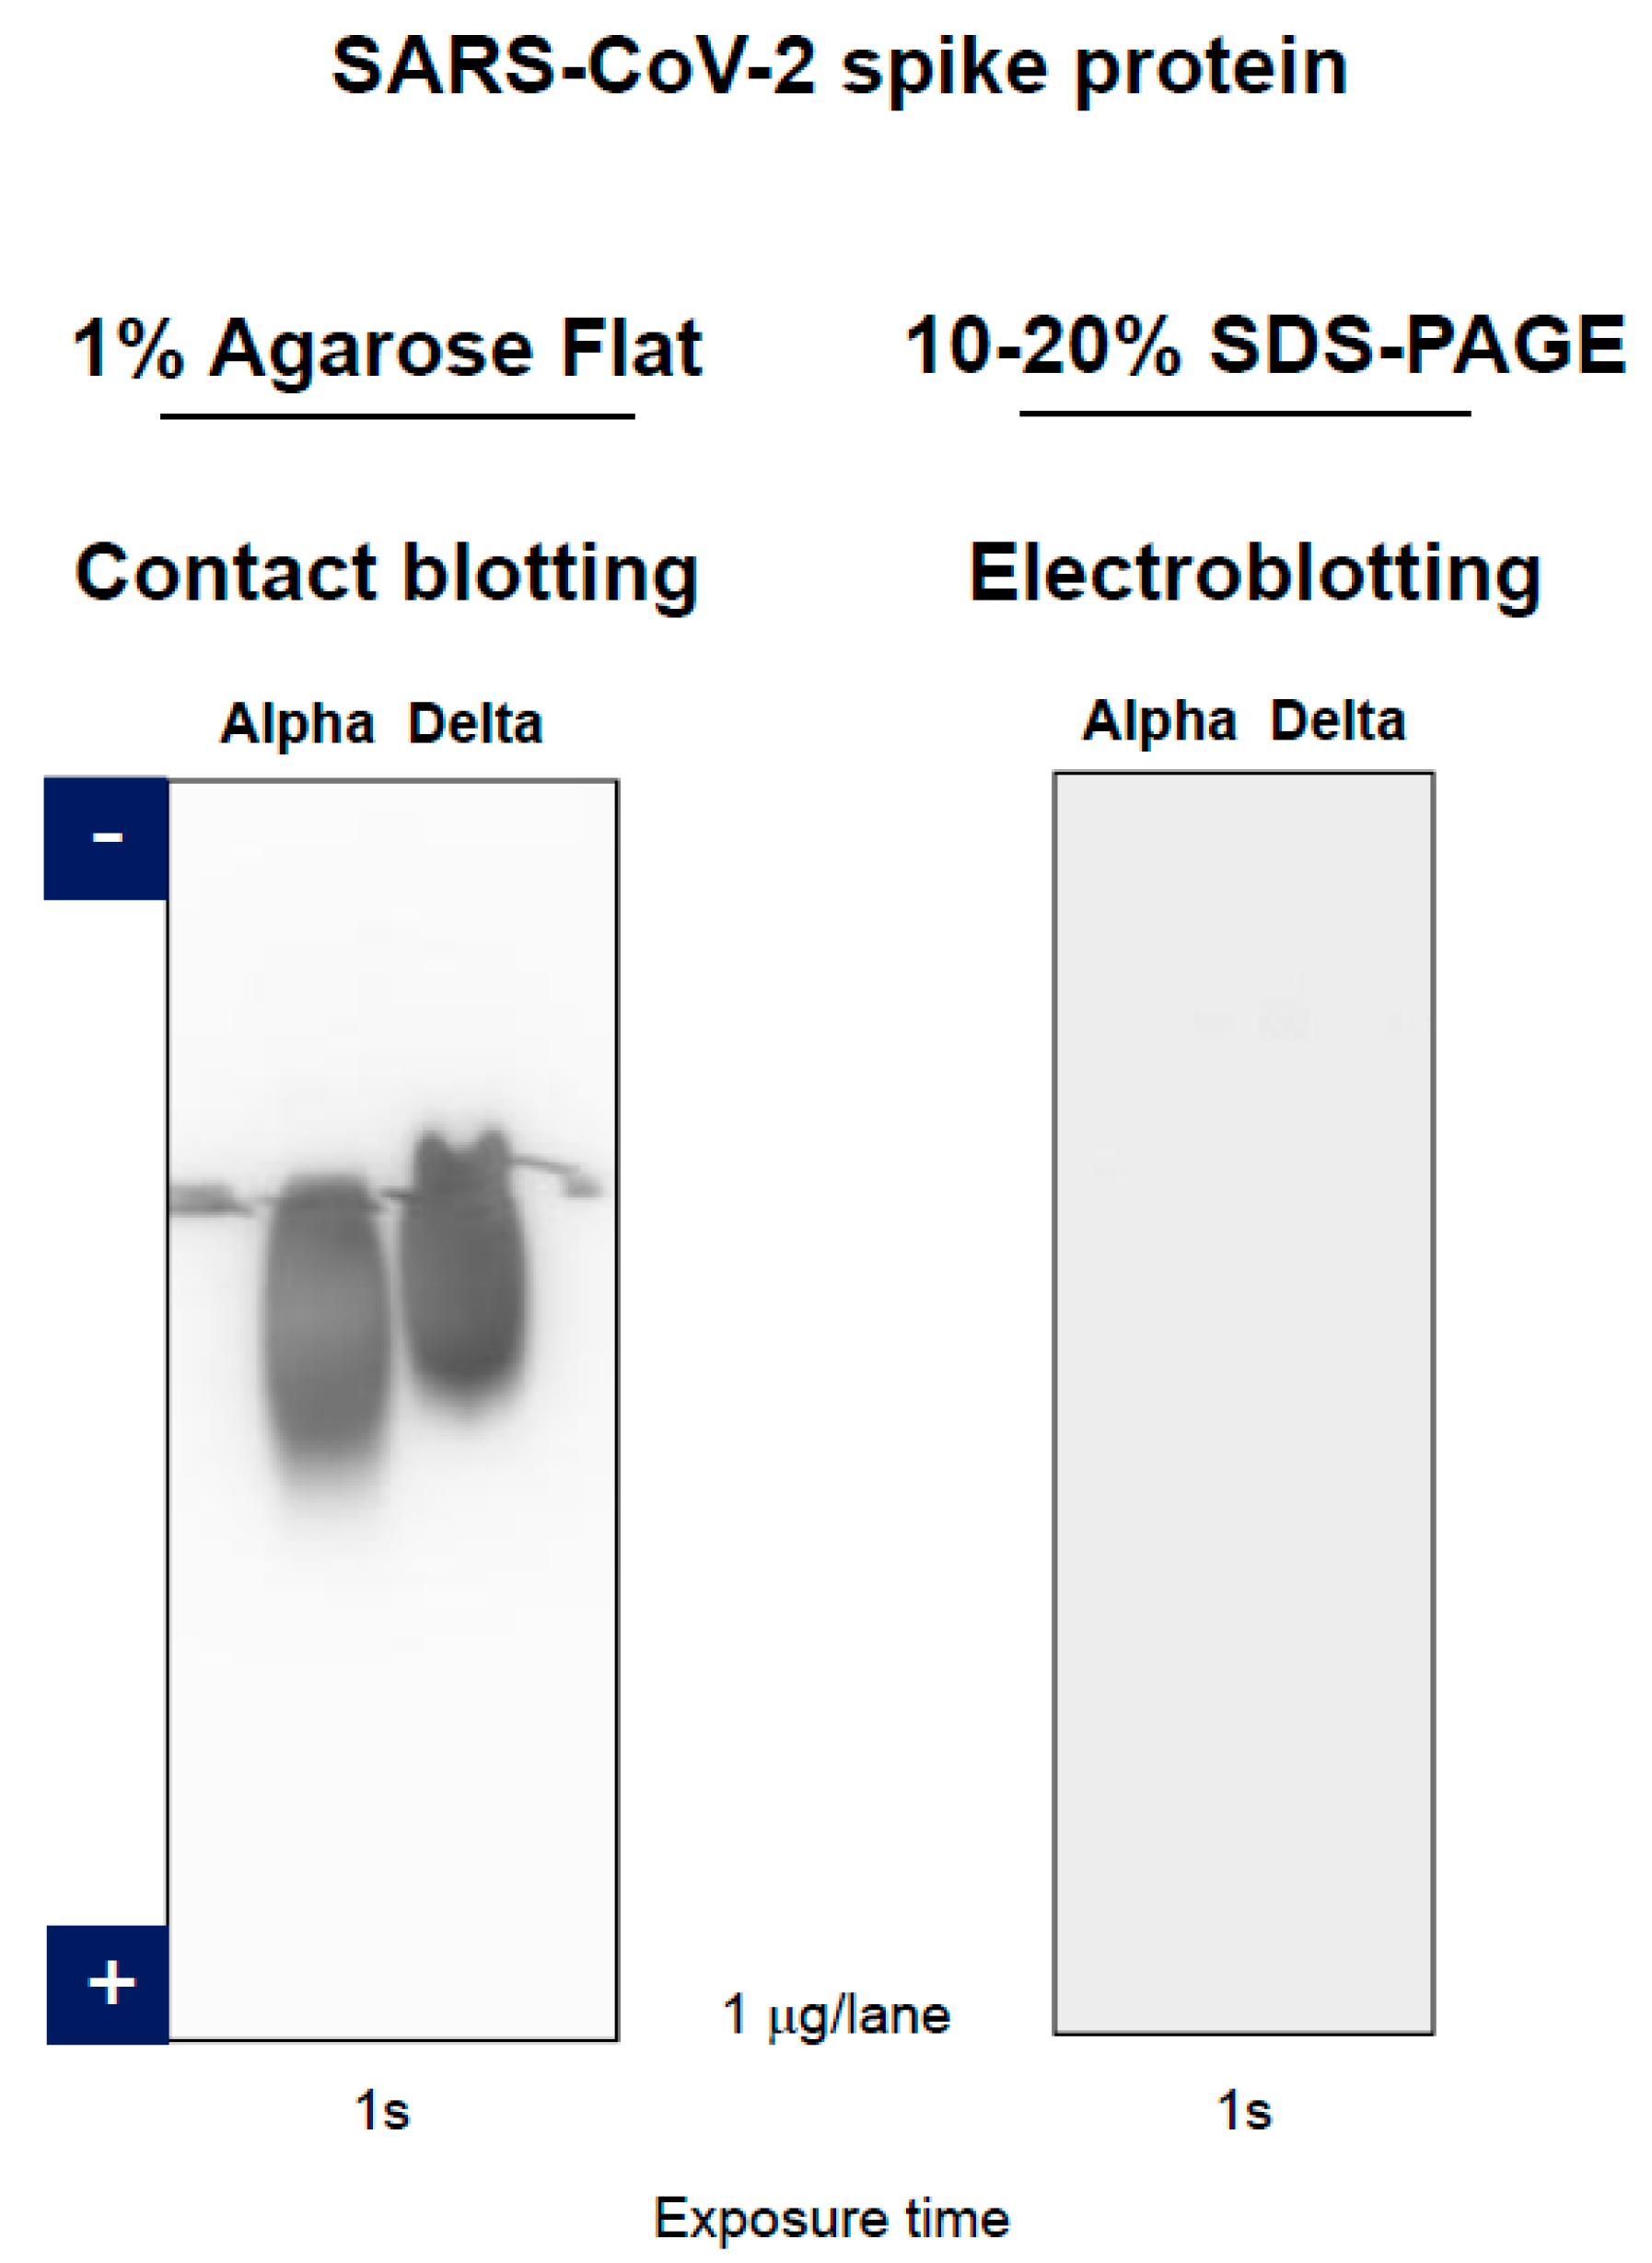
3.3. Anti-SARS-CoV-2 Spike Protein
4. Conclusions
5. Perspective
Author Contributions
Funding
Data Availability Statement
Acknowledgments
Conflicts of Interest
References
- Tiller, K.E.; Tessier, P.M. Advances in antibody design. Annu. Rev. Biomed. Eng. 2015, 17, 191–216. [Google Scholar] [CrossRef] [PubMed]
- Glabe, C.S. Conformation-dependent antibodies target diseases of protein misfolding. Trends Biochem. Sci. 2004, 29, 542–547. [Google Scholar] [CrossRef] [PubMed]
- Kurien, B.T.; Scofield, R.H. Multiple immunoblots by passive diffusion of proteins from a single SDS-PAGE gel. Methods Mol. Biol. 2015, 1312, 77–86. [Google Scholar] [PubMed]
- Paduch, M.; Kossakoff, A.A. Generating conformation and complex-specific synthetic antibodies. Methods Mol. Biol. 2017, 1575, 93–119. [Google Scholar] [PubMed]
- Gao, J.; Sidhu, S.S.; Wells, J.A. Two-state selection of conformation-specific antibodies. Proc. Natl. Acad. Sci. USA 2009, 106, 3071–3076. [Google Scholar] [CrossRef]
- van Dyck, C.H. Anti-amyloid-beta monoclonal antibodies for Alzheimer’s disease: Pitfalls and promise. Biol. Psychiatry 2018, 83, 311–319. [Google Scholar] [CrossRef]
- Murakami, K. Conformation-specific antibodies to target amyloid beta oligomers and their application to immunotherapy for Alzheimer’s disease. Biosci. Biotechnol. Biochem. 2014, 78, 1293–1305. [Google Scholar] [CrossRef]
- Kayed, R.; Head, E.; Thompson, J.L.; McIntire, T.M.; Milton, S.C.; Cotman, C.W.; Blabe, C.G. Common structure of soluble amyloid oligomers implies common mechanism of pathogenesis. Science 2003, 300, 486–489. [Google Scholar] [CrossRef]
- Aydin, S. A short history, principle, and types of ELISA, and our laboratory experience with peptide/protein analysis using ELISA. Peptides 2015, 72, 4–15. [Google Scholar] [CrossRef]
- Citartan, M. Aptamers as the powerhouse of dot blot analysis. Talanta 2021, 232, 122436. [Google Scholar] [CrossRef]
- Piliarik, M.; Vaisocherová, H.; Homola, J. Surface plasmon resonance biosensing. Methods Mol. Biol. 2009, 503, 65–88. [Google Scholar] [PubMed]
- Lin, K.; Wu, G. Isothermal titration calorimetry assays to measure binding affinities in vitro. Methods Mol. Biol. 2019, 1893, 257–272. [Google Scholar]
- Chen, A.; Yang, S. Replacing antibodies with aptamers in lateral flow immunoassay. Biosens. Bioelectron. 2015, 71, 230–242. [Google Scholar] [CrossRef] [PubMed]
- Ortega-Vinuesa, J.L.; Bastos-González, D. A review of factors affecting the performance of latex agglutination tests. J. Biomater. Sci. Poly. Ed. 2001, 12, 379–408. [Google Scholar] [CrossRef] [PubMed]
- Olsen, I.; Wiker, H.G. Diffusion blotting: A rapid and simple method for production of multiple blots from a single gel. Methods Mol. Biol. 2015, 1312, 73–76. [Google Scholar] [PubMed]
- Kakuta, M.; Yamazaki, T.; Hayasaka, A.; Hayashi, Y.; Arakawa, T. Stabilized Antibody-Containing Preparations. EP European Patent 1314437B1, 25 June 2014. [Google Scholar]
- Arakawa, T.; Haniu, M.; Narhi, L.O.; Miller, J.A.; Talvenheimo, J.; Philo, J.S.; Chutem, H.T.; Matheson, C.; Carnahan, J.; Louis, J.C.; et al. Formation of heterodimers from three neurotrophins, nerve growth factor, neurotrophin-3, and brain-derived neurotrophic factor. J. Biol. Chem. 1994, 269, 27833–27839. [Google Scholar] [CrossRef]
- Freeman, L.A. Native-native 2D gel electrophoresis for HDL subpopulation analysis. Methods Mol. Biol. 2013, 1027, 353–367. [Google Scholar]
- Tokunaga, K.; Horai, S.; Omoto, K.; Juji, T.; Nakajima, H. Genetic polymorphism of the fourth component of human complement in Japanese. Jpn. J. Human Genet. 1979, 24, 69–74. [Google Scholar] [CrossRef]
- Jania, A.; Andraszek, K. Application of native agarose gel electrophoresis of serum proteins in veterinary diagnosis. J. Vet. Res. 2016, 60, 501–508. [Google Scholar] [CrossRef]
- Wu, S.; Zhao, Q.; Zhang, P.; Kulp, J.; Hu, L.; Hwang, N.; Zhang, J.; Block, T.M.; Xu, X.; Du, Y.; et al. Discovery and mechanistic study of benzamide derivatives that modulate hepatitis B virus capsid assembly. J. Virol. 2017, 91, e00519-17. [Google Scholar] [CrossRef]
- Holmberg, M.; Nollen, E.A. Analyzing modifiers of protein aggregation in C. elegans by native agarose gel electrophoresis. Methods Mol. Biol. 2013, 1017, 193–199. [Google Scholar] [PubMed]
- Sakuma, N.; Saeki, T.; Ito, T.; Hibino, T.; Suzuki, S.; Kunimatsu, M.; Yamamoto, K.; Kitada, S. HDL2 can inhibit further oxidative modification of partially oxidized LDL. J. Atheroscler. Thromb. 2010, 17, 229–234. [Google Scholar] [CrossRef] [PubMed][Green Version]
- Abrahamson, M.; Mason, R.W.; Hansson, H.; Buttle, D.; Grubb, A. Human cystatin C. Role of the N-terminal segment in the inhibition of human cysteine proteinases and its inactivation by leucocyte elastase. Biochem. J. 1991, 273, 621–626. [Google Scholar] [CrossRef] [PubMed]
- Lissitzky, J.C.S.; Charpin, C.; Bignon, C.; Bouzon, M.; Kopp, F.; Delori, P.; Martin, P.M. Laminin biosynthesis in the extracellular matrix-producing cell line PFHR9 studied with monoclonal and polyclonal antibodies. Biochem. J. 1988, 290, 843–852. [Google Scholar] [CrossRef]
- Fremont, L.; Riazi, A. Biochemical analysis of vitellogenin from rainbow trout (Salmo gairdneri): Fatty acid composition of phos pholipids. Reprod. Nutr. Dev. 1988, 28, 939–952. [Google Scholar] [CrossRef]
- Haberland, M.E.; Fless, G.M.; Scanu, A.M.; Fogelman, A.M. Malondialdehyde modification of lipoprotein(a) produces avid up take by human monocyte-macrophage. J. Biol. Chem. 1992, 267, 4143–4151. [Google Scholar] [CrossRef]
- Kobayashi, K.; Watanabe, J.; Umeda, F.; Nawata, H. Glycation accelerates the oxidation of low density lipoprotein by copper ions. Endocr. J. 1995, 42, 461–465. [Google Scholar] [CrossRef]
- Abrahamson, M.; Dalbøge, H.; Olafsson, I.; Carlsen, S.; Grubb, A. Efficient production of native, biologically active human cys tatin C by Escherichia coli. FEBS Lett. 1988, 236, 14–18. [Google Scholar] [CrossRef]
- Kim, R. Native Agarose Gel Elecrophoresis of Multiprotein Complexes; Cold Spring Harbor Protocols: Cold Spring Harbor, NY, USA, 2011. [Google Scholar] [CrossRef]
- Ishii, M.; Nakakido, M.; Caaveiro, J.M.M.; Kuroda, D.; Okumura, C.J.; Maruyama, T.; Entzminger, K.; Tsumoto, K. Structural basis for antigen recognition by methylated lysine-specfic antibodies. J. Biol. Chem. 2021, 296, 100176. [Google Scholar] [CrossRef]
- Arakawa, T.; Nakagawa, M.; Tomioka, Y.; Sakuma, C.; Li, C.; Sato, T.; Sato, R.; SHibata, T.; Kurosawa, Y.; Akuta, T. Gel-electro phoresis based method for biomolecular interaction. Methods Cell Biol. 2022, in press. [Google Scholar] [CrossRef]
- McLellan, T. Electrophoresis buffers for polyacrylamide gels at various pH. Anal. Biochem. 1982, 126, 94–99. [Google Scholar] [CrossRef]
- Li, C.; Arakawa, T. Agarose native gel electrophoresis of proteins. Int. J. Biol. Macromol. 2019, 140, 668–671. [Google Scholar] [CrossRef] [PubMed]
- Li, C.; Akuta, T.; Nakagawa, M.; Sato, T.; Shibata, T.; Maruyama, T.; Okumura, C.J.; Kurosawa, Y.; Arakawa, T. Agarose native gel electrophoresis for characterization of antibodies. Int. J. Biol. Macromol. 2020, 151, 885–890. [Google Scholar] [CrossRef] [PubMed]
- Sakuma, C.; Sato, T.; Shibata, T.; Nakagawa, M.; Kurosawa, Y.; Okumura, C.J.; Maruyama, T.; Arakawa, T.; Akuta, T. Western blotting analysis of proteins separated by agarose native gel electrophoresis. Int. J. Biol. Macromol. 2021, 166, 1106–1110. [Google Scholar] [CrossRef] [PubMed]
- Sakuma, C.; Tomioka, Y.; Li, C.; Shibata, T.; Nakagawa, M.; Kurosawa, Y.; Arakawa, T.; Akuta, T. Analysis of protein denature ation, aggregation and post-translational modification by agarose native gel electrophoresis. Int. J. Biol. Macromol. 2021, 172, 589–596. [Google Scholar] [CrossRef]
- Nakagawa, M.; Tomioka, Y.; Sakuma, C.; Sato, R.; Shibata, T.; Kurosawa, Y.; Sato, Y.; Ono, Y.; Arakawa, T.; Akuta, T. Optimi zation and application of silver staining of non-glycosylated and glycosylated proteins and nucleic acids for agarose native gel electrophoresis. Int. J. Biol. Macromol. 2021, 189, 869–878. [Google Scholar] [CrossRef]
- Tomioka, Y.; Arakawa, T.; Akuta, T.; Nakagawa, M.; Ishibashi, M. Analysis of proteins by agarose native gel electrophoresis in the presence pf solvent additives. Int. J. Biol. Macromol. 2022, 198, 26–36. [Google Scholar] [CrossRef]
- Perera, H.K.I. Detection of aspartic proteinase activities using gel zymography. Methods Mol. Biol. 2017, 1626, 43–52. [Google Scholar]
- Langley, K.E.; Villarejo, M.R.; Fowler, A.V.; Zamenhof, P.J.; Zabin, I. Molecular basis of beta-galactosidase alpha-complementa tion. Proc. Natl. Acad. Sci. USA 1975, 72, 1254–1257. [Google Scholar] [CrossRef]
- Mamboya, F.; Amri, E. Papain, a plant enzyme of biological importance: A review. Am. J. Biochem. Biotechnol. 2012, 8, 99–104. [Google Scholar]
- Burnette, W.N. “Western blotting”: Electrophoretic transfer of proteins from sodium dodecylsulfate-polyacrylamide gel to un modified nitrocellulose ad radiographic detection with antibody and radioiodinated protein A. Anal. Biochem. 1981, 112, 195–203. [Google Scholar] [CrossRef]
- Burnette, W.N. Western blotting: Remembrance of things past. In Western Blotting; Humana Press: New York, NY, USA, 2015; Volume 1312, pp. 9–12. [Google Scholar]
- Burnette, W.N. Western Blotting: Origin and ascent of the species. In Detection of Blotted Proteins; Humana Press: New York, NY, USA, 2015; Volume 1314, pp. 1–3. [Google Scholar]
- Southern, E.M. Detection of specific sequences among DNA fragments separated by gel electrophoresis. J. Mol. Biol. 1975, 98, 503–517. [Google Scholar] [CrossRef]
- Sakuma, C.; Nakagawa, M.; Tomioka, Y.; Maruyama, T.; Entzminger, K.; Fleming, J.K.; Shibata, T.; Kurosawa, Y.; Okumura, C.J.; Arakawa, T.; et al. Western blotting of native proteins from agarose gels. BioTechnique 2022. [Google Scholar] [CrossRef] [PubMed]


Publisher’s Note: MDPI stays neutral with regard to jurisdictional claims in published maps and institutional affiliations. |
© 2022 by the authors. Licensee MDPI, Basel, Switzerland. This article is an open access article distributed under the terms and conditions of the Creative Commons Attribution (CC BY) license (https://creativecommons.org/licenses/by/4.0/).
Share and Cite
Akuta, T.; Maruyama, T.; Sakuma, C.; Nakagawa, M.; Tomioka, Y.; Entzminger, K.; Fleming, J.K.; Sato, R.; Shibata, T.; Kurosawa, Y.; et al. A New Method to Characterize Conformation-Specific Antibody by a Combination of Agarose Native Gel Electrophoresis and Contact Blotting. Antibodies 2022, 11, 36. https://doi.org/10.3390/antib11020036
Akuta T, Maruyama T, Sakuma C, Nakagawa M, Tomioka Y, Entzminger K, Fleming JK, Sato R, Shibata T, Kurosawa Y, et al. A New Method to Characterize Conformation-Specific Antibody by a Combination of Agarose Native Gel Electrophoresis and Contact Blotting. Antibodies. 2022; 11(2):36. https://doi.org/10.3390/antib11020036
Chicago/Turabian StyleAkuta, Teruo, Toshiaki Maruyama, Chiaki Sakuma, Masataka Nakagawa, Yui Tomioka, Kevin Entzminger, Jonathan K. Fleming, Ryo Sato, Takashi Shibata, Yasunori Kurosawa, and et al. 2022. "A New Method to Characterize Conformation-Specific Antibody by a Combination of Agarose Native Gel Electrophoresis and Contact Blotting" Antibodies 11, no. 2: 36. https://doi.org/10.3390/antib11020036
APA StyleAkuta, T., Maruyama, T., Sakuma, C., Nakagawa, M., Tomioka, Y., Entzminger, K., Fleming, J. K., Sato, R., Shibata, T., Kurosawa, Y., Okumura, C. J., & Arakawa, T. (2022). A New Method to Characterize Conformation-Specific Antibody by a Combination of Agarose Native Gel Electrophoresis and Contact Blotting. Antibodies, 11(2), 36. https://doi.org/10.3390/antib11020036