Nonlinear Mechanisms of PM2.5 and O3 Response to 2D/3D Building and Green Space Patterns in Guiyang City, China
Abstract
1. Introduction
2. Materials and Methods
2.1. Study Area
2.2. Datasets
2.2.1. Air Pollution Data
2.2.2. Land Use Data
2.2.3. Tree Height Dataset
2.2.4. Building, Road and Water Data
2.3. Methods
2.3.1. Two- and Three-Dimensional Urban Landscape Pattern Indices
2.3.2. XGBoost Model
2.3.3. SHAP Model
3. Results
3.1. Spatiotemporal Patterns of PM2.5 and O3
3.1.1. Time Variation Characteristics of PM2.5 and O3 Concentrations
3.1.2. Spatial Distribution Characteristics of PM2.5 and O3
3.2. Analysis of Urban 2D/3D Landscape Patterns
3.2.1. Spatial Distributions of Buildings Height
3.2.2. Spatial Patterns of 2D/3D Landscape Indices
3.3. Relationship Between PM2.5, O3 and 2D/3D Landscape Indices
3.4. Relationship Between PM2.5, O3 and 2D/3D Landscape Indices
3.4.1. Relative Impacts of 3D Landscape Indices on PM2.5 and O3
3.4.2. Marginal Effect of 2D/3D Landscape Indices on PM2.5 and O3
4. Discussion
5. Policy Recommendations and Limitations
6. Conclusions
- (1)
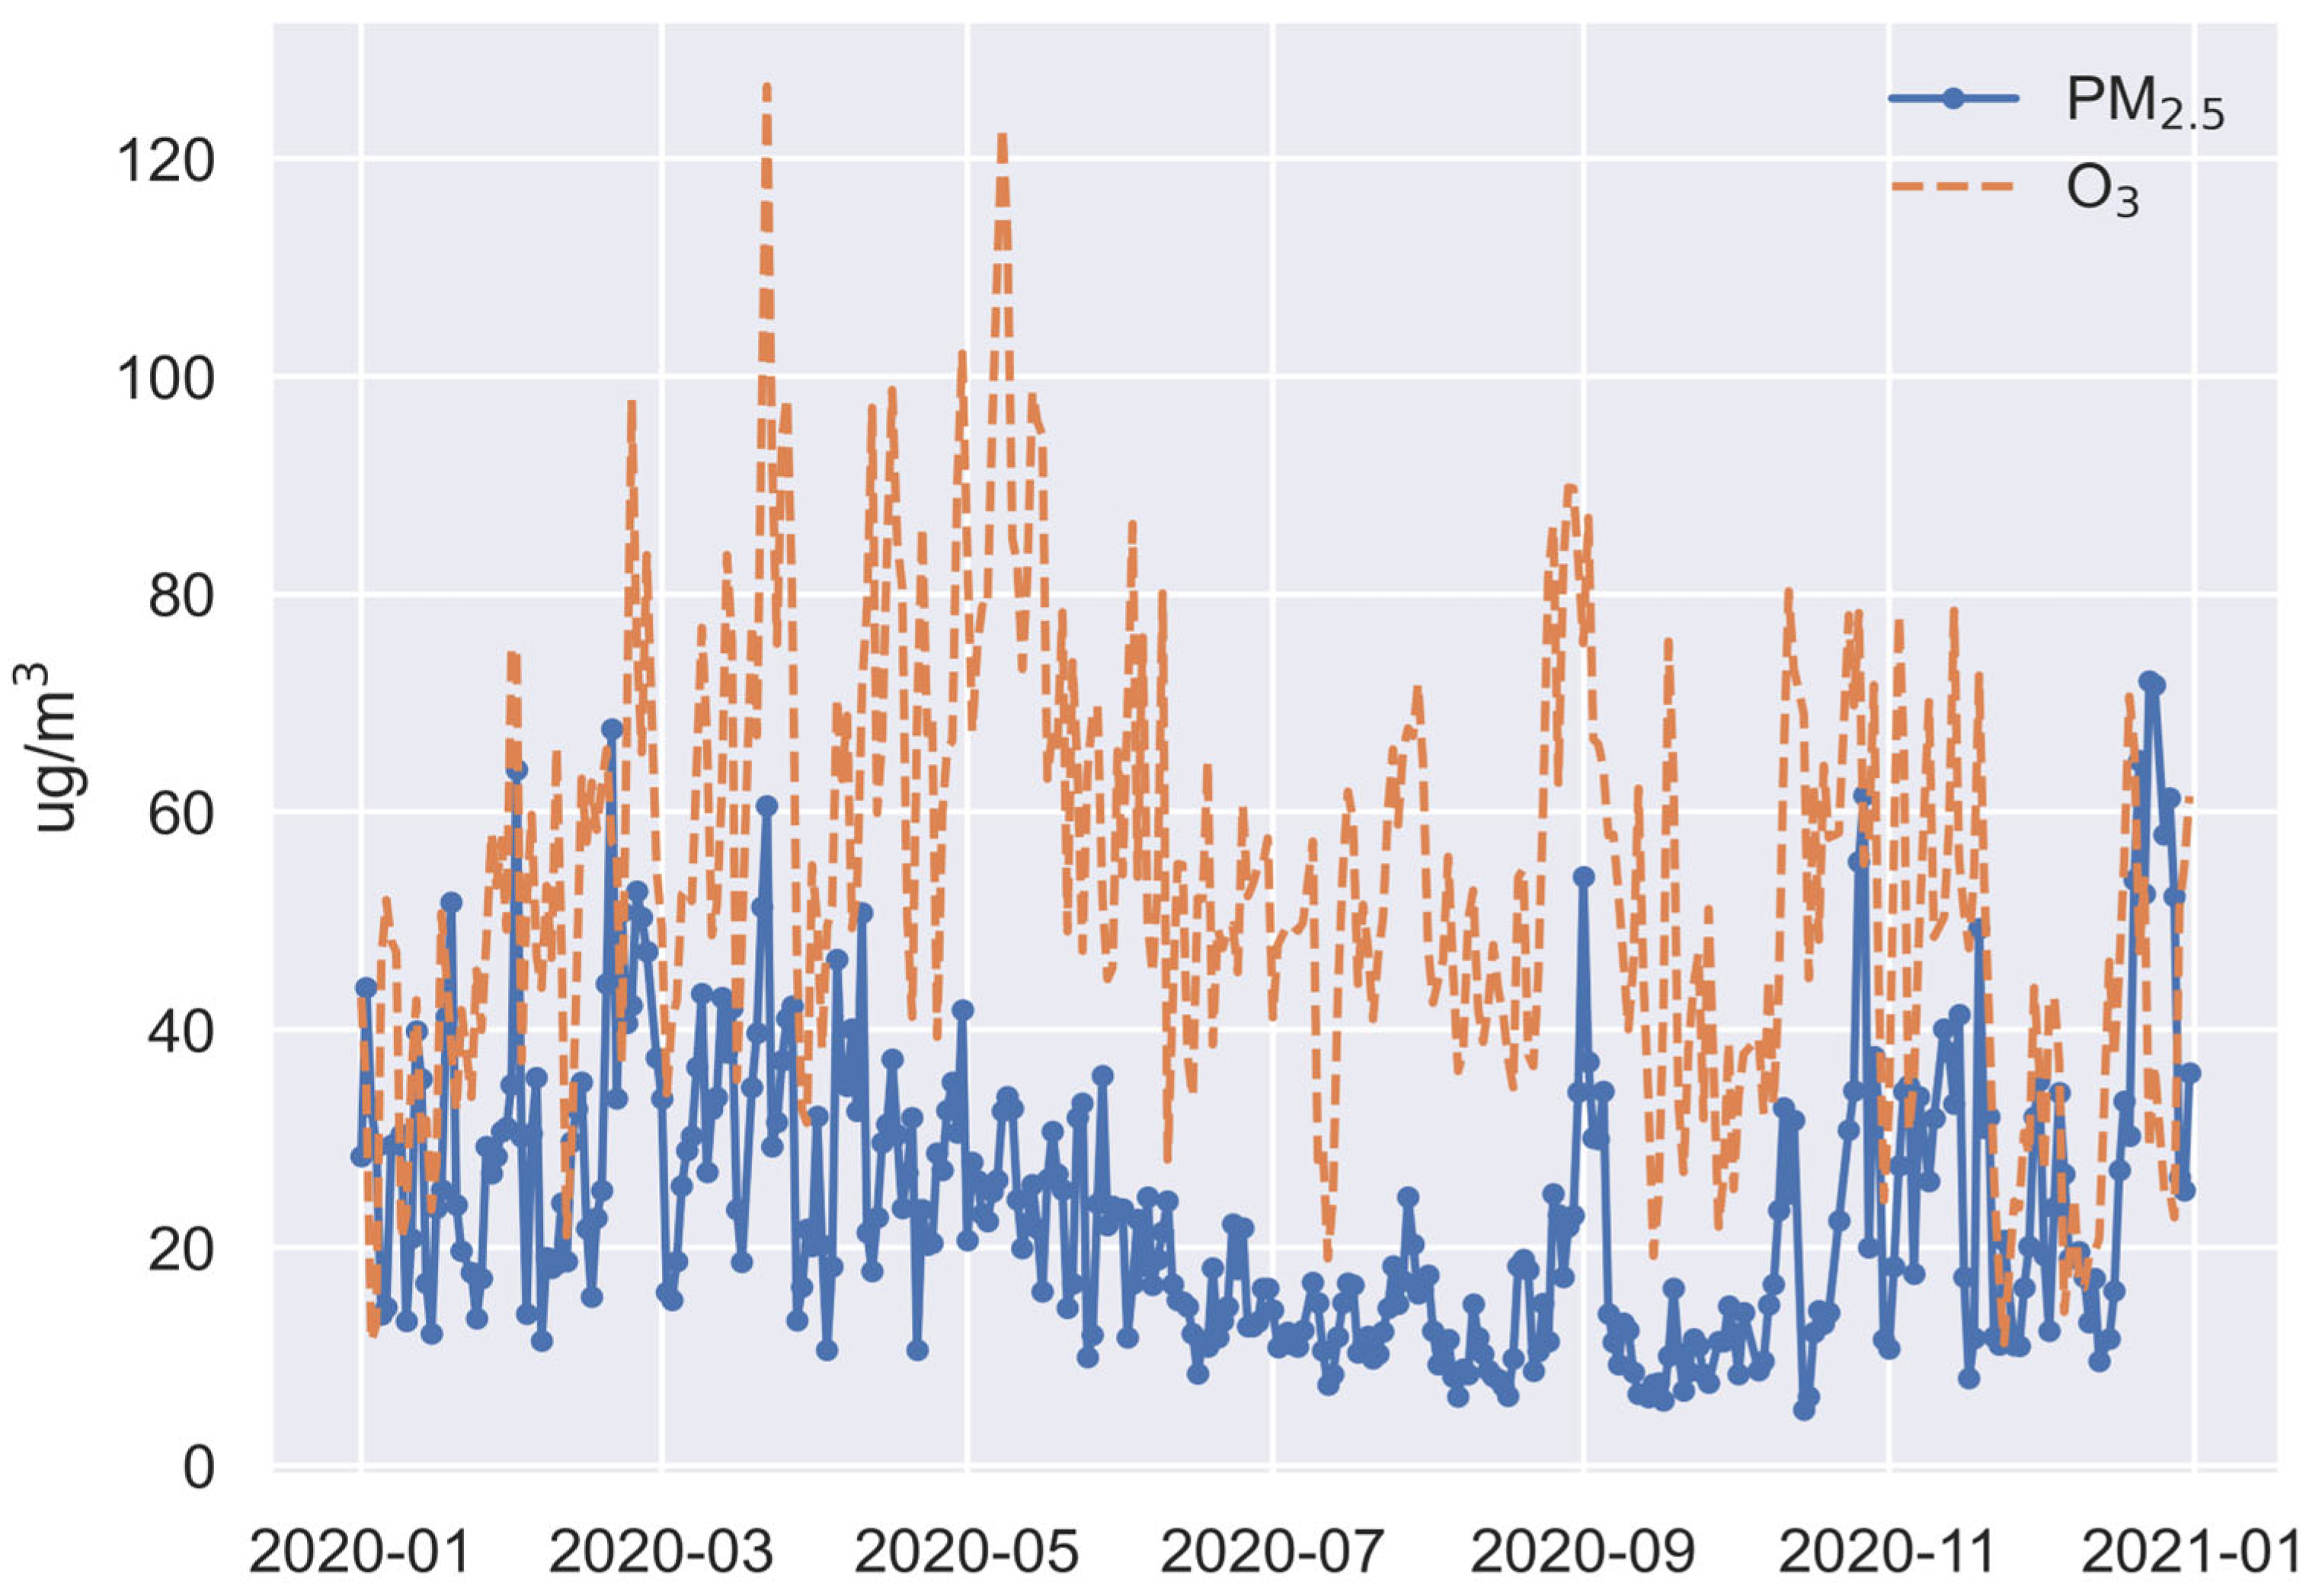
- PM2.5 shows a clear U-shaped seasonal cycle, with concentrations peaking in winter and spring and reaching their lowest in summer and autumn. In contrast, O3 exhibits an inverted U-shaped cycle, with high values in spring and summer and low levels in autumn and winter. These opposite seasonal dynamics highlight the need for differentiated pollution control strategies across seasons.
- (2)
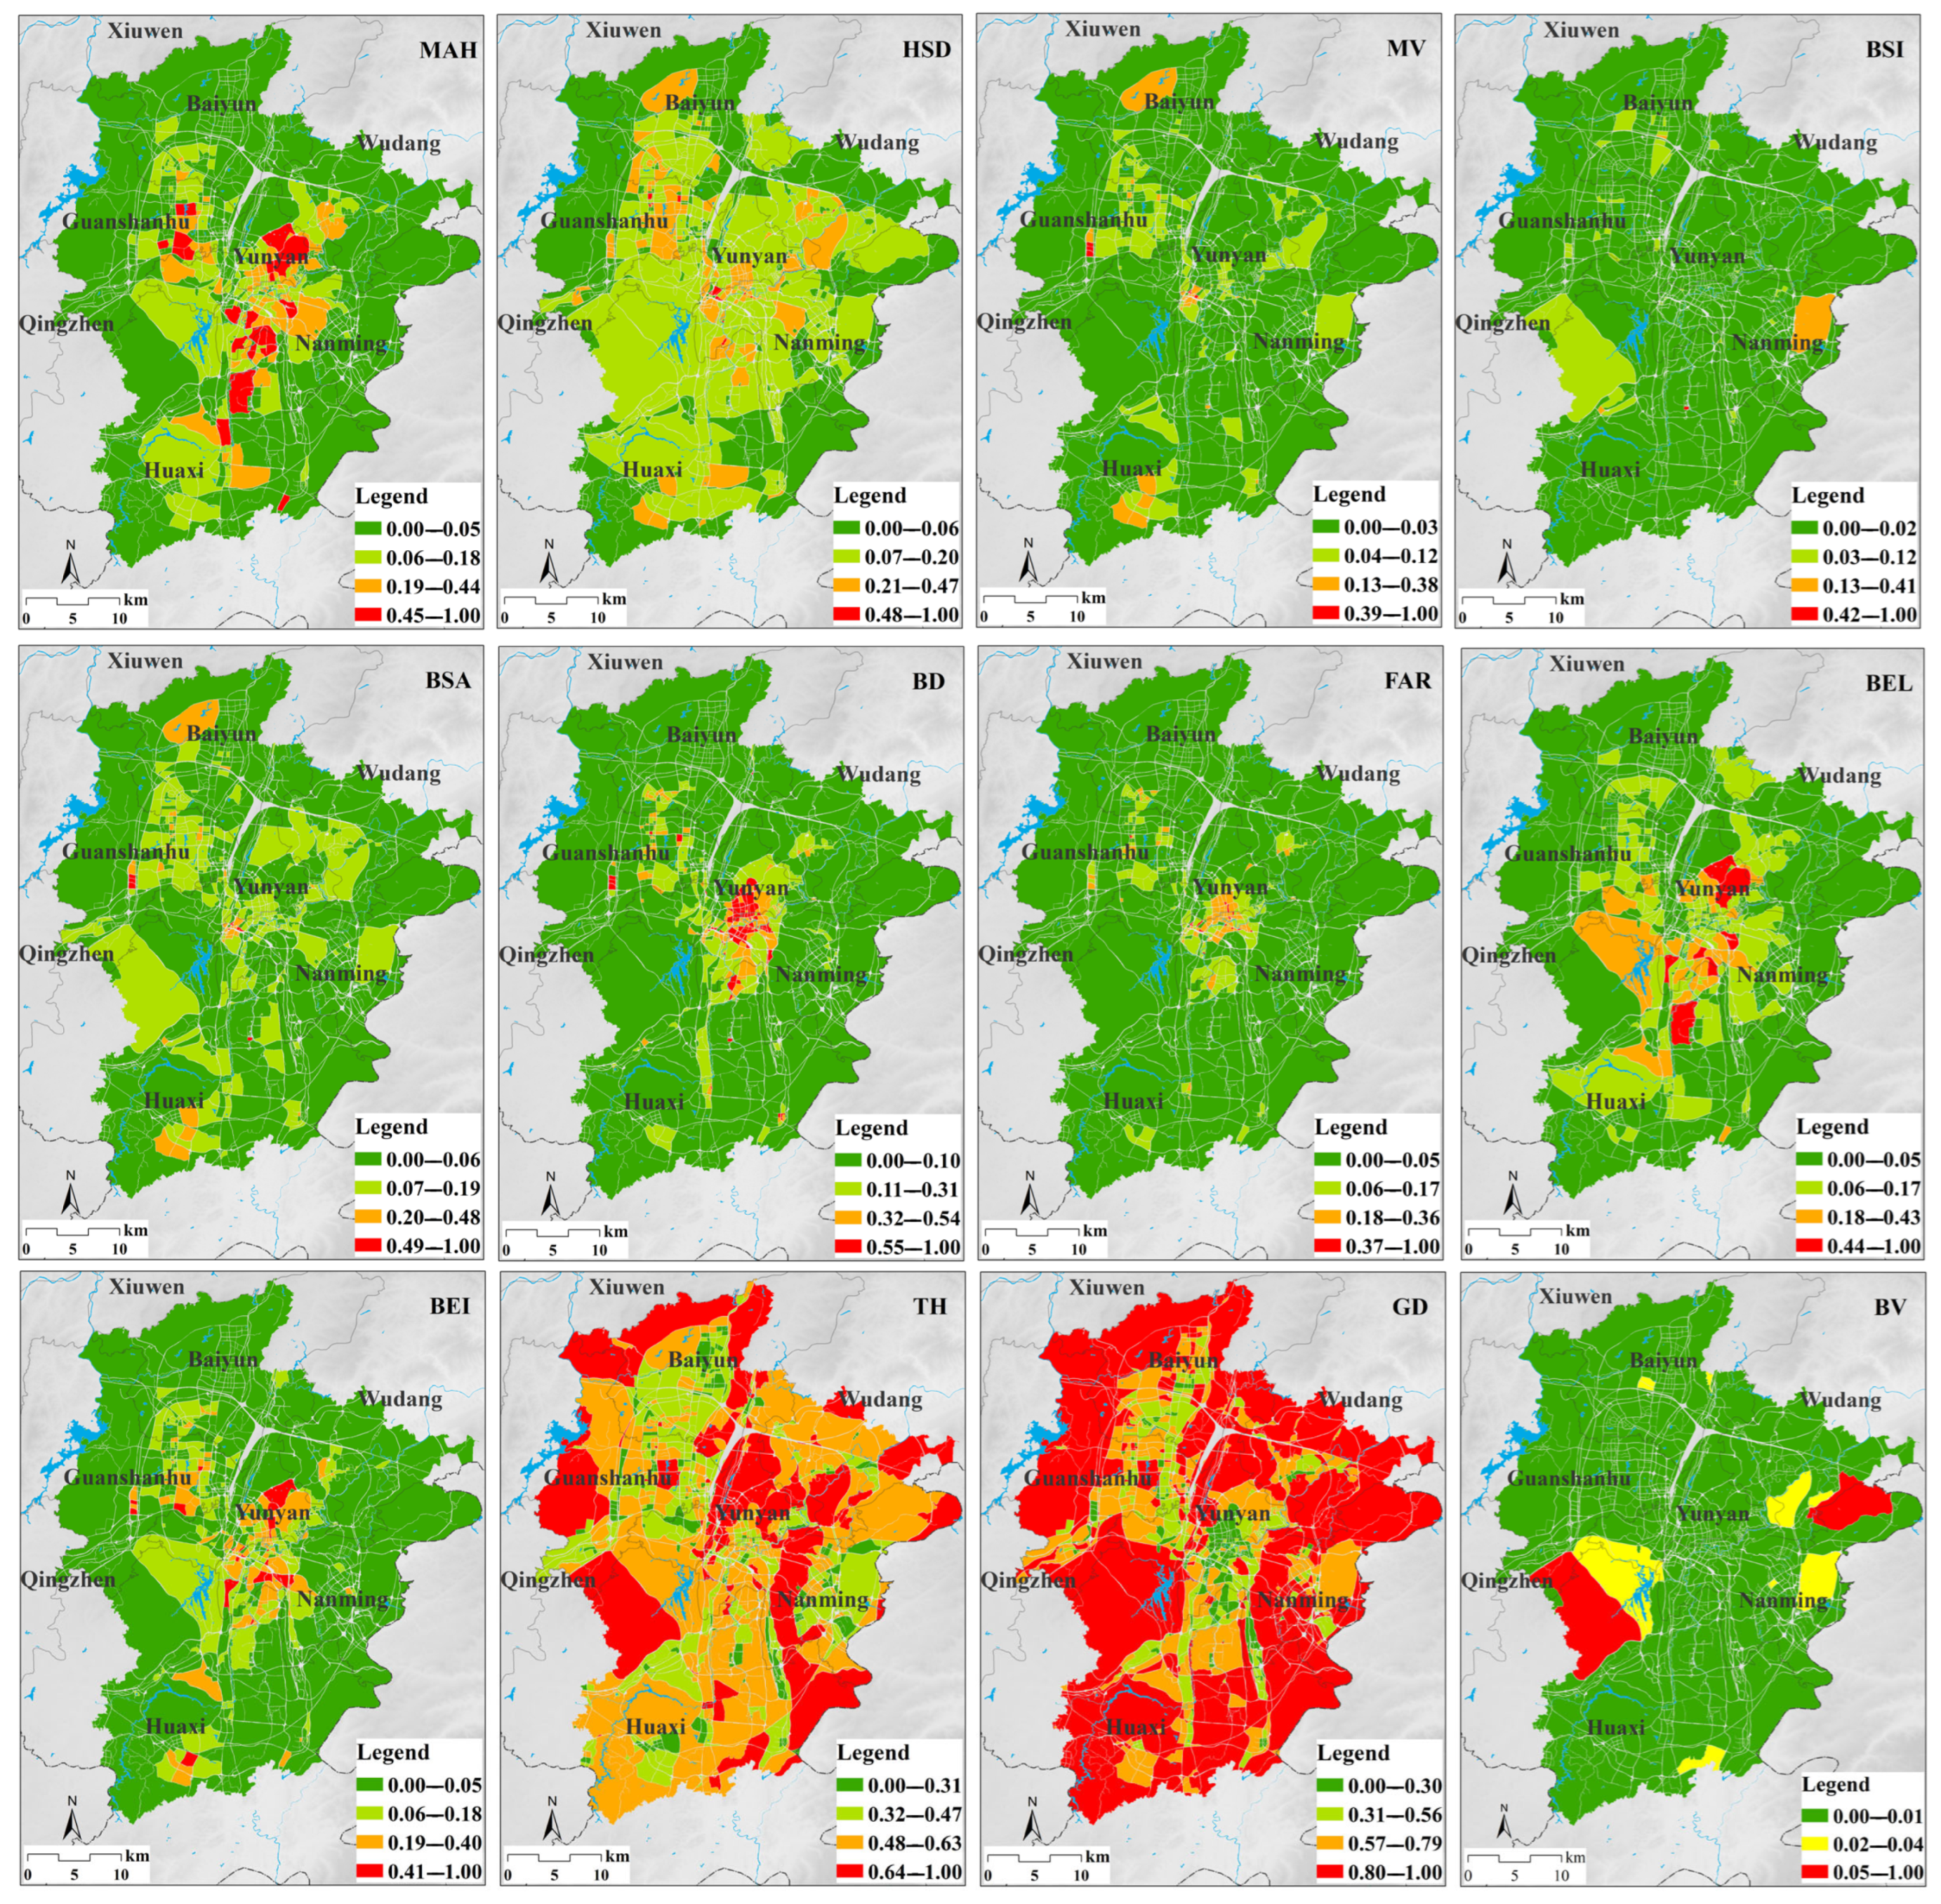
- PM2.5 concentrations are generally higher in suburban and industrial areas and lower in central residential districts, reflecting the combined influence of emission sources and local ventilation conditions. By contrast, O3 concentrations increase gradually from the urban core toward suburban areas, indicating that photochemical processes and precursor transport play stronger roles outside the city center.
- (3)
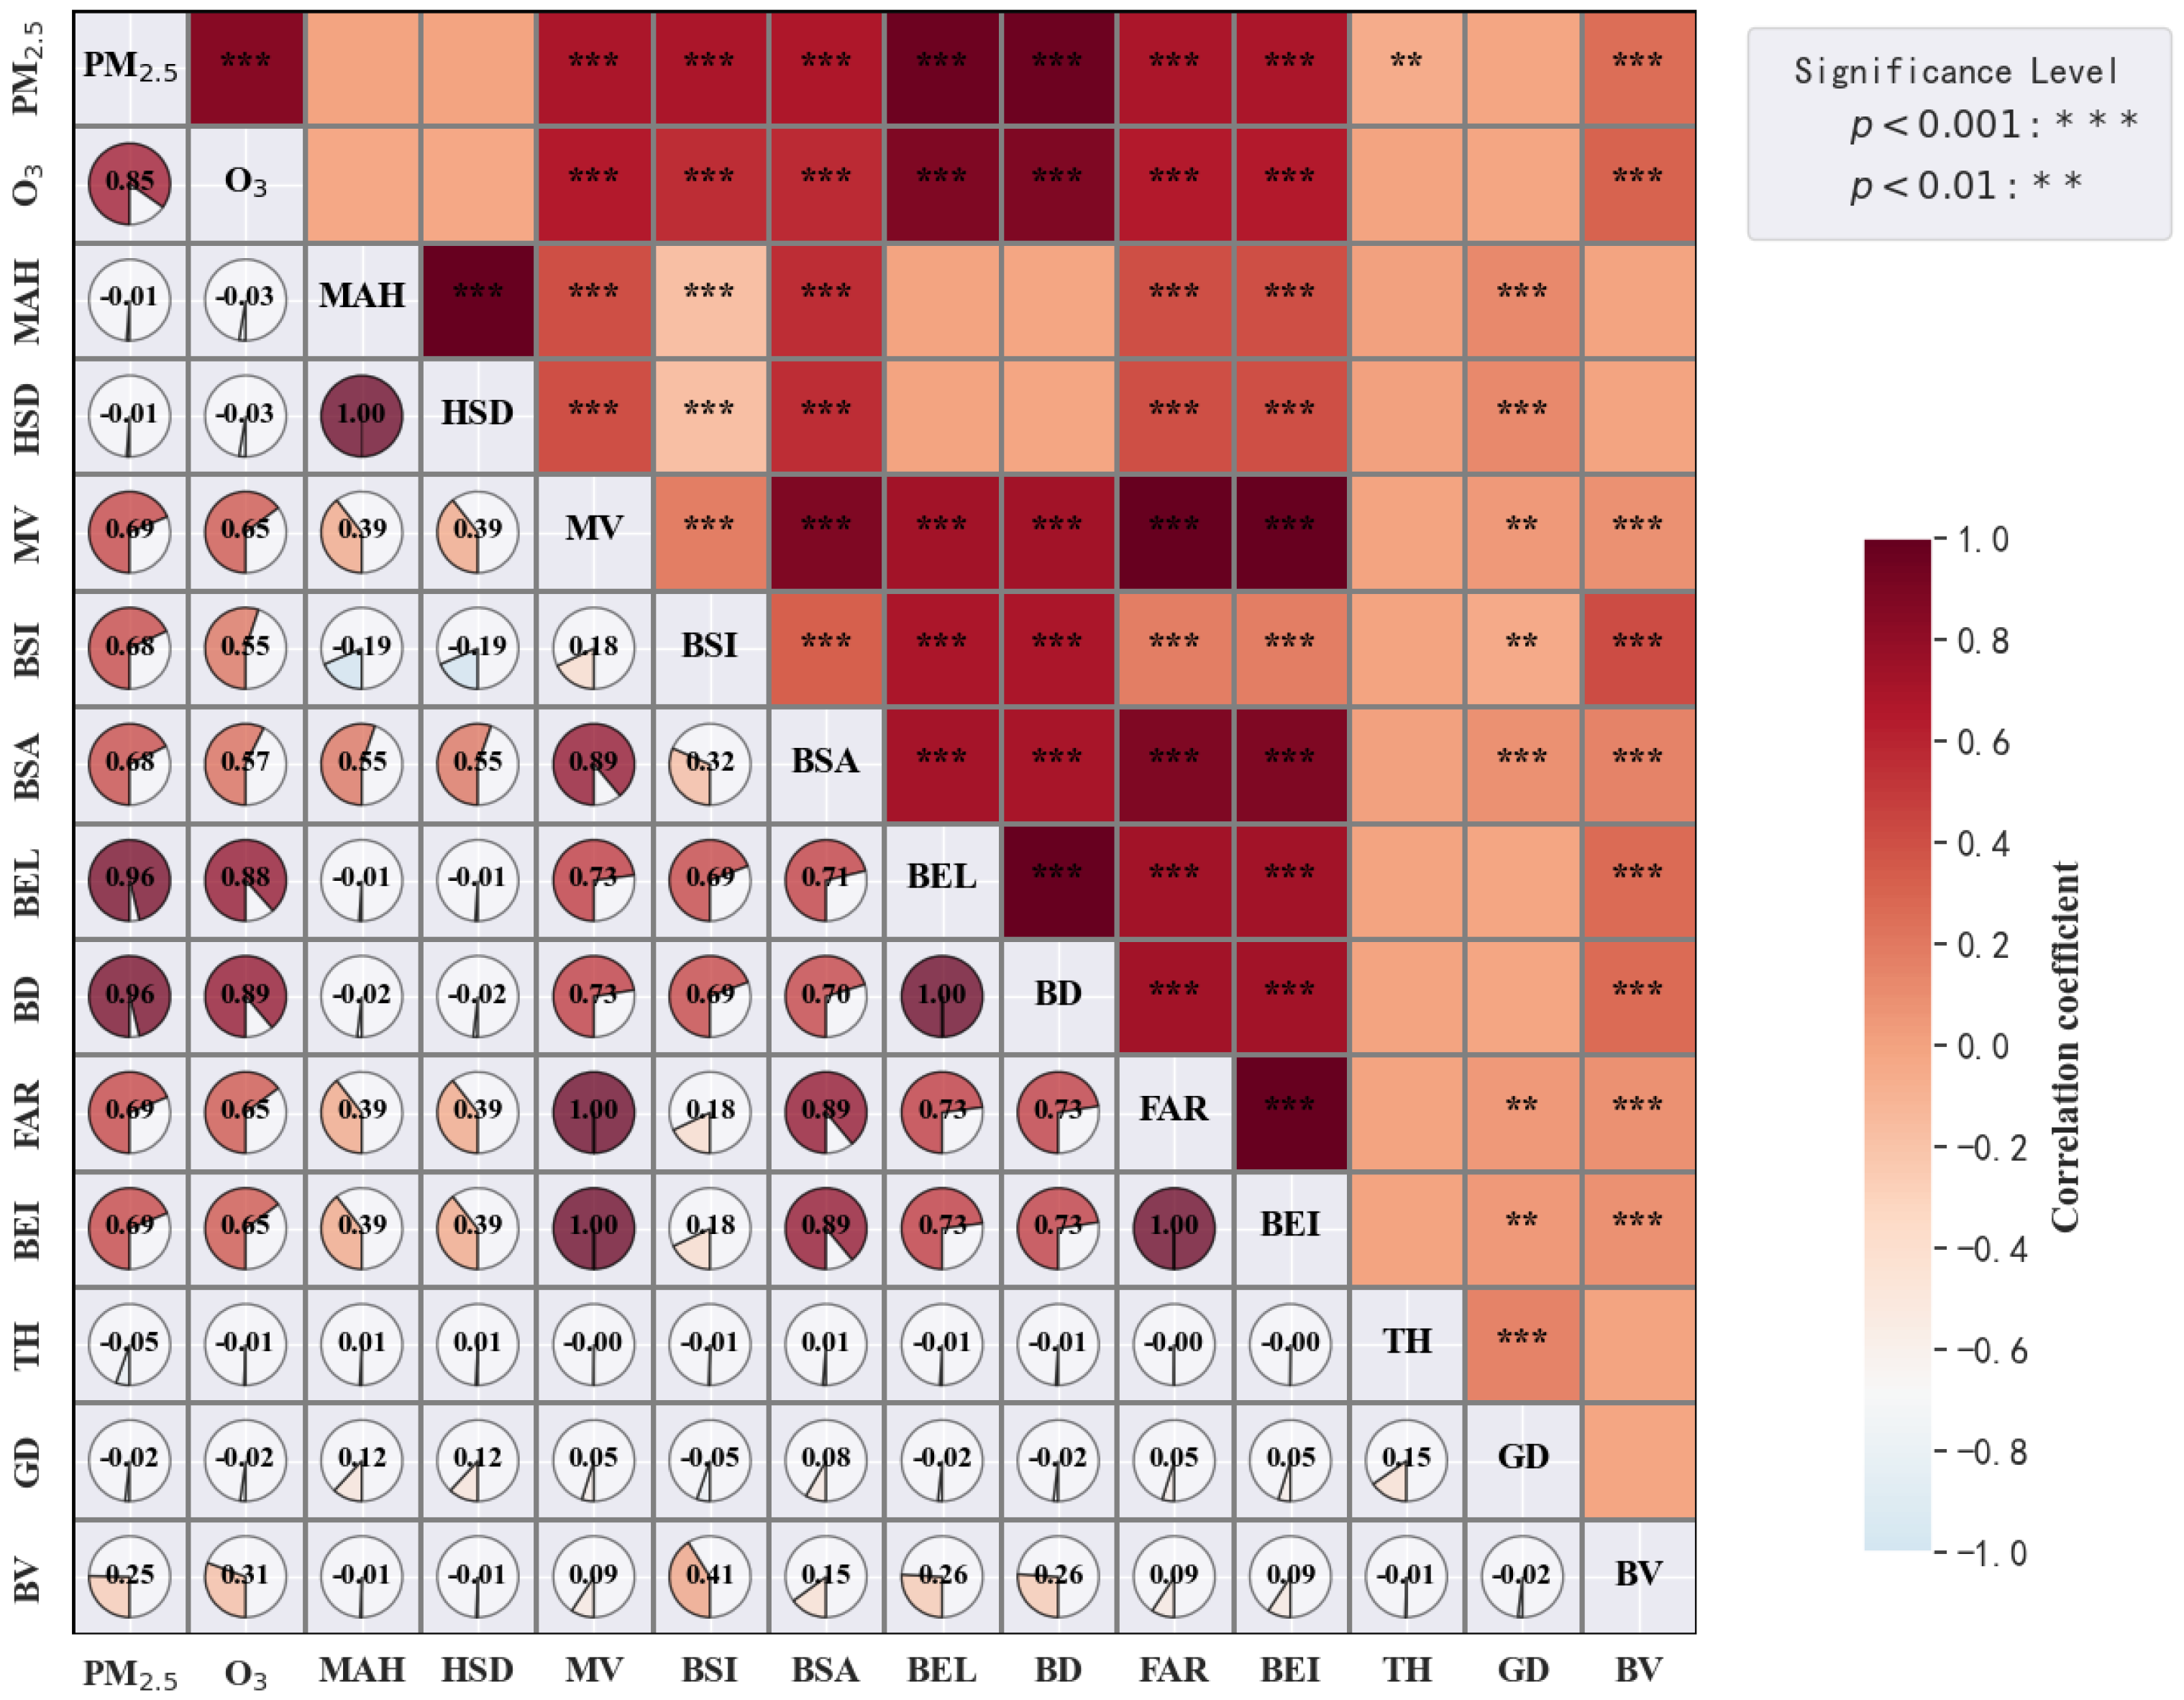
- Among the constructed indicators, MV, BSI, BSA, BEL, BD, FAR, and BV show significant positive correlations with both PM2.5 and O3 (p < 0.001), confirming that higher building density, volume, and structural complexity exacerbate pollution accumulation. In contrast, TH exhibits a significant negative correlation with PM2.5 (p < 0.001), emphasizing the role of urban vegetation in particulate matter removal.
- (4)
- High-density and complex building-edge patterns intensify both PM2.5 and O3 pollution by hindering air circulation and promoting pollutant retention. Conversely, moderate vertical heterogeneity and taller trees can mitigate PM2.5 by improving ventilation and enhancing deposition, yet they also promote O3 formation through increased VOC emissions and photochemical activity. These findings underscore the dual role of urban form and vegetation in air quality regulation and call for integrated planning strategies that balance building configuration and green infrastructure to achieve co-benefits for public health and sustainable urban development.
Author Contributions
Funding
Data Availability Statement
Conflicts of Interest
References
- Han, L.; Zhou, W.; Li, W. City as a major source area of fine particulate (PM2.5) in China. Environ. Pollut. 2015, 206, 183–187. [Google Scholar] [CrossRef]
- Yang, D.; Ye, C.; Wang, X.; Lu, D.; Xu, J.; Yang, H. Global distribution and evolvement of urbanization and PM2.5 (1998–2015). Atmos. Environ. 2018, 182, 171–178. [Google Scholar] [CrossRef]
- Liu, L.; Liu, W.; Yang, L.; Zhang, X. The Drag Effect of Land Resources on New-Type Urbanization: Evidence from China’s Top 10 City Clusters. Sustainability 2025, 17, 7746. [Google Scholar] [CrossRef]
- Wang, W.; Deng, X.; Wang, Y.; Peng, L.; Yu, Z. Impacts of infrastructure construction on ecosystem services in new-type urbanization area of North China Plain. Resour. Conserv. Recycl. 2022, 185, 106376. [Google Scholar] [CrossRef]
- Li, J.; An, X.; Li, Q.; Wang, C.; Yu, H.; Zhou, X.; Geng, Y. Application of XGBoost algorithm in the optimization of pollutant concentration. Atmos. Res. 2022, 276, 106238. [Google Scholar] [CrossRef]
- Bian, H.; Gao, J.; Liu, Y.; Yang, D.; Wu, J. China’s safe and just space during 40 years of rapid urbanization and changing policies. Landsc. Ecol. 2024, 39, 74. [Google Scholar] [CrossRef]
- Lu, D.; Xu, J.; Yang, D.; Zhao, J. Spatio-temporal variation and influence factors of PM2.5 concentrations in China from 1998 to 2014. Atmos. Pollut. Res. 2017, 8, 1151–1159. [Google Scholar] [CrossRef]
- Zhang, X.; Han, L.; Wei, H.; Tan, X.; Zhou, W.; Li, W.; Qian, Y. Linking urbanization and air quality together: A review and a perspective on the future sustainable urban development. J. Clean. Prod. 2022, 346, 130988. [Google Scholar] [CrossRef]
- Han, J.; Yang, Y.; Yang, X.; Wang, D.; Wang, X.; Sun, P. Exploring air pollution characteristics from spatio-temporal perspective: A case study of the top 10 urban agglomerations in China. Environ. Res. 2023, 224, 115512. [Google Scholar] [CrossRef]
- Lu, D.; Xu, J.; Yue, W.; Mao, W.; Yang, D.; Wang, J. Response of PM2.5 pollution to land use in China. J. Clean. Prod. 2020, 244, 118741. [Google Scholar] [CrossRef]
- Lu, D.; Mao, W.; Xiao, W.; Zhang, L. Non-Linear Response of PM2.5 Pollution to Land Use Change in China. Remote Sens. 2021, 13, 1612. [Google Scholar] [CrossRef]
- Chen, X.; Wei, F. Reducing PM2.5 and O3 through optimizing urban ecological land form based on its size thresholds. Atmos. Pollut. Res. 2025, 16, 102466. [Google Scholar] [CrossRef]
- Guan, Y.; Xiao, Y.; Wang, Y.; Zhang, N.; Chu, C. Assessing the health impacts attributable to PM2.5 and ozone pollution in 338 Chinese cities from 2015 to 2020. Environ. Pollut. 2021, 287, 117623. [Google Scholar] [CrossRef] [PubMed]
- Xu, H.; Ruan, Z.; Fang, H.; Jia, Q.; Li, F.; Li, J.; Ye, M.; Wu, T. Machine learning unveils the impact of anthropogenic emission changes on urban PM2.5 and O3: A case study in Wuhu. J. Environ. Sci. 2025, 158, 395–404. [Google Scholar] [CrossRef]
- Zhu, G.; Hu, W.; Liu, Y.; Cao, J.; Ma, Z.; Deng, Y.; Sabel, C.E.; Wang, H. Health burdens of ambient PM2.5 pollution across Chinese cities during 2006-2015. J. Environ. Manag. 2019, 243, 250–256. [Google Scholar] [CrossRef]
- Xiao, Q.; Geng, G.; Xue, T.; Liu, S.; Cai, C.; He, K.; Zhang, Q. Tracking PM2.5 and O3 Pollution and the Related Health Burden in China 2013–2020. Environ. Sci. Technol. 2022, 56, 6922–6932. [Google Scholar] [CrossRef]
- Zhao, H.; Che, H.; Zhang, X.; Ma, Y.; Wang, Y.; Wang, H.; Wang, Y. Characteristics of visibility and particulate matter (PM) in an urban area of Northeast China. Atmos. Pollut. Res. 2013, 4, 427–434. [Google Scholar] [CrossRef]
- Nguyen, G.T.H.; Shimadera, H.; Uranishi, K.; Matsuo, T.; Kondo, A. Numerical assessment of PM2.5 and O3 air quality in Continental Southeast Asia: Impacts of potential future climate change. Atmos. Environ. 2019, 215, 116901. [Google Scholar] [CrossRef]
- He, J.; Liu, H.; Salvo, A. Severe Air Pollution and Labor Productivity: Evidence from Industrial Towns in China. Am. Econ. J. Appl. Econ. 2019, 11, 173–201. [Google Scholar] [CrossRef]
- Alberti, M. The Effects of Urban Patterns on Ecosystem Function. Int. Reg. Sci. Rev. 2005, 28, 168–192. [Google Scholar] [CrossRef]
- Seto, K.C.; Shepherd, J.M. Global urban land-use trends and climate impacts. Curr. Opin. Environ. Sustain. 2009, 1, 89–95. [Google Scholar] [CrossRef]
- Yu, S.; Chen, Z.; Yu, B.; Wang, L.; Wu, B.; Wu, J.; Zhao, F. Exploring the relationship between 2D/3D landscape pattern and land surface temperature based on explainable eXtreme Gradient Boosting tree: A case study of Shanghai, China. Sci. Total Environ. 2020, 725, 138229. [Google Scholar] [CrossRef] [PubMed]
- Liu, M.; Ren, Q.; Liu, C.; Zhang, W.; Song, C.; Chen, P.; Huang, Q. Urban land expanded closer to protected areas in China: A three decade investigation over 2622 protected areas. Int. J. Sustain. Dev. World Ecol. 2024, 31, 578–592. [Google Scholar] [CrossRef]
- Zhang, Y.; Middel, A.; Turner, B.L. Evaluating the effect of 3D urban form on neighborhood land surface temperature using Google Street View and geographically weighted regression. Landsc. Ecol. 2019, 34, 681–697. [Google Scholar] [CrossRef]
- Qiu, Y.; Xu, S.; Xiao, W.; He, T.; Lu, D.; Ruan, L.; Wang, K. Urban Concrete Forest: China’s 3D Urban Expansion over the Last Three Decades. J. Urban Plann. Dev. 2024, 150, 04024003. [Google Scholar] [CrossRef]
- He, T.; Hu, Y.; Li, F.; Chen, Y.; Zhang, M.; Zheng, Q.; Dong, B.; Ren, H. An improved height sampling approach used for global urban building height mapping. Int. J. Appl. Earth Obs. Geoinf. 2025, 141, 104633. [Google Scholar] [CrossRef]
- Li, D.; Liu, M.; Shi, S.; Li, C.; Zhang, T.; Yu, Y. Influence of three-dimensional patterns of buildings on urban atmospheric pollutants in metropolises of China. Build. Environ. 2025, 274, 112746. [Google Scholar] [CrossRef]
- Huang, L.; Zhang, C.; Bi, J. Development of land use regression models for PM2.5, SO2, NO2 and O3 in Nanjing, China. Environ. Res. 2017, 158, 542–552. [Google Scholar] [CrossRef]
- Lu, D.; Mao, W.; Yang, D.; Zhao, J.; Xu, J. Effects of land use and landscape pattern on PM2.5 in Yangtze River Delta, China. Atmos. Pollut. Res. 2018, 9, 705–713. [Google Scholar] [CrossRef]
- Anache, J.A.A.; Flanagan, D.C.; Srivastava, A.; Wendland, E.C. Land use and climate change impacts on runoff and soil erosion at the hillslope scale in the Brazilian Cerrado. Sci. Total Environ. 2018, 622–623, 140–151. [Google Scholar] [CrossRef]
- Tian, Y.; Zhou, W.; Qian, Y.; Zheng, Z.; Yan, J. The effect of urban 2D and 3D morphology on air temperature in residential neighborhoods. Landsc. Ecol. 2019, 34, 1161–1178. [Google Scholar] [CrossRef]
- Liu, Y.; Li, Q.; Yang, L.; Mu, K.; Zhang, M.; Liu, J. Urban heat island effects of various urban morphologies under regional climate conditions. Sci. Total Environ. 2020, 743, 140589. [Google Scholar] [CrossRef] [PubMed]
- Shao, L.; Liao, W.; Li, P.; Luo, M.; Xiong, X.; Liu, X. Drivers of global surface urban heat islands: Surface property, climate background, and 2D/3D urban morphologies. Build. Environ. 2023, 242, 110581. [Google Scholar] [CrossRef]
- Wang, Z.; Zhou, R.; Yu, Y. The impact of urban morphology on land surface temperature under seasonal and diurnal variations: Marginal and interaction effects. Build. Environ. 2025, 272, 112673. [Google Scholar] [CrossRef]
- Wang, S.; Zhou, C.; Wang, Z.; Feng, K.; Hubacek, K. The characteristics and drivers of fine particulate matter (PM2.5) distribution in China. J. Clean. Prod. 2017, 142, 1800–1809. [Google Scholar] [CrossRef]
- Zhao, C.; Weng, Q.; Hersperger, A.M. Characterizing the 3-D urban morphology transformation to understand urban-form dynamics: A case study of Austin, Texas, USA. Landsc. Urban Plan. 2020, 203, 103881. [Google Scholar] [CrossRef]
- Chen, Z.; Xu, B.; Devereux, B. Urban landscape pattern analysis based on 3D landscape models. Appl. Geogr. 2014, 55, 82–91. [Google Scholar] [CrossRef]
- Caynes, R.J.C.; Mitchell, M.G.E.; Wu, D.S.; Johansen, K.; Rhodes, J.R. Using high-resolution LiDAR data to quantify the three-dimensional structure of vegetation in urban green space. Urban Ecosyst. 2016, 19, 1749–1765. [Google Scholar] [CrossRef]
- Kedron, P.; Zhao, Y.; Frazier, A.E. Three dimensional (3D) spatial metrics for objects. Landsc. Ecol. 2019, 34, 2123–2132. [Google Scholar] [CrossRef]
- Zhang, A.; Xia, C.; Li, W. Exploring the effects of 3D urban form on urban air quality: Evidence from fifteen megacities in China. Sustain. Cities Soc. 2022, 78, 103649. [Google Scholar] [CrossRef]
- Liu, Y.; Wang, H. The Effects of 2D and 3D Urban Morphology on Air Quality. Water Air Soil Pollut. 2023, 234, 593. [Google Scholar] [CrossRef]
- Duan, H.; Cao, Q.; Wang, L.; Gu, X.; Ashrafi, K. Exploring the relationships between 3D urban landscape patterns and PM2.5 pollution using the multiscale geographic weighted regression model. Prog. Phys. Geogr. Earth Environ. 2024, 48, 368–388. [Google Scholar] [CrossRef]
- Cao, Q.; Luan, Q.; Liu, Y.; Wang, R. The effects of 2D and 3D building morphology on urban environments: A multi-scale analysis in the Beijing metropolitan region. Build. Environ. 2021, 192, 107635. [Google Scholar] [CrossRef]
- Ke, B.; Hu, W.; Huang, D.; Zhang, J.; Lin, X.; Li, C.; Jin, X.; Chen, J. Three-dimensional building morphology impacts on PM2.5 distribution in urban landscape settings in Zhejiang, China. Sci. Total Environ. 2022, 826, 154094. [Google Scholar] [CrossRef] [PubMed]
- Hong, S.; Wang, C.; Wang, W.; Zhang, P.; Guo, Y.; Ma, Z.; Hong, W.; Ren, Z. Urban 2D and 3D morphology and the pattern of ozone pollution: A 68-city study in China. Landsc. Ecol. 2024, 39, 27. [Google Scholar] [CrossRef]
- Feng, R.; Wang, F.; Wang, K.; Wang, H.; Li, L. Urban ecological land and natural-anthropogenic environment interactively drive surface urban heat island: An urban agglomeration-level study in China. Environ. Int. 2021, 157, 106857. [Google Scholar] [CrossRef]
- Feng, T.; Du, H.; Lin, Z.; Zuo, J. Spatial spillover effects of environmental regulations on air pollution: Evidence from urban agglomerations in China. J. Environ. Manag. 2020, 272, 110998. [Google Scholar] [CrossRef]
- Chen, X.; Wei, F. Impact of territorial spatial landscape pattern on PM2.5 and O3 concentrations in the Yangtze River delta urban agglomeration: Exploration and planning strategies. J. Clean. Prod. 2024, 452, 142172. [Google Scholar] [CrossRef]
- Liu, R.; Yan, X.; Lin, X.; Sun, Y.; Zhang, T.; Xiao, J. Urban spontaneous plant richness in response to the 2D/3D building and green space patterns in a highly urbanized area. Ecol. Indic. 2023, 154, 110852. [Google Scholar] [CrossRef]
- Liu, Y.; Chen, C.; Li, J.; Chen, W.-Q. Characterizing three dimensional (3-D) morphology of residential buildings by landscape metrics. Landsc. Ecol. 2020, 35, 2587–2599. [Google Scholar] [CrossRef]
- Wang, M.; Sampson, P.D.; Hu, J.; Kleeman, M.; Keller, J.P.; Olives, C.; Szpiro, A.A.; Vedal, S.; Kaufman, J.D. Combining Land-Use Regression and Chemical Transport Modeling in a Spatiotemporal Geostatistical Model for Ozone and PM2.5. Environ. Sci. Technol. 2016, 50, 5111–5118. [Google Scholar] [CrossRef] [PubMed]
- Wong, P.-Y.; Lee, H.-Y.; Chen, Y.-C.; Zeng, Y.-T.; Chern, Y.-R.; Chen, N.-T.; Candice Lung, S.-C.; Su, H.-J.; Wu, C.-D. Using a land use regression model with machine learning to estimate ground level PM2.5. Environ. Pollut. 2021, 277, 116846. [Google Scholar] [CrossRef] [PubMed]
- Ma, H.; Kong, J.; Zhong, Y.; Jiang, Y.; Zhang, Q.; Wang, L.; Wang, X.; Zhang, J. The optimization of XGBoost model and its application in PM2.5 concentrations estimation based on MODIS data in the Guanzhong region, China. Int. J. Remote Sens. 2024, 45, 6954–6975. [Google Scholar] [CrossRef]
- Chen, T.; Guestrin, C. Xgboost: A scalable tree boosting system. arXiv 2016, arXiv:1603.02754. [Google Scholar] [CrossRef]
- Zhu, H.; He, J.; Wu, Y.; Tong, L.; Zhang, W.; Zhuang, L. Assessment of Global Antibiotic Exposure Risk for Crops: Incorporating Soil Adsorption via Machine Learning. Environ. Sci. Technol. 2024, 58, 13327–13336. [Google Scholar] [CrossRef]
- GB 3095-2012; Ambient Air Quality Standard. China Environmental Science Press: Beijing, China, 2016.
- Lang, N.; Jetz, W.; Schindler, K.; Wegner, J.D. A high-resolution canopy height model of the Earth. Nat. Ecol. Evol. 2023, 7, 1778–1789. [Google Scholar] [CrossRef]
- Štrumbelj, E.; Kononenko, I. Explaining prediction models and individual predictions with feature contributions. Knowl. Inf. Syst. 2014, 41, 647–665. [Google Scholar] [CrossRef]
- Li, Z. Extracting spatial effects from machine learning model using local interpretation method: An example of SHAP and XGBoost. Comput. Environ. Urban Syst. 2022, 96, 101845. [Google Scholar] [CrossRef]
- GB 50352-2019; Uniform Standard for Design of Civil Buildings. Ministry of Housing and Urban-Rural Development of China: Beijing, China, 2019.
- Yang, Z.; Li, Z.; Cheng, F.; Lv, Q.; Li, K.; Zhang, T.; Zhou, Y.; Zhao, B.; Xue, W.; Wei, J. Two-decade surface ozone (O3) pollution in China: Enhanced fine-scale estimations and environmental health implications. Remote Sens. Environ. 2025, 317, 114459. [Google Scholar] [CrossRef]
- Wei, J.; Li, Z.; Lyapustin, A.; Sun, L.; Peng, Y.; Xue, W.; Su, T.; Cribb, M. Reconstructing 1-km-resolution high-quality PM2.5 data records from 2000 to 2018 in China: Spatiotemporal variations and policy implications. Remote Sens. Environ. 2021, 252, 112136. [Google Scholar] [CrossRef]
- Maison, A.; Lugon, L.; Park, S.-J.; Baudic, A.; Cantrell, C.; Couvidat, F.; D’Anna, B.; Di Biagio, C.; Gratien, A.; Gros, V.; et al. Significant impact of urban tree biogenic emissions on air quality estimated by a bottom-up inventory and chemistry transport modeling. Atmos. Chem. Phys. 2024, 24, 6011–6046. [Google Scholar] [CrossRef]


| Datasets | Format | Source |
|---|---|---|
| PM2.5, O3 | Table | China Environmental Monitoring Station |
| Raster | https://zenodo.org/records/6398971 (accessed on 10 July 2025) | |
| Elevation | Raster | Geospatial data cloud of China |
| AOIs | Point features | Gaode Map Services, China |
| Building, Road and Water data | Vector | Baidu map |
| Boundary maps | Line features | Open Street Map |
| Land use | Raster | European Space Agency (ESA) |
| Tree Height | Raster | https://arxiv.org/pdf/2204.08322 (accessed on 10 July 2025) |
| Landscape Metric | Formula | Description | |
|---|---|---|---|
| Mean Architecture Height (MAH) | , : the height of individual building; : number of buildings. | (1) | Mean building height in the analytical unit. |
| Height standard deviation (HSD) | (2) | Variation in the buildings in the analytical unit. | |
| Mean Volume (MV) | , : building cover area. | (3) | Reflects the average building volume within the region. |
| Building Structure Index (BSI) | (4) | Variation in building structural characteristics analyzed by the ratio of building footprint area to height. | |
| Building surface area (BSA) | , : the perimeter of building. | (5) | Reflects the average building surface area within the region. |
| Building density (BD) | , : land parcel cover area. | (6) | Reflects the intensity of building within the analytical unit. |
| Floor area ratio (FAR) | (7) | The ratio between the sum of gross floor area and analytical unit area. | |
| Building edge length (BEL) | (8) | Reflects the morphological complexity and spatial development of building edges within the analytical unit. | |
| Building Evenness Index (BEI) | (9) | Reflects the uniformity of building distribution in three-dimensional space. | |
| Tree height (TH) | , : height of tree. | (10) | Total tree height in the analytical unit. |
| Greenery density (GD) | ,: green cover area. | (11) | Reflects the intensity of green spaces within the analytical unit. |
| Building-to-Vegetation Volume Ratio (BV) | , : building volume; : vegetation volume. | (12) | Reflects the spatial balance between built-up and vegetated volumes, indicating the degree of urban development intensity and ecological greenness within the analytical unit. |
| Building Type | Low-Rise (<10 m) | Multistory (11–24 m) | High-Rise (25–100 m) | Super High-Rise (>100 m) | Total Building |
|---|---|---|---|---|---|
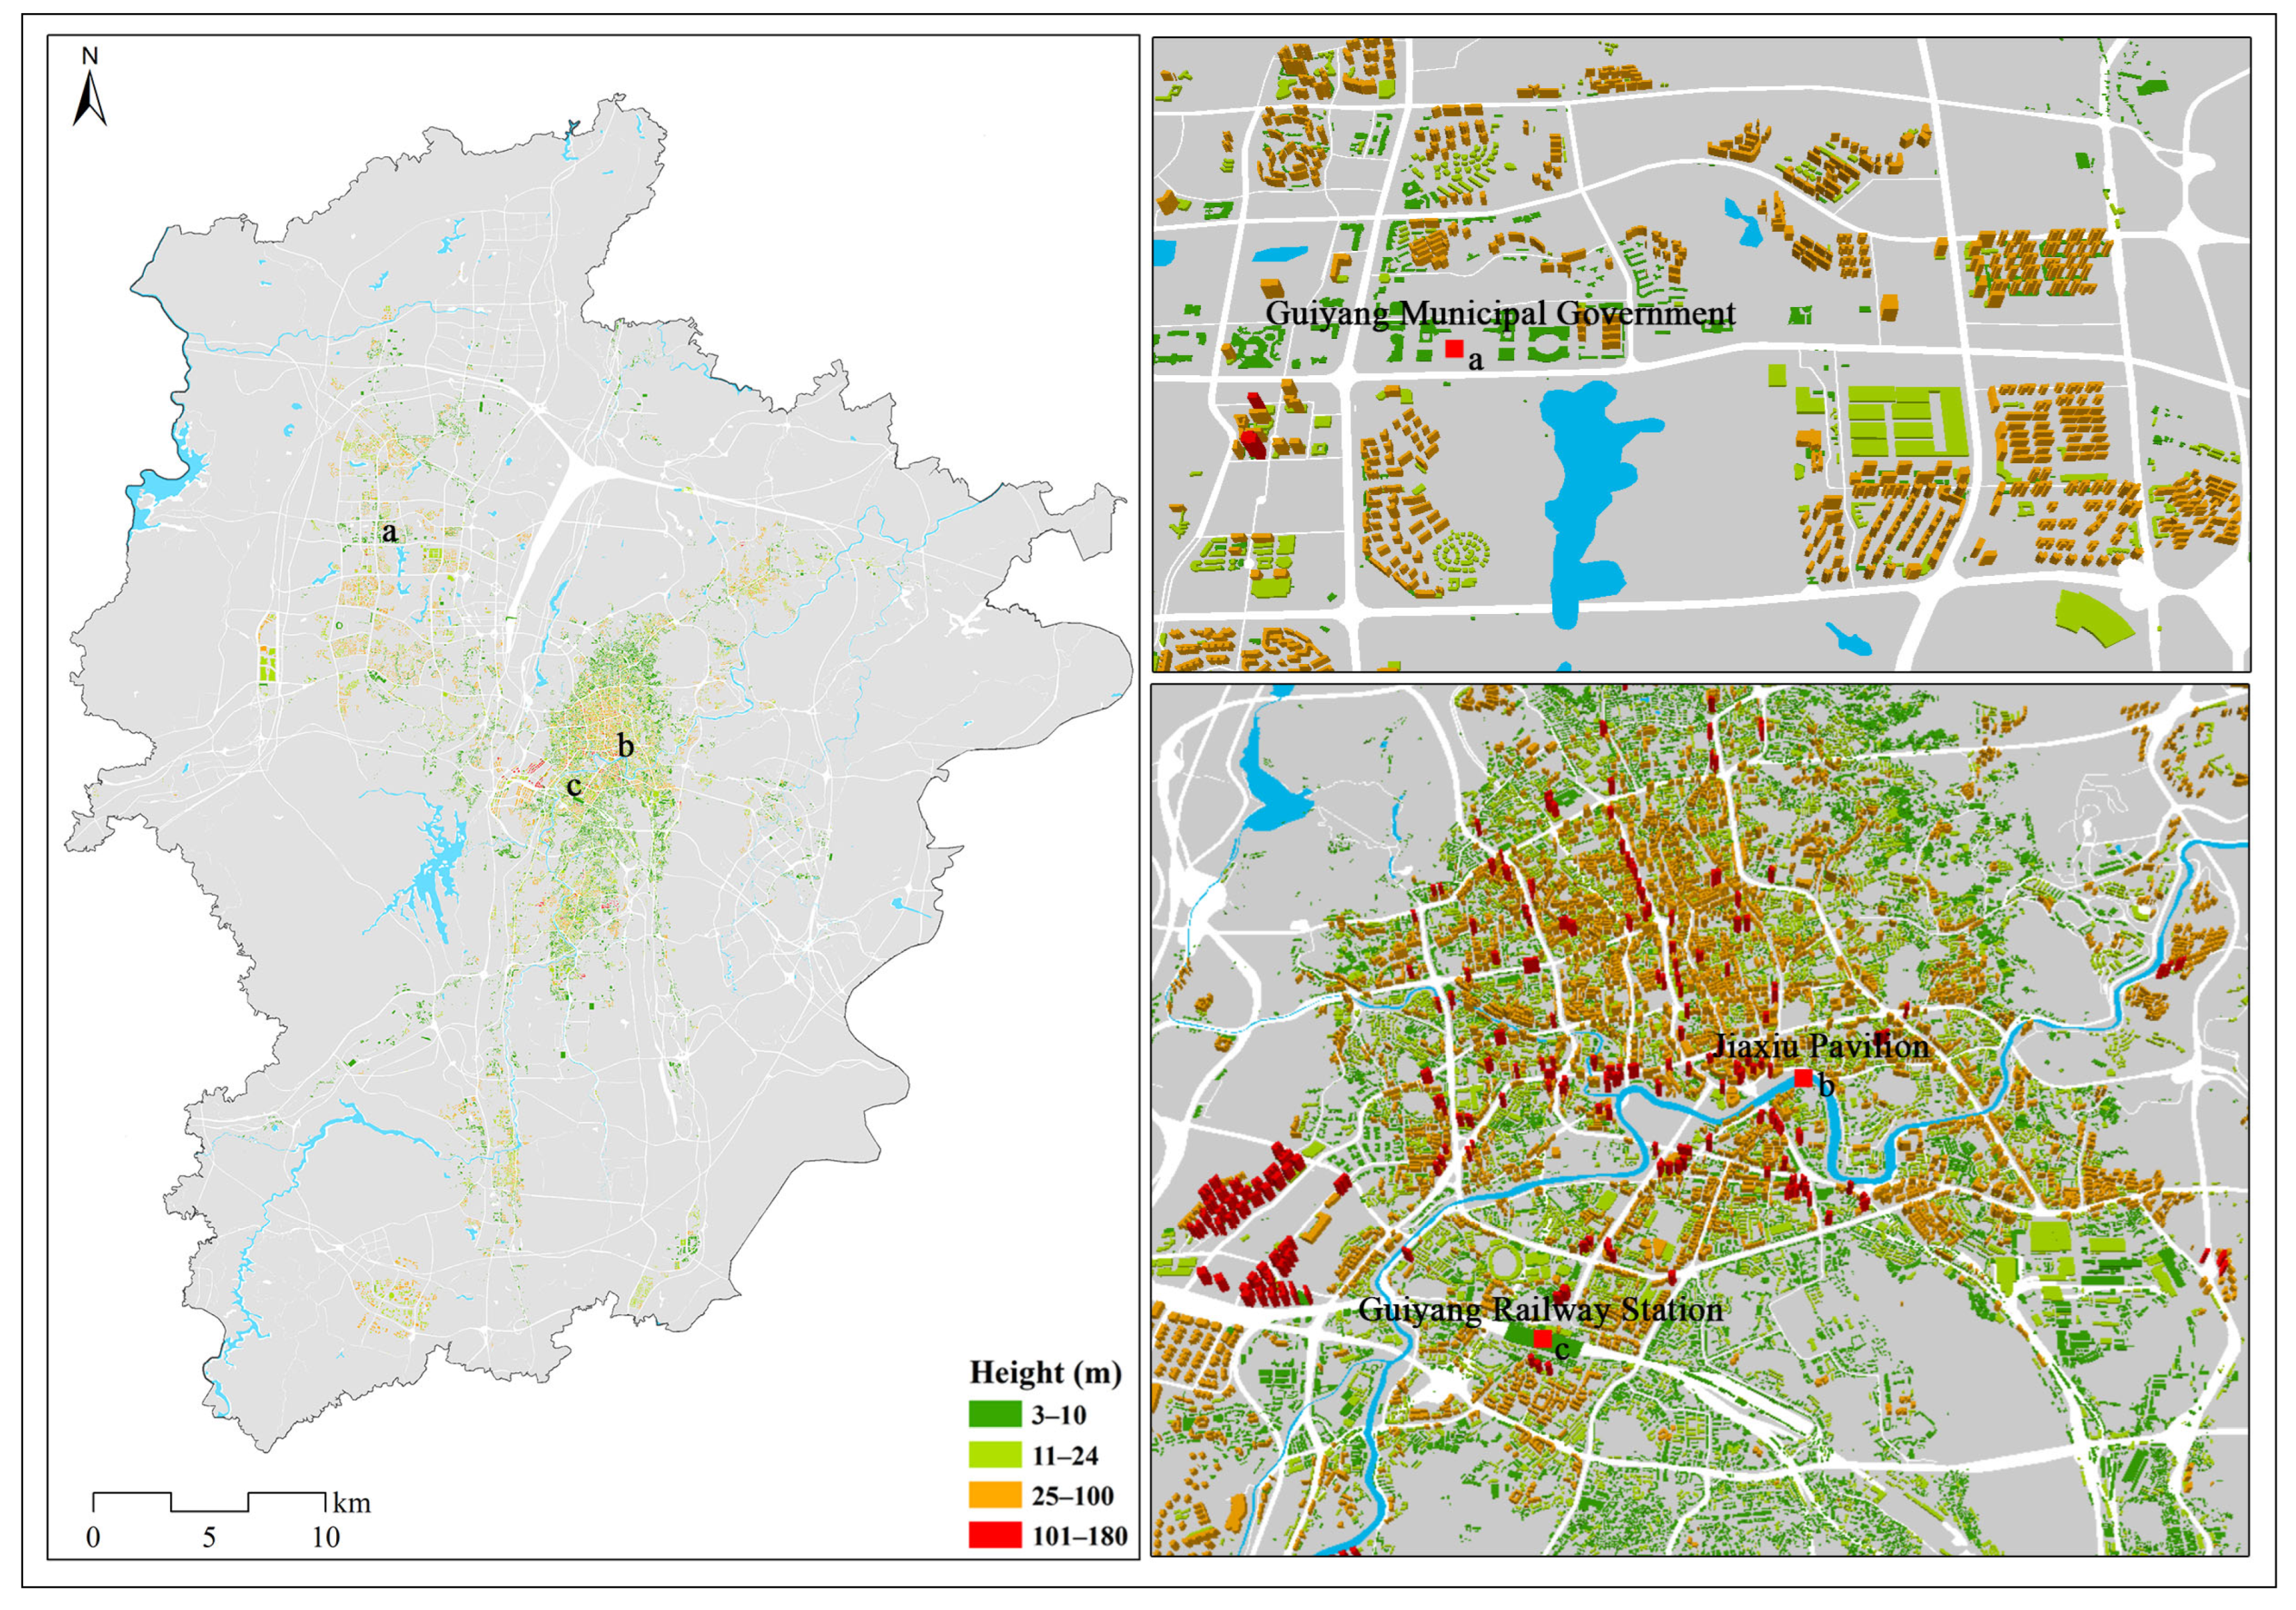
| Quantity | 28,366 | 12,992 | 8867 | 330 | 50,555 |
| Proportion | 0.56% | 0.26% | 0.18% | 0.01% | 100% |
Disclaimer/Publisher’s Note: The statements, opinions and data contained in all publications are solely those of the individual author(s) and contributor(s) and not of MDPI and/or the editor(s). MDPI and/or the editor(s) disclaim responsibility for any injury to people or property resulting from any ideas, methods, instructions or products referred to in the content. |
© 2025 by the authors. Licensee MDPI, Basel, Switzerland. This article is an open access article distributed under the terms and conditions of the Creative Commons Attribution (CC BY) license (https://creativecommons.org/licenses/by/4.0/).
Share and Cite
Lu, D.; Yang, D.; Li, M.; Lu, T.; Han, C. Nonlinear Mechanisms of PM2.5 and O3 Response to 2D/3D Building and Green Space Patterns in Guiyang City, China. Land 2025, 14, 2257. https://doi.org/10.3390/land14112257
Lu D, Yang D, Li M, Lu T, Han C. Nonlinear Mechanisms of PM2.5 and O3 Response to 2D/3D Building and Green Space Patterns in Guiyang City, China. Land. 2025; 14(11):2257. https://doi.org/10.3390/land14112257
Chicago/Turabian StyleLu, Debin, Dongyang Yang, Menglin Li, Tong Lu, and Chang Han. 2025. "Nonlinear Mechanisms of PM2.5 and O3 Response to 2D/3D Building and Green Space Patterns in Guiyang City, China" Land 14, no. 11: 2257. https://doi.org/10.3390/land14112257
APA StyleLu, D., Yang, D., Li, M., Lu, T., & Han, C. (2025). Nonlinear Mechanisms of PM2.5 and O3 Response to 2D/3D Building and Green Space Patterns in Guiyang City, China. Land, 14(11), 2257. https://doi.org/10.3390/land14112257


