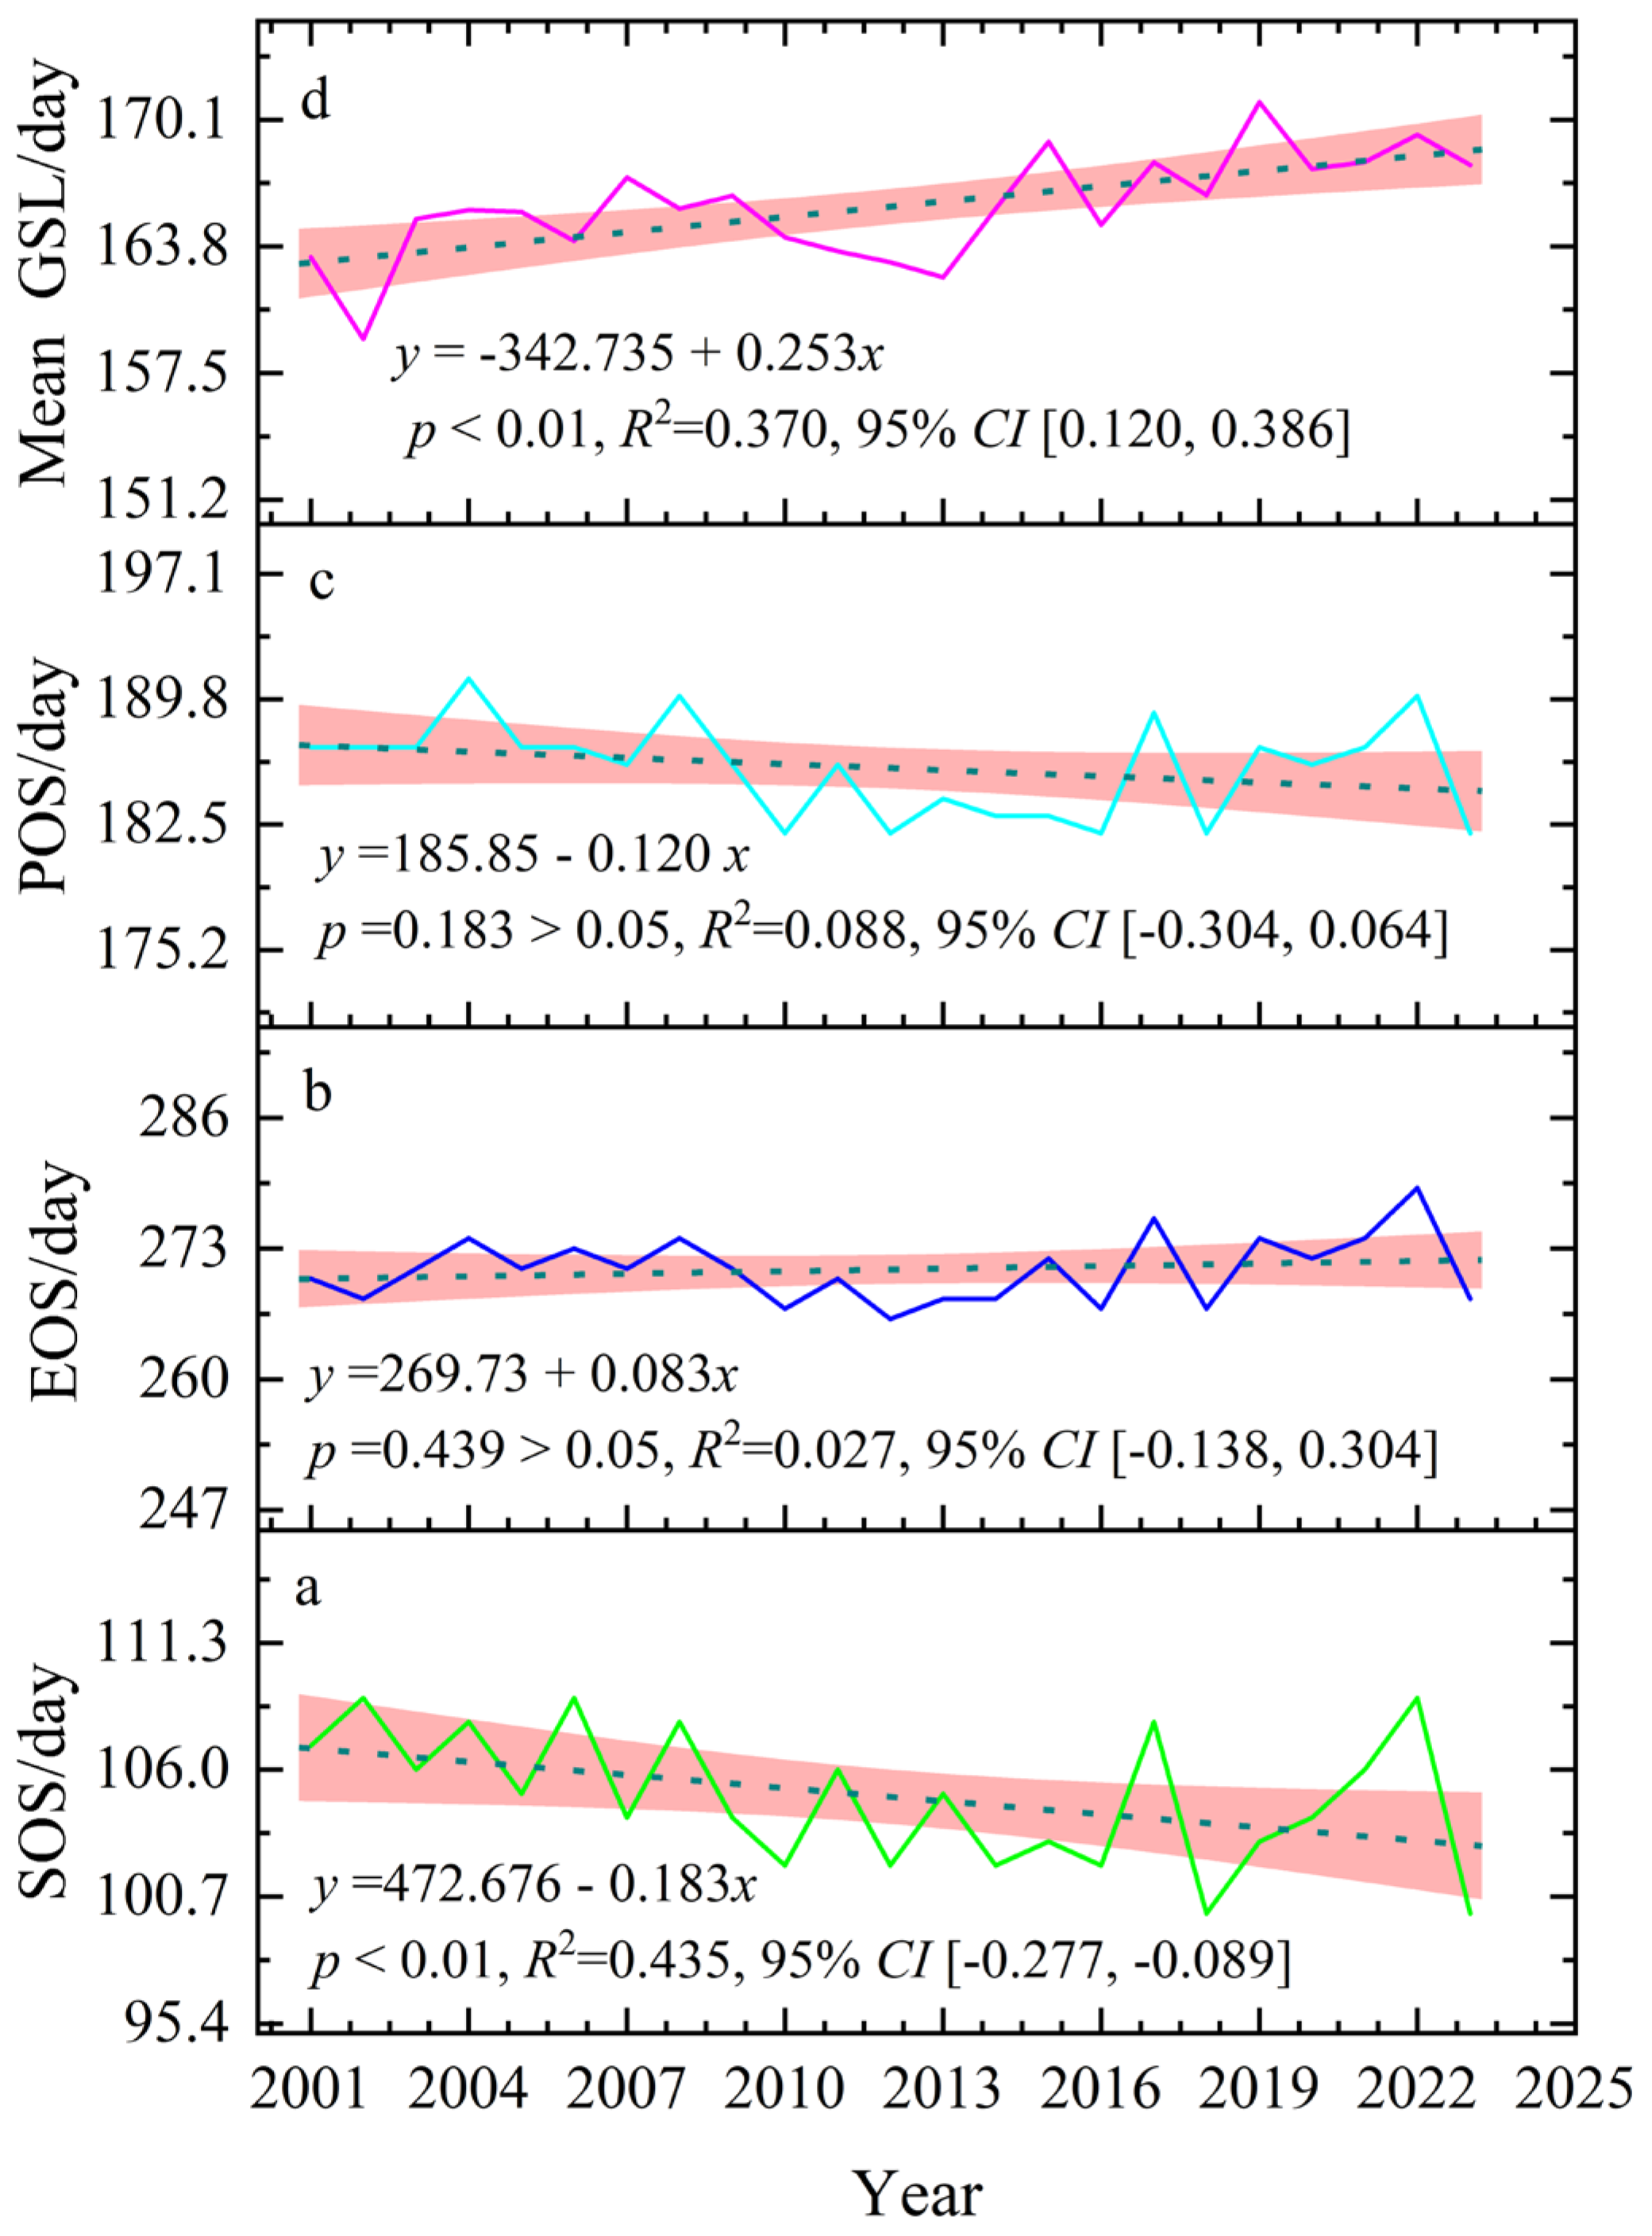
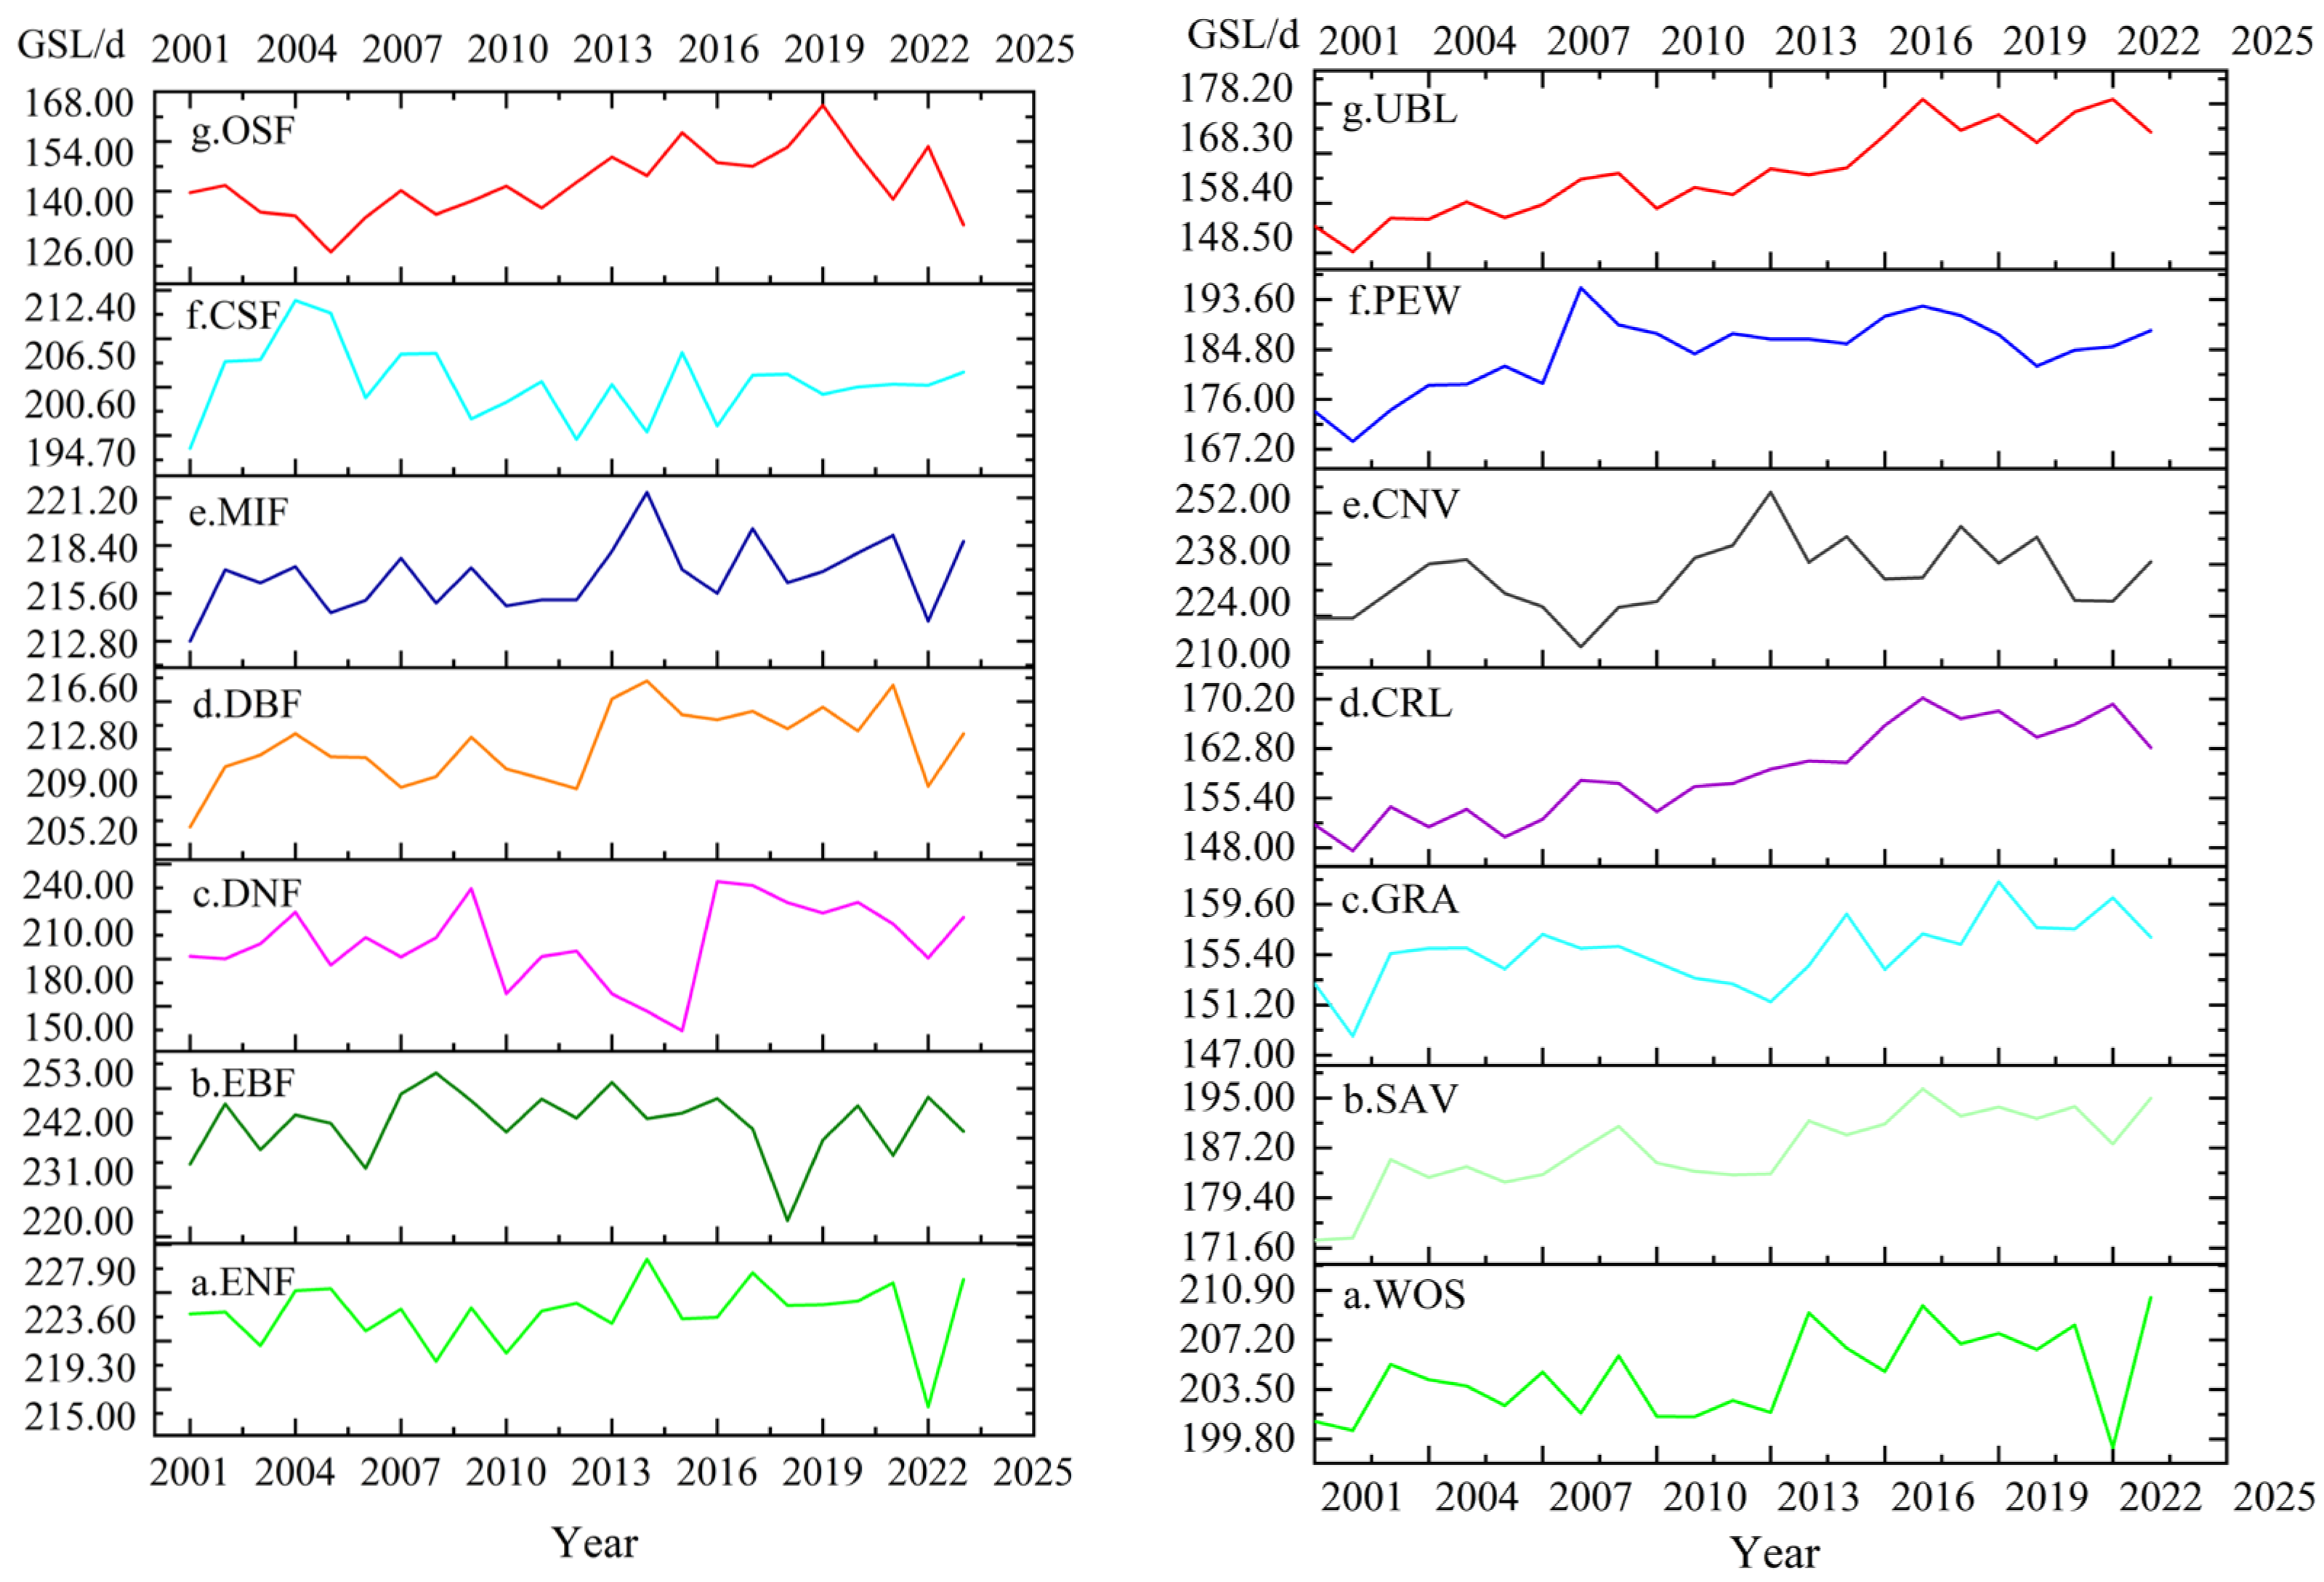
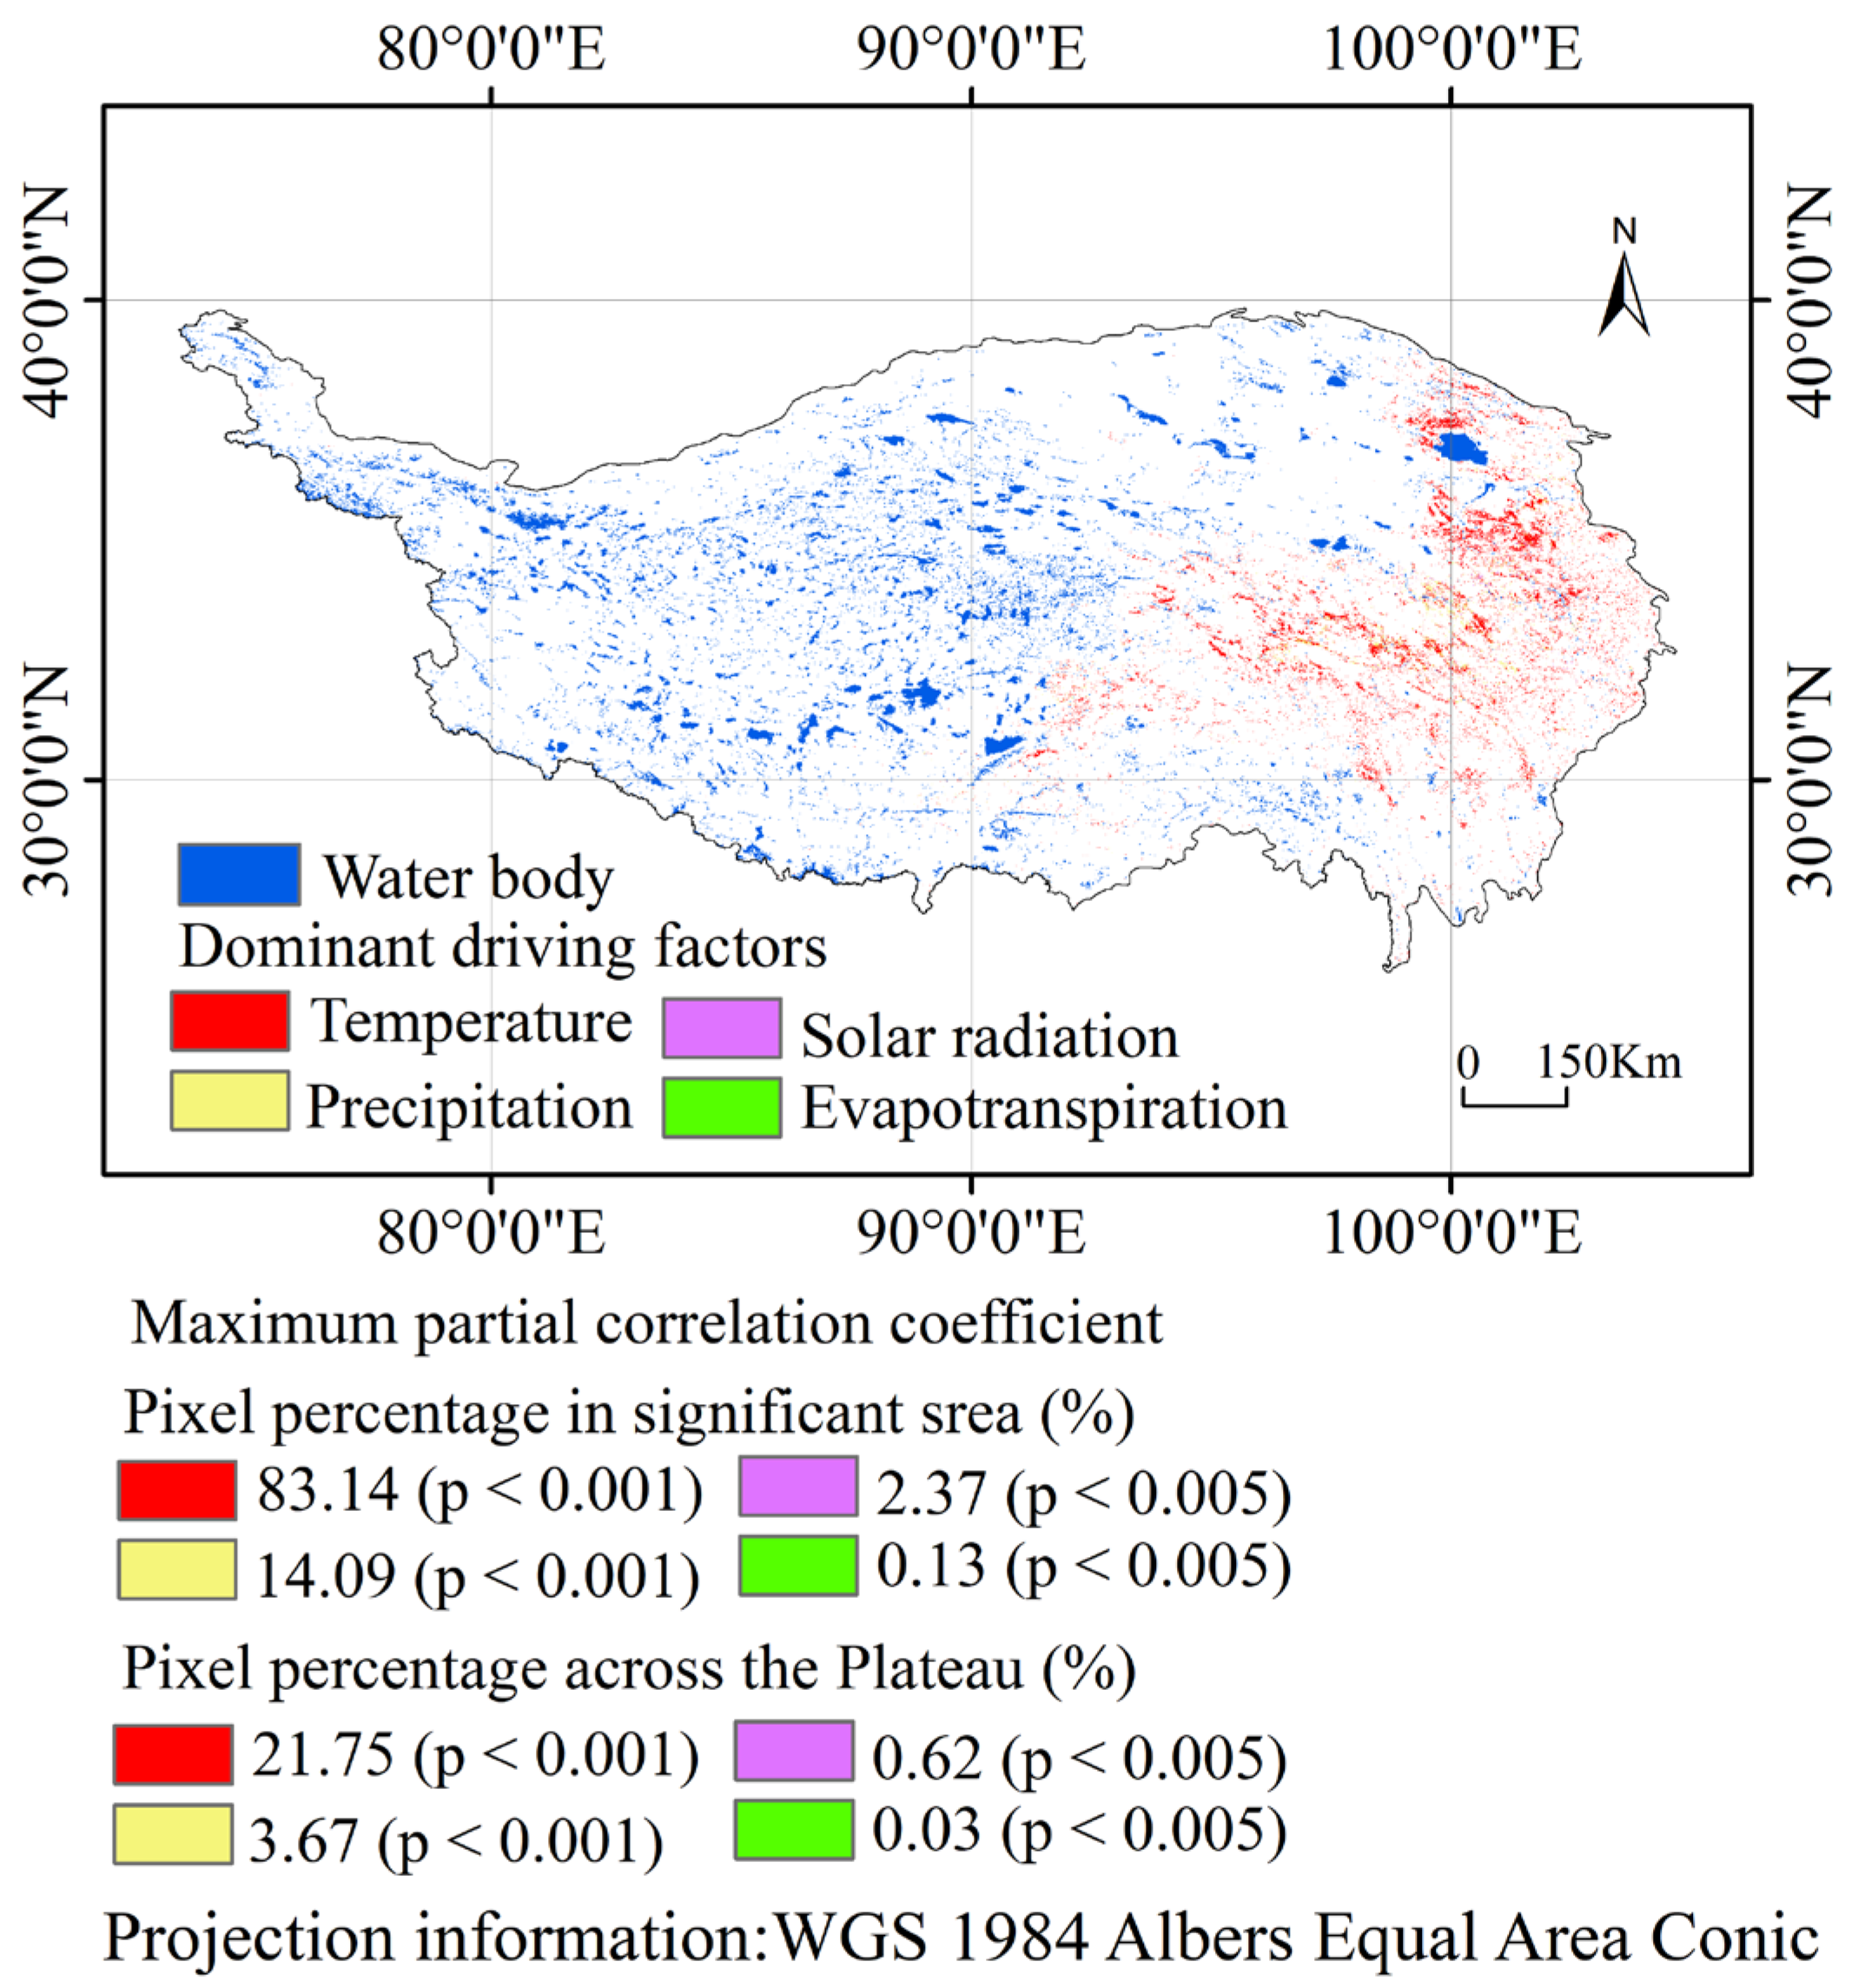
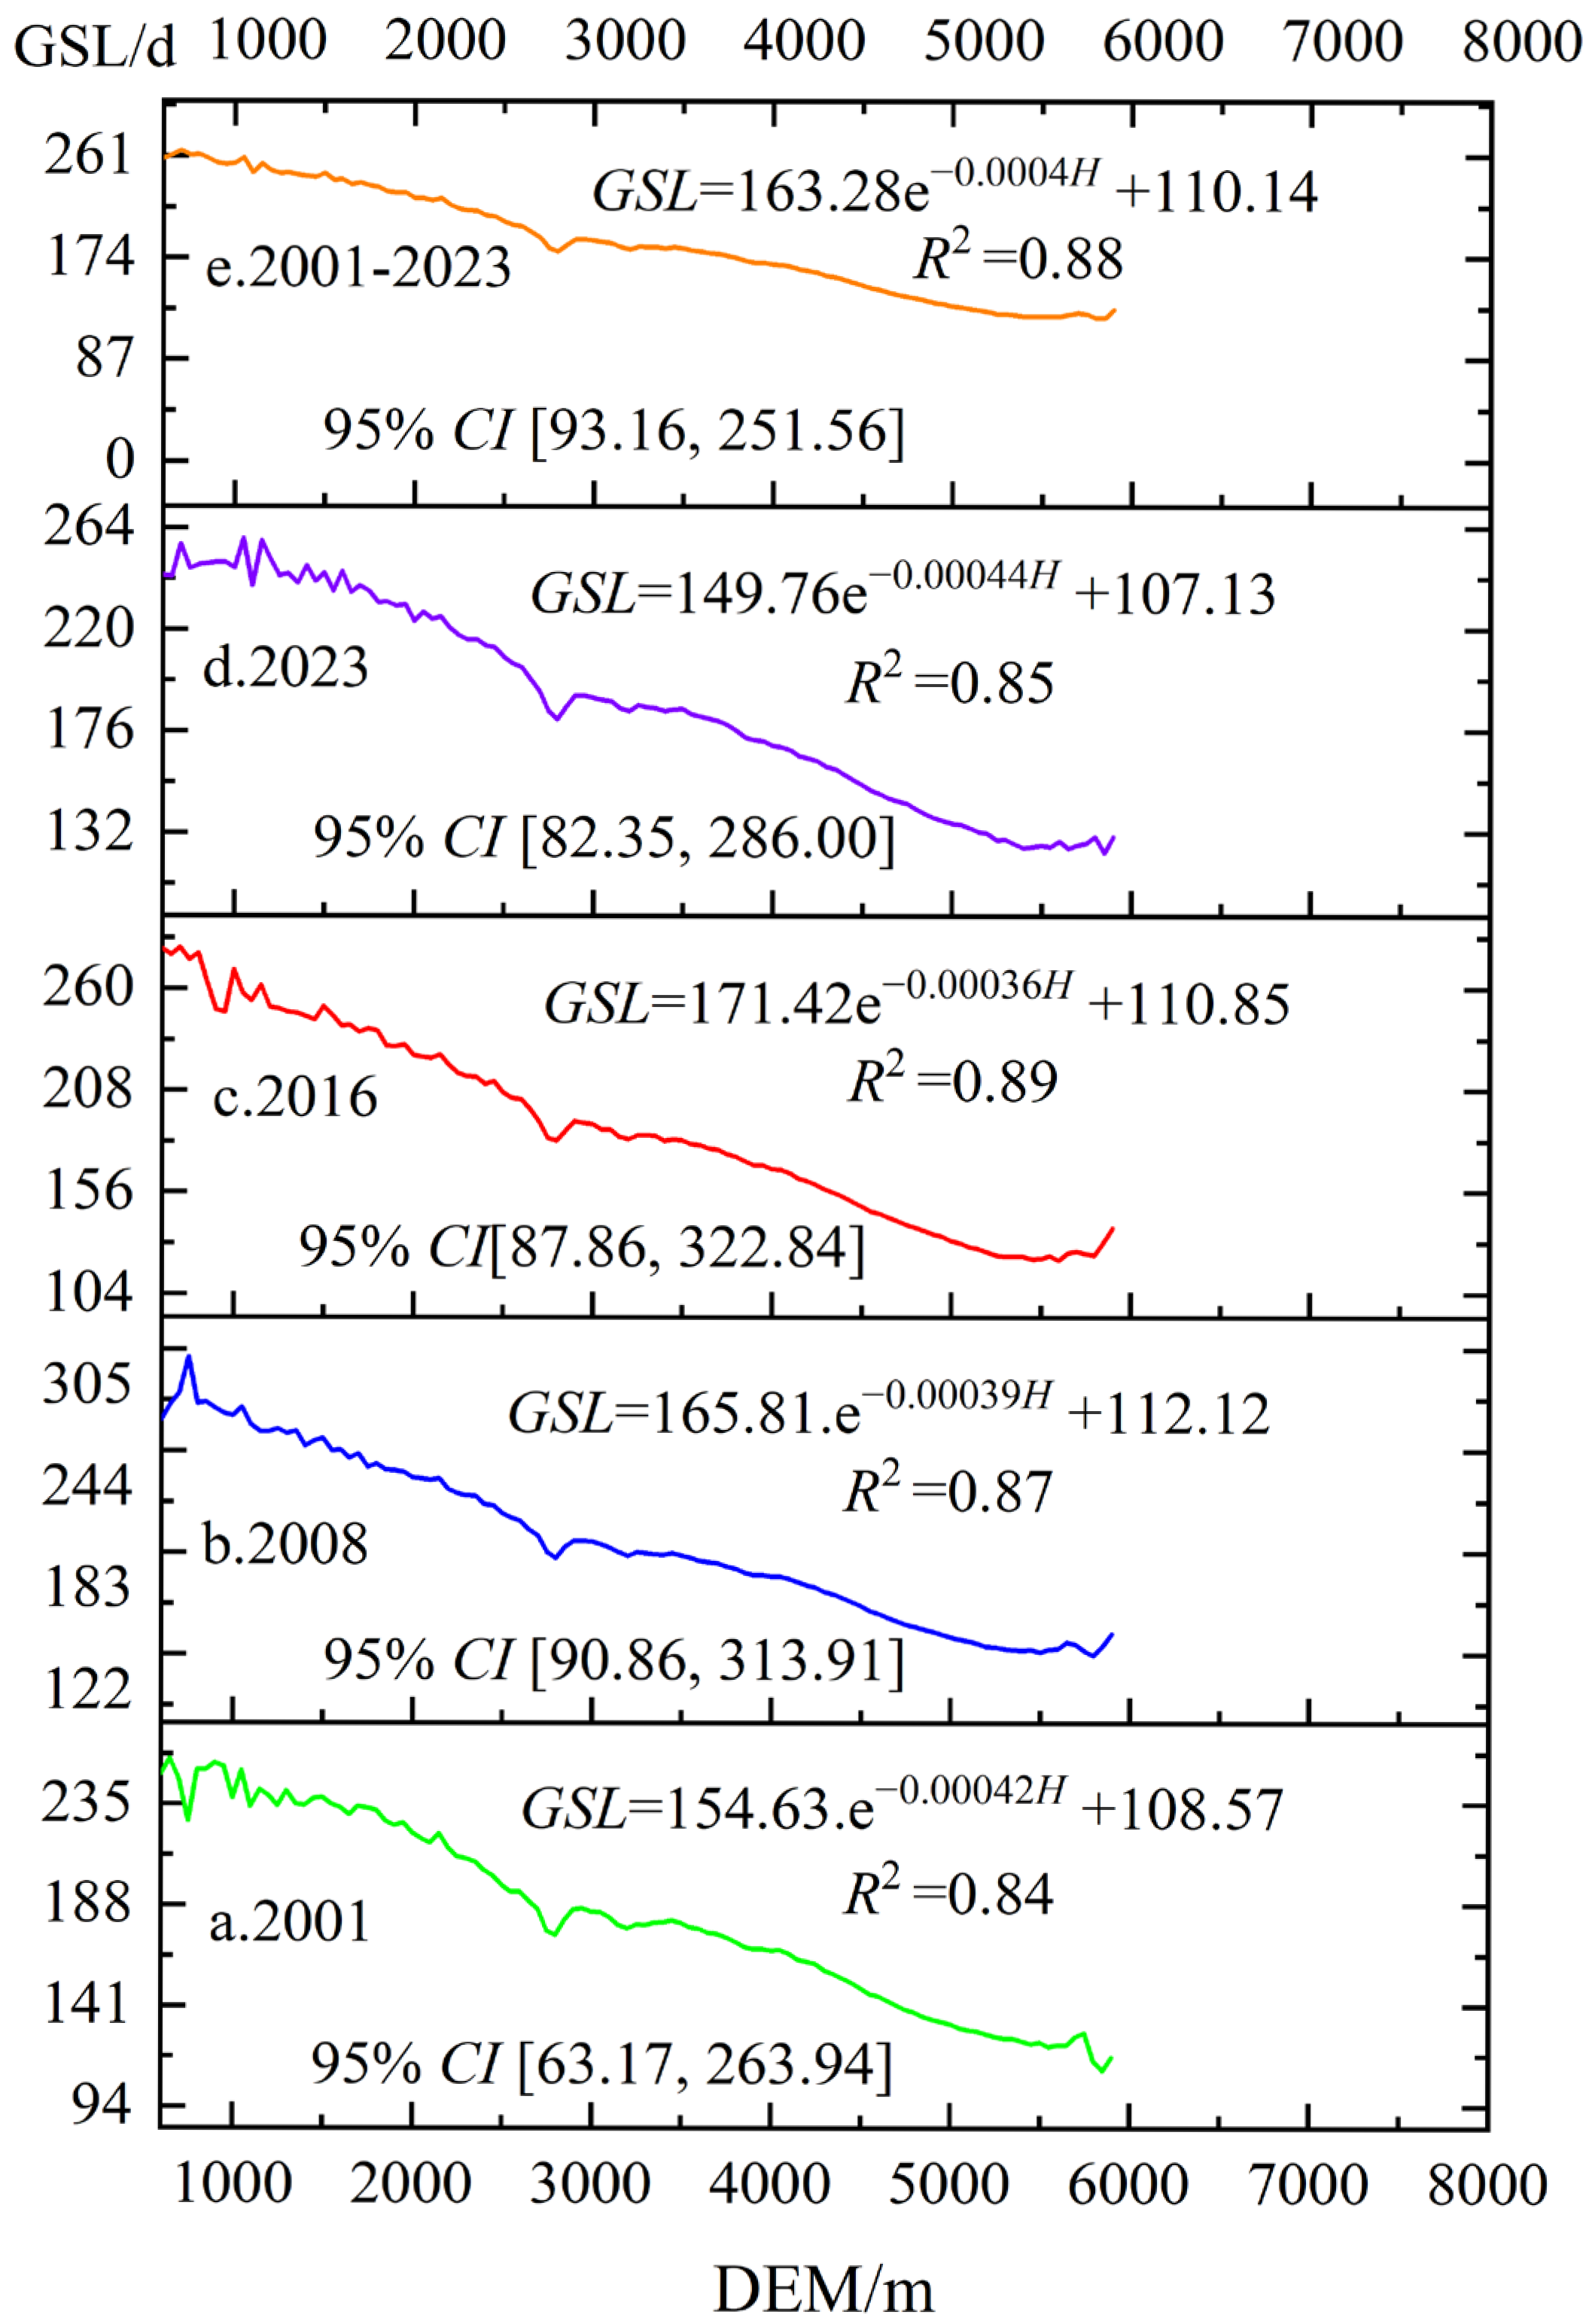
Phenological parameters derived from MODIS NDVI data between 2001 and 2023 reveal pronounced spatiotemporal variations in vegetation phenology across the Tibetan Plateau. Overall, during the past 23 years, vegetation phenology on the plateau has shown a distinct trend characterized by the extension of the Growing Season Length (GSL). This change is jointly driven by delayed autumn phenology and a modest advancement of spring phenology, underscoring the high sensitivity of plateau ecosystems to climate change.
4.4. Trends and Significance of GSL
Sen’s slope estimates reveal that the GSL of vegetation across most of the Tibetan Plateau has exhibited a highly significant increasing trend (
p < 0.01;
Z = 3.21,
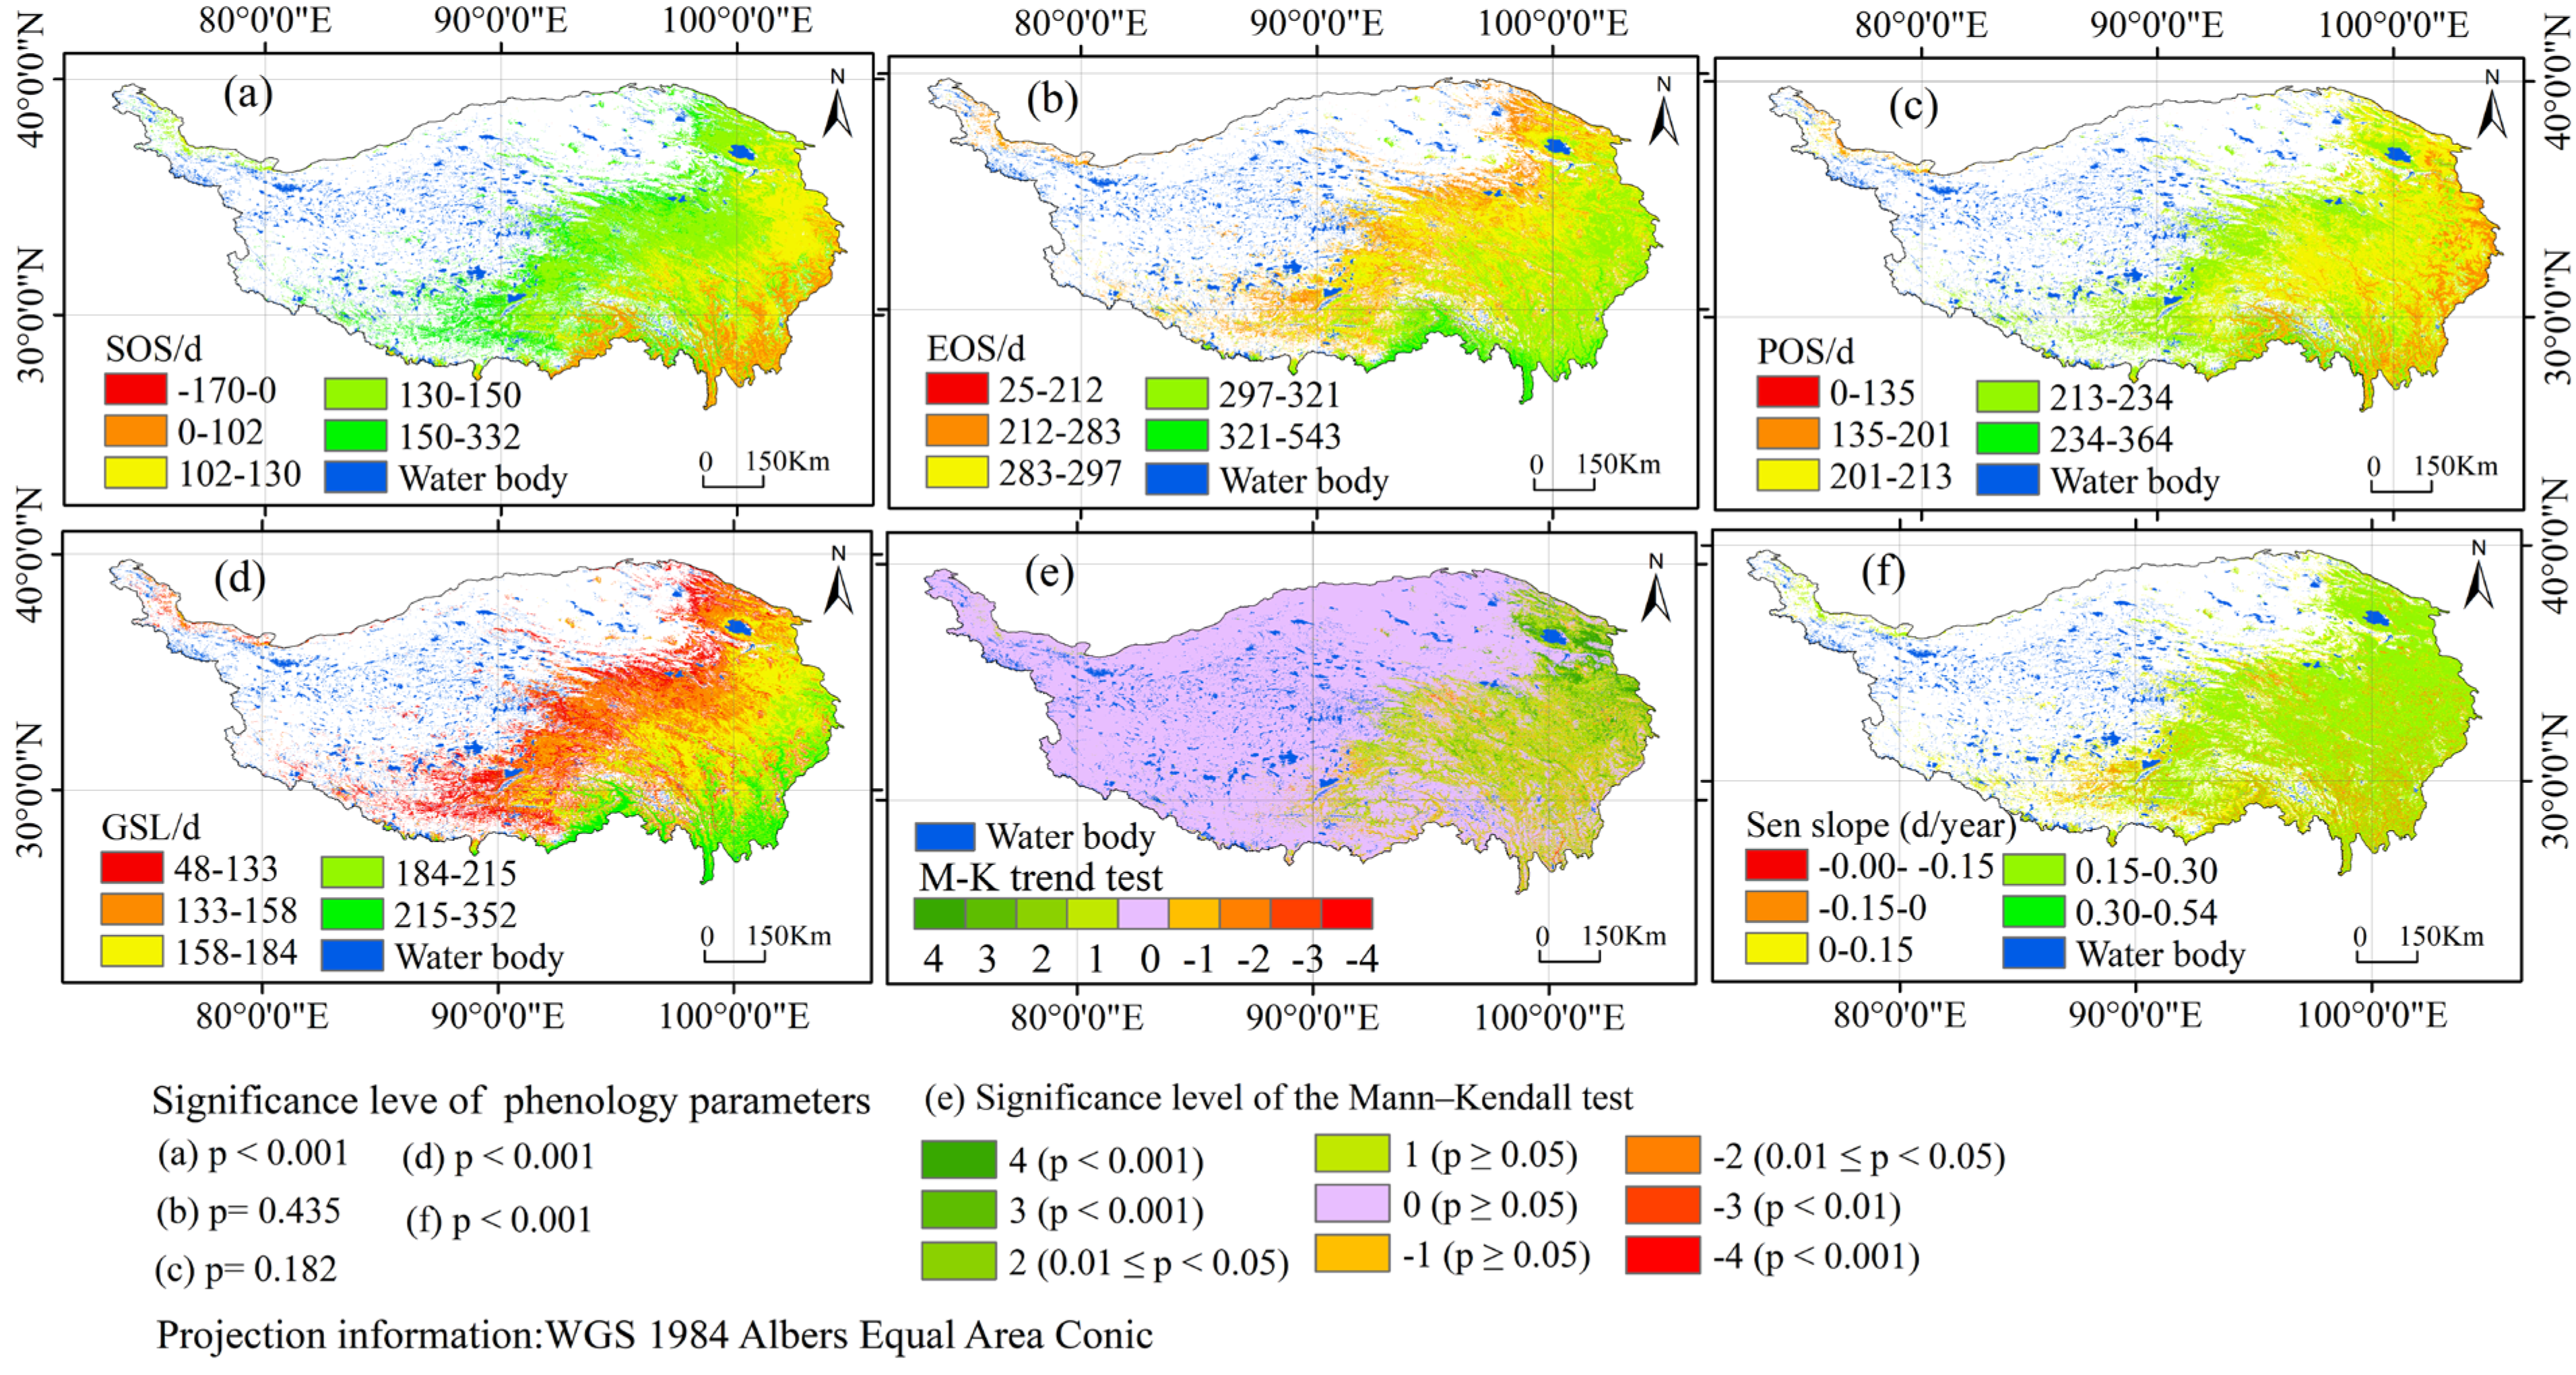
p < 0.001), with an extension rate of 0.183 days per year. This corresponds to an increase of approximately 1.83 days per decade, amounting to a cumulative extension of about 4.2~5.8 days over the 23-year period, indicating a substantial lengthening of the effective growing season. Nonetheless, the GSL trends display pronounced spatial heterogeneity: the southeastern valleys show the most marked increases (Sen’s slope > 0.4), whereas localized shortening occurs in the northern and western cold-arid regions (
Figure 3f), reflecting clear regional variability and ecological threshold effects in alpine ecosystem responses to warming.
Mann–Kendall non-parametric tests (
Figure 3e,
Table 6) indicate that the significance of GSL trends from 2001 to 2023 exhibits a distinct spatial pattern. The majority of the plateau (86.57%) shows no statistically significant change (
p ≥ 0.05), predominantly in cold desert and grassland ecosystems such as the Qiangtang Plateau, Hoh Xil, and Ali Plateau. This suggests that GSL in these areas is relatively stable and responds weakly to climate change, likely due to water limitations or the buffering capacity of these ecosystems.
A slight increasing trend (0 <
Z < 1.645,
p ≥ 0.05) is observed in 6.60% of the area, mainly in valley and grassland regions in the eastern and southeastern parts of the plateau (
Table 6). Notably, 3.54% of the area shows statistically significant increases (
Z ≥ 1.645), including regions of significant increase (1.645 ≤
Z < 1.96, 1.01%), sharp increase (1.96 ≤
Z < 2.58, 1.31%), and highly significant increase (
Z ≥ 2.58, 1.22%) (
Table 6). These areas are primarily located in the Three-River Source region, the eastern Hengduan Mountains, the lower reaches of the Yarlung Tsangpo River, and the Nyingchi–Qamdo corridor. Here, the synergistic effects of rising temperatures and increased precipitation have created optimal hydrothermal conditions that promote the extension of the growing season.
By contrast, areas exhibiting slight decreases (
Z < 0,
p ≥ 0.05) cover 156,600 km
2 (2.93%), mostly distributed along the northern plateau margins and cold transitional zones (
Table 6). Regions experiencing significant to highly significant decreases (
Z ≤ −1.645) are limited to 0.35% of the area and are scattered, primarily in high-altitude or ecologically sensitive zones such as the Kunlun Mountains and the northern slopes of the Tanggula Mountains. The observed GSL shortening in these regions may be associated with enhanced water stress induced by warming, although the precise driving mechanisms warrant further investigation.
4.5. Correlations Between Vegetation Phenology and Climate Factors
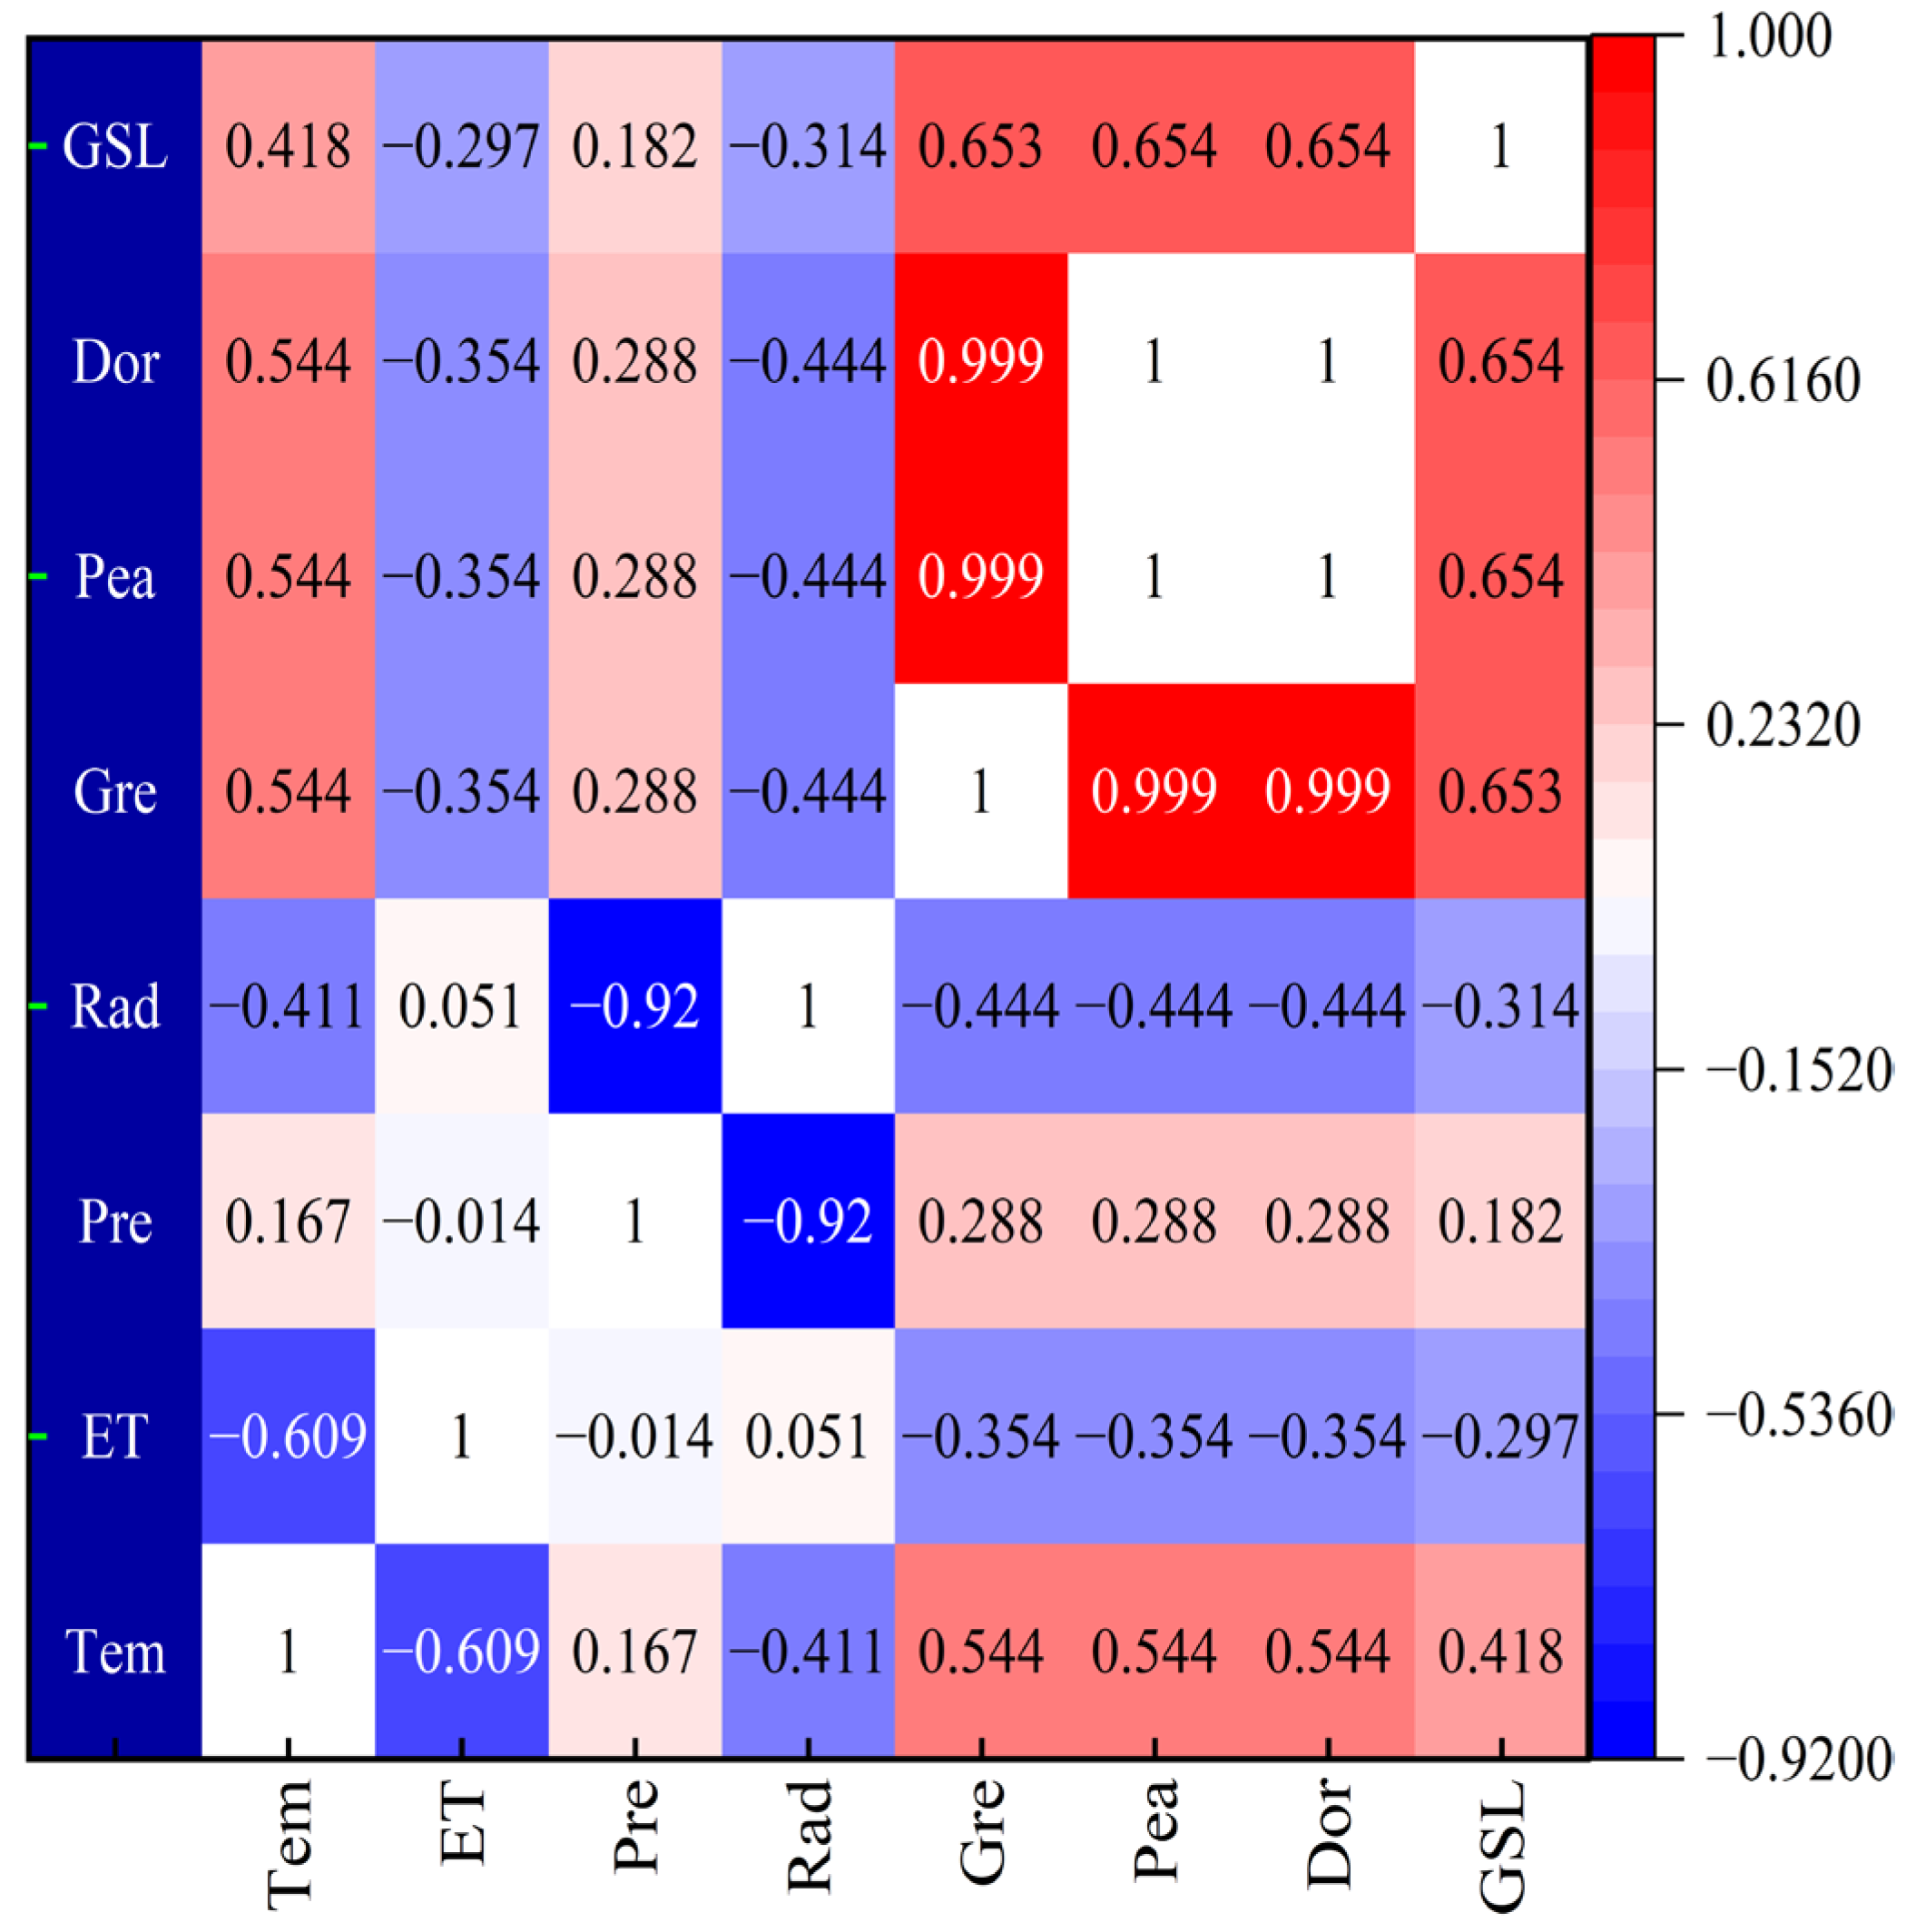
Using multi-source remote sensing and meteorological data from 2001 to 2023, we conducted Pearson correlation analyses to examine the relationships between temperature (Tem), evapotranspiration (ET), precipitation (Pre), surface solar radiation (Rad), and vegetation phenology parameters, including start of SOS POS, end of EOS, as well as growing season length (GSL) (
Figure 5).
The analysis indicates that temperature is the primary climatic driver of vegetation phenology on the Tibetan Plateau. Temperature exhibits significant positive correlations with SOS, POS, and EOS (r = 0.544, p < 0.01, n = 23), and a moderate positive correlation with GSL (r = 0.418, p < 0.05), suggesting that rising temperatures may advance the onset of greening, delay dormancy, and consequently extend the growing season. In contrast, ET shows consistent negative correlations with all phenological parameters (r = −0.354, p < 0.05) and with GSL (r = −0.297, p < 0.05), indicating that high ET—and the associated water stress—may constrain phenological development and shorten the growing season.
Precipitation displays relatively weak correlations with phenological parameters and GSL (r = 0.182~0.288, p > 0.05), suggesting that it is not the dominant factor controlling phenological changes on the Tibetan Plateau, likely due to time-lag effects and regional hydrothermal constraints. Surface solar radiation is moderately negatively correlated with phenology parameters and GSL (r = −0.314 to −0.444, p < 0.05). Notably, radiation and precipitation are strongly negatively correlated (r = −0.92, p < 0.001), implying that periods of high radiation are typically accompanied by reduced precipitation, potentially exacerbating drought stress and adversely affecting vegetation phenology.
Furthermore, the three key phenological stages, SOS, POS, and EOS are highly correlated with one another (r > 0.95, p < 0.001), indicating strong interannual synchrony likely driven by common climatic factors. GSL also shows strong correlations with all three stages (r > 0.65, p < 0.01), highlighting that growing season length is largely governed by the coordinated timing of critical phenological events.
4.6. Partial Correlation Analysis of Climatic Factors with GSL
4.6.1. Partial Correlation Analysis of Temperature Regulation on SGL
Based on remote sensing and meteorological observations from 2001 to 2023 (n = 23 years), this study employed partial correlation analysis to examine the statistical associations between temperature (Tem) and GSL, while controlling for precipitation (Pre), surface radiation (Rad), and evapotranspiration (ET) (degrees of freedom, df = 20). Significance levels were defined as follows: indicates p < 0.05, indicates p < 0.01, indicates p < 0.001, and values without asterisks are not significant (p ≥ 0.05). Smaller p-values indicate a lower likelihood that the observed associations are due to random chance, reflecting higher statistical reliability.
Based on remote sensing and meteorological observations from 2001 to 2023 (
n = 23 years), this study employed partial correlation analysis to systematically examine the independent statistical relationships between temperature (Tem), precipitation (Pre), surface radiation (Rad), evapotranspiration (ET), and GSL, while controlling for the effects of other climatic factors (degrees of freedom, df = 20). Significance levels were defined as follows: indicates significance at the 95% confidence level (
p < 0.05), at the 99% confidence level (
p < 0.01), at the 99.9% confidence level (
p < 0.001), and results without asterisks are not significant (
p ≥ 0.05). The results indicate that the statistical associations between GSL and climatic factors vary across spatial distribution, vegetation types, and elevation gradients, highlighting heterogeneous patterns in vegetation-climate relationships on the Tibetan Plateau (
Figure 6a−c).
- (1)
Statistical associations between temperature and GSL under controlled solar radiation
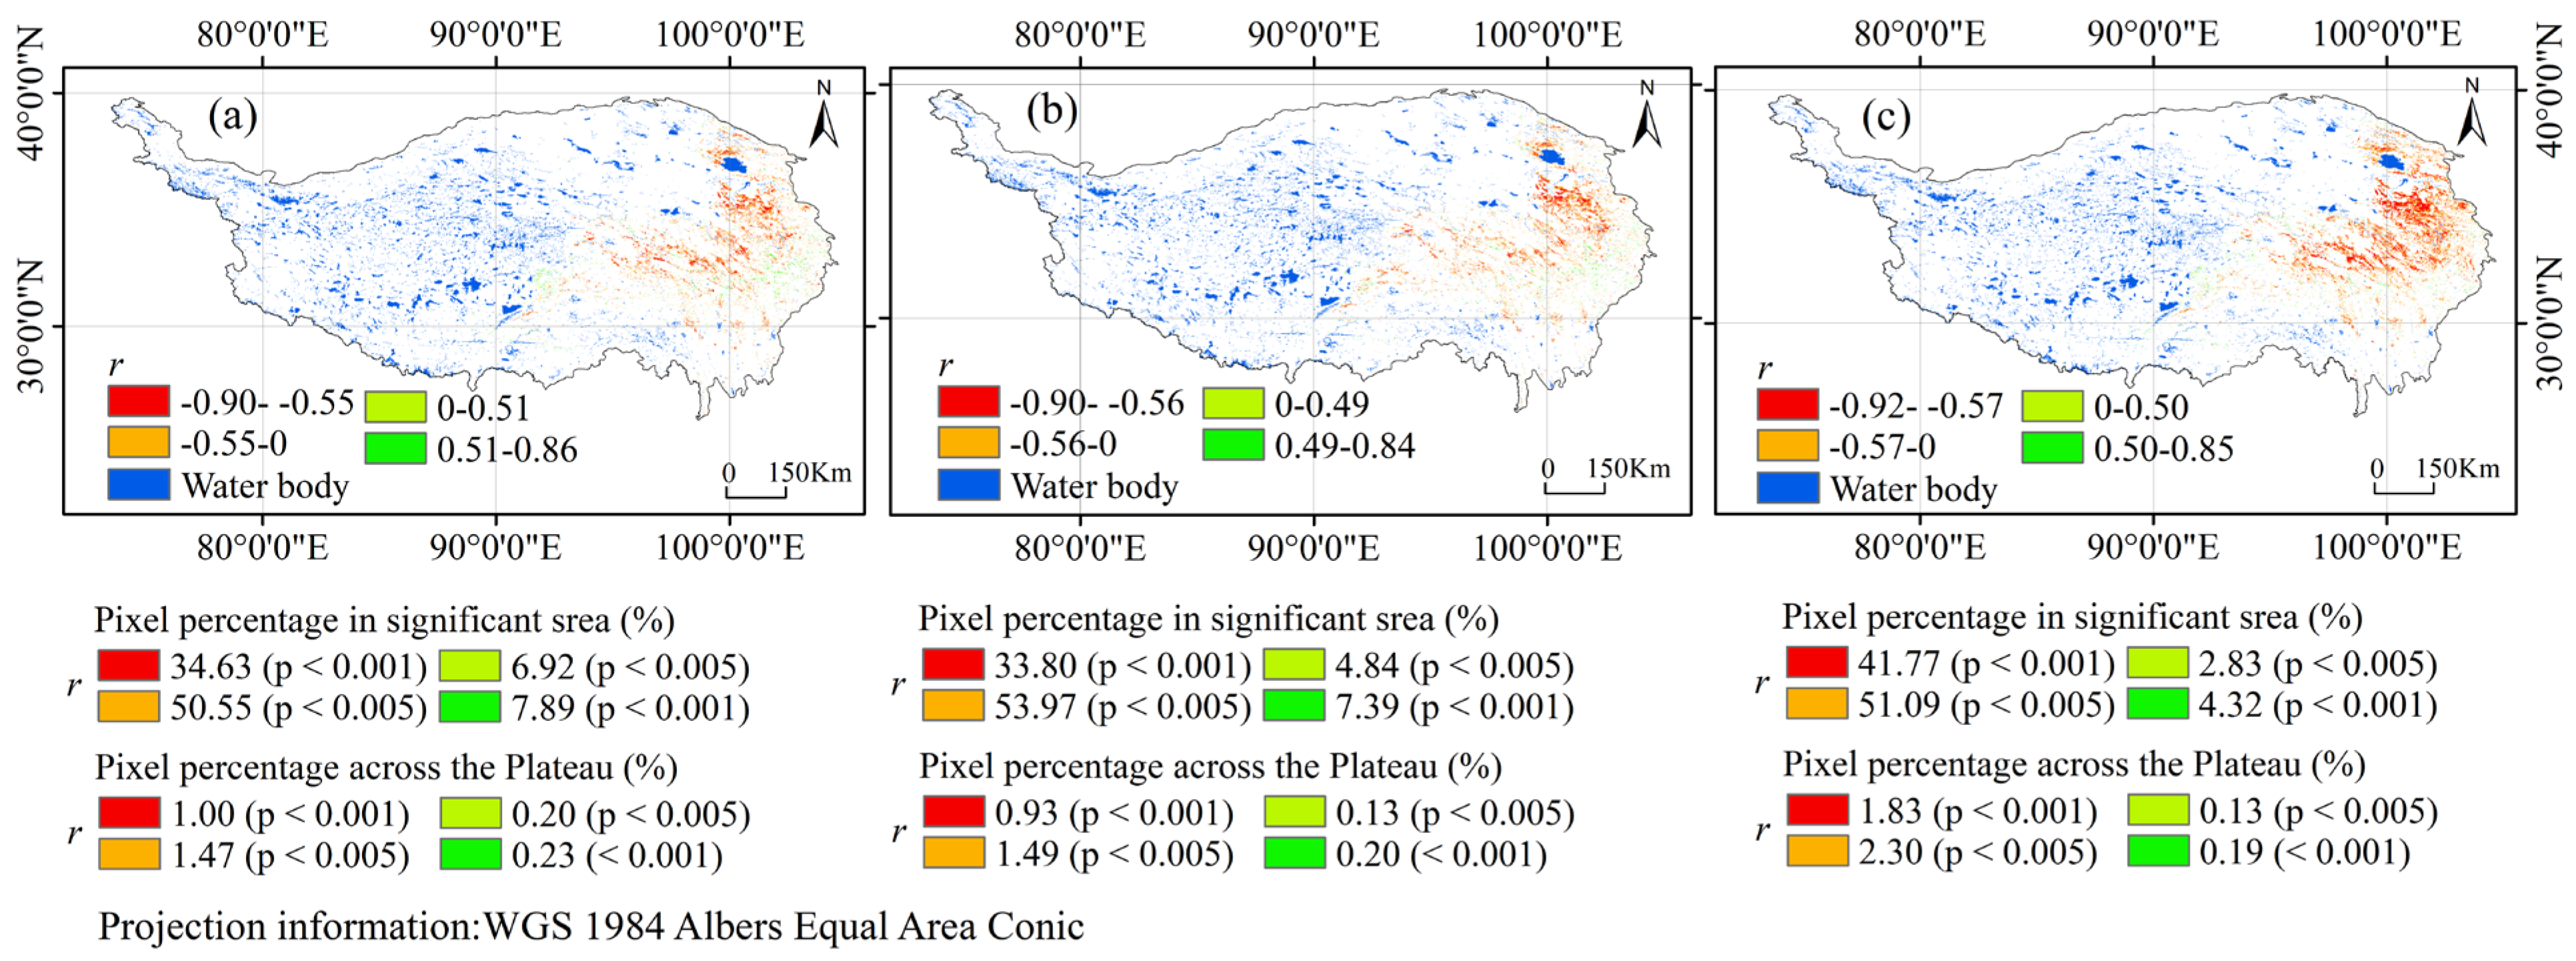
Under controlled solar radiation conditions, the statistical associations between temperature and GSL of vegetation on the Tibetan Plateau exhibited pronounced spatial heterogeneity (
Figure 6a). Across the plateau, only 2.90% of the area showed statistically significant correlations (
p < 0.05). Within these significant regions, correlation coefficients were predominantly negative, indicating that higher temperatures were associated with shorter GSL in these areas. Only a small fraction of areas displayed positive correlations, suggesting that in some localized regions, higher temperatures were associated with longer GSL.
Specifically, strong negative correlations (r = −0.90 to −0.55, p < 0.001) accounted for 1.00% of the total area, primarily distributed in the high–cold zones of the central and western plateau. Weak negative correlations (r = −0.55 to 0, p < 0.05) covered 1.47% of the area and were more scattered. Weak positive correlations (r = 0 to 0.51, p < 0.05) occurred sporadically, accounting for 0.20%, whereas strong positive correlations (r = 0.51 to 0.86, p < 0.001) represented 0.23%, concentrated in the eastern and southeastern plateau. Overall, statistically significant associations between temperature and GSL were limited to 2.90% of the plateau, with the remaining 97% showing no significant correlation.
The spatial pattern of temperature–GSL associations showed east–west differentiation. In the northeastern and eastern marginal regions, particularly the Three-Rivers Source area, stronger negative correlations were observed, whereas central and parts of western regions exhibited weak negative correlations. In some western and southeastern plateau areas with favorable water–heat conditions, weak to moderate positive correlations were observed, indicating that higher temperatures in these areas were associated with longer GSL.
This spatial differentiation reflects observed patterns of temperature–GSL relationships: strong negative correlations were more common in high–cold regions, while weak positive correlations were more frequent in warm and humid regions. In summary, the statistical associations between temperature and GSL varied across the Tibetan Plateau, showing heterogeneous patterns that differ by region and local environmental conditions.
- (2)
Statistical associations between temperature and GSL under controlled precipitation
When controlling for precipitation, the statistical associations between temperature and the growing season length (GSL) of Tibetan Plateau vegetation exhibited pronounced spatial heterogeneity. Positive correlations (r = 0.49~0.84, green areas) were predominantly observed in localized regions of the eastern and southern plateau, suggesting that in some regions, higher temperatures were associated with longer GSL. Areas with weak or non-significant correlations (r = −0.49~0.49, light-colored regions) were primarily concentrated in the central and northern plateau, indicating that higher temperatures were weakly associated or not significantly associated with GSL in these regions. In contrast, negative correlations (r = −0.90 to −0.56, red areas) were mainly distributed in high-altitude and northwestern marginal zones, indicating that higher temperatures were associated with shorter GSL in these areas.
Partial correlation analysis controlling for precipitation (
Figure 6b) revealed even stronger spatial heterogeneity in observed temperature−GSL associations. Across the plateau, only 2.76% of the area exhibited statistically significant correlations (
p < 0.05). Of these significant regions, approximately 87.78% (33.80% + 53.97%) displayed negative correlations, with strong negative correlations (
r = −0.90 to −0.56,
p < 0.001) accounting for 0.93% and weak negative correlations (
r = −0.56 to 0,
p < 0.05) covering 1.49% of the plateau. Positive correlations were relatively sparse, with weak positive correlations (r = 0~0.49,
p < 0.05) representing 0.13% and strong positive correlations (
r = 0.49~0.84,
p < 0.001) accounting for 0.20%. Negative correlations were concentrated in the eastern and southeastern plateau, including regions such as the Three-Rivers Source and northwestern Sichuan Plateau, whereas significant positive correlations were primarily observed in the northeastern high-altitude cold zones. These results indicate that only a small fraction of the plateau (2.76%) exhibited statistically significant temperature−GSL associations when precipitation effects were controlled.
The spatial pattern of temperature–GSL associations showed clear differentiation. Along the east–west gradient, positive correlations dominated low-altitude eastern regions, whereas high-altitude western and northwestern arid zones were mostly characterized by weak or negative correlations. Along the north–south gradient, southern mountainous areas and the southeastern margin generally exhibited positive correlations, while northern and northwestern arid regions were predominantly weakly correlated or negatively correlated. Isolated points of strong positive or strong negative correlations were also observed, reflecting observed heterogeneous patterns across local climate and topography. Overall, the statistical associations between temperature and GSL varied across the plateau, with higher temperatures in southeastern and low-altitude regions being associated with longer GSL, whereas in high-altitude or arid regions, higher temperatures were weakly or negatively associated with GSL. No causal interpretations (e.g., effects of ET or soil moisture) are inferred.
- (3)
Statistical associations between temperature and GSL under controlled ET
After controlling for the influence of ET, the statistical associations between temperature and GSL across the Tibetan Plateau became more pronounced (
Figure 6c). Partial correlation analysis indicated that across the Tibetan Plateau, only 4.50% of the area exhibited statistically significant correlations (
p < 0.05). Among these significant regions, the vast majority (91.86%) showed negative correlations, with strong negative correlations (
r = −0.92 to −0.57,
p < 0.001) accounting for 1.88% and weak negative correlations (
r = −0.57 to 0,
p < 0.05) covering 2.30% of the plateau. Positive correlations were relatively limited, with weak positive correlations (
r = 0~0.50,
p < 0.05) representing 0.13% and strong positive correlations (
r = 0.50~0.85,
p < 0.001) accounting for 0.19%.
Spatially, negative correlations were primarily concentrated in high-altitude and northwestern regions, indicating that higher temperatures in these areas were associated with shorter GSL. Positive correlations were mostly scattered in the northeastern high-altitude cold zones and some localized southeastern low-altitude regions, indicating that higher temperatures in these areas were associated with longer GSL. Overall, these results indicate that, after controlling for ET, only a small fraction of the plateau (4.50%) exhibited statistically significant temperature–GSL associations, with negative correlations predominating, reflecting spatial heterogeneity in observed patterns. No causal interpretations (e.g., snowmelt acceleration, permafrost thaw, or vegetation growth promotion) are inferred.
4.6.2. Statistical Associations Between Precipitation and GSL
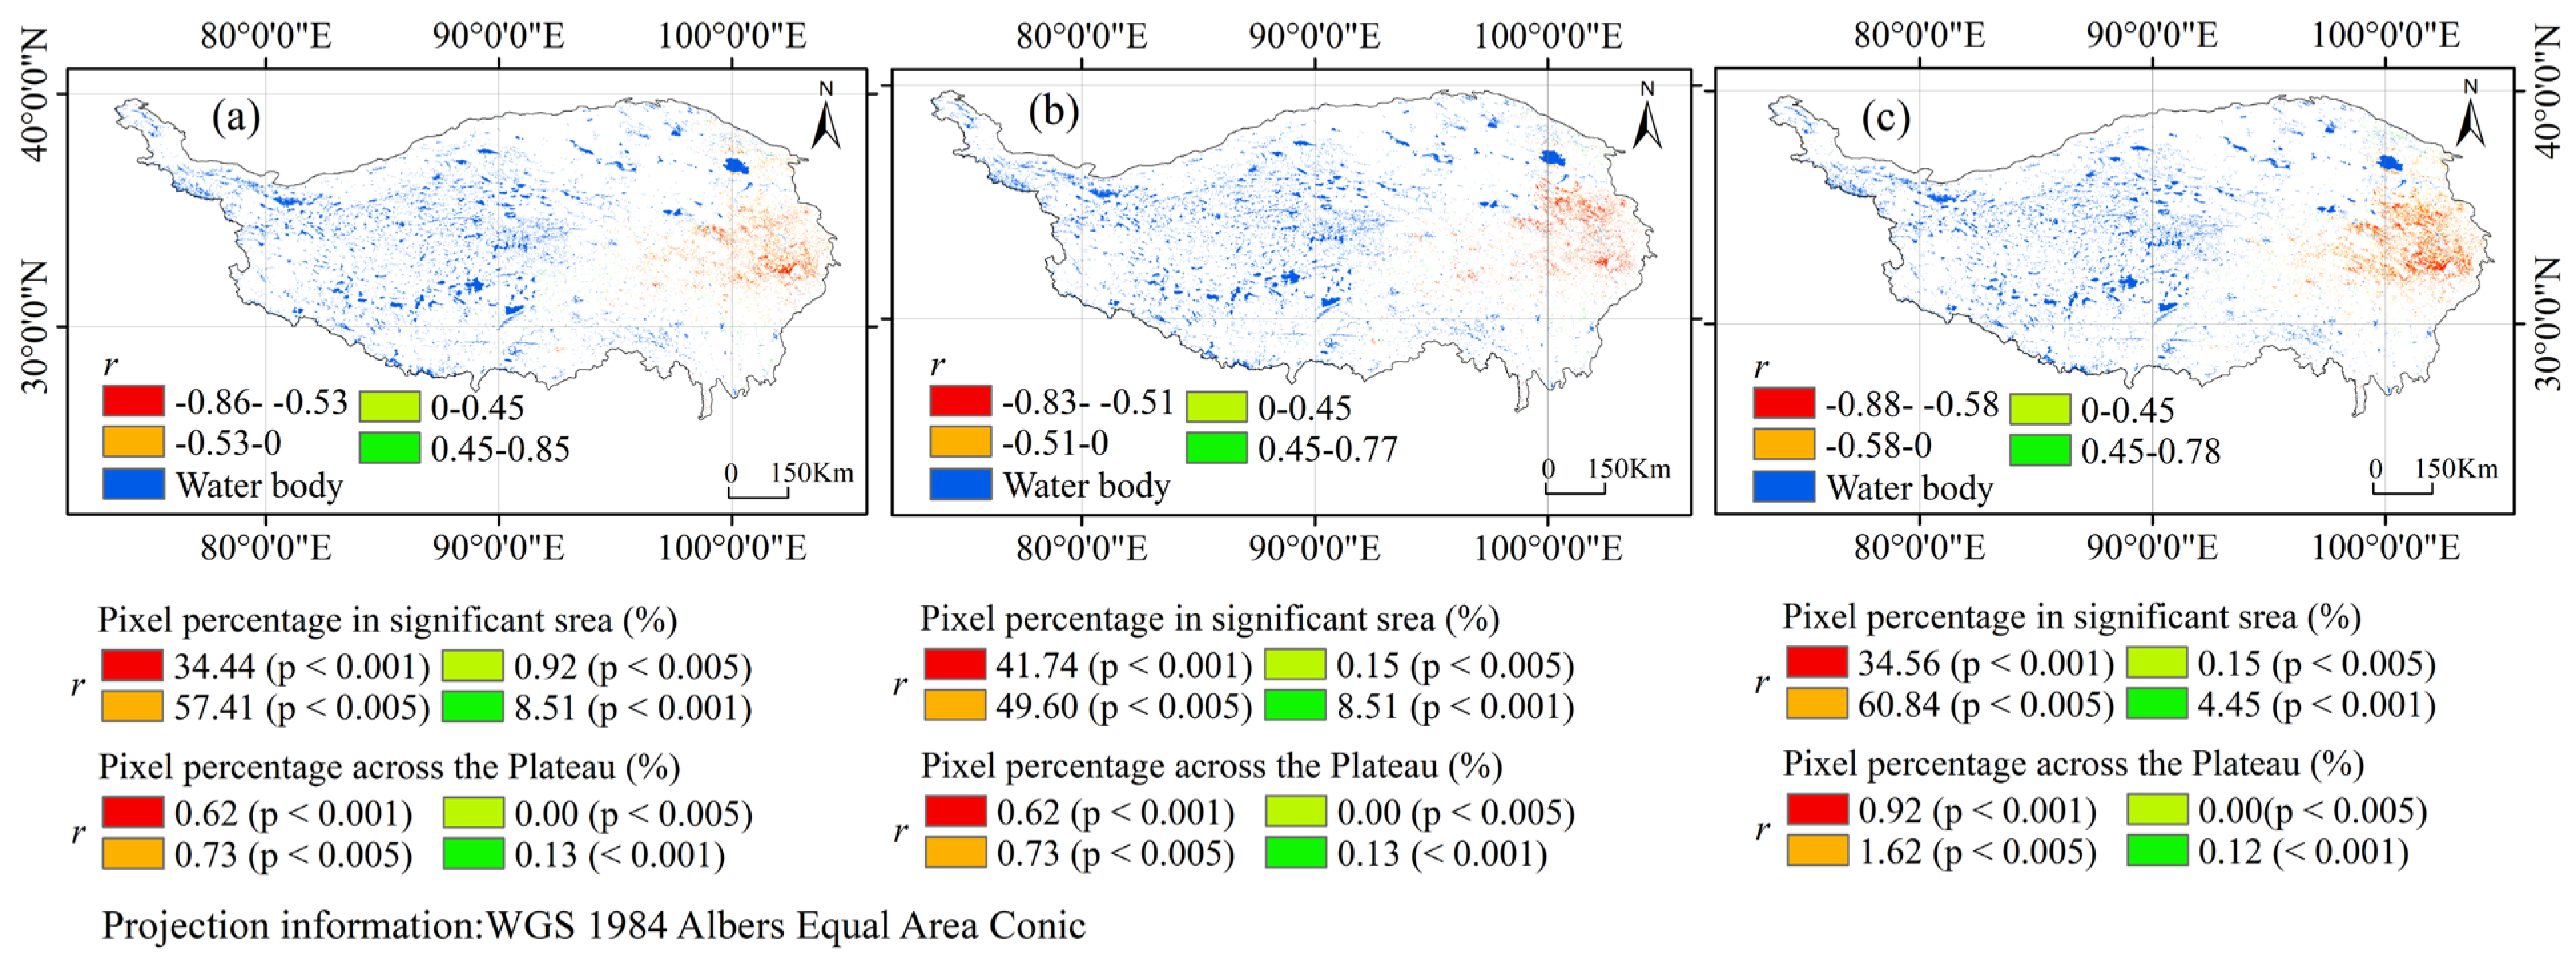
Water availability is an important climatic variable associated with vegetation phenology in alpine regions. To systematically assess the statistical associations between precipitation and the growing season length (GSL) of Tibetan Plateau vegetation under varying climatic contexts, we conducted partial correlation analyses using multisource remote sensing and meteorological data spanning 2001~2023. Spatial correlations between precipitation and GSL were evaluated while controlling separately for temperature, solar radiation, and ET (
Figure 7). Only pixels passing the significance threshold (
p < 0.05) were retained, with a 23-year temporal sample (degrees of freedom, df = 20) to ensure statistical robustness. The results reveal pronounced spatial heterogeneity and variable patterns of association, highlighting observed spatial differences in precipitation—GSL relationships across the plateau.
- (1)
Statistical associations between precipitation and GSL under controlled temperature
After controlling for temperature, only 2.39% of the plateau exhibited statistically significant precipitation–GSL associations (
p < 0.05). Within these areas, the majority (84.11%) displayed positive correlations (
Figure 7a). Strong positive correlations (
r = 0.53~0.88,
p < 0.001) accounted for 0.94% of the plateau and were concentrated in the eastern and southeastern regions, including the Sichuan–Yunnan–Tibet junction and the eastern margin of the Hengduan Mountains. These areas feature favorable water−heat conditions and are dominated by alpine shrubs and meadows, where higher precipitation was associated with longer GSL. Moderate positive correlations (
r = 0~0.53,
p < 0.05) occupied 1.07% of the plateau, primarily in central regions, indicating that higher precipitation was weakly associated with longer GSL, with spatial patterns potentially influenced by solar radiation, soil properties, and other local factors.
Negative correlations accounted for 15.89% of the significant areas, including weak negative correlations (r = −0.50~0, p < 0.05; 0.17%) and strong negative correlations (r = −0.84~−0.50, p < 0.001; 0.21%), mainly distributed in arid high–cold zones such as the western Ali Plateau and the Qiangtang Grassland. Spatially, these observations indicate that only a small fraction of the plateau exhibited statistically significant precipitation–GSL associations after controlling for temperature. No causal interpretations (e.g., soil waterlogging, suppressed photosynthesis) are inferred.
Overall, the spatial pattern of precipitation–GSL associations follows a gradient from southeast to west, reflecting observed regional differences in how precipitation and GSL are statistically associated, without implying mechanistic causation.
- (2)
Statistical associations between precipitation and GSL under controlled solar radiation
After controlling for solar radiation, only 2.21% of the Tibetan Plateau showed a statistically significant precipitation–GSL association (
p < 0.05). Among these areas, precipitation was predominantly positively correlated with GSL, accounting for 83.31% (
Figure 7b). Weak positive correlation areas (
r = 0~0.53,
p < 0.05) and strong positive correlation areas (
r > 0.53,
p < 0.001) represented 1.00% and 0.84% of the plateau, respectively, and were mainly located in southeastern Tibet, the western Sichuan Plateau, and southern Qinghai. These regions are strongly influenced by the monsoon, with annual precipitation typically ranging from 400 to 800 mm. Vegetation is dominated by alpine meadows and shrubs, where higher precipitation was associated with longer GSL.
Negatively correlated areas accounted for 16.68%, including weak negative correlations (r = −0.52~0, p < 0.05) at 0.20% and significant negative correlations (r < −0.52, p < 0.001) at 0.17%, primarily distributed across the central and western high-altitude deserts and grasslands. These areas generally receive less than 300 mm of precipitation annually, with large interannual variability. Observed negative correlations may reflect associations with episodic precipitation events, without implying causation.
These observations indicate that only a small fraction (2.21%) of the Tibetan Plateau exhibits statistically significant precipitation–GSL associations when solar radiation is controlled. No causal interpretations (e.g., driver, effect on GSL) are inferred, and the direction of associations varies across regional hydrothermal conditions.
- (3)
Statistical associations between precipitation and GSL under controlled ET
After controlling for ET, only 3.00% of the Tibetan Plateau exhibited statistically significant precipitation–GSL associations (
p < 0.05). Overall, positively correlated areas accounted for over 90% of the significant regions. Weak positive correlation areas (
r = 0~0.55,
p < 0.05) and strong positive correlation areas (
r > 0.55,
p < 0.001) represented 1.53% and 1.17% of the plateau, respectively (
Figure 7c), mainly in the eastern and southeastern plateau, indicating that higher precipitation was associated with longer GSL in these areas.
Significant negative correlation areas (
r = −0.82 to −0.48,
p < 0.001) accounted for 0.21% (
Figure 7c), mainly in the central high-altitude zone. Observed negative correlations may reflect associations with snow-dominated precipitation or delayed phenology, without implying causal effects. Weak negative correlation areas (
r = −0.48~0,
p < 0.05) accounted for only 0.09%, indicating that precipitation was weakly associated with GSL in these regions, with other factors such as temperature or radiation likely contributing to variability.
Overall, under controlled ET conditions, only 3.00% of the plateau exhibited statistically significant precipitation–GSL associations. Observed patterns vary with elevation, precipitation form (rain vs. snow), and local conditions, but no causal interpretations are made.
4.6.3. Statistical Associations Between Solar Radiation and GSL
Solar radiation is an important climatic variable associated with vegetation growth and phenology in alpine regions. To assess the statistical associations between solar radiation and the growing season length (GSL) of vegetation on the Tibetan Plateau under different climatic contexts, this study utilized multi-source remote sensing and meteorological data from 2001 to 2023. Partial correlation analysis was applied to systematically assess the relationship between solar radiation and GSL while controlling for three key climatic variables: temperature, precipitation, and ET (
Figure 8). Only pixels passing the 0.05 significance level were retained to ensure the robustness of the results. The findings indicate that observed associations between solar radiation and GSL exhibit pronounced spatial heterogeneity, with both the direction and magnitude of correlations varying depending on the controlled climatic factor, reflecting spatially variable patterns in Tibetan Plateau vegetation responses.
- (1)
Statistical associations under controlled temperature
When controlling for temperature, only 1.68% of the study area exhibited a statistically significant solar radiation–GSL association (
p < 0.05). Within these areas, partial correlations showed marked spatial variability (
Figure 8a).
The eastern and southeastern regions (approximately 92°~102° E, 26°~35° N), including the western Sichuan Plateau and the northern Yunnan transitional zone, exhibited significant positive correlations (r = 0.45~0.85, p < 0.001), accounting for 0.12% of the plateau. These areas, dominated by montane forests and alpine meadows with favorable hydrothermal conditions, showed positive associations between higher solar radiation and longer GSL. Central regions (approximately 88°~95° E, 30°~35° N) mostly showed weak positive correlations (r = 0~0.45, 0.02% of the plateau), indicating weak positive associations with GSL. In contrast, the northwestern and arid regions, such as Ngari (approximately 80°~85° E, 32°~35° N), exhibited strong negative correlations (r = −0.86 to −0.53, p < 0.001), accounting for 0.58% of the plateau. Observed negative correlations indicate that higher solar radiation was associated with shorter GSL in these areas, without implying causation.
Overall, under controlled temperature conditions, only a small fraction (1.68%) of the Tibetan Plateau exhibited statistically significant solar radiation–GSL associations. No causal interpretations (e.g., enhanced photosynthesis or increased ET causing growth changes) are inferred.
- (2)
Statistical associations under controlled precipitation
When controlling for precipitation, 1.48% of the plateau displayed statistically significant solar radiation–GSL associations (
p < 0.05), with notable changes in spatial patterns (
Figure 8b).
The eastern and southeastern regions remained positively correlated (r = 0.45~0.87, 0.13% of the plateau), indicating that higher solar radiation was associated with longer GSL in these areas. Most central and southwestern regions (approximately 85°~95° E, 28°~35° N) exhibited negative correlations, covering 1.35% of the plateau (with strong negative correlations r = −0.83 to −0.51, p < 0.001, accounting for 0.62%). Observed negative correlations indicate that higher solar radiation was associated with shorter GSL in these regions, without implying causation.
Overall, under controlled precipitation, only 1.48% of the plateau exhibited statistically significant solar radiation–GSL associations, and spatial patterns varied regionally. No causal interpretations (e.g., effects of ET or heat stress) are inferred.
- (3)
Statistical associations under controlled ET
When controlling for ET, 2.67% of the plateau showed statistically significant solar radiation–GSL associations (
p < 0.05), displaying an “eastern negative–western positive” spatial pattern (
Figure 8c).
Eastern and southeastern regions (approximately 92°~102° E, 26°~35° N) showed significant negative correlations (r = −0.88 to −0.55, p < 0.001), accounting for 0.92% of the plateau, indicating that higher solar radiation was associated with shorter GSL in these areas. Western and northern arid regions (approximately 78°~90° E, 33°~37° N) exhibited significant positive correlations (r = 0.45~0.78, p < 0.001), accounting for 0.12% of the plateau, indicating that higher solar radiation was associated with longer GSL in these energy-limited regions. Central transitional zones (approximately 90°~95° E, 30°~34° N) were dominated by weak negative correlations (r = −0.55~0, 1.62% of the plateau), reflecting spatially variable associations without implying causation.
In summary, the statistical associations between solar radiation and GSL exhibit pronounced spatial heterogeneity: eastern regions generally show negative correlations, western arid regions show positive correlations, and transitional zones display mixed associations. These observations indicate that the direction and magnitude of solar radiation–GSL associations vary regionally, without inferring causal mechanisms related to water, energy, or vegetation traits.
4.6.4. Statistical Associations Between ET and GSL
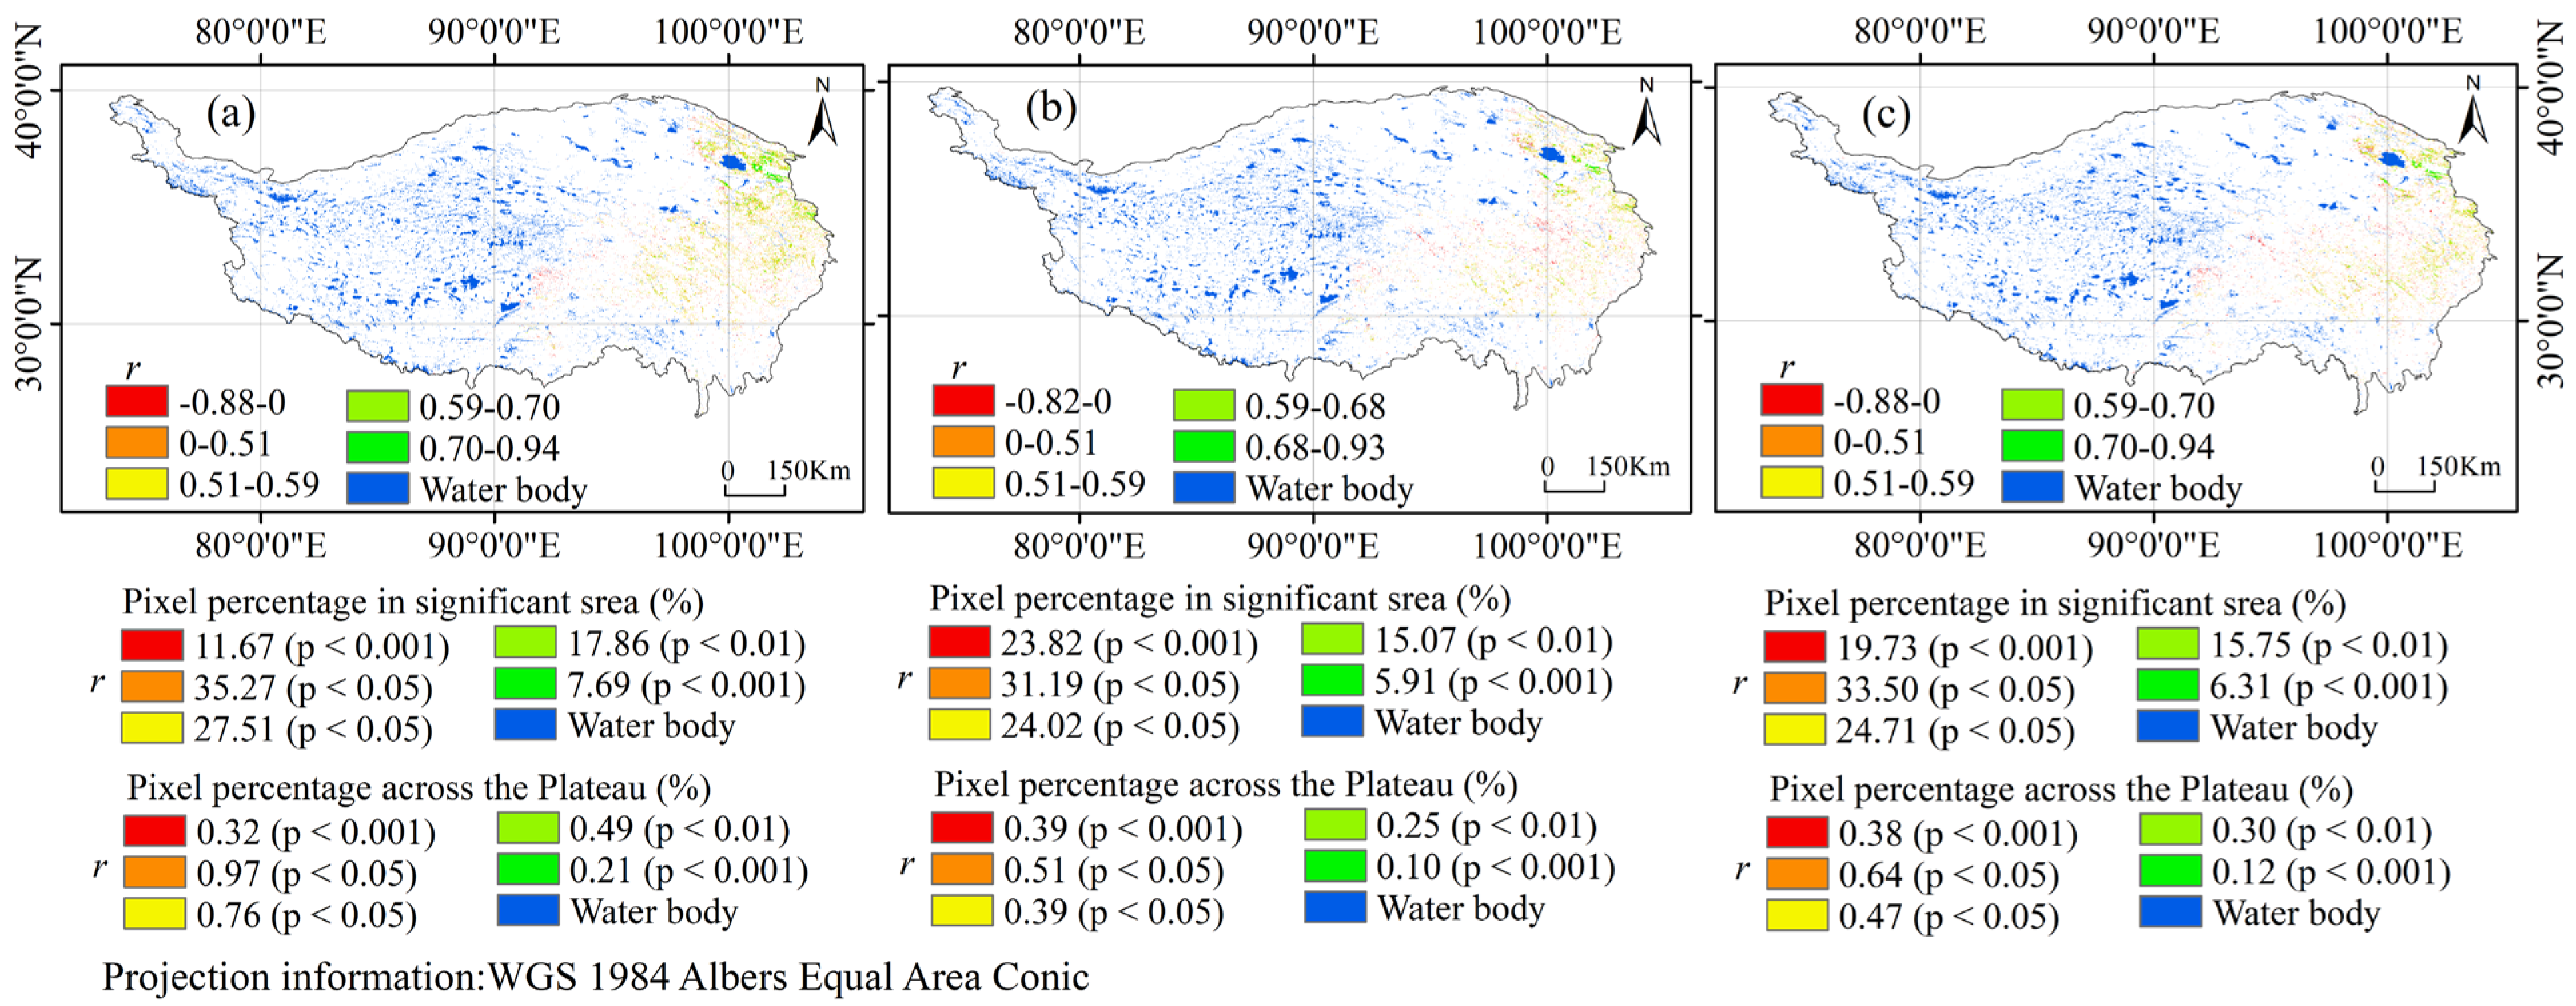
ET reflects surface energy and water cycling processes and is closely associated with vegetation phenology. To assess the statistical associations between ET and the growing season length (GSL) of vegetation on the Tibetan Plateau under different climatic contexts, this study utilized multi-source remote sensing and meteorological data from 2001 to 2023. Partial correlation analysis was applied while controlling for three key climatic factors-temperature, precipitation, and solar radiation—to quantify the associations between ET and GSL (
Figure 9). Only pixels meeting the 0.05 significance threshold were retained. Observed ET-GSL associations exhibit pronounced spatial heterogeneity, with both the direction and magnitude of correlations varying systematically across different climatic backgrounds, without implying causal mechanisms.
- (1)
Statistical associations under controlled temperature
Under controlled temperature conditions, only 2.75% of the Tibetan Plateau exhibited statistically significant ET–GSL associations (
p < 0.05). Partial correlation coefficients in these areas ranged from −0.88 to 0.94, reflecting bidirectional associations and spatial differentiation (
Figure 9a).
Positive correlations accounted for 2.43% of the plateau (0.76% + 0.49% + 0.21%), indicating that higher ET was associated with longer GSL in these areas. Low positive correlations (r = 0~0.51, 0.76%) were mainly distributed across central and western grasslands and transitional zones. Moderate positive correlations (r = 0.51~0.59, 0.49%) were concentrated in northwestern Sichuan and southeastern Tibetan mountainous regions. High (r = 0.59~0.70, 0.17%) and very high positive correlations (r = 0.70~0.94, 0.21%) occurred primarily in eastern Qinghai and Gannan forest–grassland ecotones.
Negative correlations accounted for 1.29% (0.32% + 0.97%), primarily in western high-altitude arid regions such as Qiangtang and Ngari, indicating that higher ET was associated with shorter GSL in these areas, without implying causation.
- (2)
Statistical associations under controlled precipitation
After controlling for precipitation, only 1.64% of the plateau showed statistically significant ET–GSL associations (
p < 0.05), with partial correlation coefficients ranging from −0.82 to 0.93 (
Figure 9b).
Positive correlations accounted for 1.14% of the plateau (0.39% + 0.25% + 0.10%). Low positive correlations (r = 0~0.51, 0.39%) were widely distributed across central and marginal areas, showing weak positive associations with GSL. Moderate positive correlations (r = 0.51~0.59, 0.25%) were concentrated in southeastern forests and high-coverage grasslands. High positive correlations (r > 0.68, 0.10%) were observed in northwestern Yunnan and western Sichuan Plateau.
Negative correlations (0.90%) were mostly in western arid regions, indicating negative ET–GSL associations without inferring causal effects.
- (3)
Statistical associations under controlled solar radiation
When controlling for solar radiation, 1.92% of the plateau exhibited statistically significant ET–GSL associations (
p < 0.05), with partial correlation coefficients ranging from −0.88 to 0.94 and an overall “strong east–weak west” spatial gradient (
Figure 9c).
Positive correlations accounted for 1.34% of the plateau (0.47% + 0.30% + 0.12%), indicating higher ET was associated with longer GSL in these areas. Low positive correlations (r = 0~0.51, 0.47%) were mainly found in central and western grasslands and transitional zones. Moderate positive correlations (r = 0.51~0.59, 0.30%) were concentrated in southeastern and central mountain transitional areas. High (r = 0.59~0.70, 0.15%) and very high positive correlations (r = 0.70~0.94, 0.12%) occurred primarily in eastern Qinghai, Gannan, and northwestern Sichuan forest–grassland ecotones.
Negative correlations (1.02%) were mainly distributed in high-altitude arid regions such as Ngari and Nagqu, indicating that higher ET was associated with shorter GSL in these areas, without implying causation.
In summary, observed ET-GSL associations display pronounced spatial heterogeneity: eastern and southeastern regions generally show positive associations, western arid and high-altitude regions show negative associations, and transitional zones display mixed associations. These patterns reflect statistical associations only, without inferring ET as a causal factor in GSL variability.
It should be noted that the limited temporal sample size (n = 23) constrains the statistical power of pixel-wise correlation analyses, particularly in heterogeneous alpine environments. Temporal autocorrelation in both climatic and phenological series may further reduce effective degrees of freedom, potentially leading to an underestimation of significant relationships. Moreover, while pixel-level tests were conducted at p < 0.05 without multiple-testing correction, the spatial coherence of significant regions across independent analyses suggests that the detected patterns are unlikely to result from random noise. Future studies with longer time series or model-based approaches may help improve the robustness of such spatial correlation assessments.
4.6.5. Multifactor Interaction Analysis of Hydrothermal Conditions
We have expanded our analysis to include a Geographically Weighted Regression (GWR) model to quantitatively investigate the multifactor interactions that govern the spatial variability of growing season length (GSL) under different climatic scenarios across the Tibetan Plateau. This approach allows us to capture the spatial non-stationarity of climatic effects and to quantify the synergistic or antagonistic relationships among precipitation, radiation, and temperature, thus providing robust statistical support for the previously qualitative description of “nonlinear interactions.”
Under the high-precipitation–high-radiation scenario, GWR results revealed significant spatial variability in the climatic effects on GSL. The model showed strong explanatory power (R2 = 0.746, Adj. R2 = 0.685), indicating that GWR effectively captured the spatial heterogeneity of hydrothermal influences. Precipitation exerted a significant positive effect on GSL (coefficient = 0.844, p < 0.001), while radiation showed a weak and statistically insignificant effect (coefficient= −0.057, p = 0.522). Spatially, high precipitation coefficients (>0.8) were concentrated in the humid southeastern region, where ample moisture substantially prolonged the growing season. In contrast, in the arid and cold northwestern regions, the precipitation effect weakened and the radiation coefficient shifted from negative to positive, suggesting that enhanced radiation can compensate for thermal deficiencies and promote GSL extension. Overall, high precipitation and high radiation exhibited antagonistic effects in humid regions but synergistic effects in cold and arid regions, reflecting a spatially differentiated hydrothermal regulation of GSL and a shift from moisture-limited to temperature-regulated ecological processes.
Under the low-precipitation–high-radiation scenario, the GWR model also performed well (R2 = 0.818, Adj. R2 = 0.798), demonstrating strong spatial responses of GSL to climatic factors. The mean precipitation coefficient was −0.808 (p < 0.001), indicating that reduced precipitation strongly constrained GSL duration, while radiation showed a weak positive mean effect (0.053; range: 0.030–0.189; p = 0.384), especially in high-altitude areas where increased radiation promotes snowmelt and advances vegetation growth. Overall, most regions exhibited antagonistic interactions, where water scarcity amplified the drought stress induced by radiation-driven evapotranspiration. However, synergistic effects occurred in cold and dry regions, where enhanced radiation partially compensated for thermal limitations, jointly extending GSL.
In summary, the hydrothermal coupling relationship of GSL across the Tibetan Plateau shows pronounced spatial differentiation under different climatic gradients, revealing a regional transition from temperature-limited to moisture-limited ecosystems. This quantitative GWR-based analysis provides stronger empirical evidence for the nonlinear and spatially heterogeneous interactions among climatic drivers.
4.7. Impacts of Extreme Weather on GSL
4.7.1. Effects of Extreme Temperature on GSL
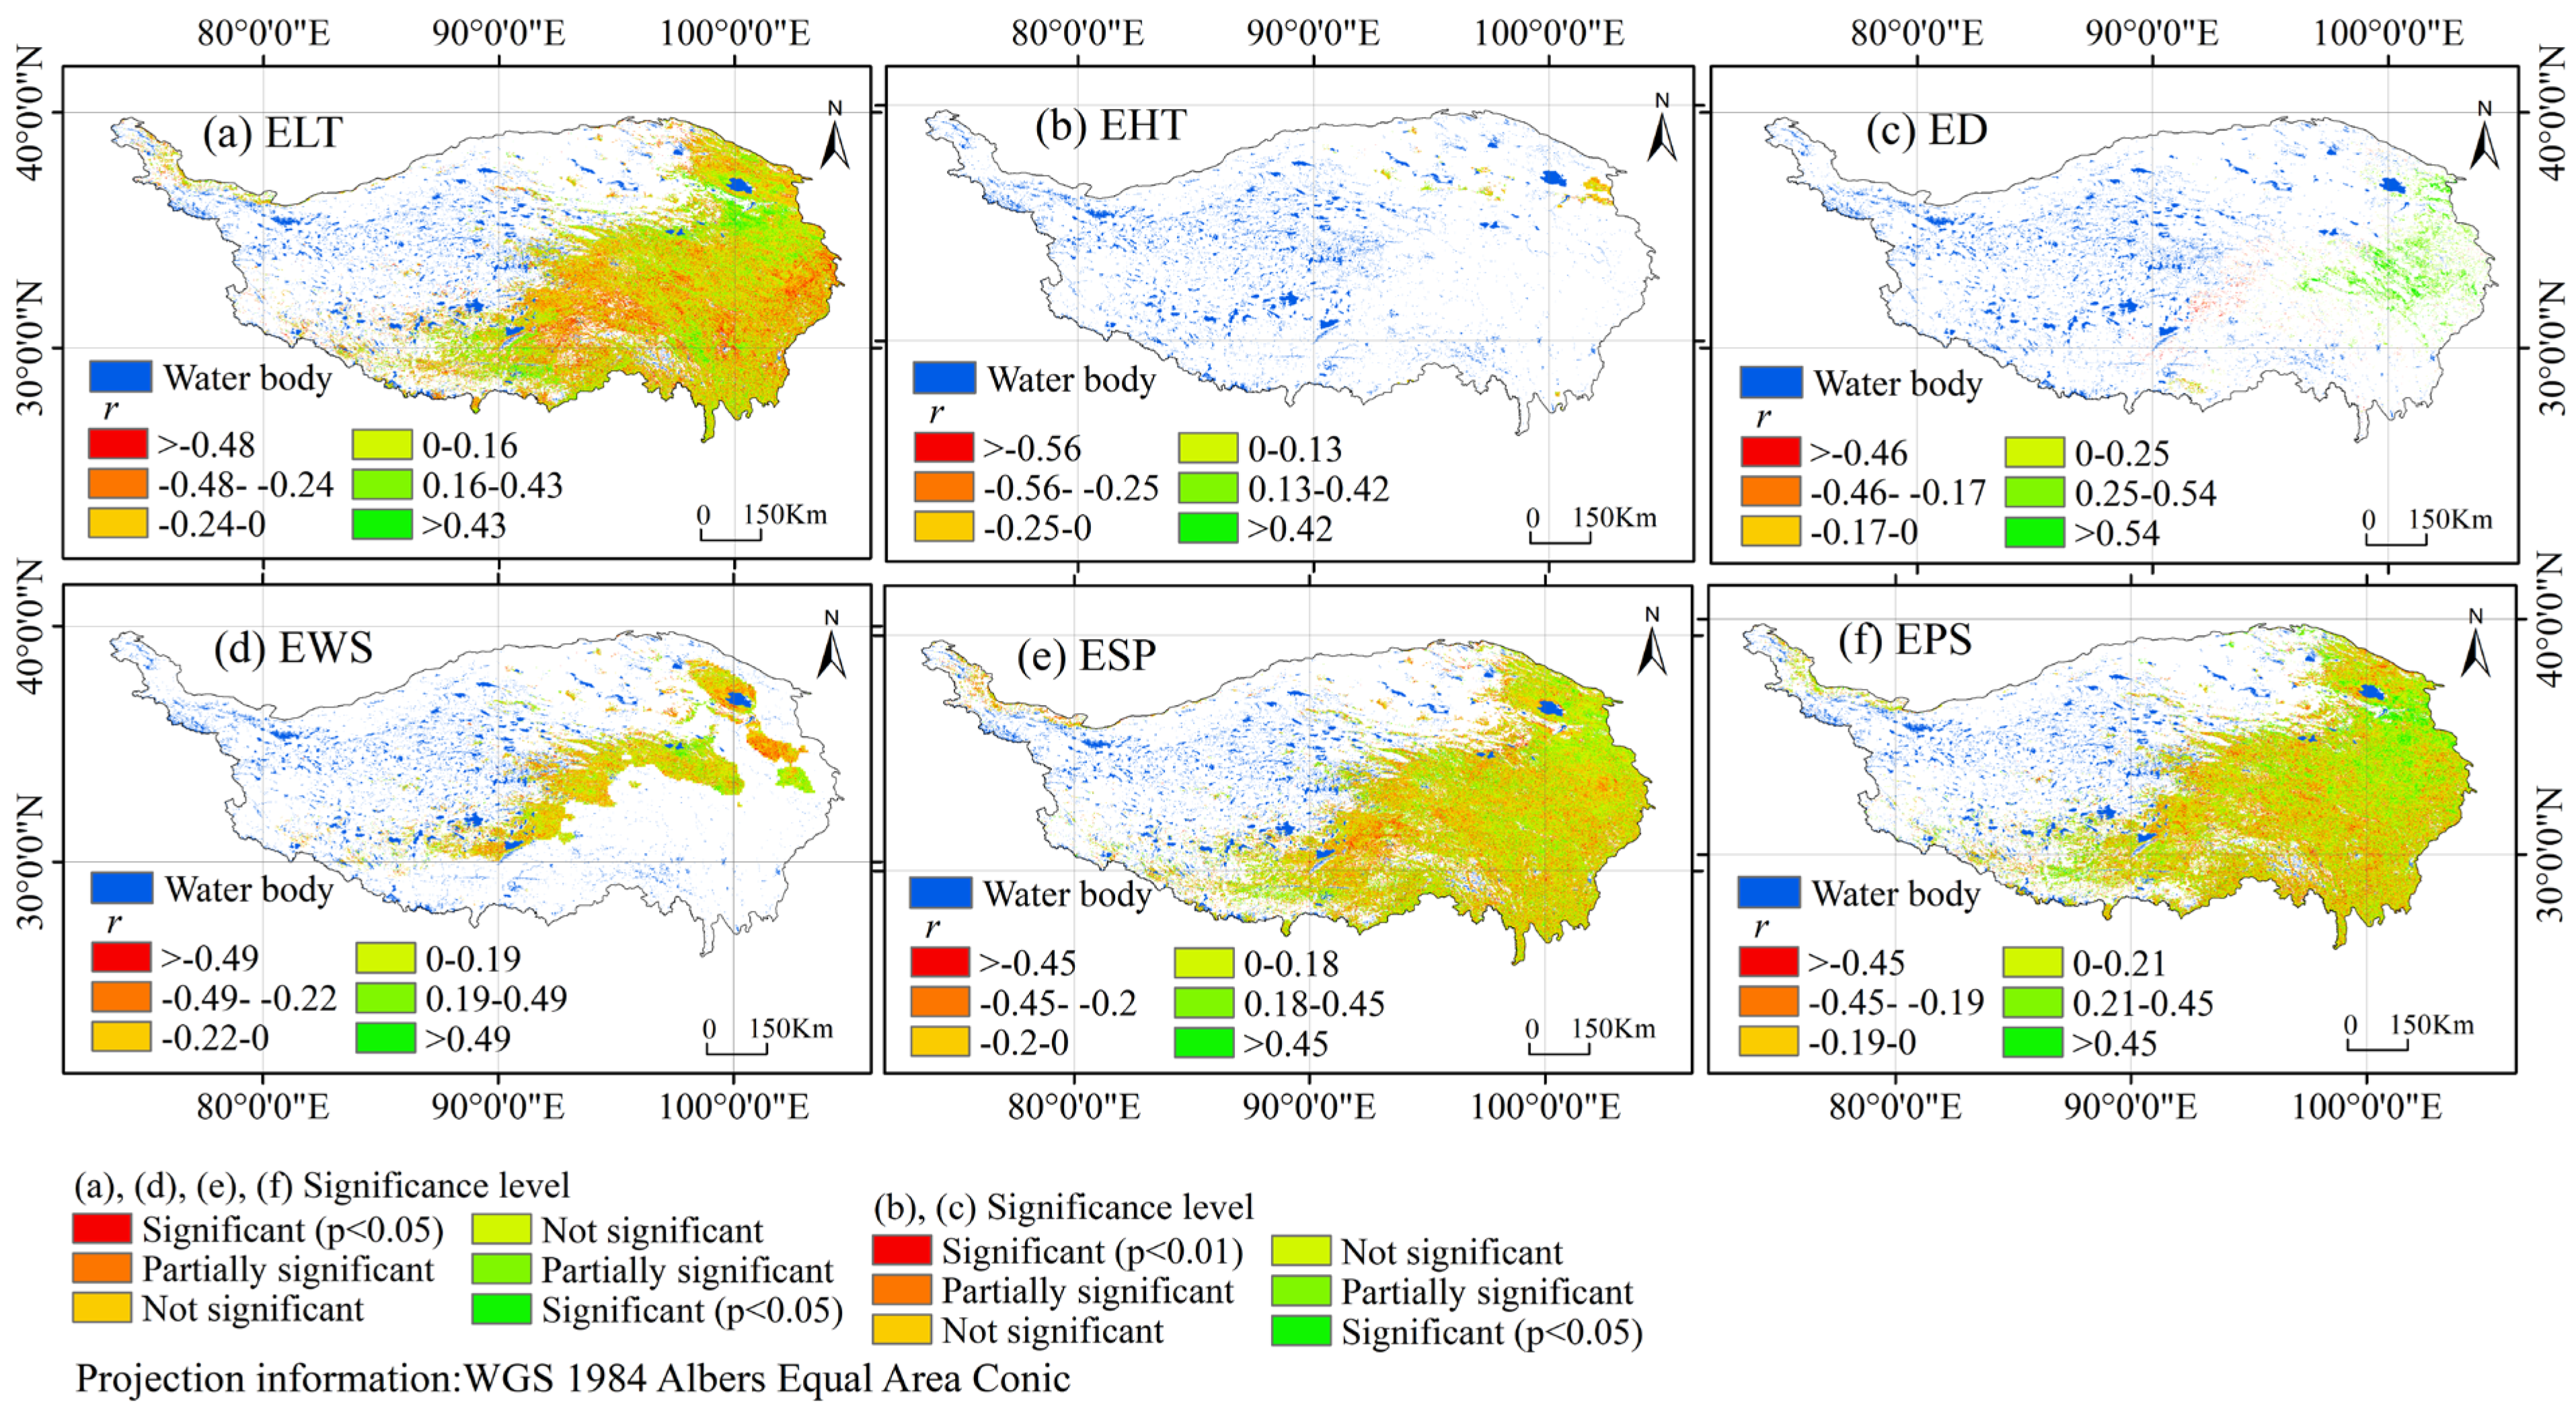
To further elucidate the influence of extreme temperature variations on the growing season length (GSL) of vegetation across the Tibetan Plateau, this study analyzed the correlations between extreme low temperature (ELT) and extreme high temperature (EHT) events with GSL, as well as their spatial distribution characteristics (
Figure 10a,b;
Table 7). The results reveal that both types of extreme temperature events exert significant effects on GSL, with overall negative correlations dominating, accompanied by pronounced spatial heterogeneity.
From an overall perspective, a significant negative correlation was observed between ELT and GSL (
Figure 10a;
Table 7). The negatively correlated area covered approximately 631,000 km
2, accounting for 25.24% of the total area of the Tibetan Plateau, which was substantially larger than the positively correlated area of 474,000 km
2 (18.97%). Within the negatively correlated regions, weak (−0.24~0) and moderate (−0.48~−0.24) negative correlations were most prevalent, representing 31.96% and 18.92% of all pixels, respectively, while the strongly negative correlation area (−1~−0.48) was smallest, at only 2.75%. Spatially, the western and central high-altitude regions (e.g., the Qiangtang Plateau and the western Kunlun Mountains) exhibited strong negative correlations, indicating that extreme low temperatures substantially suppressed the extension of the growing season in these cold, high-elevation zones. The central-to-eastern transitional belt was dominated by weakly negative or insignificant correlations, whereas the eastern and southeastern regions (e.g., the Sanjiangyuan and Hengduan Mountain areas) were mostly positively correlated, with correlation coefficients ranging from 0.16~0.43. This suggests that in relatively mild climatic environments, the negative impacts of extreme low temperatures on GSL are mitigated and may even promote its extension.
Similarly, the relationship between EHT and GSL was also predominantly negative (
Figure 10b;
Table 7). Among all valid pixels, negatively correlated pixels accounted for approximately 66%, significantly exceeding the 34% of positively correlated ones. Pixels with correlation coefficients between −0.25 and 0 were most abundant (46.02%), followed by moderate (−0.56~−0.25, 16.47%) and strong (−1~−0.56, 3.66%) negative correlations. Positively correlated areas were mainly distributed within the coefficient range of 0 to 0.42, including 17.20% in the 0~0.13 range, 13.63% in the 0.13~0.42 range, and only 3.01% exceeding 0.42.
The spatial distribution pattern indicates that negative correlations are concentrated in the western and central high-altitude regions of the Tibetan Plateau, suggesting that extreme high temperature events markedly shortened the growing season in these cold environments. The central-to-southeastern transitional zone exhibited weaker negative correlations or insignificant relationships, while positive correlations were mainly found in the southeastern valleys and plains, such as the Sanjiangyuan and Hengduan Mountain regions, where hydrothermal conditions are favorable and the climate is relatively mild. Overall, EHT displayed a notable inhibitory effect on GSL in high–cold regions, whereas in thermally favorable areas, moderate extreme high temperatures might instead facilitate the extension of the growing season, highlighting the strong spatial regulation of GSL dynamics by temperature and hydrothermal gradients across the Plateau.
4.7.2. Effects of Extreme Precipitation/Snow) (EPS) and Extreme Drought (ED) on GSL
Based on the correlation analysis between the growing season length (GSL) and extreme climatic events across the Tibetan Plateau from 2001 to 2023, the results reveal distinct differences in the effects of extreme precipitation and extreme drought on GSL (
Figure 10;
Table 8). Overall, extreme precipitation exerts a predominantly positive influence on GSL, whereas extreme drought generally shows a negative effect, both exhibiting pronounced spatial heterogeneity across the plateau.
- (1)
Effects of extreme precipitation on GSL
Across all valid pixels, GSL shows an overall positive correlation with extreme precipitation. Spatially, most regions of the plateau fall within the positive correlation range, with correlation coefficients between 0 and 0.21 accounting for the largest area (28.82%, 314,365 km
2), followed by 0.21~0.45 (20.22%, 220,598 km
2) (
Table 8). In total, positively correlated regions account for 43.63% of the plateau’s area, suggesting that moderate extreme precipitation events tend to extend the growing season and promote vegetation growth. However, certain areas display negative correlations, with correlation coefficients between −0.19~0, −0.45~−0.19, and −1~−0.45 accounting for 23.61% (257,572 km
2), 16.50% (180,000 km
2), and 4.19% (45,676 km
2), respectively (
Table 8). This indicates that excessive precipitation may inhibit GSL extension due to waterlogging or flooding. Overall, the impact of extreme precipitation on GSL shows substantial spatial heterogeneity, dominated by weak to moderate positive correlations, though localized areas exhibit notable negative relationships.
- (2)
Effects of extreme drought on GSL
Across all valid pixels, GSL is mainly negatively correlated with extreme drought. Regions with correlation coefficients between −0.46~−0.17 and between −0.17 and 0 account for 16.87% (380 km
2) and 21.98% (495 km
2), respectively (
Table 8), suggesting that extreme drought generally suppresses the extension of the growing season. Positively correlated areas are very limited, with correlation coefficients between 0 and 0.25 (32.15%, 724 km
2) and between 0.25~0.54 (17.81%, 401 km
2), while strongly positive correlations (>0.54) account for only 5.06% (114 km
2) (
Table 8). Overall, the spatial extent of drought-related effects is extremely limited, with valid pixels covering only 0.09% of the total area of the Tibetan Plateau. This implies that, although the overall influence of drought on GSL is relatively weak, it may still exert a localized but notable impact on growing season variability in some regions.
4.7.3. Effects of Extreme Solar Radiation (ESR) and Extreme Strong Wind (ESW) on GSL
- (1)
Influence of Extreme Solar Radiation (ESR) on GSL
Across all valid pixels, the correlation between ESR and GSL exhibits pronounced spatial heterogeneity (
Figure 10;
Table 9). Overall, the relationship is dominated by a weak positive correlation. The positively correlated regions, with correlation coefficients ranging from 0~0.18 and 0.18~0.43, cover areas of 281,591 km
2 (11.26%) and 197,562 km
2 (7.90%), respectively, accounting for approximately 19.16% of the total area of the Tibetan Plateau and 43.87% of all valid pixels. In contrast, negatively correlated regions with correlation coefficients between −0.25~0, −0.45~0.25, and −1~0.45 occupy 329,665 km
2 (13.19%), 188,196 km
2 (7.53%), and 43,033 km
2 (1.72%), respectively, together representing 22.44% of the total Plateau area. This pattern suggests that excessive solar radiation may suppress the extension of the growing season in certain regions.
Spatially, positively correlated areas are mainly distributed in regions with moderate radiation intensity, where sufficient sunlight combined with favorable thermal conditions enhances photosynthetic activity, thereby promoting GSL extension. Conversely, negatively correlated zones are primarily concentrated in high-radiation or high-altitude regions, where intense solar radiation likely exacerbates evapotranspiration or induces photoinhibition effects, consequently shortening the growing season. Overall, the influence of ESR on GSL demonstrates marked spatial heterogeneity, with its positive regulatory effect being slightly weaker than that of extreme precipitation.
- (2)
Influence of Extreme Strong Wind (ESW) on GSL
Across all valid pixels, the impact of ESW on GSL is relatively limited, covering only 12.08% (301,887 km
2) of the total area of the Tibetan Plateau (
Figure 10;
Table 9). Among these, positively correlated regions, with correlation coefficients of 0~0.19 and 0.19~0.49, encompass 77,477 km
2 (3.10%) and 48,066 km
2 (1.92%), respectively—accounting for about 5.02% of the total area. This suggests that local increases in wind speed may enhance air circulation, promote gas exchange, or alleviate heat stress, thereby slightly extending the growing season length. In contrast, negatively correlated regions, corresponding to correlation coefficients of −0.22~0, −0.49~0.22, and −1~0.49, occupy 96,477 km
2 (3.86%), 54,474 km
2 (2.18%), and 13,928 km
2 (0.56%), respectively, accounting for approximately 6.60% of the total Plateau area. This indicates that strong wind events may accelerate evapotranspiration, cause mechanical damage, or disrupt leaf structures, thereby constraining the extension of GSL.
Overall, the impact of ESW on GSL is comparatively weak and exhibits localized and non-persistent characteristics, reflecting that wind-induced variations in vegetation growth are spatially constrained and secondary compared to other climatic extremes such as precipitation and temperature.
−1~−0.49) cover 96,477 km2 (3.86%), 54,474 km2 (2.18%), and 13,928 km2 (0.56%), respectively, indicating that strong winds primarily suppress GSL by accelerating ET or causing mechanical damage to vegetation.
In terms of spatial patterns, negative effects are mainly concentrated in exposed highlands and wind-prone regions, whereas positive effects are scattered and localized. Overall, extreme strong wind exhibits pronounced site-specific effects on GSL, predominantly negative, and has a limited impact on the plateau-wide growing season length.
4.7.4. Quantitative Analysis of Human Activity Contributions to GSL Changes
We have expanded our analysis to include explicit measurements of human activity intensity and a quantitative decomposition of GSL changes into natural climatic and anthropogenic components.
- (1)
Quantification of human activity intensity (2001–2023)
We quantified two core types of—human activities, agricultural management (irrigation) and urban heat island effects (impervious surface expansion)—using datasets from the National Tibetan Plateau Data Center and MODIS Land Cover Product.
Agricultural management: In major irrigated farmland regions (Heihe River Basin and Yarlung Zangbo Valley) [
107,
108], the irrigated farmland ratio increased from 14.2% to 23.1% and 38% to 65%, respectively, between 2001 and 2023. After the implementation of the “High-Standard Farmland Construction” program in 2015, irrigation coverage increased by 2.1% per year, closely matching the acceleration of GSL_mean (from 168.99 to 170.96 days). NDVI trends were strongly correlated with irrigation coverage (r = 0.87,
p < 0.01). In 2023, irrigated farmland exhibited an average GSL of 203.5 days, which was 22.3 days longer than rain-fed farmland, confirming that irrigation effectively extends the growing season [
109].
Urban heat island: In Xining and Lhasa, impervious surface areas expanded from 36.9 km
2 to 60.1 km
2 and 21.6 km
2 to 55.3 km
2, corresponding to increases of 62.8% and 156.5%, respectively. Urban areas exhibited annual mean temperatures 1.8–3.2 °C higher than nearby rural zones. The urban heat island intensity was significantly correlated with impervious surface area (r = 0.82,
p < 0.01) [
110,
111]. Consequently, the 2023 GSL in urban areas (196.4 days) was 30.7 days longer than in adjacent natural regions (165.7 days), suggesting strong local warming effects.
- (2)
Attribution of GSL changes to climate and human activities
We further applied a multiple linear regression + residual analysis framework to distinguish the contributions of natural climate factors and human activities [
112,
113].
⟶ Total GSL increase: 18.2 days, with climate contributing 9.7 days (53.3%) and human activities contributing 8.5 days (46.7%).
⟶ Total GSL increase: 24.0 days, with climate contributing 14.7 days (61.2%) and human activities contributing 9.3 days (38.8%) [
114,
115].
In both cases, the GSL extension was primarily attributed to earlier SOS, accounting for 60% in urban areas and 58% in farmland, reflecting spring phenology advancement driven by urban warming and irrigation [
116].
- (3)
Spatial heterogeneity of anthropogenic effects
The contribution of human activities was substantially higher in core urban areas (Xining, Lhasa) and irrigated oasis regions (Heihe Basin, Yarlung Zangbo Valley) than in surrounding natural zones. These findings confirm that intensive human activities have locally amplified GSL extension beyond the plateau-wide average [
117].
- (4)
Model verification and reliability
Model errors were below 5%, with climatic variable correlations exceeding 0.94, and all key metrics showing <25% uncertainty, indicating robust and replicable results. The spatial consistency between regional and plateau-wide contributions further supports the conclusion that GSL extension in farmland and urban areas is jointly driven by irrigation and urban heat island effects [
118,
119].
We now provides explicit data on human activity intensity, distinguishes the relative contributions of natural and anthropogenic drivers, and strengthens the conclusion that farmland GSL extension is primarily due to irrigation management, while urban GSL extension arises from urban heat island effects [
110,
120].

