Article

Traditional Pollarding Practices for Dimorphic Ash Tree (Fraxinus dimorpha) Support Soil Fertility in the Moroccan High Atlas

by
Abdessamad Fakhech
1,
Didier Genin
2,*,
Mohamed Ait-El-Mokhtar
3,
El Mustapha Outamamat
1,
Soufiane M’Sou
1,
Mohamed Alifriqui
1,
Abdelilah Meddich
3 and
Mohamed Hafidi
1,4
1
Laboratory of Microbiological Biotechnology, Agricultural Sciences & Environment (BioMAgE), Faculty of Sciences Semlalia, Cadi Ayyad University, Marrakech 40000, Morocco
2
IRD, Laboratory Population, Environment, Dévelopment, UMR151 AMU-IRD, 1331 Marseille, France
3
Laboratory of Agri-food,, Biotechnologies & Bioresource Valorisation (AGROBIOVAL), Faculté des Sciences Semlalia, Université Cadi Ayyad, Marrakech 40000, Morocco
4
AgroBioSciences Program, Mohammed IV Polytechnic University (UM6P), Benguerir 43150, Morocco
*
Author to whom correspondence should be addressed.
Land 2020, 9(9), 334; https://doi.org/10.3390/land9090334
Submission received: 4 September 2020 / Revised: 18 September 2020 / Accepted: 18 September 2020 / Published: 21 September 2020
(This article belongs to the Special Issue Agroforestry-Based Ecosystem Services)

Abstract

:
Shaping and pollarding of dimorphic ash tree (Fraxinus dimorpha) are two traditional practices used by the local inhabitants in agropastoral parklands of the Moroccan High Atlas to secure their production systems and increase tree production and strength. This study focused on assessing the impact of these practices on soil quality. Abiotic parameters and mycorrhizal attributes of the samples of four soil types related to different ash tree morphotypes were assessed and compared. Rhizospheric soils (Rs) of three F. dimorpha morphotypes were sampled: trees regularly pollarded and shaped for stem anastomosis (An), regularly pollarded multistemmed trees (Na), and multistemmed trees belonging to a public forest under national forestry service management and sporadically illegally pollarded (Fo). The fourth soil was a non-Rs found in bare soils, which represented the control (Nr). Results showed a sizable difference between An soil properties and the other soil types ones, with significantly higher phosphorus (×6), nitrogen (×5), and carbon (×2) levels and higher mycorrhizal (×6) status than Nr soil, and showed 37% more mycorrhization intensity than Fo. Na showed intermediary levels between An and Fo. Fo had ×2 P, ×3 Total Kjeldahl Nitrogen (TKN), 58% more Total Organic Carbon (TOC) content, and twice the spore density compared with Nr. It is concluded that shaping and pollarding have a positive impact on the soil characteristics of the studied species and could make a useful contribution to sound agroforest management schemes.

1. Introduction

Traditional ecological knowledge (TEK) is defined as “a cumulative body of knowledge, practices and beliefs, handed down through generations by cultural transmission and evolving by adaptive processes, about the relationship between living beings with one another and with their forest environment” [1]. It refers to the knowledge developed by native or local people over generations through direct interactions with their environment. While TEK remains under-recognized, efforts to preserve it are increasing [2]. Over the last years, TEK has become an alternative approach to better understand and adapt to climate and biodiversity change [3,4]. Examples of how TEK provides insights into balanced forest management have been reported and discussed [5]. In Morocco, this approach was particularly documented by Genin et al. [6] in the forested landscapes of the Aït M’hamed region in Azilal province, situated in the Central High Atlas. A unique traditional practice relative to dimorphic ash tree stands was described, consisting of strict periodic tree pollarding and favoring tree stem coalescence and fusion in order to improve the productivity of foliar fodder [6,7].
The dimorphic ash tree, Fraxinus dimorpha, is a native tree growing spontaneously in some parts of the Moroccan High Atlas. It is called “imts” in the local Amazigh language, and it grows primarily on rocky inclines and valleys, at altitudes between 1200 and 2000 m. For the local inhabitants, it is a multifunctional tree, which constitutes a keystone species in the functioning of their agro-silvo-pastoral systems and livelihoods [8]. It supplies them with firewood, poles, and beams for houses and agricultural tools, spices, tinctorial, and medicinal products [6]. But its most essential use is as fodder, in times when pasture is scarce and insufficient. From August until November, F. dimorpha trees are relied upon for providing fodder for small stocks. For a single tree, branches are pollarded every 4 years to allow enough regrowth time. Sheep and goats graze directly on the ground chopped leafy branches [7].
F. dimorpha in this area is characterized by trunk heterogeneity with four reported morphotypes: (1) large anastomosed trunks located mainly in privately owned, cultivated, and/or grazed parklands; (2) multistemmed trunks with multiple 10–20 cm diameter stems located both in parklands and in the adjacent public forest; (3) single-stemmed trunks, which are the least frequently occurring morphotype; and (4) shrublike trees, which dominate the public forest (Figure 1) [6].
The most widespread morphotype within the privately owned lands is the anastomosed trunks. This morphotype is the fruit of one of the most remarkable features of traditional tree management of this region. In the local Amazigh language, this is called “Tahboucht”, which translates roughly as “educating” or “mothering.” It consists in building rock walls around small or overgrazed trees until they are out of the reach of sheep and goats. Only the best-developed and straightest stems are then attached together as close as possible to favor the process of “anastomosis,” by which they can fuse and form a single large trunk. Anastomosis promotes anatomical changes, such as increased proportion of parenchymatous cells and cross section surface area [9]. This singular practice is viewed by Genin et al. [6] as an original and effective option for resource scarcity management in this region.
As perennial plants, woody trees and shrubs represent an important ecosystem stabilization component by ensuring fundamental ecosystem functions, such as soil organic matter improvement and mutual symbiosis [10,11], while producing biomass, services, and goods to support local populations. The case of F. dimorpha could help to develop a more global approach to ensure both the preservation and valorization of efficient TEK practices, and the conservation of ecosystemic functionality. Genin et al. [6] showed that the practice of trunk anastomosis allowed a 36% increase in foliage production after a 4-year cycle of exploitation, compared with non-anastomosed trees, and promoted the resilience and longevity of the trees. The effects of this practice on belowground properties have still to be investigated. Here we focused on mycorrhizal status since the arbuscular mycorrhizal fungi (AMF) are a major rhizospheric component of most plant roots [12].
The aim of this study was thus to investigate the response of some of F. dimorpha rhizospheric soil (Rs) characteristics found below different tree ports as a result of contrasted tree exploitation practices. We hypothesized that aerial improvement of F. dimorpha should be linked to an improvement of its belowground characteristics since the improvement of the tree’s aerial parts requires a mobilization of all the rhizospheric components.

2. Material and Methods

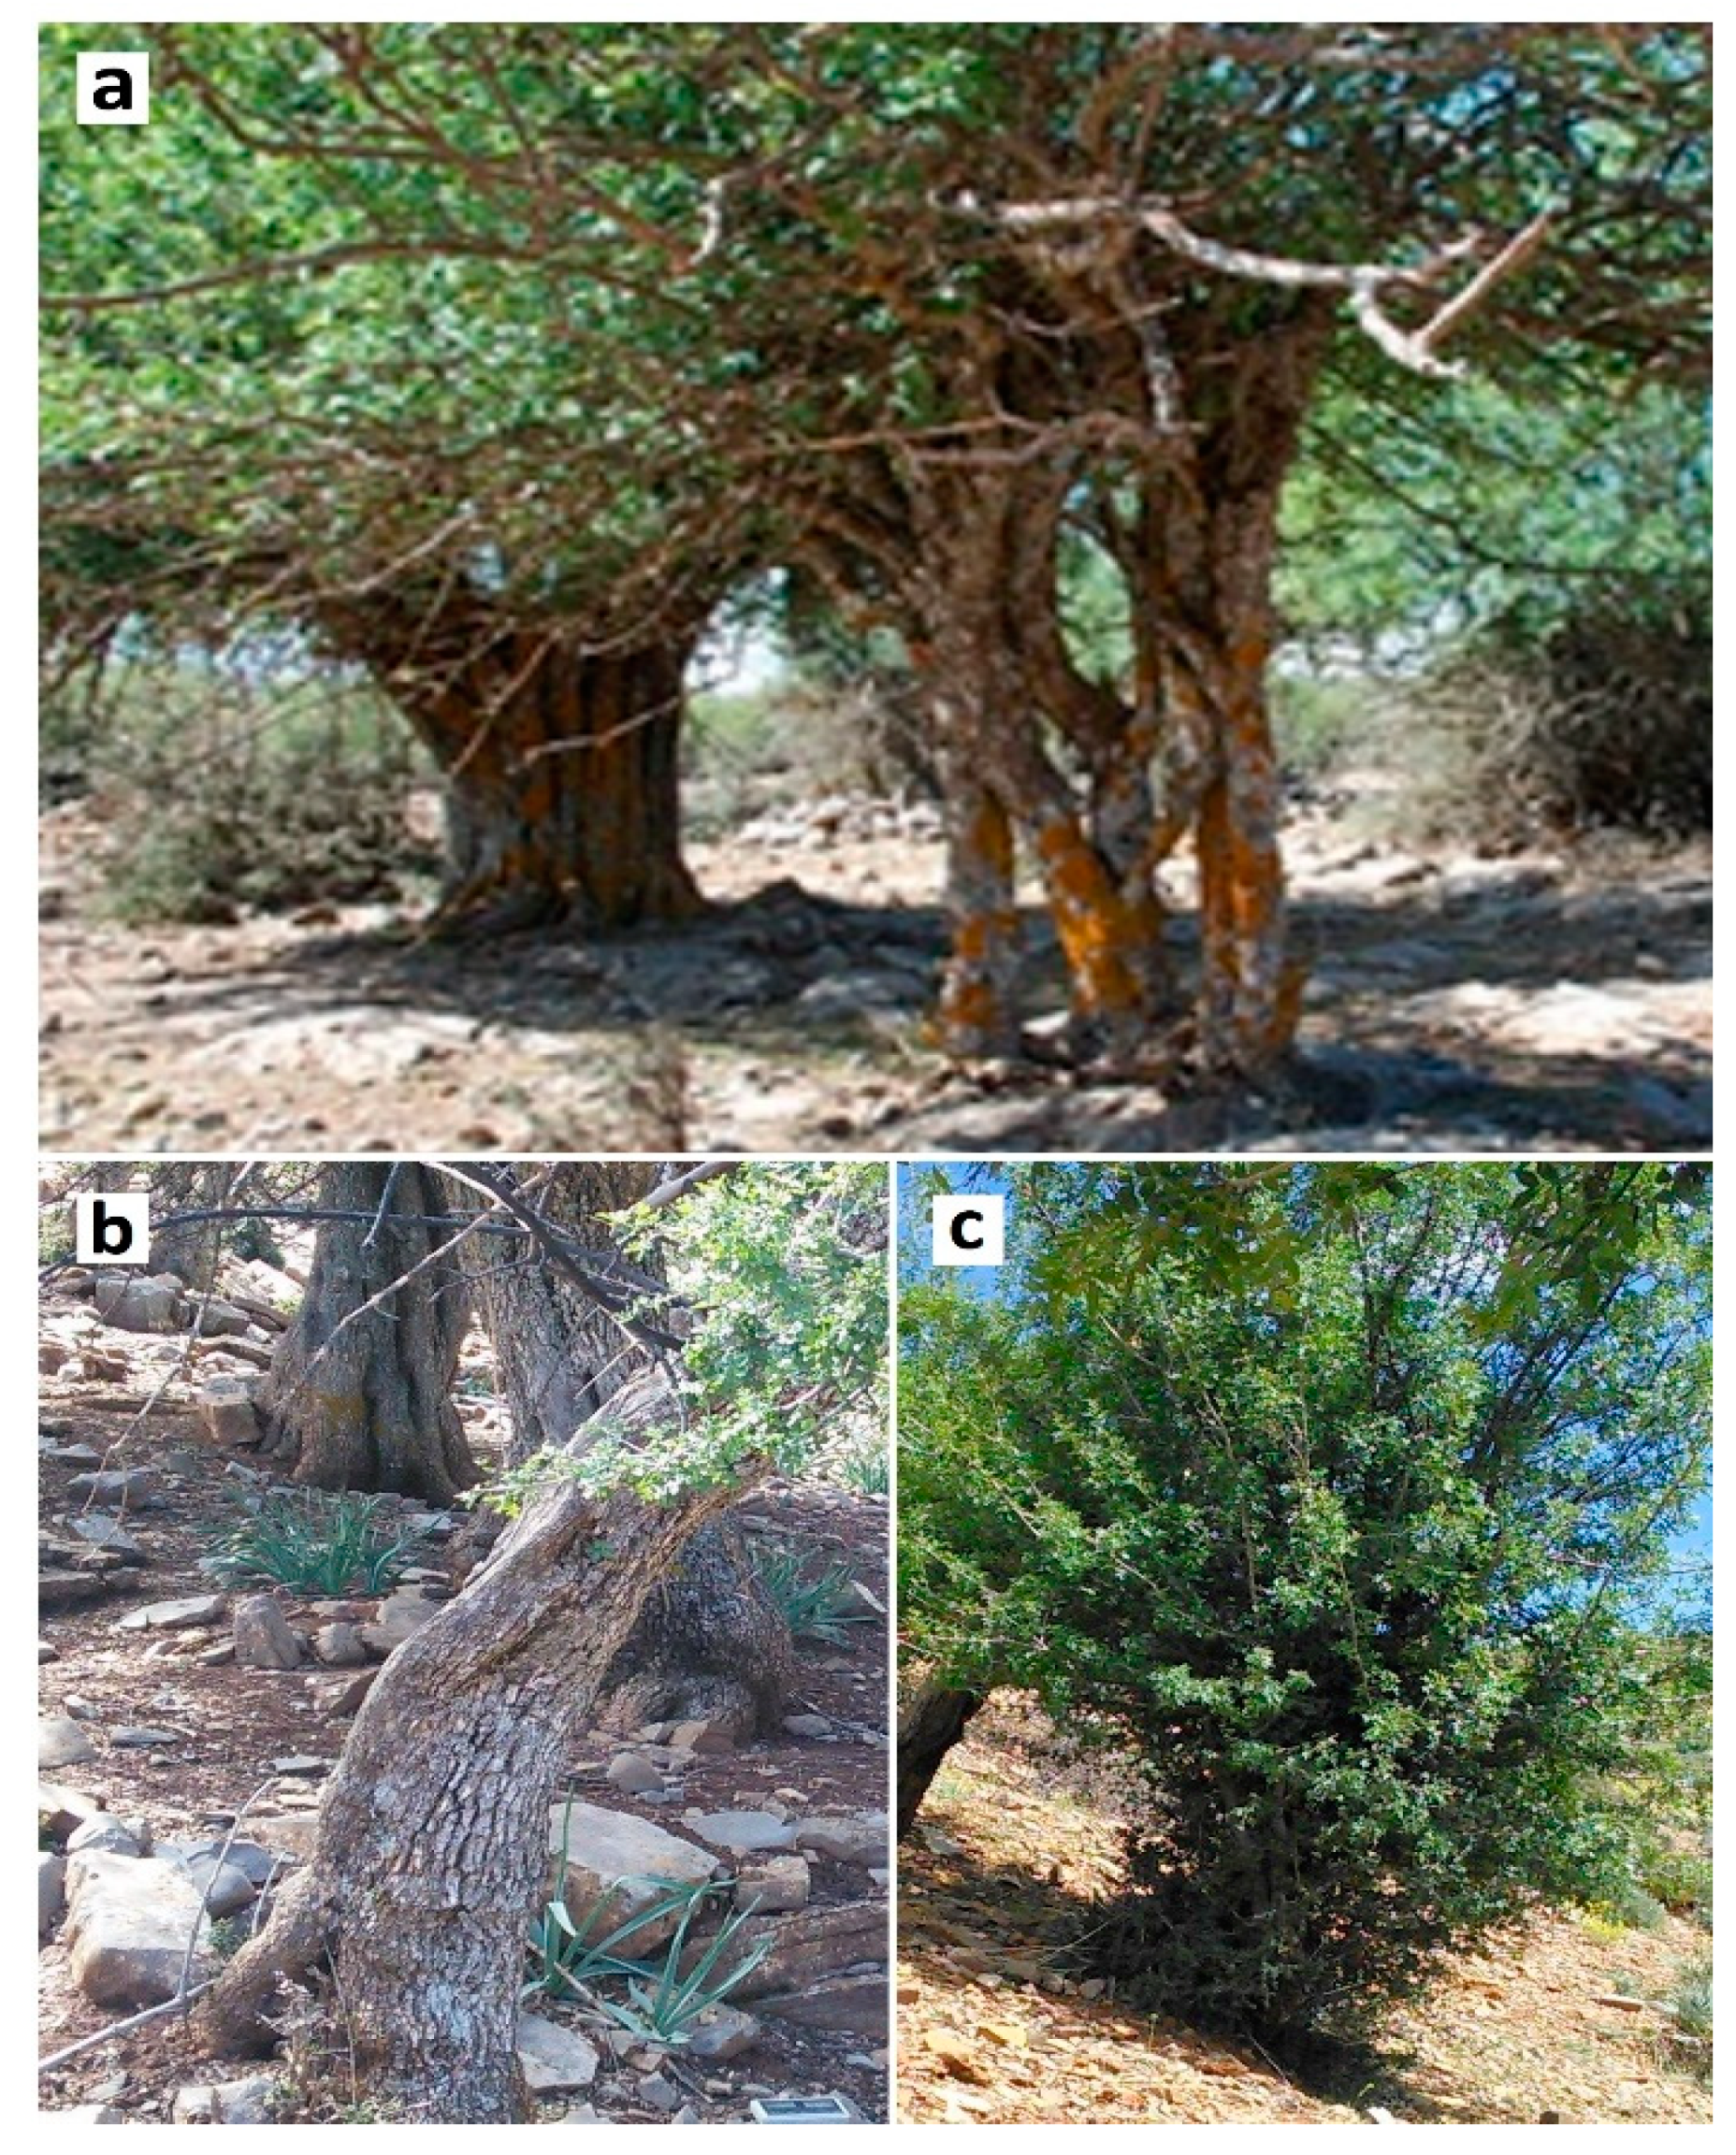
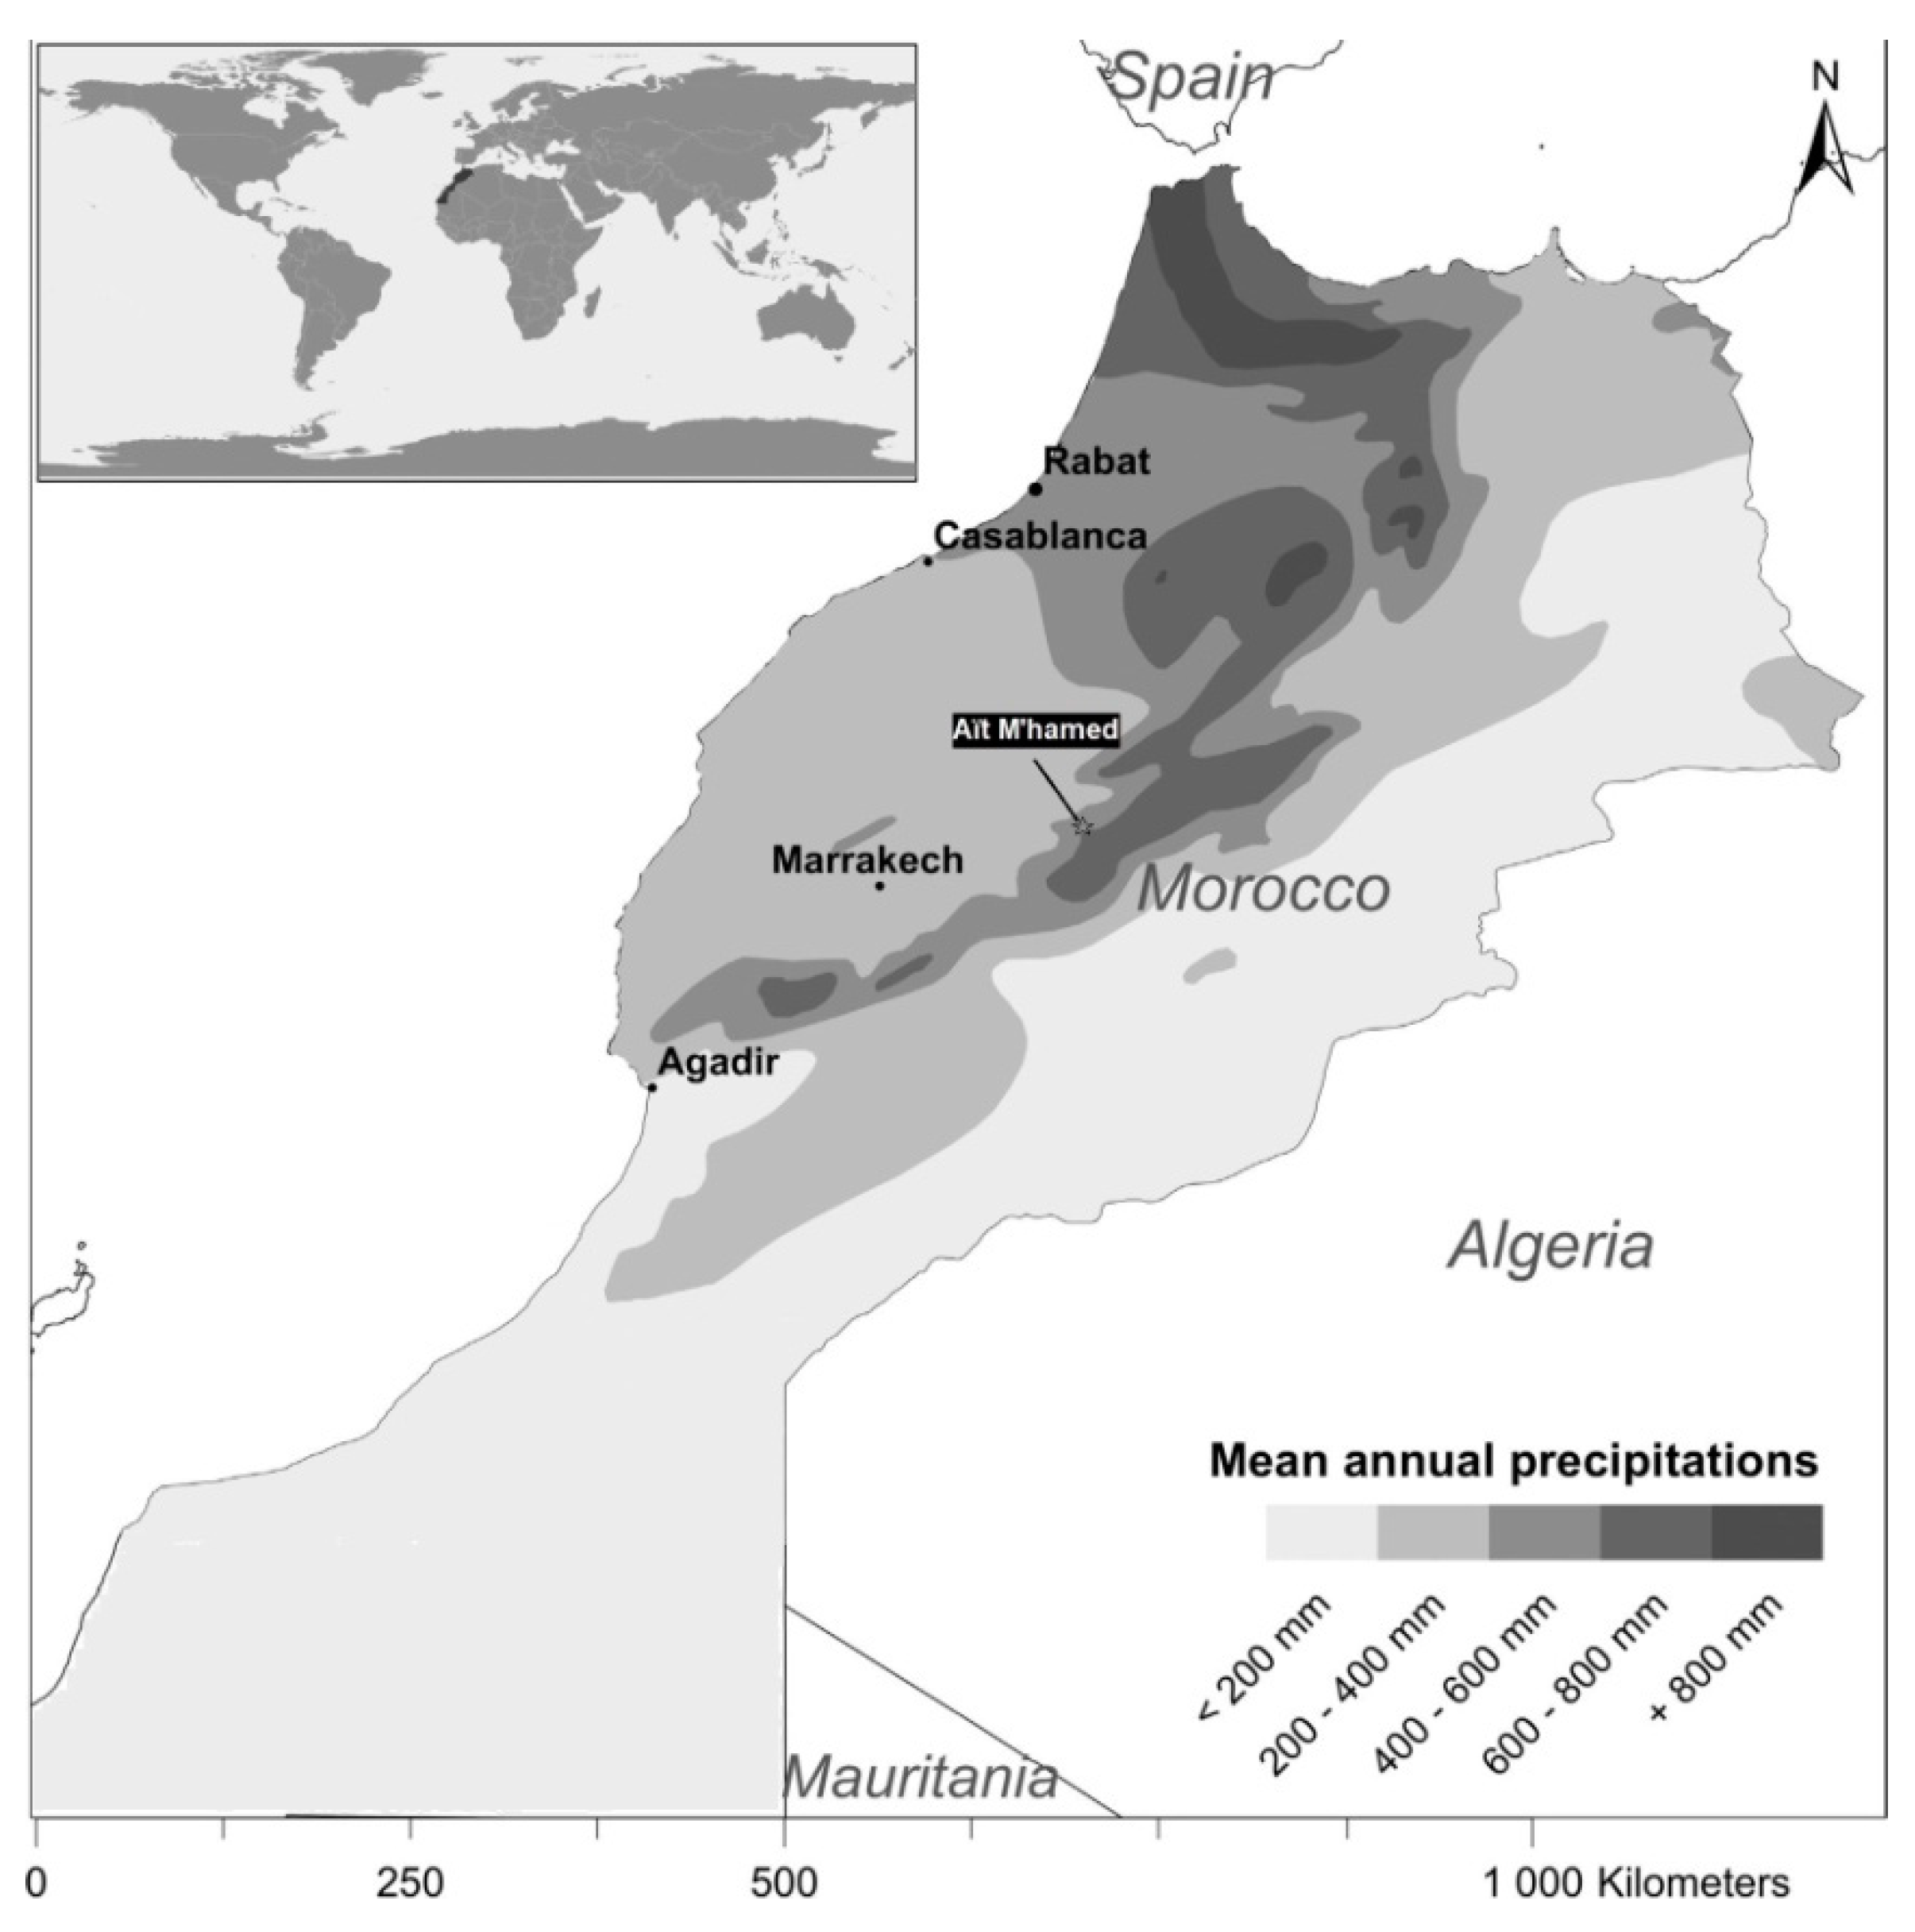
2.1. Study Site and Sampling

Field sampling was conducted in Aït M’hamed rural commune, located in the Central High Atlas, Azilal province, Morocco (31°49′N; 6°35′W) (Figure 2). Dimorphic ash is the dominantly distributed spontaneous tree species in the landscape, forming tree parklands fully integrated within local agro-silvo-pastoral systems. Altitudes range from 1300 to 1700 m. The climate is mountain Mediterranean with annual rainfall between 450 and 600 mm. The mean minimum temperature is 5 °C, and the mean maximum temperature is 28 °C. Soils are relatively homogeneous, largely dominated by a sandy-loamy calcareous skeletal soil. Sampling was carried out in May on rhizospheric soil (Rs) found below three F. dimorpha morphotypes: anastomosed (An), multistemmed (Na) (both tree types located in occasionally cultivated parklands), and public forest (Fo) tree types. Ten 1 kg soil samples (Rs) were randomly collected from between 10 and 40 cm depth under the tree cover for each morphological type of trees, within a homogeneous edaphotopographic slope. Ten additional samples of non-Rs, situated 50 m away from any dimorphic ash tree cover, were also randomly collected as control (Nr). Root samples of F. dimorpha were collected for mycorrhizal colonization assessment for An, Na, and Fo trees.

2.2. Soil Chemical and Physical Analysis

Soil chemical and physical characteristics were determined using the following methods: Total Kjeldahl nitrogen (TKN) was determined using the Kjeldahl method [13], which consists in distilling the transformed organic nitrogen in a soil sample in boric acid (H3BO3) as ammonium (NH+4) and titrating it with dilute sulfuric acid. Available phosphorus (P) was determined using the Olsen method [14]; soil phosphoric acid was extracted using sodium bicarbonates (NaHCO3), and the resulting proportional blue color of the phosphomolybdic complex was evaluated using spectrophotometry at 820 nm. Total organic carbon (TOC) was determined with the potassium dichromate method [13], soil sample organic matter was completely oxidized using potassium dichromate (K2Cr2O7), and residual potassium dichromate was dosed with Mohr salt ((NH4)2Fe(SO4)2(H2O)6). Carbon-to-nitrogen (C/N) ratio was calculated using the last two parameters. Soil texture was determined using a Robinson pipette [13]; soil fine particles (sands, silt, and clay) were separated by diameter and gravity after different time periods and at different depths using the Stokes equation. Electrical conductivity and pH were measured using a conductometer (Basic 30) and a pH meter (Basic 20), respectively, for a 1:5 soil-to-water ratio.

2.3. Mycorrhizal Attributes

2.3.1. Root Mycorrhization

Arbuscular mycorrhizal fungi colonization assessment was performed according to the Phillips and Hayman [15] clearing and coloring method. Fine roots were cleared in 10% potassium hydroxide (KOH). They were then colored with 5 mL Trypan blue with repeated washing between and after. Next, samples were cut into 1 cm fragments, and 20 were placed on each slide, with three repetitions for each sample. Glycerol was added for conservation, as well as a cover slip before visualization under microscope. Mycorrhizal structures appear in dark blue. Relative mycorrhization intensity was measured by assigning a colonization index from 0 to 5: 0, no colonization; 1, colonization percentage less than 1%; 2, between 1% and 10%; 3, between 11% and 50%; 4, between 51% and 90%; 5, greater than 91% [16]:
M   %   = ( 95 × n 5 + 70 × n 4 + 30 × n 3 + 5 × n 2   +   n 1 ) Tf
where n5 is the fragments number that represents the colonization degree corresponding to index 5, the same for n4, n3, n2, and n1, respectively; and Tf is total fragments number.

2.3.2. Spore Enumeration

Arbuscular mycorrhizal fungi spores isolation was conducted using the Gerdemann and Nicolson method [17]: wet sieving and decanting, in combination with the Walker sucrose gradient centrifugation method [18]. Soil samples were passed through a set of sieves (800 and 50 µm) under running water. The trapped fraction in between was processed with two-step centrifugation at 3000 rpm, first with distilled water, then with two sucrose solutions (40% and 60%), with filtration being carried out on Whatman paper. Spores were observed and counted under a stereoscopic microscope at ×40.

2.4. Statistical Analysis

Results were tested using one-way analysis of variance (ANOVA) after dismissing heteroscedasticity and confirming normality using the Levene and Shapiro–Wilk tests, respectively [18]. Tukey’s honest significant difference (HSD) was performed to describe significance. The Pearson product-moment coefficient was used to measure the linear correlation between the studied variables, for which p-values were approximated using the F-distributions. Values of p lower than 0.05 were considered significant. Principal component analysis (PCA) was also performed on all the variables to emphasize their variation and visualize how they evolve [19]. Statistical analyses were performed using the LibreOffice Calc v6.4.4 and R v4.0 software under a rolling ArchLabs distribution.

3. Results

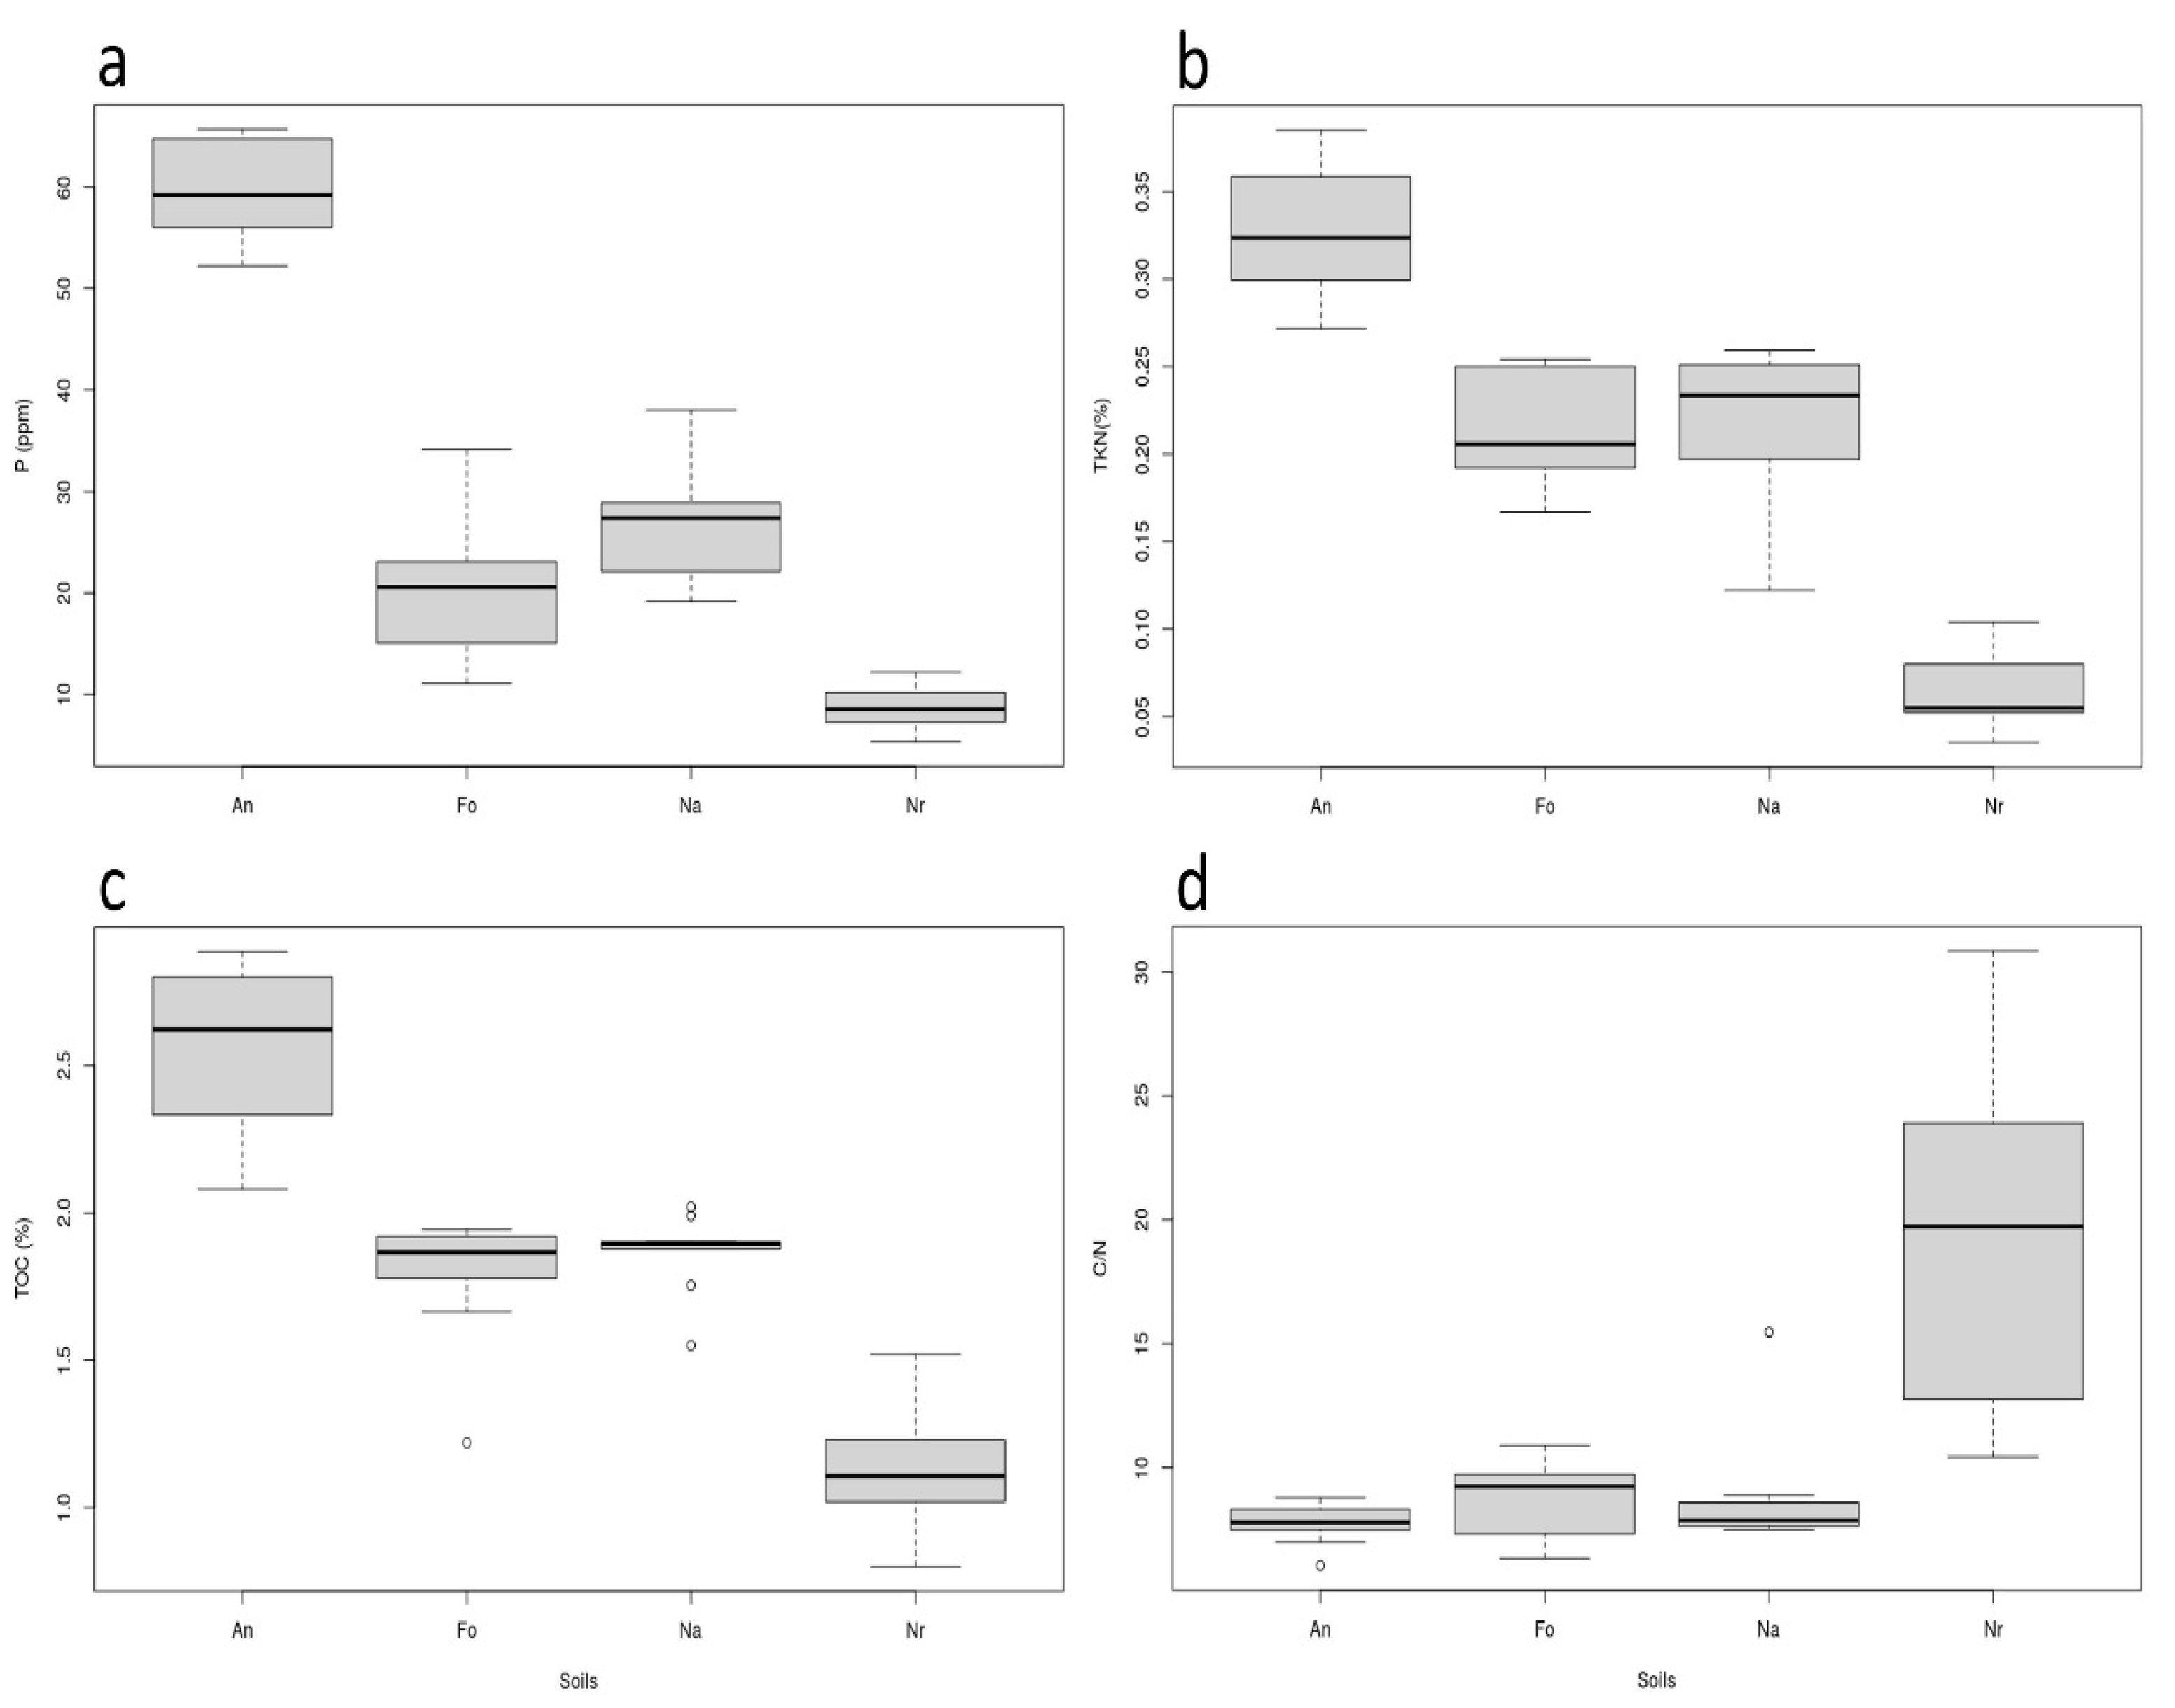
3.1. Soil Chemical and Physical Analyses

Variability in Rs’ abiotic variables is represented with box and whisker plots (Figure 3). An soil had significantly higher P (Figure 3a), TKN (Figure 3b), and TOC (Figure 3c) levels than the other soils (Table 1). Na had higher levels of the same parameters than Fo with no statistical significance. Nr had significantly the lowest levels of these parameters. The C/N ratio was 8 for An and Na and 9 for Fo. The Nr C/N ratio, on the other hand, was 19 and significantly higher than the other soil ratios (Figure 3d and Table 1). Texture did not change significantly for all the soil types and ranged from loam to loamy sand; pH was neutral, and Electrical Conductivity (EC) was around 3 µS/cm for all soils with no statistical difference. Thus these were left out of the box and whisker plots.

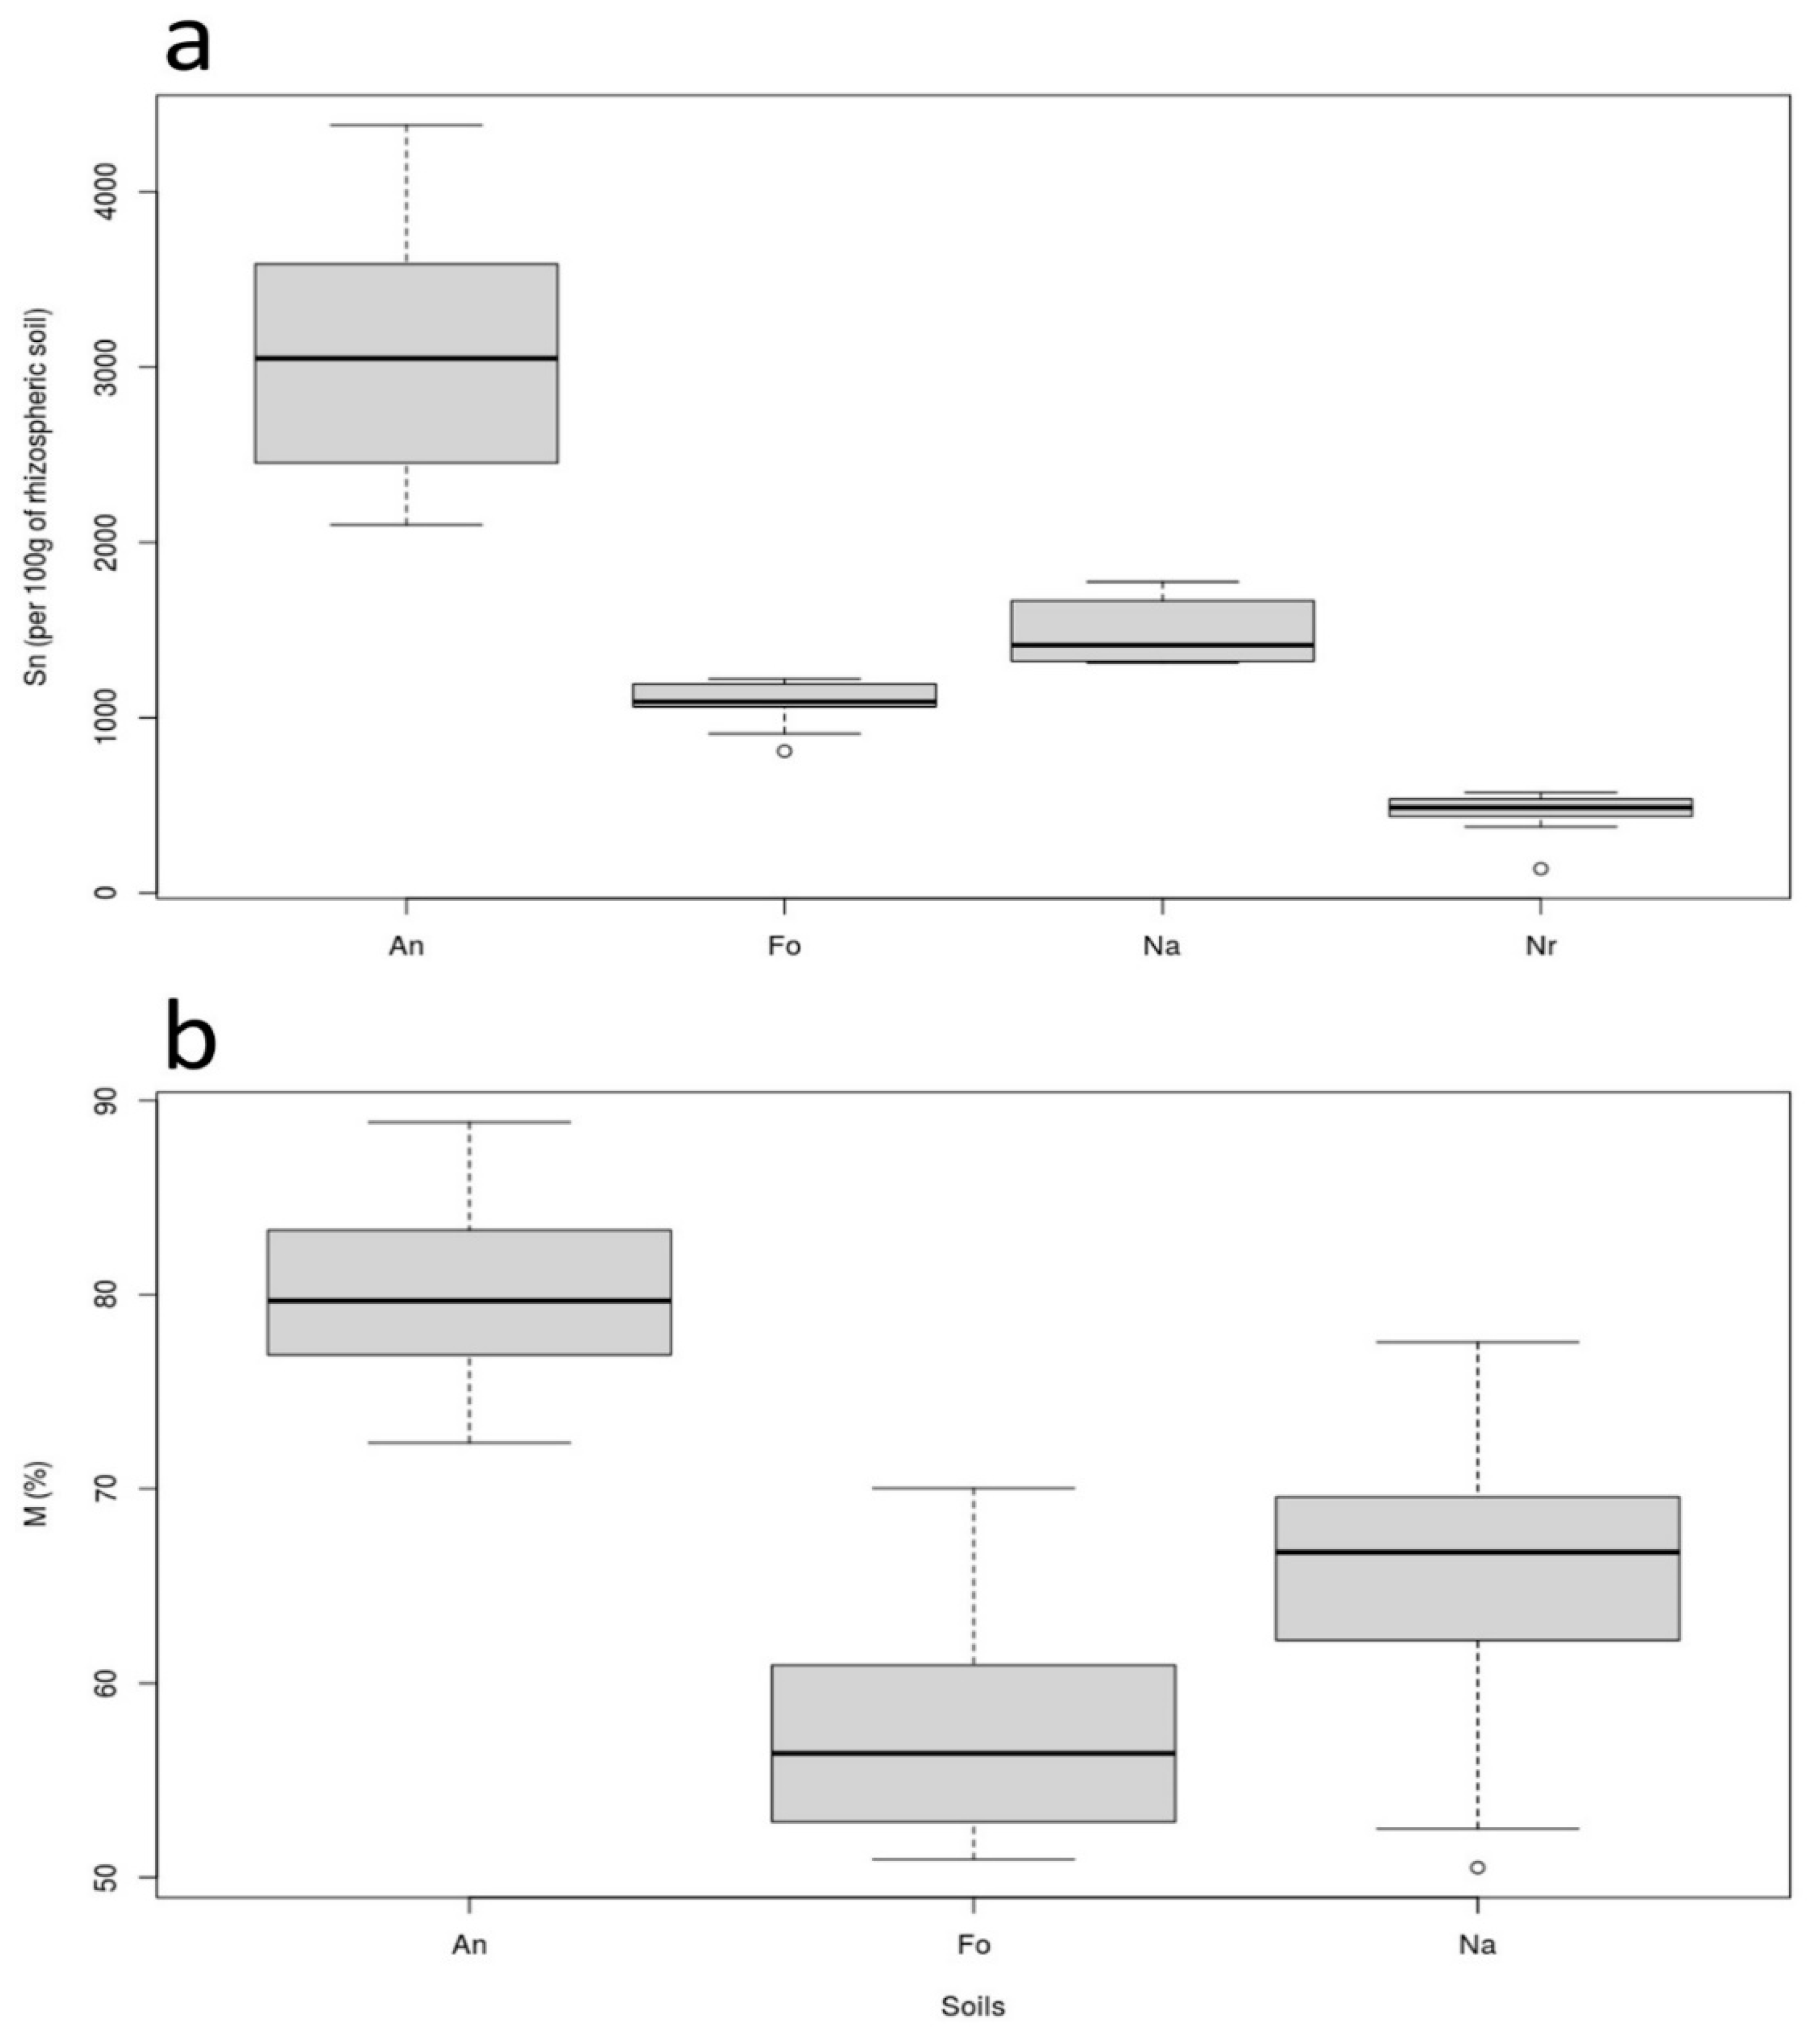
3.2. Soil Mycorrhizal Attributes

An significantly had the highest spore density (Figure 4a) and mycorrhization intensity (Figure 4b), followed by Na, Fo, and Nr (Table 1). All root samples were mycorrhized and consequently had 100% mycorrhization frequency. The mycorrhized fragments number was equal to the total observed fragments number (M% = m%). That is the reason why only the relative mycorrhization intensity (M%) was used to evaluate the difference in colonization levels.
Compared with the control, An had six times higher P levels, five times higher TKN levels, and twice higher TOC levels. It also showed 37% higher mycorrhization intensity than Fo and six times higher spore density than Nr. Compared with Na, An had twice higher P levels, 47% higher TKN levels, 35% higher TOC levels, 22% higher M, and twice higher spore density. Compared with Nr, Na had three times higher P levels, three times higher TKN levels, and 65% times higher TOC levels. It also showed 12% higher mycorrhization intensity than Fo and three times higher spore density than Nr. Na and Fo did not differ much, and all differences were insignificant. Lastly, Fo had twice higher P content than Nr, three times higher TKN content, 58% higher TOC content, and twice higher spore density than Nr.
The studied variables’ correlations were grouped by soil type in Table 2, Table 3, Table 4 and Table 5. For An, a strong and significant positive correlation was found between P and M, P and Sn, M and Sn, Sn and TKN, and Sn and TOC and a moderate positive correlation between P and TKN (Table 2). For Na, a strong and significant positive correlation was found between P and M and between M and TKN, a moderate positive correlation between P and TKN and between M and TOC) and a strong negative one between TKN and C/N (Table 3). For Fo, a strong and significant positive correlation was noted between P and M and between M and Sn and a strong negative one between TKN and C/N) (Table 4). Lastly, the Nr soil type had one strong significant negative correlation between TKN and C/N (Table 5).
Figure 5a shows PCA compressed 56.5% of the data in the first component and 15.7% in the second. Figure 5b shows the biplot of the PCA with samples and variables represented in the plot. The PCA biplot shows the intimate co-evolution of P, TKN, and Sn, followed by M and TOC, highly driven by the An soil, while Nr had no influence. An showed a small overlap with Na and an even smaller one with Fo. Nr did not show any overlap with the other soil types.

4. Discussion

The differences between the studied soil types are very considerable, considering that they are under the same climatic, topographic, and edaphic conditions. Since their only differences rely on whether or not they are located under specific tree morphotypes or not submitted to tree management (Fo and Nr), we consider that these differences are to be related to human intervention in tree shaping. Tree shaping seems to lead to an increase in biological activity and nutrient fluxes, and thus to differences in soil properties, as found in a Himalayan context [20]. For the An and Na soil types, the only difference is the presence/absence of anastomosis. Fo trees are subjected to higher but still moderate browsing [7]. This could explain the Fo soil’s low recorded values for the studied variables and high C/N ratio compared with the other soil types. Heavy grazing has been proved to have a negative impact on soil fertility and AMF attributes [21,22,23,24,25,26]. In the present case, slight grazing could explain the relatively elevated N levels in soils [27,28], as well as the technique used to deliver forage material to flocks. Grazing in moderation was also recorded to have an increasing effect on AMF [29]. The only difference between An and Na samples was the shaping applied on trees. Some samples were no more than 10 m away from each other, but presented completely different soil profiles (Figure 1a). Most Na and Fo parameters were statistically similar and had almost the same profile. This suggests that the major explanation for the remarkably high An soil parameters is linked to the tree shaping status. The biomass produced by anastomosed trees is higher [6], which enriches the soil more than elsewhere, leading to increased soil biological activity.
The C/N ratio is used to characterize the patterns of change in organic matter in soil. It can represent an important indicator describing the organic matter state and its influence on soil microbial activity and identity and soil productivity [30,31]. Carbon is lost by mineralization faster than nitrogen, and the C/N ratio decreases over time. Low C/N ratios generally indicate that plants provide soil biological activity with necessary resources so that it releases, in return, the elements contained in the organic matter faster, thus helping to nourish the trees more actively [32]. In this study, An, Na, and Fo C/N ratios point to rapid decomposition of soil organic matter and release of N into the soil, which can also be an alternative explanation for the soils’ elevated N levels. The higher Nr C/N ratio was still within the range, favoring good organic matter decomposition with little to no release of N into the soil [33].
Correlating the studied variables showed some similarities and clear differences between the behaviors of these variables in the different studied soil types. Starting with the similarities, all soil types had a significant positive correlation between P and M. An and Fo had one similarity as both had a strong and significant positive correlation between M and Sn. An and Na also had one similarity, a strong and significant positive correlation between P and TKN. The differences were that Nr showed no distinctive correlations between almost all of its parameters, and only An had a strong and significant positive correlation between Sn and TOC and between Sn and TKN. An had a distinctive new pattern never previously mentioned in the literature, where three variables (P, M, and Sn) positively correlated strongly with each other. To our knowledge, this is the first time such a pattern emerged. In the available literature, one or two of these variables commonly correlate negatively with the others, often being spore density and available phosphorus [34,35,36,37], although some studies sometimes showed positive correlations [38,39,40]. One study even showed that P can correlate with either M or Sn [41], but we could not find one that cites such case where the three variables simultaneously correlate positively with each other. This newly observed pattern could be interpreted as the result of an indirect effect of stems shaping on the discussed soil variables.
Arbuscular mycorrhizal fungi are a fungi group that forms mutualistic symbiosis with most land plants [42]. They are well known for increasing plant nutrient uptake and productivity [43]. Their impacts on a wide range of ecosystem processes and several species are very well documented [44,45,46]. In high concentrations, phosphorus is known to suppress AMF infection and spore density [47], whereas in low concentrations, AMF take on the task of P prospectors and make it more available to the host at the hyphosphere and mycorrhizosphere [48]. Arbuscular Mycorrhizal Fungi’s positive correlation with TKN has also been reported [49,50], while different nitrogen responses have also been mentioned, ranging from positive correlation to P [51] to even opposing levels of P [52,53].
Principal Component analysiss confirmed the noted correlations and showed that Na and Fo shared more similarities with high variance overlap, while for Nr, the absence of variance overlap singled it out, not having any significant similarities with any of the other soil types. M and Sn co-evolution has also been noted in another ecosystem on a different tree species, Juniperus phoenicea [36]. It also showed that pH, EC, and texture evolved independently of the rest of the variables not having any drive effect on them.
Agroforestry is undergoing a revival of interest nowadays, particularly to manage soil fertility and in the context of ongoing climate change [54]. Pollarding is a secular technique found historically in many countries [55]. If it almost disappeared in many of them due to the eviction of trees in croplands, it is still alive in various developing countries and supports local livelihoods [20,56]. It is considered to be an efficient technique to delay tree ageing [57], as well as to modify the allocation of resources, especially in the short-term shift in shoot–root balance induced by pruning or pollarding, which can lead to altered root distribution and fine-root turnover enriching soil biota [58]. This knowledge has to be enriched, by both observation of traditional practices and experimentation, and could be useful to develop alternative schemes for agricultural production.
Finally, these results provide arguments in support of the intermediate disturbance hypothesis [59,60], which argues that biological diversity and ecological functioning are enhanced when environments are subjected to intermediate levels of disturbance. Trunk anastomosis, by enhancing tree productivity, seems to promote organic restitutions to the soil and favor its biological activity. These results have to be confirmed in other situations, particularly in zones where pollarding has been used for long time.

5. Conclusions

Traditional tree shaping by pollarding and favoring trunk anastomosis have a clear and distinct positive impact on the dimorphic ash tree’s rhizospheric soil variables found in agroforestral systems in the Central Moroccan High Atlas, particularly on phosphorus, nitrogen, and carbon content, and on mycorrhizal activity, compared with uncultivated or poorly managed soils. This illustrates that, in some cases, human practices can indirectly improve the delivery of ecosystem services from spontaneous forested stands. Our results confirm the initial hypothesis that soil characteristics respond to F. dimorpha shaping, as such changes in the aerial parts of the tree require recruitment of all the belowground actors, both abiotic and biotic. They tend to show that soil biological activity can be boosted by modifying natural tree port, and by a management that allows higher organic restitutions. However, these results suggest that abiotic factors alone are insufficient to fully explain the spectacular improvement of leaf productivity on anastomosed tree, and physiological, histological, and biomolecular experiments have to be conducted to better understand the impact of shaping dimorphic ash tree at these different levels, and their mutual interactions.

Author Contributions

Conceptualization, A.F., D.G., M.A., M.H.; writing—original draft, A.F., D.G.; methodology, M.A.-E.-M., A.M., A.F., M.H.; investigation, A.F., E.M.O., S.M.; writing—review and editing, A.F., M.A.-E.-M., D.G., M.A., A.M., M.H. All authors have read and agreed to the published version of the manuscript.

Funding

This research was partly funded by Agence Nationale de la Recherche, France, within the Research Project Med-Inn-Local (ANR-12-TMED-0001-01), with further support from participating authors’ institutions.

Conflicts of Interest

The authors declare no conflict of interest.

References

  1. Parrotta, J.; Agnoletti, M. Traditional forest knowledge: Challenges and opportunities. Forest Ecol. Manag. 2007, 249, 1–4. [Google Scholar] [CrossRef]
  2. Maffi, L.; Woodley, E. Biocultural Diversity Conservation: A Global Sourcebook; Routledge: London, UK, 2012. [Google Scholar]
  3. De Freitas, J.G.; Bastos, M.R.; Dias, J.A. Traditional Ecological Knowledge as a Contribution to Climate Change Mitigation and Adaptation: The Case of the Portuguese Coastal Populations. In Handbook of Climate Change Communication: Case Studies in Climate Change Communication; Filho, W.L., Manolas, E., Azul, A.M., Azeiteiro, U.M., McGhie, H., Eds.; Springer International Publishing: Cham, Switzerland, 2018; pp. 257–269. [Google Scholar] [CrossRef]
  4. Wyllie de Echeverria, V.R.; Thornton, T.F. Using traditional ecological knowledge to understand and adapt to climate and biodiversity change on the Pacific coast of North America. Ambio 2019, 48, 1447–1469. [Google Scholar] [CrossRef] [PubMed] [Green Version]
  5. Parrotta, J.; Yeo-Chang, Y.; Camacho, L.D. Traditional knowledge for sustainable forest management and provision of ecosystem services. Int. J. Biodivers. Sci. Ecosyst. Serv. Manag. 2016, 12, 1–4. [Google Scholar] [CrossRef]
  6. Genin, D.; M’Sou, S.; Ferradous, A.; Alifriqui, M. Another vision of sound tree and forest management: Insights from traditional ash shaping in the Moroccan Berber mountains. For. Ecol. Manag. 2018, 429, 180–188. [Google Scholar] [CrossRef]
  7. Genin, D.; Crochot, C.; MSou, S.; Araba, A.; Alifriqui, M. Meadow up a tree: Feeding flocks with a native ash tree in the Moroccan mountains. Pastoralism 2016, 6. [Google Scholar] [CrossRef] [Green Version]
  8. Genin, D.; Alifriqui, M. The agroforestry parklands with dimorphic ash trees of Aït M’Hamed. A well-guarded local specificity. In The Emergence of Local Specificities in the Mediterranean Hinterlands; Aderghal, M., Genin, D., Hanafi, A., Landel, P.A., Michon, G., Eds.; Laboratoire Population-Environnement-Développement: Marseille, France, 2019; pp. 30–51. ISBN 979-10-96763-08-5. [Google Scholar]
  9. Schweingruber, F.H. Wood Structure and Environment; Springer Science & Business Media: Berlin/Heidelberg, Germany, 2007. [Google Scholar]
  10. Howard, K.S.C.; Eldridge, D.J.; Soliveres, S. Positive effects of shrubs on plant species diversity do not change along a gradient in grazing pressure in an arid shrubland. Basic Appl. Ecol. 2012, 13, 159–168. [Google Scholar] [CrossRef]
  11. Birhane, E.; Ahmed, S.; Hailemariam, M.; Negash, M.; Rannestad, M.M.; Norgrove, L. Carbon stock and woody species diversity in homegarden agroforestry along an elevation gradient in southern Ethiopia. Agrofor. Syst. 2020, 94, 1099–1110. [Google Scholar] [CrossRef]
  12. Rillig, M.C.; Mummey, D.L. Mycorrhizas and soil structure. New Phytol. 2006, 171, 41–53. [Google Scholar] [CrossRef]
  13. Schinner, F.; Öhlinger, R.; Kandeler, E.; Margesin, R. Methods in Soil Biology; Springer Science & Business Media: Berlin/Heidelberg, Germany, 2012. [Google Scholar]
  14. Olsen, S.R. Estimation of available phosphorus in soils by extraction with sodium bicarbonate. USDA Circular 1954, 24. [Google Scholar] [CrossRef]
  15. Phillips, J.M.; Hayman, D.S. Improved procedures for clearing roots and staining parasitic and vesicular-arbuscular mycorrhizal fungi for rapid assessment of infection. Trans. Br. Mycol. Soc. 1970, 55, 158. [Google Scholar] [CrossRef]
  16. Trouvelot, A.; Kough, J.L.; Gianinazzi-Pearson, V. Measurement of the mycorrhization rate VA of a root system. In search for an estimation method with functional significance Presented at the Physiological and genetical aspects of mycorrhizae. In Proceedings of the 1st European Symposium on Mycorrhizae, Dijon, France, 1–5 July 1985; pp. 217–221. [Google Scholar]
  17. Gerdemann, J.W.; Nicolson, T.H. Spores of mycorrhizal Endogone species extracted from soil by wet sieving and decanting. Trans. Br. Mycol. Soc. 1963, 46, 235–244. [Google Scholar] [CrossRef]
  18. Scheffe, H. The Analysis of Variance; John Wiley & Sons, Inc.: Hoboken, NJ, USA, 1959; pp. 351–358. [Google Scholar]
  19. Jolliffe, I.T. Principal Component Analysis. In Series in Statistics; Springer: New York, NY, USA, 2012. [Google Scholar] [CrossRef]
  20. Singh, R.K.; Singh, A.; Garnett, S.T.; Zander, D.K.; Lobsang, D.K.; Tsering, D. Paisang (Quercus griffithii); a keystone tree species in sustainable agroecosystem management and livelihoods in Arunachal Pradesh, India. Environ. Manag. 2015, 55, 187–204. [Google Scholar] [CrossRef] [PubMed]
  21. Walker, C.; Mize, C.W.; McNabb, H.S. Populations of endogonaceous fungi at two locations in central Iowa. Can. J. Bot. 1982, 60, 2518–2529. [Google Scholar] [CrossRef]
  22. Liu, J.; Zhang, Q.; Li, Y.; Di, H.; Xu, J.; Li, J.; Pan, H. Effects of pasture management on soil fertility and microbial communities in the semi-arid grasslands of Inner Mongolia. J. Soils Sediments 2016, 16, 235–242. [Google Scholar] [CrossRef]
  23. Guangyu, Z.; Zhuangsheng, T.; Lei, C.; Zhouping, S.; Lei, D. Overgrazing depresses soil carbon stock through changing plant diversity in temperate grassland of the Loess Plateau. Plant Soil Environ. 2018, 64, 1–6. [Google Scholar] [CrossRef] [Green Version]
  24. Cai, Y.; Yan, Y.; Xu, D.; Xu, X.; Wang, C.; Wang, X.; Eldridge, D.J. The fertile island effect collapses under extreme overgrazing: Evidence from a shrub-encroached grassland. Plant Soil 2020, 448, 201–212. [Google Scholar] [CrossRef]
  25. Faghihinia, M.; Zou, Y.; Chen, Z.; Bai, Y.; Li, W.; Marrs, R.; Staddon, P.L. The response of grassland mycorrhizal fungal abundance to a range of long-term grazing intensities. Rhizosphere 2020, 13, 100178. [Google Scholar] [CrossRef]
  26. Yang, X.; Chen, J.; Shen, Y.; Dong, F.; Chen, J. Global negative effects of livestock grazing on arbuscular mycorrhizas: A meta-analysis. Sci. Total Environ. 2020, 708, 134553. [Google Scholar] [CrossRef]
  27. Li, Y.; Wu, J.; Shen, J.; Liu, S.; Wang, C.; Chen, D.; Zhang, J. Soil microbial C:N ratio is a robust indicator of soil productivity for paddy fields. Sci. Rep. 2016, 6, 35266. [Google Scholar] [CrossRef] [Green Version]
  28. Shen, H.; Dong, S.; Li, S.; Xiao, J.; Han, Y.; Yang, M.; Yeomans, J.C. Grazing enhances plant photosynthetic capacity by altering soil nitrogen in alpine grasslands on the Qinghai-Tibetan plateau. Agric. Ecosyst. Environ. 2019, 280, 161–168. [Google Scholar] [CrossRef]
  29. Wan, X.; Huang, Z.; He, Z.; Yu, Z.; Wang, M.; Davis, M.R.; Yang, Y. Soil C:N ratio is the major determinant of soil microbial community structure in subtropical coniferous and broadleaf forest plantations. Plant Soil 2015, 387, 103–116. [Google Scholar] [CrossRef]
  30. Eom, A.-H.; Wilson, G.W.T.; Hartnett, D.C. Effects of ungulate grazers on arbuscular mycorrhizal symbiosis and fungal community structure in tallgrass prairie. Mycologia 2001, 93, 233–242. [Google Scholar] [CrossRef]
  31. Li, W.; Cao, W.; Wang, J.; Li, X.; Xu, C.; Shi, S. Effects of grazing regime on vegetation structure, productivity, soil quality, carbon and nitrogen storage of alpine meadow on the Qinghai-Tibetan Plateau. Ecol. Eng. 2017, 98, 123–133. [Google Scholar] [CrossRef]
  32. Brust, G.E. Chapter 9-Management Strategies for Organic Vegetable Fertility. In Safety and Practice for Organic Food; Biswas, D., Micallef, S.A., Eds.; Academic Press: Cambridge, MA, USA, 2019; pp. 193–212. [Google Scholar] [CrossRef]
  33. Zhang, S.; Zheng, Q.; Noll, L.; Hu, Y.; Wanek, W. Drivers of microbial nitrogen use efficiency and soil inorganic N processes at the continental scale. Geophys. Res. Abstr. 2019, 21, 1–4. [Google Scholar]
  34. Khakpour, O.; Khara, J. Spore density and root colonization by arbuscular mycorrhizal fungi in some species in the northwest of Iran. Int. Res. J. Appl. Basic Sci. 2012, 3, 977–982. [Google Scholar]
  35. Tamil Pradha, K.; Sivakumar, K. Effects of am fungi on spores density and root colonization of chilli (Capsicum annum) at different levels of rock phosphate. Int. J. Curr. Res. Life Sci. 2018, 7, 1415–1419. [Google Scholar]
  36. Fakhech, A.; Ouahmane, L.; Hafidi, M. Seasonality of mycorrhizal attributes, soil phosphorus and nitrogen of Juniperus phoenicea and Retama monosperma boiss. in an Atlantic sand dunes forest. J. Sustain. For. 2019, 38, 1–17. [Google Scholar] [CrossRef]
  37. Gao, D.; Pan, X.; Zhou, X.; Wei, Z.; Li, N.; Wu, F. Phosphorus fertilization and intercropping interactively affect tomato and potato onion growth and rhizosphere arbuscular mycorrhizal fungal community. Arch. Agron. Soil Sci. 2020. [Google Scholar] [CrossRef]
  38. Rubio, R.; Borie, F.; Schalchli, C.; Castillo, C.; Azcón, R. Occurrence and effect of arbuscular mycorrhizal propagules in wheat as affected by the source and amount of phosphorus fertilizer and fungal inoculation. Appl. Soil Ecol. 2003, 23, 245–255. [Google Scholar] [CrossRef]
  39. Cuéllar, A.E.; Martinez, L.R.; Espinosa, R.R.; Cuéllar, E.E. The Inoculation with an Effecient AMF Strain Decreases the Phosphoric Fertilizer Requirements in Ipomea Batata (L.), Lam in Dry Period. J. Chem. Environ. Biol. Eng. 2019, 3, 13. [Google Scholar] [CrossRef]
  40. Effendy, M.; Wijayani, B.W. Estimation of Available Phosphorus in Soil Using the Population of Arbuscular Mycorrhizal Fungi Spores. J. Trop. Soils 2019, 16, 225–232. [Google Scholar] [CrossRef]
  41. Abdel-Fattah, G.M.; El-Dohlob, A.F.; El-Dohlob, G.M.; El-Haddad, S.M.; Hafez, S.A.; Rashad, Y.M. An ecological view of arbuscular mycorrhizal status in some Egyptian plants. J. Environ. Sci. 2010, 37, 123–136. [Google Scholar]
  42. Brundrett, M.C.; Tedersoo, L. Evolutionary history of mycorrhizal symbioses and global host plant diversity. New Phytol. 2018, 220, 1108–1115. [Google Scholar] [CrossRef] [PubMed]
  43. Smith, S.E.; Smith, F.A. Roles of Arbuscular Mycorrhizas in Plant Nutrition and Growth: New Paradigms from Cellular to Ecosystem Scales. Annu. Rev. Plant Biol. 2011, 62, 227–250. [Google Scholar] [CrossRef] [PubMed] [Green Version]
  44. Powell, J.R.; Rillig, M.C. Biodiversity of arbuscular mycorrhizal fungi and ecosystem function. New Phytol. 2018, 220, 1059–1075. [Google Scholar] [CrossRef] [PubMed] [Green Version]
  45. Fakhech, A.; Ouahmane, L.; Hafidi, M. Analysis of symbiotic microbial status of Atlantic sand dunes forest and its effects on Acacia gummifera and Retama monosperma (Fabaceae) to be used in reforestation. J. For. Res. 2019. [Google Scholar] [CrossRef]
  46. Ait-El-Mokhtar, M.; Fakhech, A.; Anli, M.; Ben-Laouane, R.; Boutasknit, A.; Wahbi, S.; Meddich, A. Infectivity of the palm groves arbuscular mycorrhizal fungi under arid and semi-arid climate and its edaphic determinants towards efficient ecological restoration. Rhizosphere 2020, 100220. [Google Scholar] [CrossRef]
  47. Tucker, M. Effects of Phosphorus on Mycorrhizal Ccolonization of Wetland Plants under Natural and Controlled Conditions. Master’s Thesis, Wilfrid Laurier University, Waterloo, Belgium, 2020. [Google Scholar]
  48. Linderman, R.G. The mycorrhizosphere phenomenon. In Proceedings of the International Symposium “Mycorrhiza for Plant Vitality” and the Joint Meeting of Working Groups 1–4 of COST Action 870, Hannover, Germany, 3–5 October 2007; pp. 341–355. [Google Scholar]
  49. Nuccio, E.E.; Hodge, A.; Pett-Ridge, J.; Herman, D.J.; Weber, P.K.; Firestone, M.K. An arbuscular mycorrhizal fungus significantly modifies the soil bacterial community and nitrogen cycling during litter decomposition: AMF alters soil bacterial community and N cycling. Environ. Microbiol. 2013, 15, 1870–1881. [Google Scholar] [CrossRef]
  50. Lin, C.; Wang, Y.; Liu, M.; Li, Q.; Xiao, W.; Song, X. Effects of nitrogen deposition and phosphorus addition on arbuscular mycorrhizal fungi of Chinese fir (Cunninghamia lanceolata). Sci Rep. 2020, 10, 12260. [Google Scholar] [CrossRef]
  51. Liu, C.; Ravnskov, S.; Liu, F.; Rubæk, G.H.; Andersen, M.N. Arbuscular mycorrhizal fungi alleviate abiotic stresses in potato plants caused by low phosphorus and deficit irrigation/partial root-zone drying. J. Agric. Sci. 2018, 156, 46–58. [Google Scholar] [CrossRef]
  52. Camenzind, T.; Homeier, J.; Dietrich, K.; Hempel, S.; Hertel, D.; Krohn, A.; Rillig, M.C. Opposing effects of nitrogen versus phosphorus additions on mycorrhizal fungal abundance along an elevational gradient in tropical montane forests. Soil Biol. Biochem. 2016, 94, 37–47. [Google Scholar] [CrossRef]
  53. Xiao, D.; Che, R.; Liu, X.; Tan, Y.; Yang, R.; Zhang, W.; Wang, K. Arbuscular mycorrhizal fungi abundance was sensitive to nitrogen addition but diversity was sensitive to phosphorus addition in karst ecosystems. Biol. Fertil. Soils 2019, 55, 457–469. [Google Scholar] [CrossRef]
  54. Jose, S. Agroforestry for ecosystem services and environmental benefits: An overview. Agrofor. Syst. 2009, 76, 1–10. [Google Scholar] [CrossRef]
  55. Petit, S.; Watkins, C. Forgotten peasant practices: Tree pollarding in Great Britain. Etudes Rural. 2004, 169, 197–214. [Google Scholar] [CrossRef]
  56. Genin, D.; Aumeerudy-Thomas, Y.; Balent, G.; Nasi, R. The multiple dimensionsof rural forests: Lessons from a comparative analysis. Ecol. Soc. 2013, 18, 27. [Google Scholar] [CrossRef] [Green Version]
  57. Ferrini, F. Pollarding and its effects on tree physiology: A look to mature and senescent tree management in Italy. In Pollard Trees in Europe, European Meeting on Pollard Trees; Dumont, E., Ed.; Maison Botanique: Boursay, France, 2006; pp. 71–79. [Google Scholar]
  58. Van Noordwijk, M.; Purnomosidhi, P. Root architecture in relation to tree-soil-crop interactions and shoot pruning in agroforestry. Agrofor. Syst. 1995, 30, 161–173. [Google Scholar] [CrossRef]
  59. Connell, J. Diversity in tropical rain forests and coral reefs. Science 1978, 199, 1302–1310. [Google Scholar] [CrossRef] [Green Version]
  60. Siebert, S.F.; Belsky, J.M. Historic livelihoods and land uses as ecological disturbances and their role in enhancing biodiversity: An example from Bhutan. Biol. Conserv. 2014, 177, 82–89. [Google Scholar] [CrossRef]
Figure 1. Four different F. dimorpha morphotypes: (a) anastomosed (background) and multistemmed (foreground) (image © Genin), (b) single-stemmed, (c) shrublike (images © Fakhech).
Land 09 00334 g001
Figure 2. Localization of the study area.
Land 09 00334 g002
Figure 3. Variability of (a) available phosphorus (P), (b) total Kjeldahl nitrogen (TKN), (c) total organic carbon (TOC), and (d) carbon-to-nitrogen (C/N) ratios between the studied soils. The box and whisker diagrams include median value (dark rectangle), range of 50% of the samples (large rectangle), maximum and minimum values (cross bars), and outliers (circle).
Land 09 00334 g003
Figure 4. Variability of (a) spore number (Sn) and (b) mycorrhization intensity (M) between the studied soils. The box and whisker diagrams include median value (dark rectangle), range of 50% of the samples (large rectangle), maximum and minimum values (cross bars), and outliers (circle).
Land 09 00334 g004
Figure 5. (a) Percentage of variances explained by each principal component; (b) PCA biplot of samples and variables, obtained from the analyzed variables for the different soil types. P, available phosphorus; TKN, total Kjeldahl nitrogen; TOC, total organic carbon; M, relative mycorrhization intensity; Sn, spore number; EC, electrical conductivity.
Land 09 00334 g005
Table 1. Analysis of variance and Tukey’s honest significant difference (HSD) p-values of the studied variables and soil types.
ANOVA p-ValuesTukey’s HSD p-Values
F-ValuePr (>F)An–NaAn–FoAn–NrNa–FoNa–NrFo–Nr
M321.9<2 × 10⁻¹⁶ ***3.13 × 10−5000.0600
Sn92.38<2 × 10⁻¹⁶ ***0000.092.4 × 10−60.003
P142.4<2 × 10⁻¹⁶ ***0000.071 × 10−70.0001
TKN95.32<2 × 10⁻¹⁶ ***4 × 10−7000.8600
TOC68.316.24 × 10−15 ***4 × 10−7000.8605 × 10−7
C/N20.366.9 × 10−8 ***0.90.94 × 10−70.92.6 × 10−62.1 × 10⁻⁶
pH0.820.49------
EC0.650.59------
Significance codes: ***, 0.001; P, available phosphorus; TKN, total Kjeldahl nitrogen; TOC, total organic carbon; M, relative mycorrhization intensity; Sn, spore number; EC, electrical conductivity. An, Anastomosed trees; Na: Non-anastomosed trees; Fo: Public forest; Nr: non-rhyzospheric soil.
Table 2. An soil parameters’ correlation coefficients (left down) and corresponding p-values (right up); significant cases are highlighted.
MSnPTKNTOCC/NpHEC
M 0.010.010.070.050.990.30.19
Sn0.76 0.010.0200.720.590.28
P0.770.78 0.040.090.630.710.34
TKN0.590.730.66 0.060.140.530.35
TOC0.630.910.560.61 0.280.440.47
C/N0.010.13−0.17−0.50.38 0.070.8
pH−0.36−0.20.140.22−0.28−0.59 0.91
EC0.450.380.340.330.26−0.090.04
P, available phosphorus; TKN, total Kjeldahl nitrogen; TOC, total organic carbon; M, relative mycorrhization intensity; Sn, spore number; EC, electrical conductivity.
Table 3. Na soil parameters’ correlation coefficients (left down) and corresponding p-values (right up); significant cases are highlighted.
MSnPTKNTOCC/NpHEC
M 0.1300.010.040.070.490.25
Sn0.51 0.220.260.180.440.280.26
P0.940.43 0.040.070.190.630.4
TKN0.790.390.66 0.2500.440.18
TOC0.660.460.60.4 0.950.660.29
C/N−0.59−0.28−0.46−0.90.02 0.280.4
pH0.250.380.170.28−0.16−0.38 0.95
EC0.4−0.390.30.460.37−0.3−0.02
P, available phosphorus; TKN, total Kjeldahl nitrogen; TOC, total organic carbon; M, relative mycorrhization intensity; Sn, spore number; EC, electrical conductivity.
Table 4. Fo soil parameters’ correlation coefficients (left down) and corresponding p-values (right up); significant cases are highlighted.
MSnPTKNTOCC/NpHEC
M 00.010.530.130.690.530.89
Sn0.82 0.290.620.20.610.580.99
P0.770.37 0.20.230.650.150.73
TKN0.230.180.44 0.40.030.840.52
TOC0.510.440.420.3 0.170.240.09
C/N0.140.18−0.16−0.690.47 0.610.04
pH−0.220.2−0.49−0.08−0.41−0.18 0.86
EC0.0500.130.23−0.57−0.660.06
P, available phosphorus; TKN, total Kjeldahl nitrogen; TOC, total organic carbon; M, relative mycorrhization intensity; Sn, spore number; EC, electrical conductivity.
Table 5. Nr soil parameters’ correlation coefficients (left down) and corresponding p-values (right up); significant cases are highlighted.
SnPTKNTOCC/NpHEC
Sn 0.10.540.420.850.520.81
P0.55 0.660.290.860.260.25
TKN0.22−0.16 0.9200.920.23
TOC0.29−0.37−0.04 0.140.330.41
C/N0.070.06−0.850.5 0.540.58
pH−0.230.40.04−0.35−0.22 0.41
EC−0.09−0.40.410.3−0.20.29
P, available phosphorus; TKN, total Kjeldahl nitrogen; TOC, total organic carbon; Sn, spore number; EC, electrical conductivity.

