Soil Organic Matter, Mitigation of and Adaptation to Climate Change in Cocoa–Based Agroforestry Systems

 ,
,  and
and 
Abstract
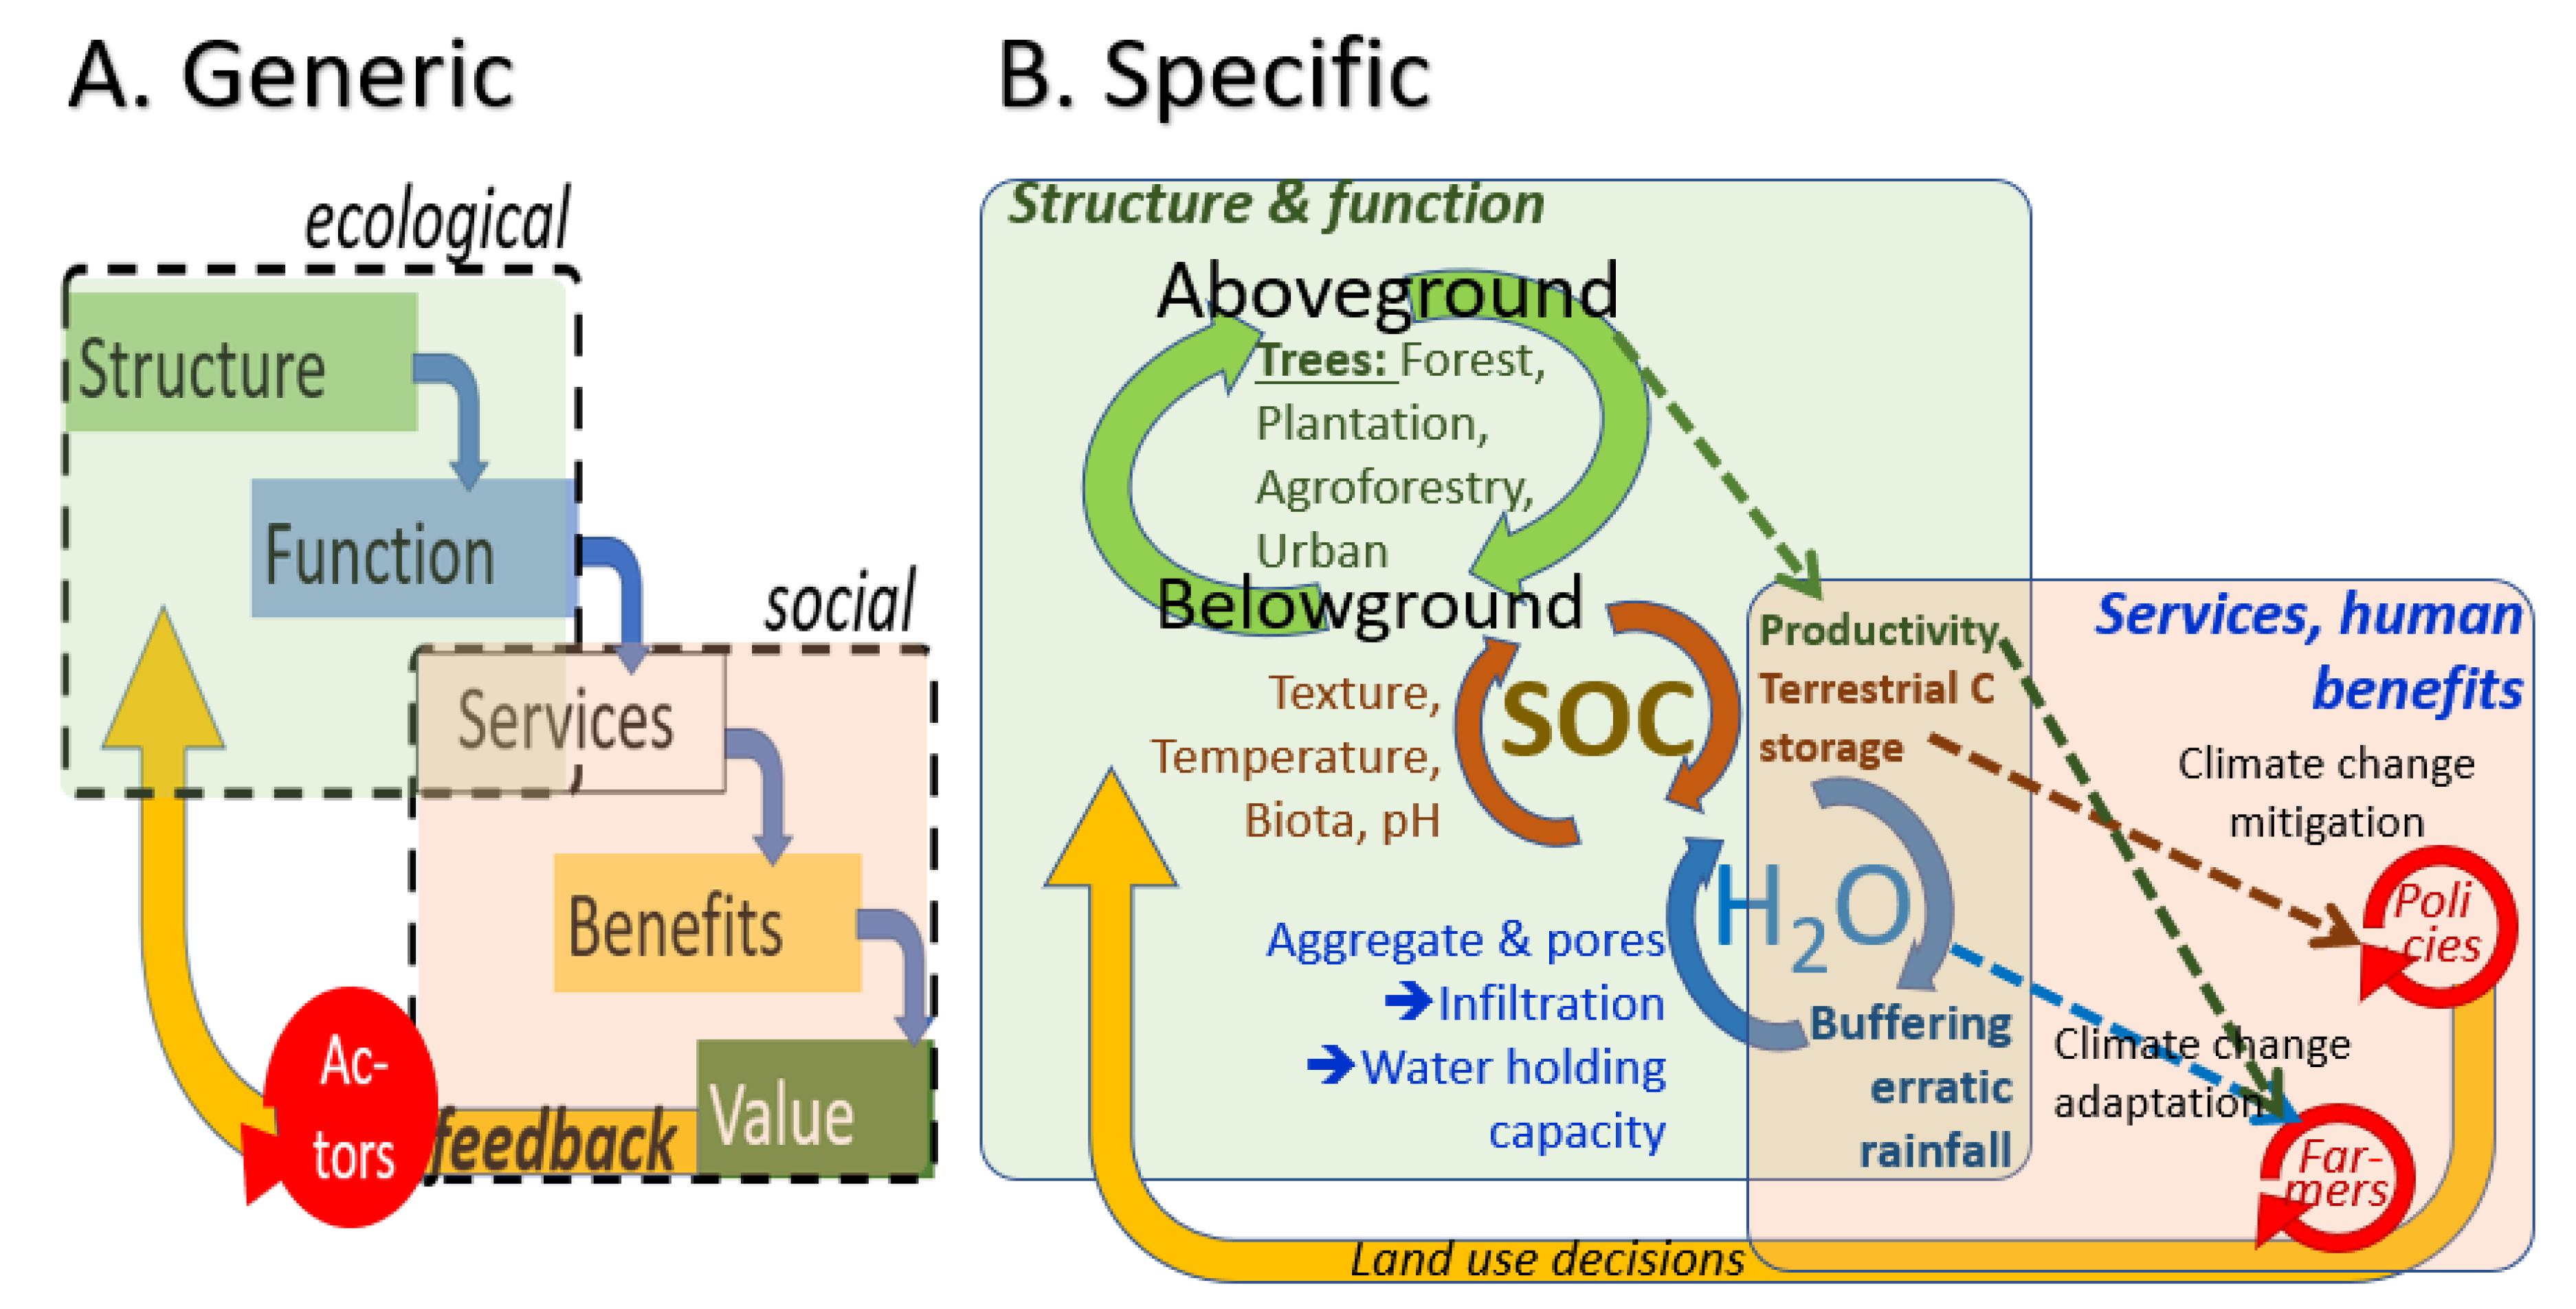
:1. Introduction
- A.
- Effects of trees as part of land cover change on soil organic matter (and soil carbon storage),
- B.
- Relations between soil organic matter and soil physical properties relevant to crop vulnerability to climate variability, and
- C.
- Deliberate farmer use of trees to reduce their own vulnerability (the adaptation line), potentially supported by global climate policies (if incentives will reach the farmer, then the dotted line).
2. Methods
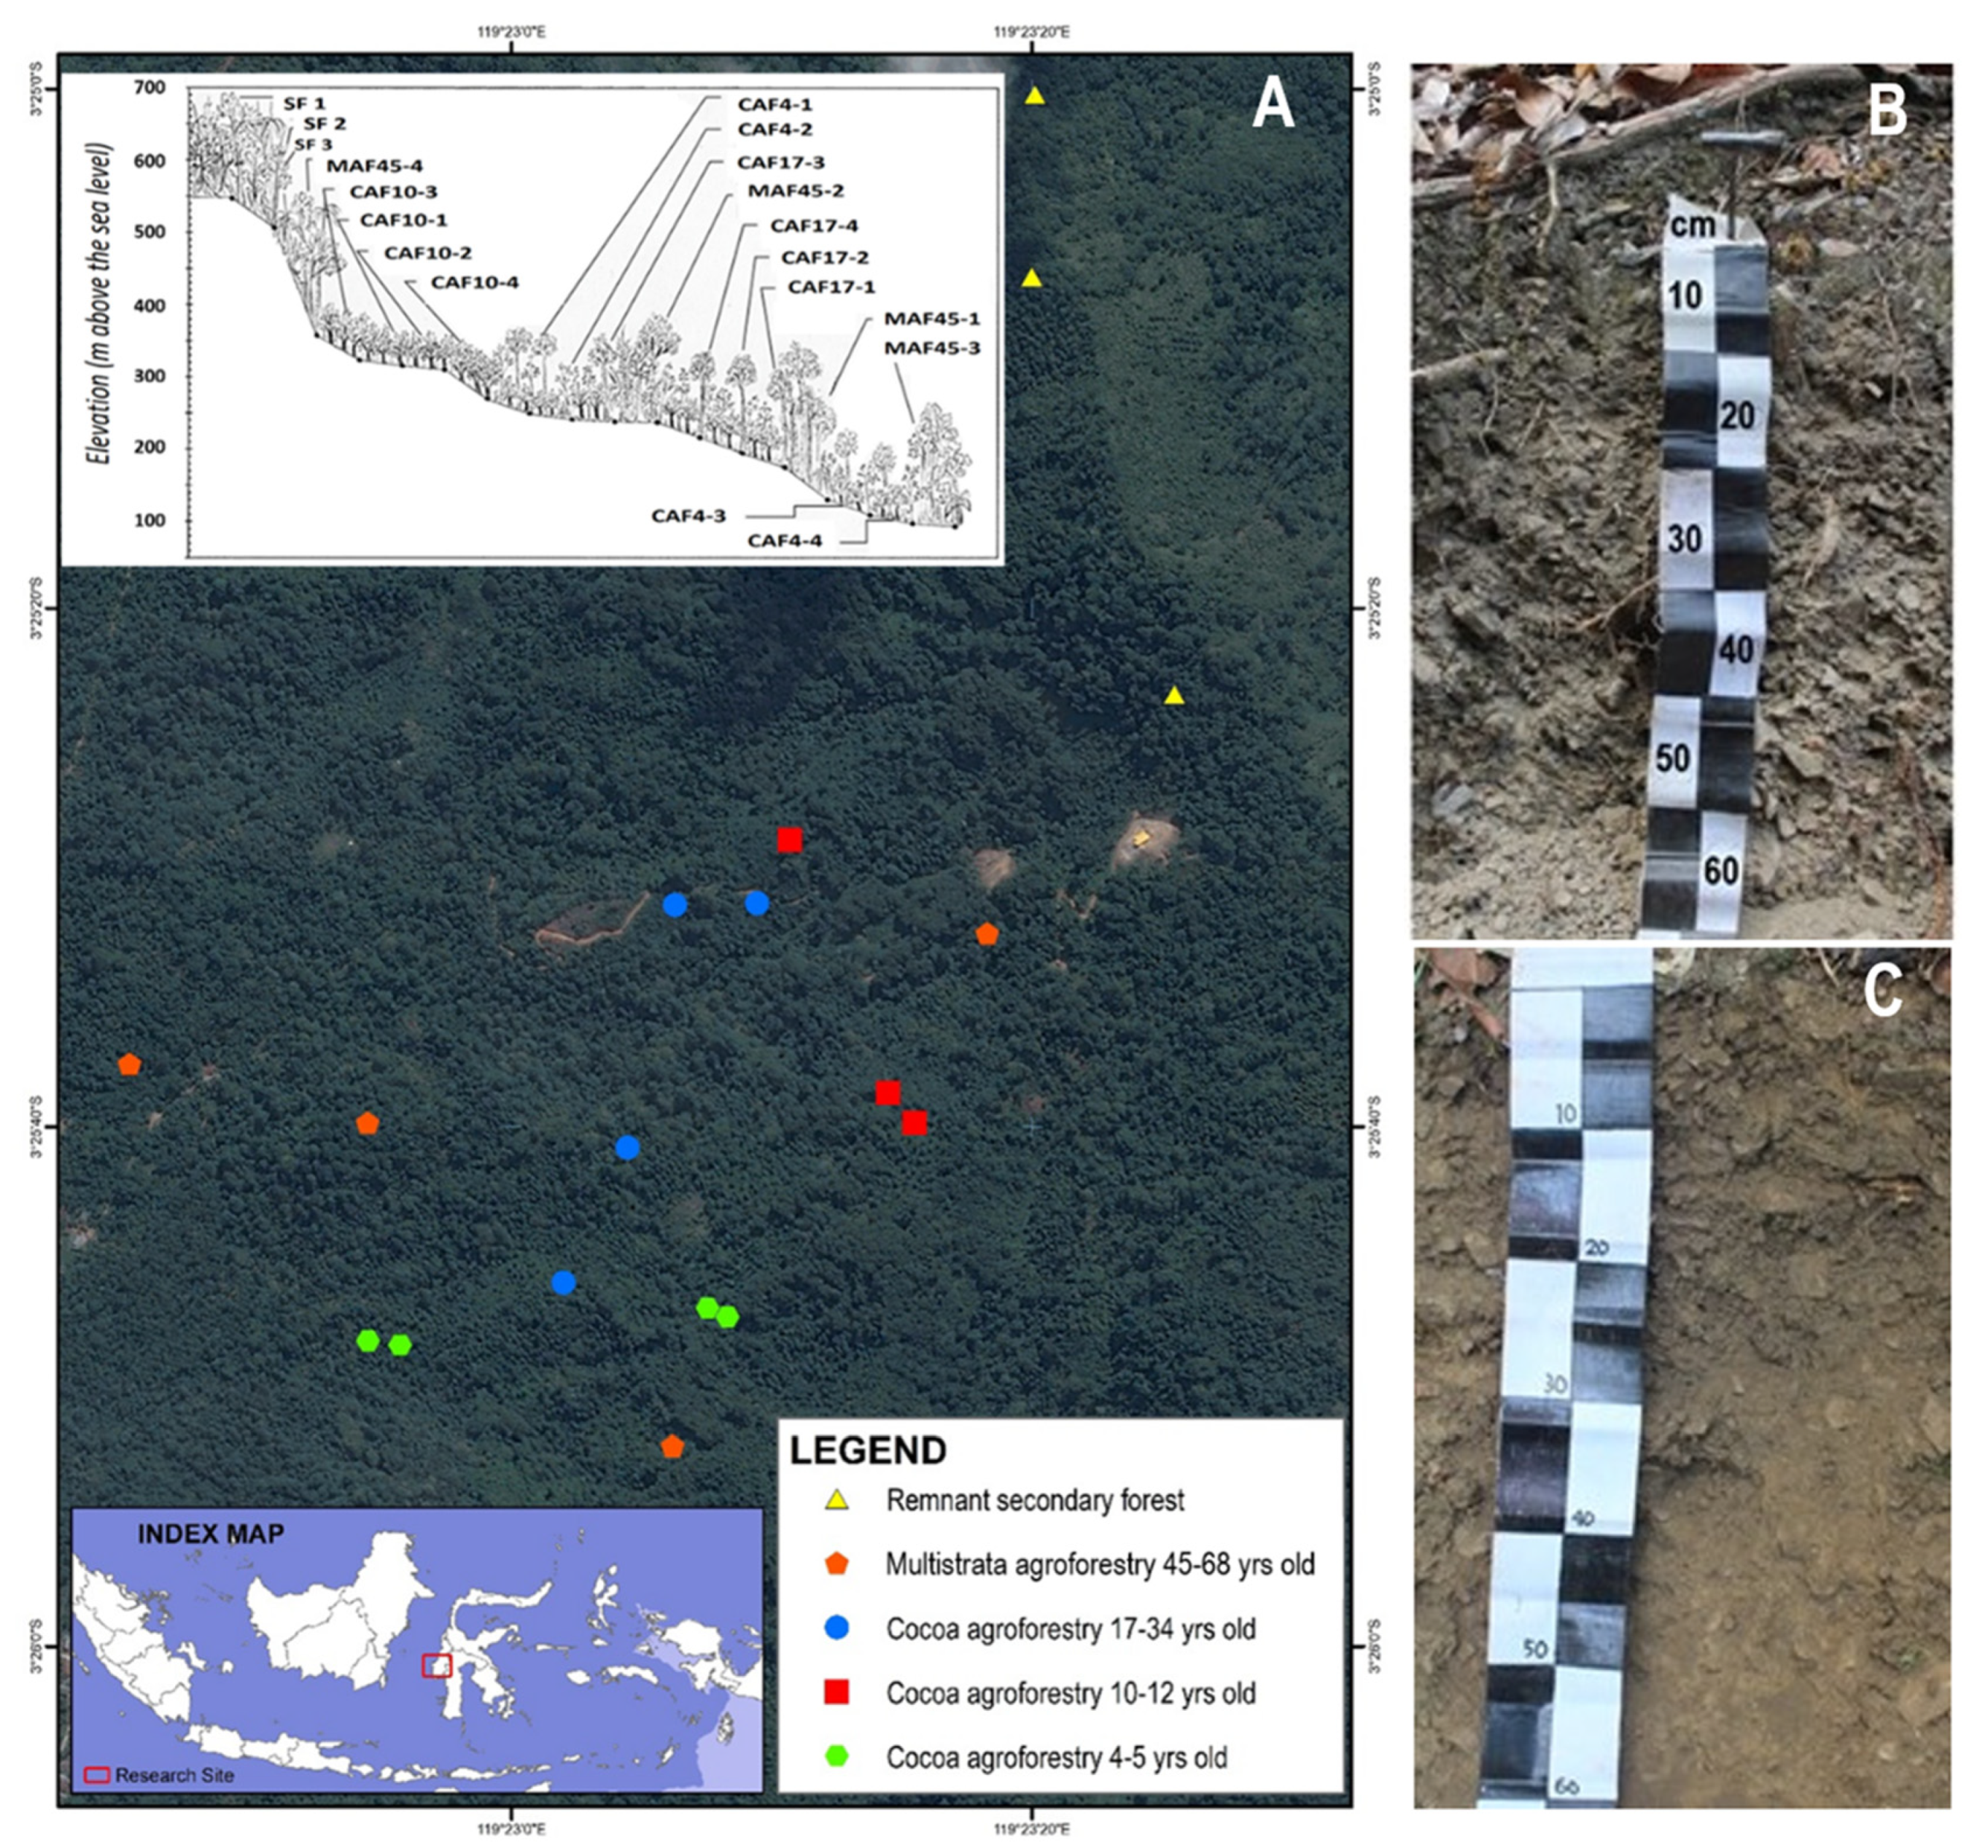
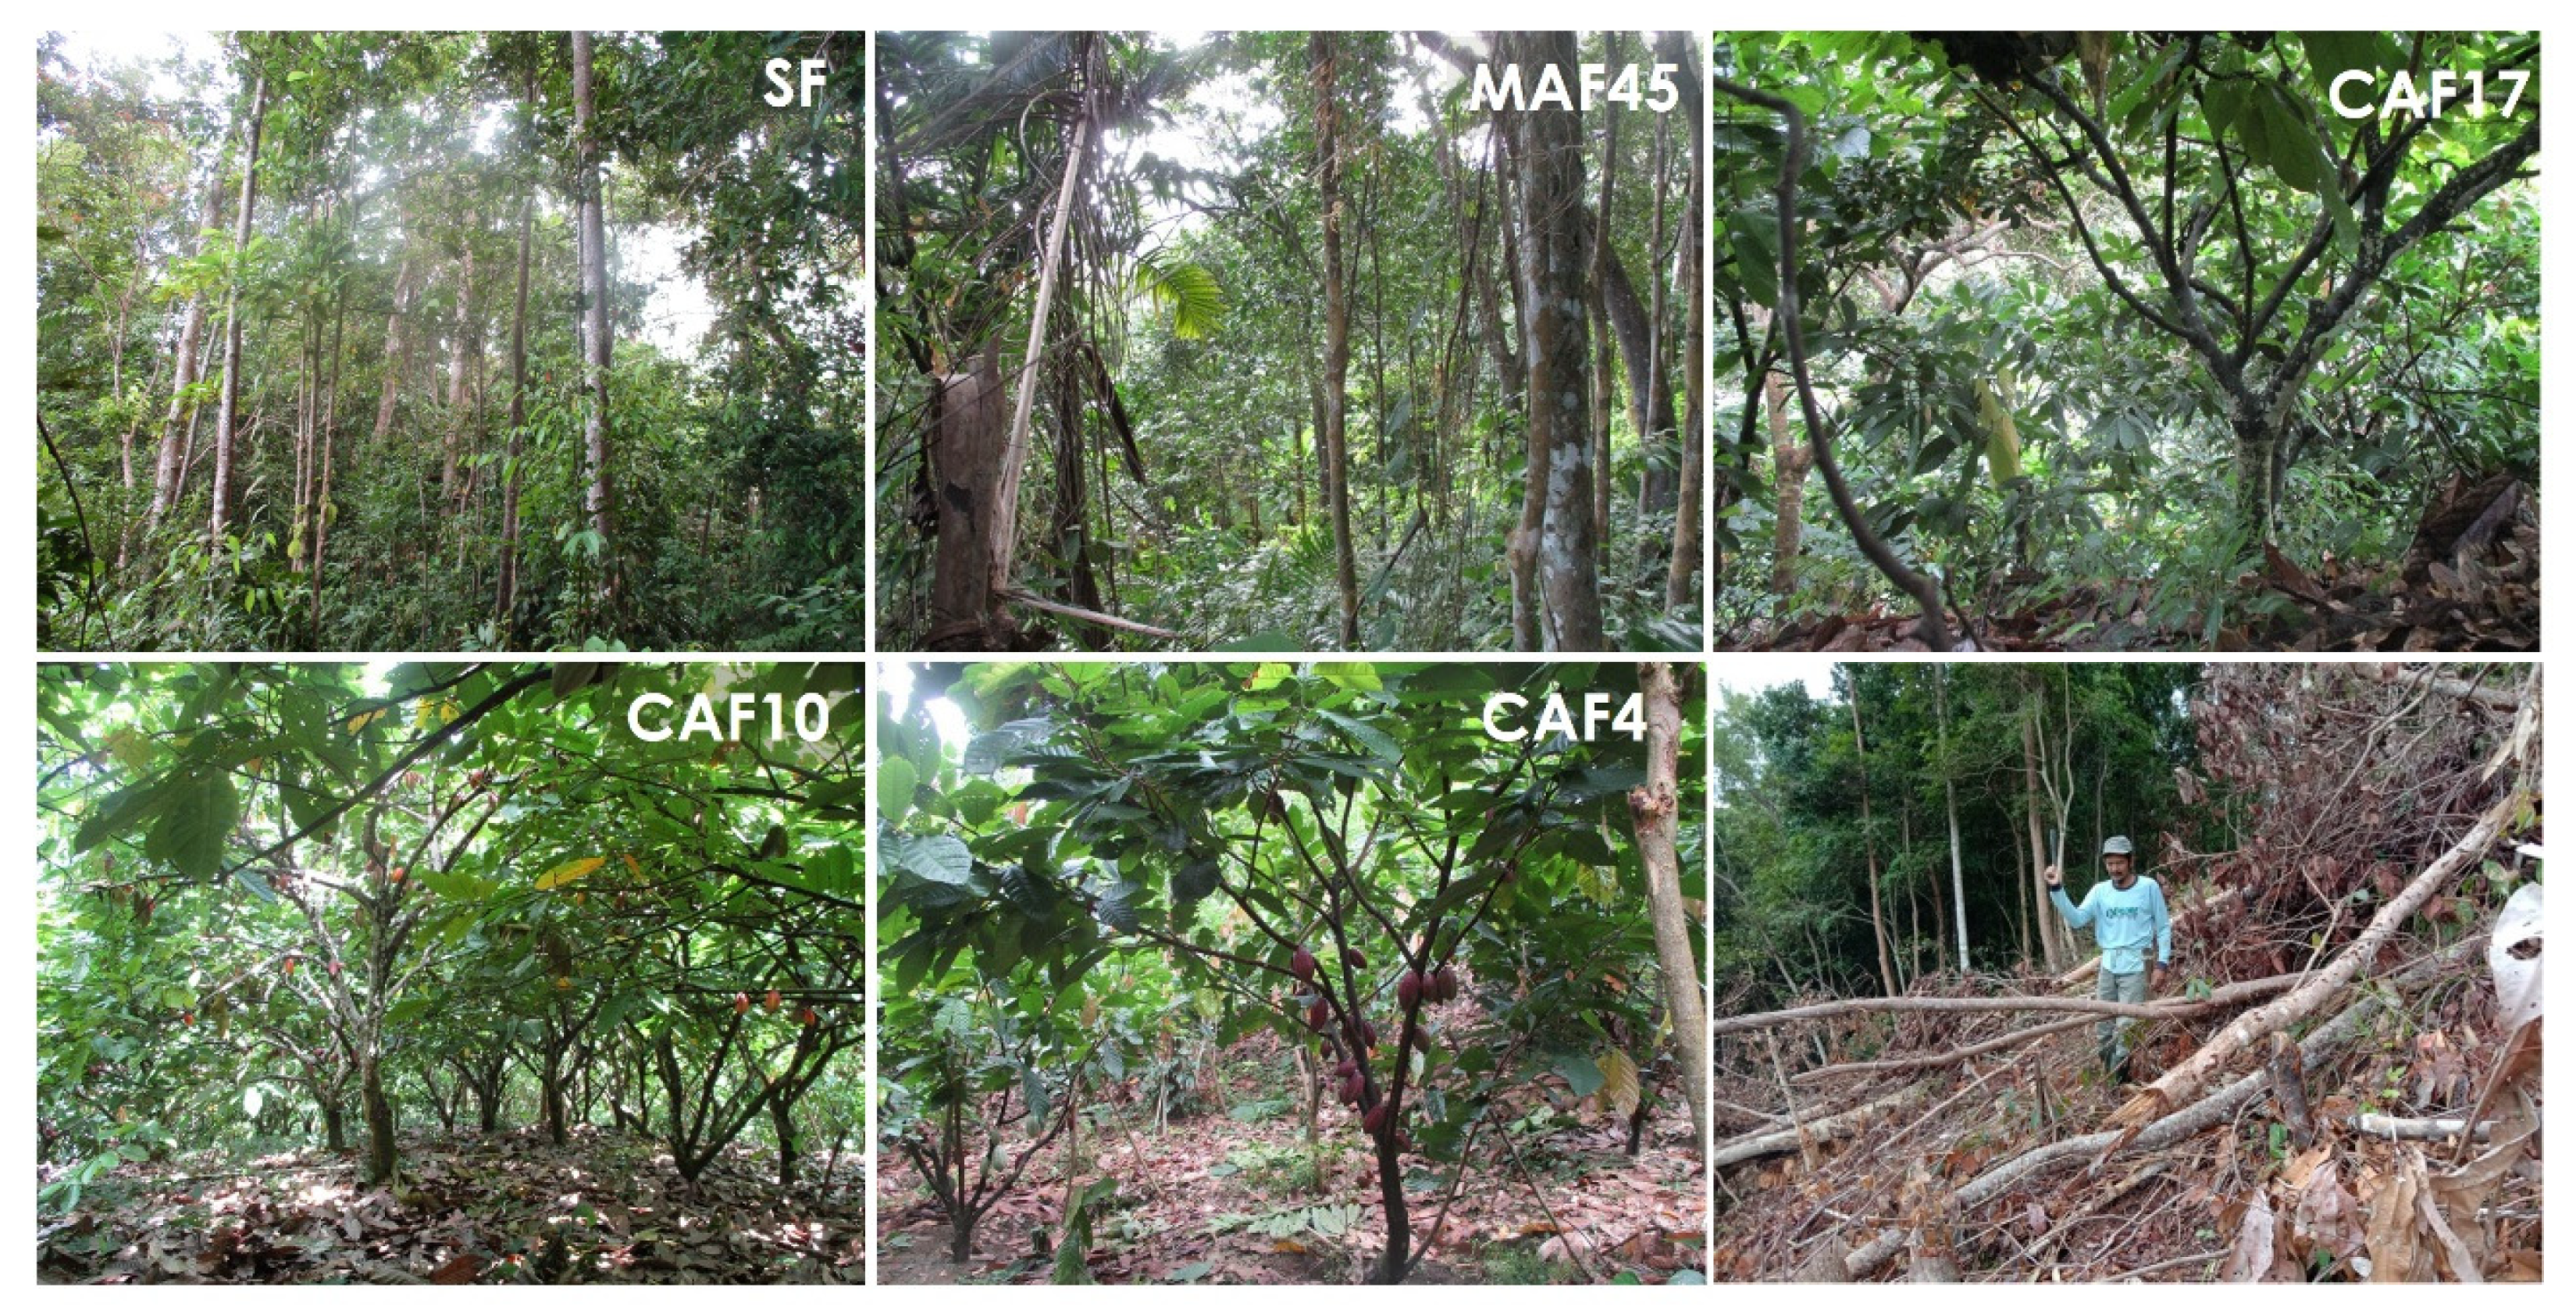
2.1. Sampling Sites
2.2. Land Cover
2.3. C–stock Measurements
2.4. Aboveground and Belowground Biomass
2.5. Soil Properties
3. Results
3.1. Density and Basal Area
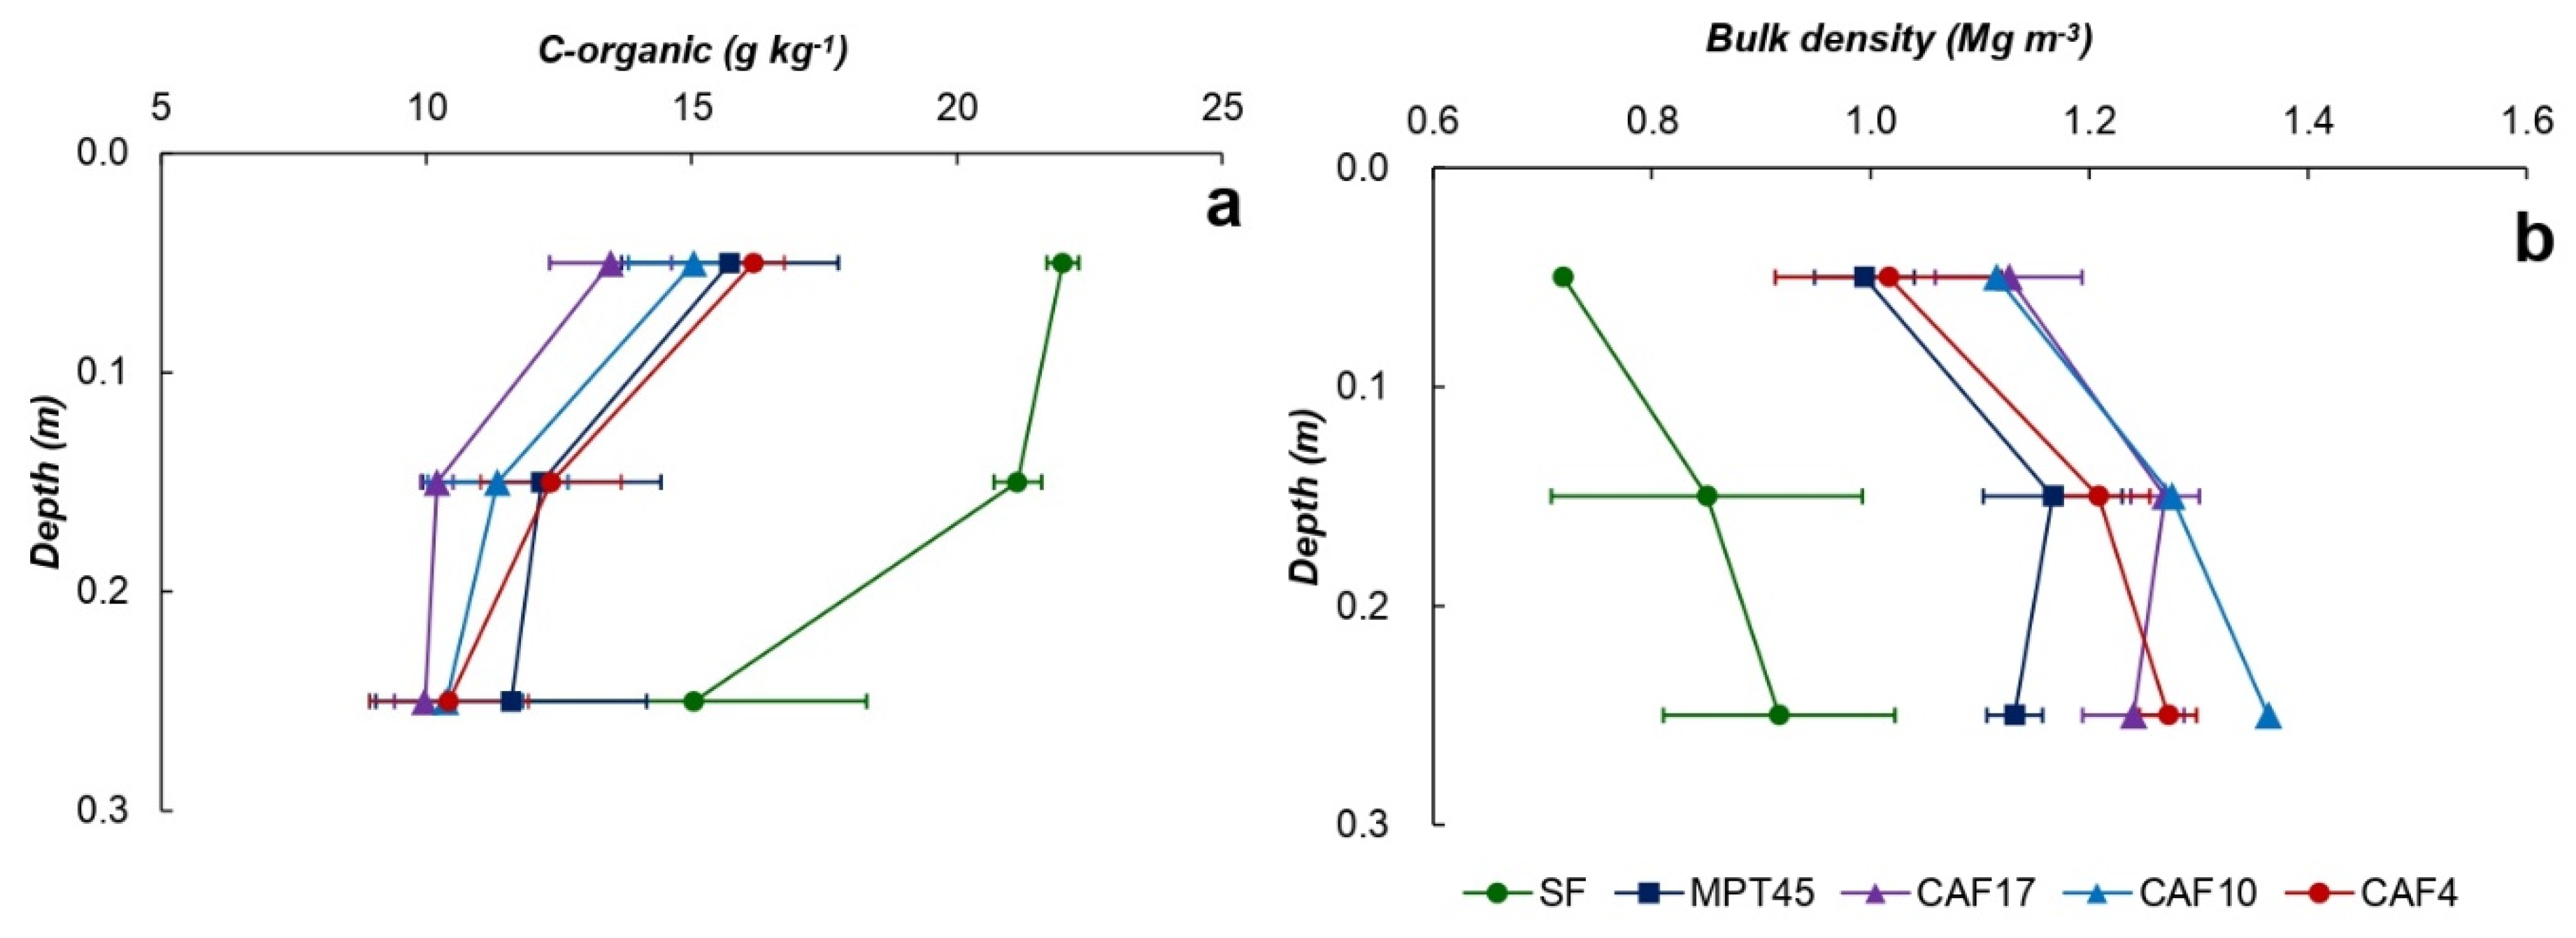
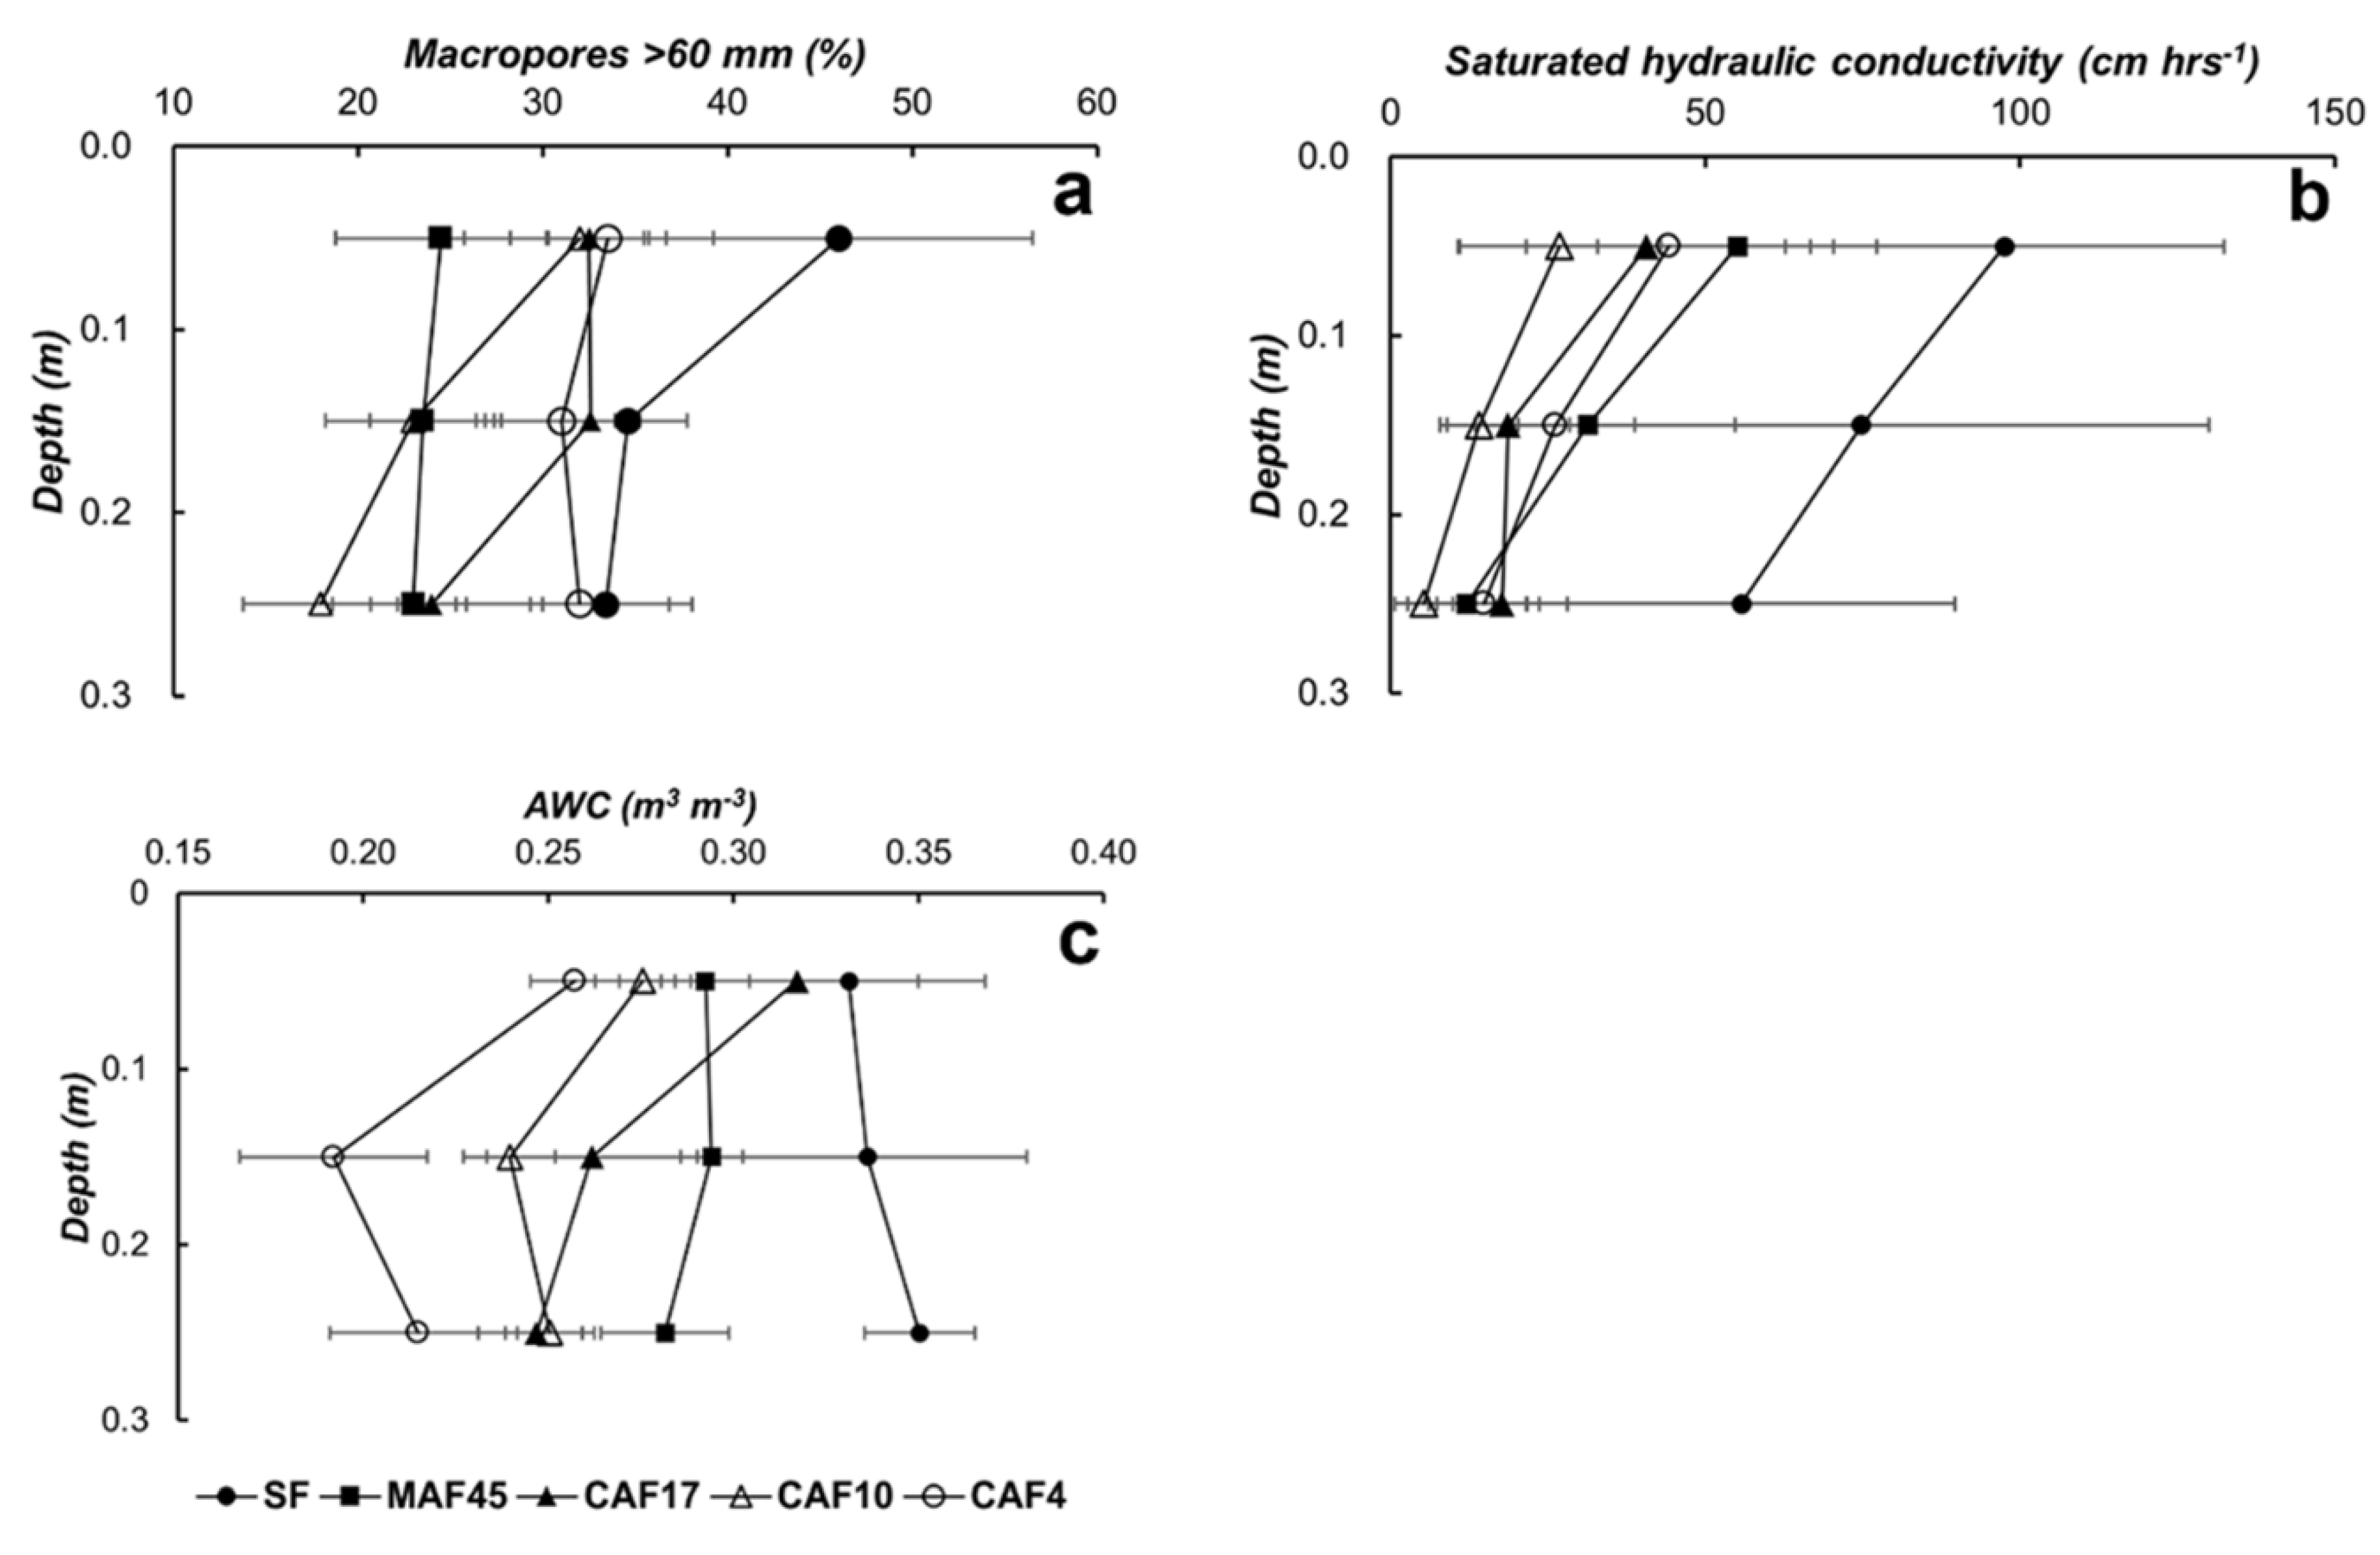
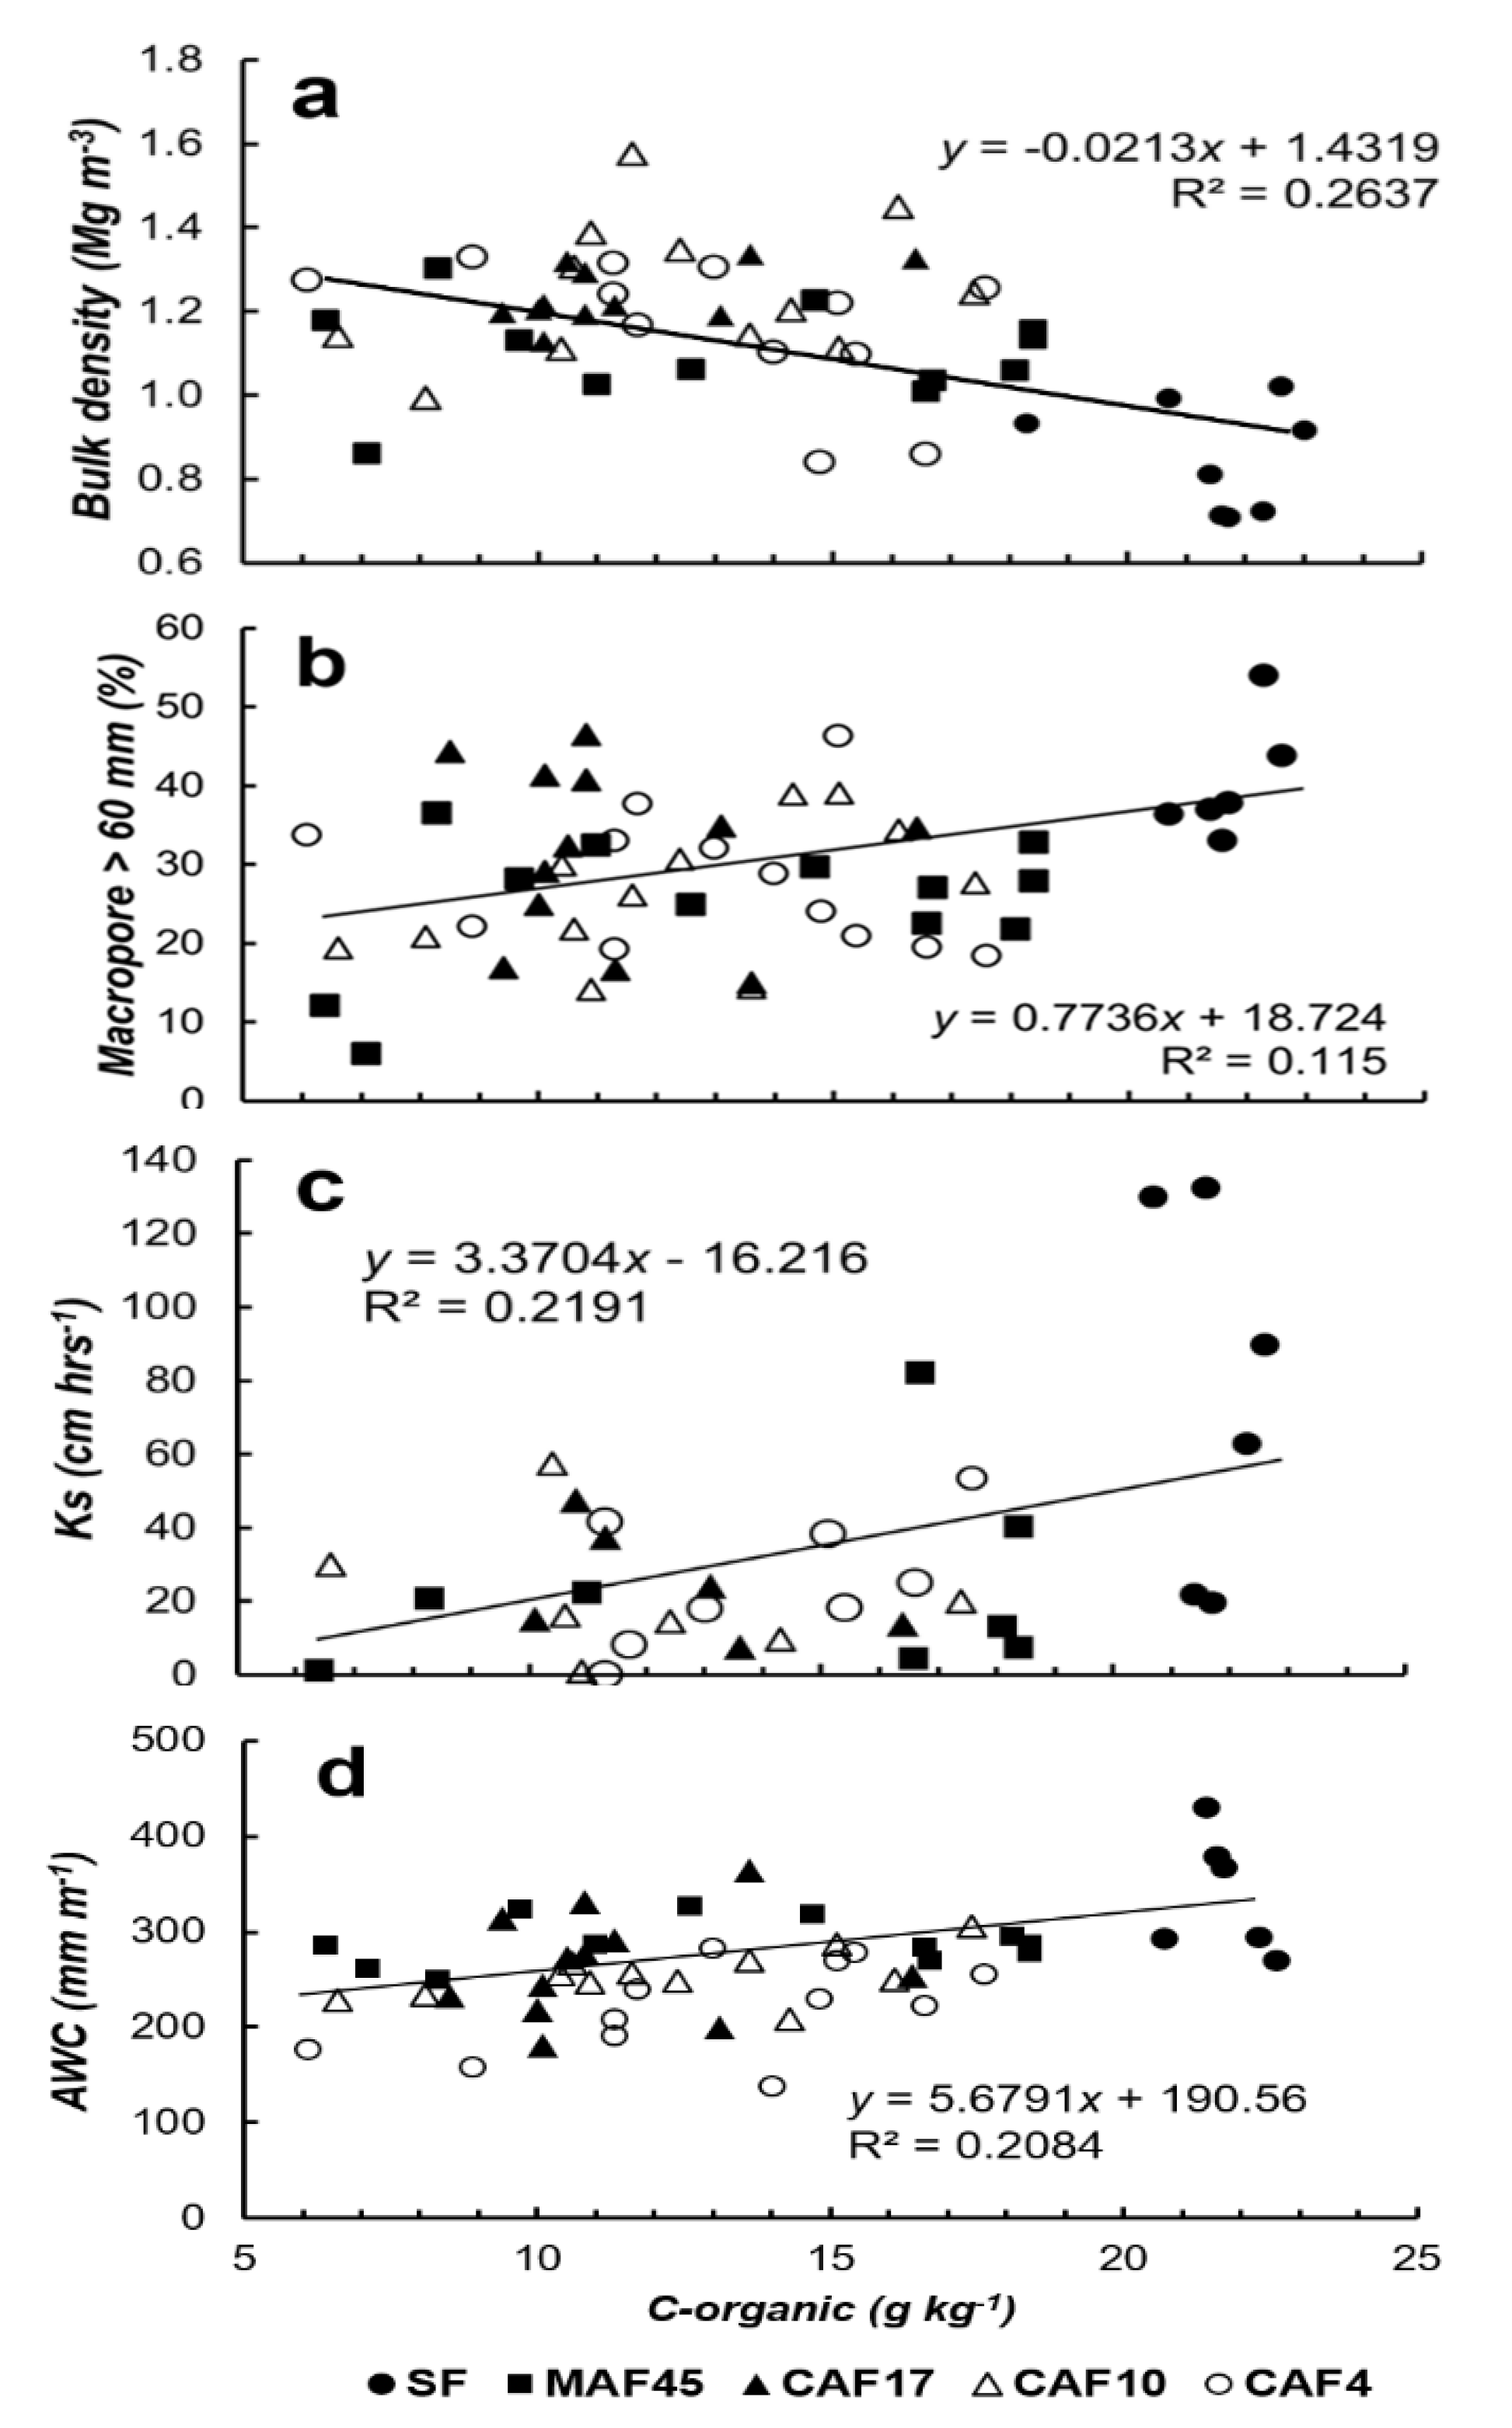
3.2. Soil Properties
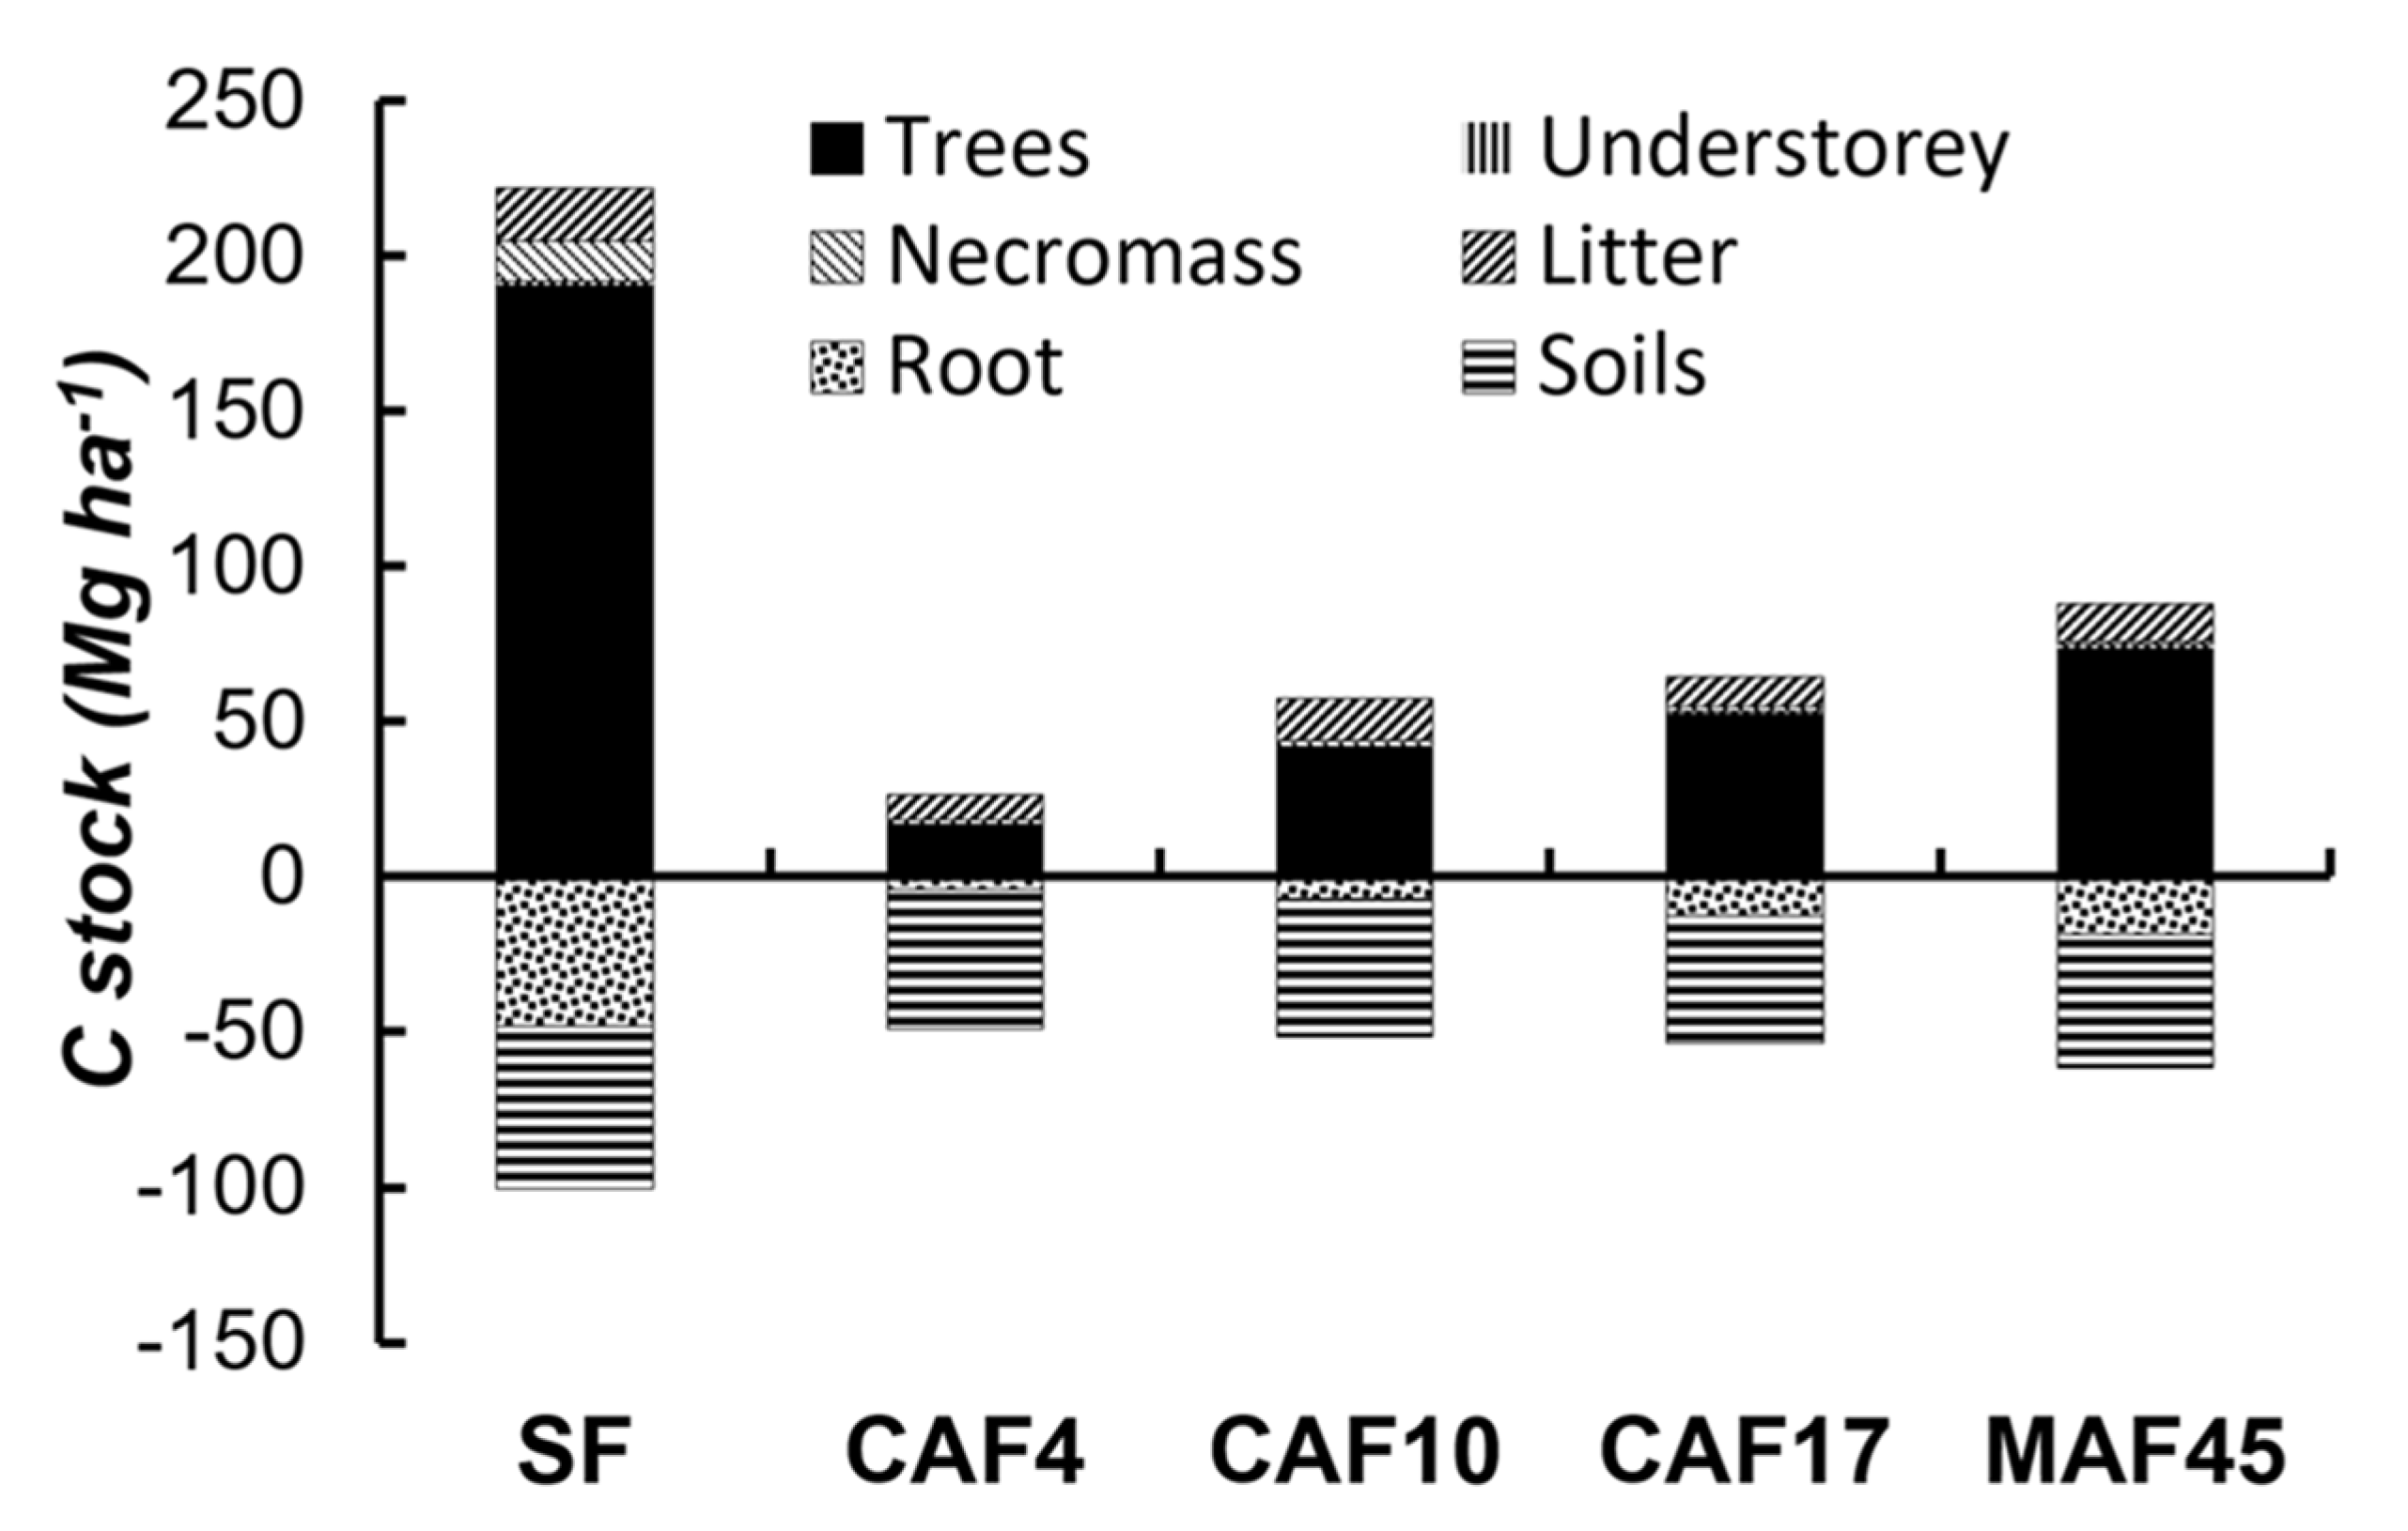
3.3. C–stock
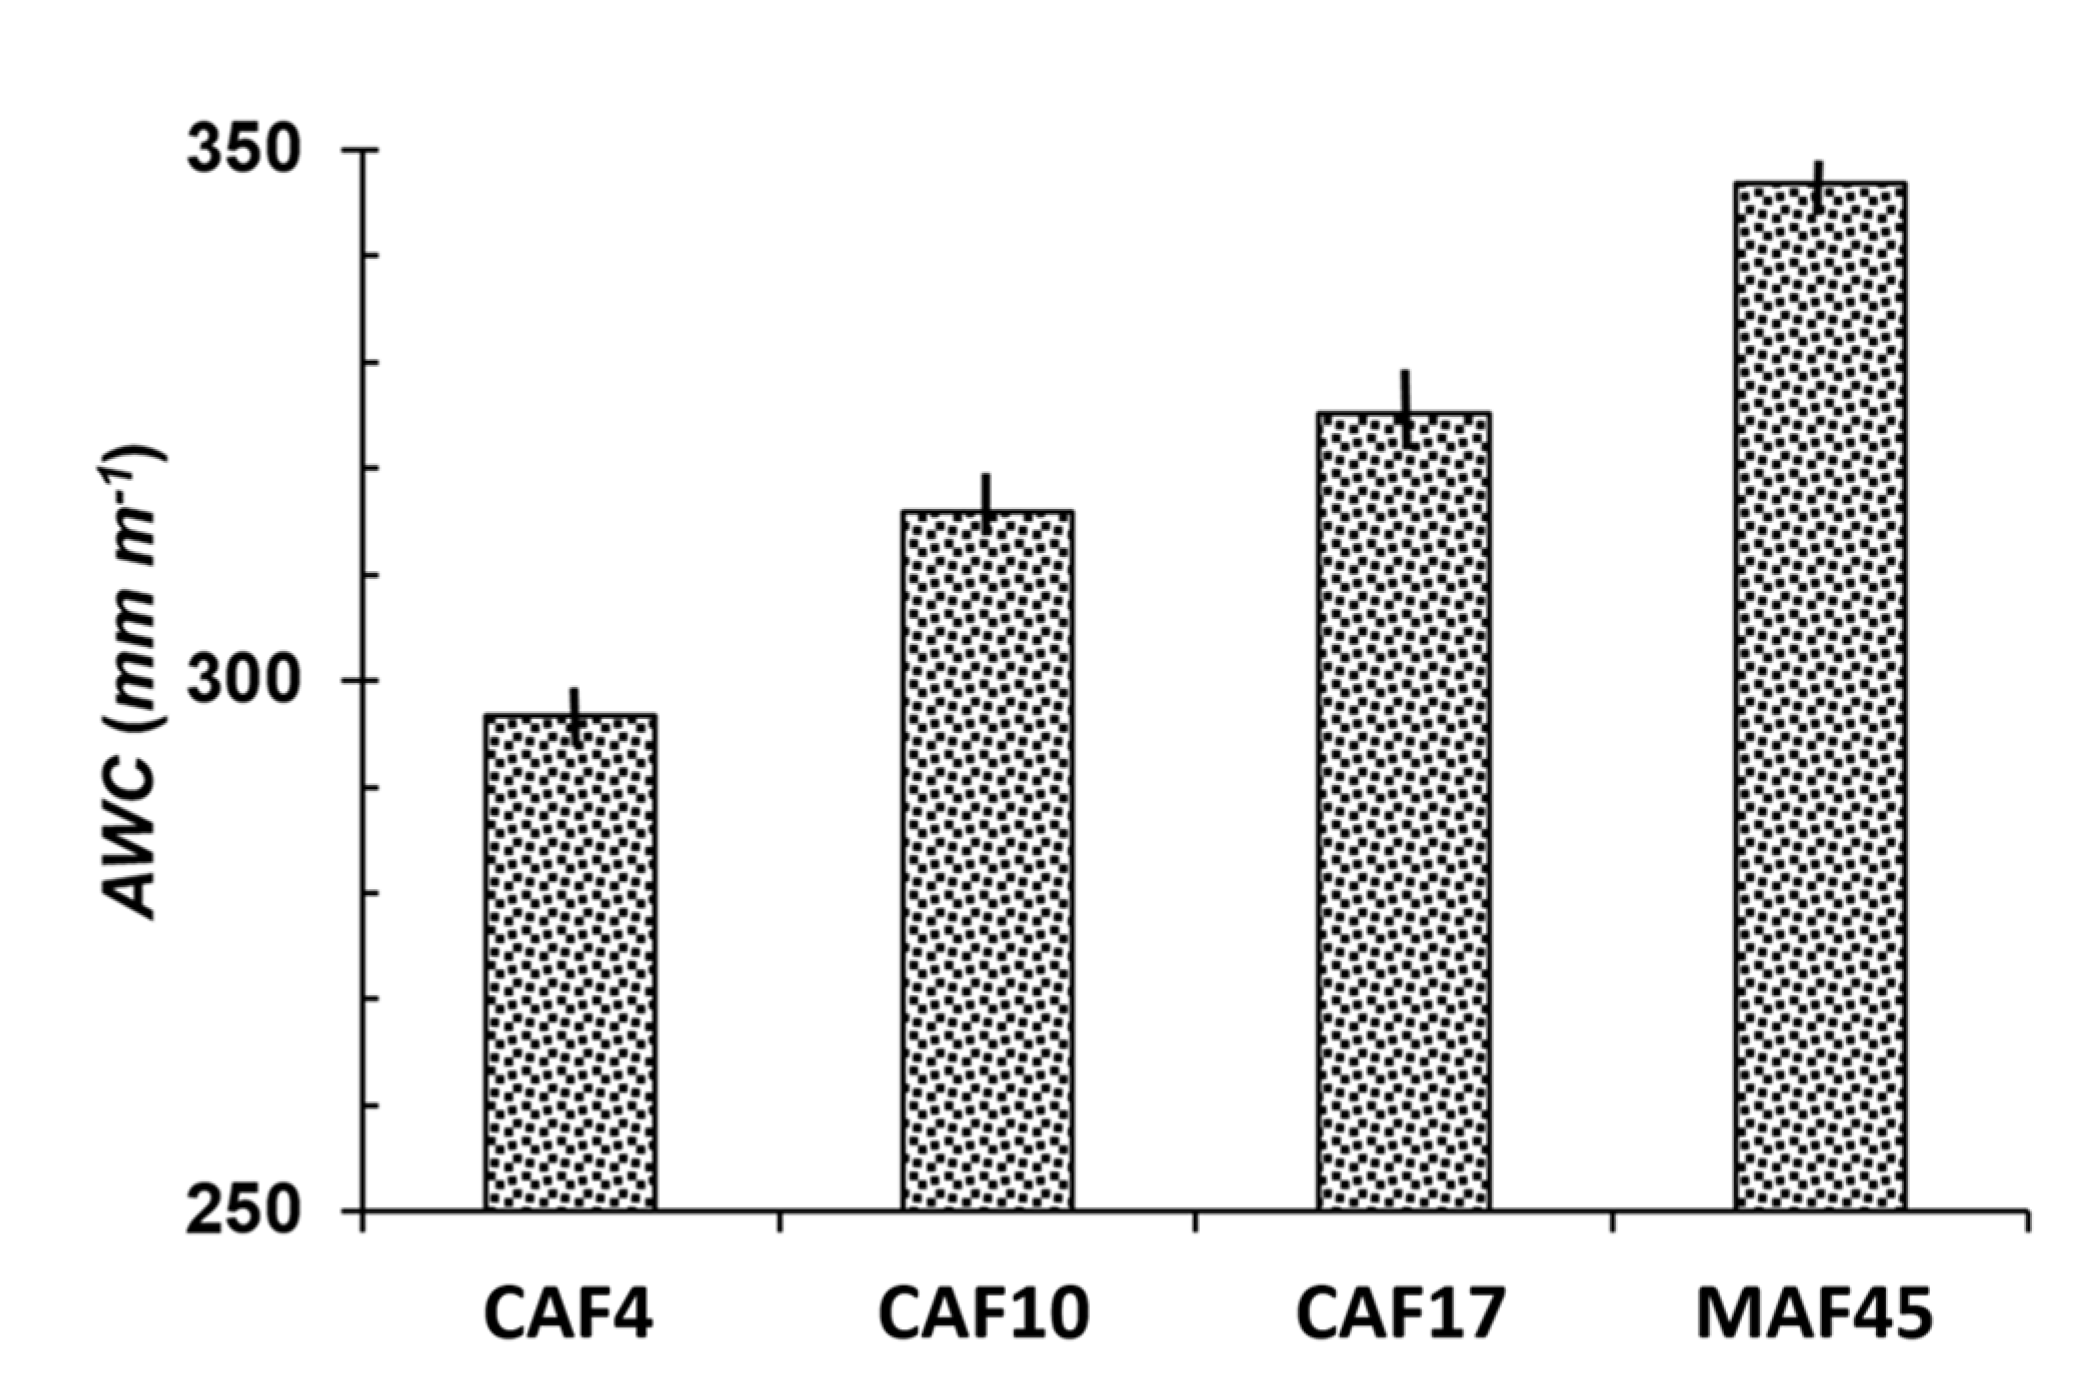
3.4. Available Water Capacity
4. Discussion
5. Conclusions
Author Contributions
Funding
Acknowledgments
Conflicts of Interest
References
- Atangana, A.; Khasa, D.; Chang, S.; Degrande, A. Tropical Agroforestry; Springer Science: London, UK, 2013. [Google Scholar]
- Van Noordwijk, M. Sustainable Development through Trees on Farms: Agroforestry in its Fifth Decade; World Agroforestry (ICRAF): Bogor, Indonesia, 2019. [Google Scholar]
- Tscharntke, T.; Clough, Y.; Bhagwat, S.A.; Buchori, D.; Faust, H.; Hertel, D.; Hölscher, D.; Juhrbandt, J.; Kessler, M.; Perfecto, I.; et al. Multifunctional shade-tree management in tropical agroforestry landscapes—A review. J. Appl. Ecol. 2011, 48, 619–629. [Google Scholar] [CrossRef] [Green Version]
- Duguma, L.A.; Minang, P.A.; Van Noordwijk, M. Climate change mitigation and adaptation in the land use sector: From complementarity to synergy. Environ. Manag. 2014, 54, 420–432. [Google Scholar] [CrossRef] [PubMed] [Green Version]
- Harvey, C.A.; Chac, M.; Donatti, C.I.; Garen, E.; Hannah, L.; Andrade, A.; Bede, L.; Brown, D.; Calle, A.; Char, J. Climate-Smart Landscapes: Opportunities and Challenges for Integrating Adaptation and Mitigation in Tropical Agriculture. Conserv. Lett. 2014, 7, 77–90. [Google Scholar] [CrossRef]
- Rosenstock, T.S.; Wilkes, A.; Jallo, C.; Namoi, N.; Bulusu, M.; Suber, M.; Mboi, D.; Mulia, R.; Simelton, E.; Richards, M.; et al. Making trees count: Measurement and reporting of agroforestry in UNFCCC national communications of non-Annex I countries. Agric. Ecosyst. Environ. 2019, 284, 106569. [Google Scholar] [CrossRef]
- Zomer, R.J.; Neufeldt, H.; Xu, J.; Ahrends, A.; Bossio, D.; Trabucco, A.; Van Noordwijk, M.; Wang, M. Global Tree Cover and Biomass Carbon on Agricultural Land: The contribution of agroforestry to global and national carbon budgets. Sci. Rep. 2016, 6, 29987. [Google Scholar] [CrossRef]
- Van Noordwijk, M.; Bayala, J.; Hairiah, K.; Lusiana, B.; Muthuri, C.; Khasanah, N.; Mulia, R. Agroforestry solutions for buffering climate variability and adapting to change. In Climate Change Impact and Adaptation in Agricultural Systems; CAB-International: Wallingford, UK, 2014; pp. 216–232. [Google Scholar]
- Hairiah, K.; van Noordwijk, M.; Sasi, R.R.; Dwi, D.; Suprayogo, D.; Kurniawan, S.; Prayogo, C.; Gusli, S. Soil carbon stocks in Indonesian (agro) forest transitions: Compaction conceals lower carbon concentrations in standard accounting. Agric. Ecosyst. Environ. 2020, 294, 106879. [Google Scholar] [CrossRef]
- Sanchez, P.A. Properties and Management of Soils in the Tropics; Cambridge University Press: Cambridge, UK, 2019. [Google Scholar] [CrossRef] [Green Version]
- Wang, F.; Li, Z.; Ding, Y.; Sayer, E.J.; Li, Q.; Zou, B.; Mo, Q.; Li, Y.; Lu, X.; Tang, J.; et al. Tropical forest restoration: Fast resilience of plant biomass contrasts with slow recovery of stable soil C stocks. Funct. Ecol. 2017, 31, 2344–2355. [Google Scholar] [CrossRef] [Green Version]
- Dollinger, J.; Jose, S. Agroforestry for soil health. Agrofor. Syst. 2018, 92, 213–219. [Google Scholar] [CrossRef] [Green Version]
- Van Noordwijk, M.; Cerri, C.; Woomer, P.L.; Nugroho, K.; Bernoux, M. Soil carbon dynamics in the humid tropical forest zone. Geoderma 1997, 79, 187–225. [Google Scholar] [CrossRef]
- Lusiana, B.; Kuyah, S.; Öborn, I.; van Noordwijk, M. Typology and metrics of ecosystem services and functions as the basis for payments, rewards and co-investment. In Co-Investment in Ecosystem Services: Global Lessons from Payment and Incentive Schemes; Namirembe, S., Leimona, B., van Noordwijk, M., Minang, P., Eds.; World Agroforestry Centre (ICRAF): Nairobi, Kenya, 2017. [Google Scholar]
- Van Noordwijk, M.; Martikainen, P.; Bottner, P.; Cuevas, E.; Rouland, C.; Dhillion, S.S. Global change and root function. Glob. Chang. Biol. 1998, 4, 759–772. [Google Scholar] [CrossRef]
- Van Noordwijk, M.; Bizard, V.; Wangpakapattanawong, P.; Tata, H.L.; Villamor, G.B.; Leimona, B. Tree cover transitions and food security in Southeast Asia. Glob. Food Secur. 2014, 3, 200–208. [Google Scholar] [CrossRef] [Green Version]
- Van Noordwijk, M.; Hoang, M.H.; Neufeldt, H.; Oborn, I.; Yatich, T. How Trees and People Can Co-Adapt to Climate Change: Reducing Vulnerability through Multifunctional Agroforestry Landscapes; World Agroforestry Centre (ICRAF): Nairobi, Kenya, 2011. [Google Scholar]
- Dewi, S.; Van Noordwijk, M.; Zulkarnain, M.T.; Dwiputra, A.; Hyman, G.; Prabhu, R.; Gitz, V.; Nasi, R. Tropical forest-transition landscapes: A portfolio for studying people, tree crops and agro-ecological change in context. Int. J. Biodivers. Sci. Ecosyst. Serv. Manag. 2017, 13, 312–329. [Google Scholar] [CrossRef]
- Abdulai, I.; Vaast, P.; Hoffmann, M.P.; Asare, R.; Jassogne, L.; van Asten, P.; Rötter, R.P.; Graefe, S. Cocoa agroforestry is less resilient to sub-optimal and extreme climate than cocoa in full sun: Reply to Norgrove (2017). Glob. Chang. Biol. 2018, 24, e733–e740. [Google Scholar] [CrossRef] [PubMed] [Green Version]
- Cerda, R.; Deheuvels, O.; Calvache, D. Contribution of cocoa agroforestry systems to family income and domestic consumption: Looking toward intensification. Agrofor. Syst. 2014, 88, 957–981. [Google Scholar] [CrossRef]
- Somarriba, E.; Beer, J. Productivity of Theobroma cacao agroforestry systems with timber or legume service shade trees. Agrofor. Syst. 2011, 81, 109–121. [Google Scholar] [CrossRef]
- Vaast, P.; Somarriba, E. Trade-offs between crop intensification and ecosystem services: The role of agroforestry in cocoa cultivation. Agrofor. Syst. 2014, 88, 947–956. [Google Scholar] [CrossRef] [Green Version]
- World Atlas. Top 10 Cocoa Producing Countries—WorldAtlas [WWW Document]. Available online: https://www.worldatlas.com/articles/top-10-cocoa-producing-countries (accessed on 13 August 2019).
- Tromba, A. What Stats Reveal about the Top 10 Cocoa Producing Countries [WWW Document]. ICCO. 2019. Available online: https://foodensity.com/cocoa-producing-countries/ (accessed on 13 August 2019).
- Kroeger, A.; Koenig, S.; Thomson, A.; Streck, C. Forest- and Climate-Smart Cocoa in Côte d’Ivoire and Ghana, Aligning Stakeholders to Support Smallholders in Deforestation-Free Cocoa; World Bank: Washington, DC, USA, 2017. [Google Scholar]
- PDSIP. Outlook Kakao—Komoditas Pertanian Subsektor Perkebunan; Kementerian Pertanian: Jakarta, Indonesia, 2016. [Google Scholar]
- Ruf, F. The Sulawesi case: Deforestation, pre-cocoa and cocoa migrations. In Beyond tropical Deforestation: From Tropical Deforestation to Forest Cover Dynamics and Forest Development; Babin, D., Ed.; CIRAD: Montpellier, France, 2004; pp. 277–298. [Google Scholar]
- Hartmann, M.; Niklaus, P.A.; Zimmermann, S.; Schmutz, S.; Kremer, J.; Abarenkov, K.; Lu, P. Resistance and resilience of the forest soil microbiome to logging-associated compaction. ISME J. 2013, 8, 226–244. [Google Scholar] [CrossRef]
- Udawatta, R.P.; Rankoth, L.M.; Jose, S. Agroforestry and Biodiversity. Sustainability 2019, 11, 2879. [Google Scholar] [CrossRef] [Green Version]
- Gijsman, A.J. Deforestation and Land Use: Changes in Physical and Biological Soil Properties in Relation to Sustainability; Agricultural University Wageningen, Department of Soil Science and Geology: Wageningen, The Netherlands, 1992. [Google Scholar]
- Wang, Q.; Wang, S.; Yu, X. Decline of soil fertility during forest conversion of secondary forest to chinese fir plantations in subtropical China. Land Degrad. Dev. 2011, 22, 444–452. [Google Scholar] [CrossRef]
- Mortimer, R.; Saj, S.; David, C. Supporting and regulating ecosystem services in cacao agroforestry systems. Agrofor. Syst. 2018, 6, 1639–1657. [Google Scholar] [CrossRef]
- Rousseau, G.X.; Deheuvels, O.; Arias, I.R.; Somarriba, E. Indicating soil quality in cacao-based agroforestry systems and old-growth forests: The potential of soil macrofauna assemblage. Ecol. Indic. 2012, 23, 535–543. [Google Scholar] [CrossRef]
- Fearnside, P.M. Global Warming and Tropical Land-Use Change: Greenhouse Gas Emission from Biomass Burning, Decomposition and Soils in Forest Conversion, Shifting Cultivation and Secondary Vegetation. Clim. Chang. 2000, 46, 115–158. [Google Scholar] [CrossRef]
- Van Noordwijk, M.; Rahayu, S.; Hairiah, K.; Wulan, Y.C.; Farida, A.; Verbist, B. Carbon stock assessment for a forest-to-coffee conversion landscape in Sumber-Jaya (Lampung, Indonesia): From allometric equations to land use change analysis. Sci. China Ser. C 2002, 45, 75–86. [Google Scholar]
- Schneider, B.M.; Andres, C.; Trujillo, G.; Alcon, F.; Amurrio, P.; Perez, E.; Weibel, F.; Milz, J. Cocoa and total system yields of organic and conventional agroforestry vs. monoculture systems in a long-term field trial in Bolivia. Expl. Agric. 2016, 53, 1–24. [Google Scholar] [CrossRef] [Green Version]
- Guest, D.; Keane, P. Vascular-Streak Dieback: A New Encounter Disease of Cacao in Papua New Guinea and Southeast Asia Caused by the Obligate Basidiomycete Oncobasidium theobromae. Phytopathology 2007, 97, 1654–1657. [Google Scholar] [CrossRef] [Green Version]
- Sari, R.R.; Saputra, D.D.; Hairiah, K.; Rozendaal, D.M.A.; Roshetko, J.; van Noordwijk, M. Gendered species preferences link tree diversity and carbon stocks in cacao agroforest in Southeast Sulawesi, Indonesia. Land 2020, 9, 108. [Google Scholar] [CrossRef] [Green Version]
- Hairiah, K.; Dewi, S.; Agus, F.; Velarde, S.; Ekadinata, A.; Rahayu, S.; van Noordwijk, M. Measuring Carbon Stocks: Across Land Use Systems: A Manual; World Agroforestry Centre (ICRAF): Bogor, Indonesia, 2011. [Google Scholar]
- Chave, J.; Andalo, C.; Brown, S.; Cairns, M.A.; Chambers, J.Q.; Eamus, D.; Fölster, H.; Fromard, F.; Higuchi, N.; Kira, T.; et al. Tree allometry and improved estimation of carbon stocks and balance in tropical forests. Oecologia 2005, 145, 87–99. [Google Scholar] [CrossRef]
- Yuliasmara, F.; Wibawa, A.; Prawoto, A. Carbon stock in different ages and plantation systemof cocoa: Allometric approach. Pelita Perkeb. Coffee Cocoa Res. J. 2009, 25, 132. [Google Scholar] [CrossRef]
- Arifin, J. Estimasi Penyimpanan C Pada Berbagai Sistem Penggunaan Lahan di Kecamatan Ngantang; Universitas Brawijaya: Malang, Indonesia, 2001. [Google Scholar]
- Brown, S. Estimating Biomass and Biomass Change of Tropical Forests: A Primer; Food and Agriclture Organization: Rome, Italy, 1997. [Google Scholar]
- Mokany, K.; Raison, R.J.; Prokushkin, A.S. Critical analysis of root: Shoot ratios in terrestrial biomes. Glob. Chang. Biol. 2006, 12, 84–96. [Google Scholar] [CrossRef]
- Norgrove, L.; Hauser, S. Carbon stocks in shaded Theobroma cacao farms and adjacent secondary forests of similar age in Cameroon. Trop. Ecol. 2013, 54, 15–23. [Google Scholar]
- Naelson, D.W.; Sommers, L.E. Carbon and Organic Matter. In Methods of Soil Analysis, Part 3, Chemical Methods; Page, A.L., Baker, D.E., Keeney, D.R., Eds.; American Society of Agronomy: Madison, WI, USA, 1996; pp. 1004–1005. [Google Scholar]
- Blake, G.R.; Hartge, K.H. Bulk density. In Methods of Soil Analysis: Part 1—Physical and Mineralogical Methods; Klute, A., Ed.; Soil Science Society of America, American Society of Agronomy: Madison, WI, USA, 1986; pp. 363–375. [Google Scholar]
- Gee, G.W.; Or, D. 2.4 Particle-size analysis. In Methods of Soil Analysis: Part 4 Physical Methods; Klute, A., Ed.; Soil Science Society of America, American Society of Agronomy: Madison, WI, USA, 2002; pp. 255–293. [Google Scholar]
- Klute, A.; Dirksen, C. Hydraulic conductivity and diffusivity: Laboratory methods. In Methods of Soil Analysis: Part 1—Physical and Mineralogical Methods; Klute, A., Ed.; Soil Science Society of America, American Society of Agronomy: Madison, WI, USA, 1986; pp. 687–734. [Google Scholar]
- Klute, A. Water retention: Laboratory methods. In Methods of Soil Analysis: Part 1—Physical and Mineralogical Methods; Klute, A., Ed.; Soil Science Society of America, American Society of Agronomy: Madison, WI, USA, 1986; pp. 635–662. [Google Scholar]
- McIntyre, D.S. Sample preparation. In Methods for Analysis of Irrigated Soils; Loveday, J., Ed.; Commonwealth Agricultural Bureaux, Famham Royal: Bucks, UK, 1974; pp. 21–37. [Google Scholar]
- Weil, R.; Brady, N. The Nature and Properties of Soils, 15th ed.; Prentice Hall: Upper Saddle River, NJ, USA, 2017. [Google Scholar]
- Marshall, T.J.; Holmes, J.W. Soil Physics, 2nd ed.; Cambridge University Press: Cambridge, UK, 1988. [Google Scholar]
- Cassel, D.K.; Nielsen, D.R. Field capacity and available water capacity. In Methods of Soil Analysis: Part 1—Physical and Mineralogical Methods; Klute, A., Ed.; Soil Science Society of America, American Society of Agronomy: Madison, WI, USA, 1986; pp. 901–926. [Google Scholar]
- Ghaley, B.B.; Wösten, H.; Olesen, J.E.; Schelde, K.; Baby, S.; Karki, Y.K.; Børgesen, C.D.; Smith, P.; Yeluripati, J.; Ferrise, R.; et al. Simulation of Soil Organic Carbon Effects on Long-Term Winter Wheat (Triticum aestivum) Production Under Varying Fertilizer Inputs. Front. Plant Sci. 2018, 9, 1158. [Google Scholar] [CrossRef] [Green Version]
- Van Noordwijk, M.; Gitz, V.; Minang, P.A.; Dewi, S.; Leimona, B.; Duguma, L.; Pingault, N.; Meybeck, A. People-Centric Nature-Based Land Restoration through Agroforestry: A Typology. Land 2020, 9, 251. [Google Scholar] [CrossRef]
- Minasny, B.; Malone, B.P.; McBratney, A.B.; Angers, D.A.; Arrouays, D.; Chambers, A.; Chaplot, V.; Chen, Z.S.; Cheng, K.; Das, B.S.; et al. Soil carbon 4 per mille. Geoderma 2017, 292, 59–86. [Google Scholar] [CrossRef]
- Juarez, R.I.N.; Hodnett, M.G.; Fu, R.; Goulden, M.L.; Randow, C. Control of Dry Season Evapotranspiration over the Amazonian Forest as Inferred from Observations at a Southern Amazon Forest Site. J. Clim. 2007, 20, 2827–2838. [Google Scholar] [CrossRef] [Green Version]
- Olchev, A.; Ibrom, A.; Erasmi, S. Effects of land-use changes on evapotranspiration of tropical rain forest margin area in Central Sulawesi (Indonesia): Modelling study with a regional SVAT model. Ecol. Model. 2008, 212, 131–137. [Google Scholar] [CrossRef]
- BPS Polman. Kabupaten Polewali Mandar dalam Angka (Polewali Mandar Regency in Figures; PEMDA Polman: Polewali, Indonesia, 2017. [Google Scholar]
- Niether, W.; Schneidewind, U.; Armengot, L.; Adamtey, N.; Schneider, M.; Gerold, G. Spatial-temporal soil moisture dynamics under different cocoa production systems. Catena 2017, 158, 340–349. [Google Scholar] [CrossRef]
- Jackson, N.A.; Wallace, J.S. Soil evaporation measurements in an agroforestry system in Kenya. Agric. For. Meteorol. 1999, 94, 203–215. [Google Scholar] [CrossRef]
- Lin, B.B. Agroforestry management as an adaptive strategy against potential microclimate extremes in coffee agriculture. Agric. For. Meteorol. 2007, 144, 85–94. [Google Scholar] [CrossRef]
- Abdulai, I.; Jassogne, L.; Graefe, S.; Asare, R.; Asten, P.; Van Vaast, P.; La, P. Characterization of cocoa production, income diversification and shade tree management along a climate gradient in Ghana. PLoS ONE 2018, 13, e0195777. [Google Scholar] [CrossRef] [PubMed]
- Bayala, J.; Heng, L.K.; van Noordwijk, M.; Ouedraogo, S.J. Hydraulic redistribution study in two native tree species of agroforestry parklands of West African dry savanna. Acta Oecol. 2008, 34, 370–378. [Google Scholar] [CrossRef]
- Van Noordwijk, M.; Lawson, G.; Hairiah, K.; Wilson, J. Root distribution of trees and crops: Competition and/or complementarity. In Tree-Crop Interactions: Agroforestry in a Changing Climate; Ong, C.K., Black, C.R., Wilson, J., Eds.; CAB International: Wallingford, UK, 2015; pp. 221–257. [Google Scholar] [CrossRef] [Green Version]
- Hairiah, K.; Widianto, W.; Suprayogo, D.; van Noordwijk, M. Tree Roots Anchoring and Binding Soil: Reducing Landslide Risk in Indonesian Agroforestry. Land 2020, 9, 256. [Google Scholar] [CrossRef]
- Wartenberg, A.C.; Blaser, W.J.; Roshetko, J.M.; van Noordwijk, M.; Six, J. Soil fertility and Theobroma cacao growth and productivity under commonly intercropped shade-tree species in Sulawesi, Indonesia. Plant Soil 2019. [Google Scholar] [CrossRef]
- Suprayogo, D.; van Noordwijk, M.; Hairiah, K.; Meilasari, N.; Rabbani, A.L.; Ishaq, R.M.; Widianto, W. Infiltration-Friendly Agroforestry Land Uses on Volcanic Slopes in the Rejoso Watershed, East Java, Indonesia. Land 2020, 9, 240. [Google Scholar] [CrossRef]
- Koko, L.K.; Snoeck, D.; Lekadou, T.T.; Assiri, A.A. Cacao-fruit tree intercropping effects on cocoa yield, plant vigour and light interception in Côte d’Ivoire. Agrofor. Syst. 2013, 87, 1043–1052. [Google Scholar] [CrossRef]
- Armengot, L.; Barbieri, P.; Andres, C.; Milz, J.; Schneider, M. Cacao agroforestry systems have higher return on labor compared to full-sun monocultures. Agron. Sustain. Dev. 2016, 36. [Google Scholar] [CrossRef] [Green Version]
- Niether, W.; Schneidewind, U.; Fuchs, M.; Schneider, M.; Armengot, L. Below- and aboveground production in cocoa monocultures and agroforestry systems. Sci. Total Environ. 2019, 657, 558–567. [Google Scholar] [CrossRef] [PubMed]
- Somarriba, E.; Cerda, R.; Orozco, L.; Cifuentes, M.; Dávila, H.; Espin, T.; Mavisoy, H.; Ávila, G.; Alvarado, E.; Poveda, V.; et al. Carbon stocks and cocoa yields in agroforestry systems of Central America. Agric. Ecosyst. Environ. 2013, 173, 46–57. [Google Scholar] [CrossRef]
- Van Noordwijk, M. Agroforestry as nexus of sustainable development goals. IOP Conf. Ser. Earth Environ. Sci. 2020, 449, 012001. [Google Scholar] [CrossRef]
- Saputra, D.D.; Sari, R.R.; Hairiah, K.; Roshetko, J.; Suprayogo, D.; van Noordwijk, M. Can cocoa agroforestry restore degraded soil structure following conversion from forest to agricultural use? Agrofor. Syst. 2020, in press. [Google Scholar]


| Land Use * | Soil Depth (cm) | Particle-Size Distribution (g kg−1) | Soil Texture | pH (1N KCl) | C-Ref (g kg−1) | Normalized C-Ref Per Layer | C-org (g kg−1) | Normalized C-Org Per Layer | ||
|---|---|---|---|---|---|---|---|---|---|---|
| Clay | Silt | Sand | ||||||||
| SF | 0–10 | 128 (49) | 176 (25) | 674 (54) | Sandy loam | 3.8 (0.2) | 22.1 (1.5) | 1.13 | 21.8 (0.3) | 1.32 |
| 10–20 | 192 (48) | 175 (41) | 610 (67) | Sandy loam | 3.6 (0.3) | 15.3 (1.3) | 1.14 | 21.6 (0.5) | 1.59 | |
| 20–30 | 118 (52) | 294 (14) | 571 (65) | Sandy loam | 3.8 (0.5) | 13.0 (1.5) | 1.09 | 17.7 (3.2) | 1.47 | |
| CAF4 | 0–10 | 82 (13) | 309 (52) | 606 (42) | Sandy loam | 4.4 (0.3) | 17.0 (1.0) | 0.87 | 16.2 (0.6) | 0.98 |
| 10–20 | 96 (46) | 323 (33) | 567 (32) | Sandy loam | 4.1 (0.3) | 12.4 (0.7) | 0.92 | 12.4 (1.3) | 0.91 | |
| 20–30 | 86 (22) | 375 (18) | 527 (24) | Loam | 3.7 (0.3) | 11.4 (0.5) | 0.96 | 10.4 (1.5) | 0.87 | |
| CAF10 | 0–10 | 94 (19) | 288 (57) | 602 (43) | Sandy loam | 4.1 (0.3) | 19.8 (1.1) | 1.01 | 15.1 (1.2) | 0.92 |
| 10–20 | 80 (25) | 325 (27) | 578 (39) | Sandy loam | 3.9 (0.2) | 13.2 (0.8) | 0.98 | 11.4 (1.3) | 0.84 | |
| 20–30 | 67 (19) | 390 (37) | 530 (34) | Loam | 3.8 (0.2) | 11.8 (0.4) | 0.99 | 10.4 (1.4) | 0.87 | |
| CAF17 | 0–10 | 93 (17) | 341 (43) | 554 (47) | Sandy loam | 3.9 (0.4) | 20.7 (1.6) | 1.06 | 13.5 (1.1) | 0.82 |
| 10–20 | 138 (42) | 319 (26) | 525 (28) | Loam | 3.4 (0.4) | 14.2 (0.7) | 1.05 | 10.2 (0.3) | 0.75 | |
| 20–30 | 138 (31) | 347 (44) | 504 (39) | Loam | 3.5 (0.4) | 12.4 (0.9) | 1.04 | 10.0 (0.6) | 0.83 | |
| MAF45 | 0–10 | 119 (33) | 254 (28) | 607 (36) | Sandy loam | 4.3 (0.4) | 18.5 (1.1) | 0.94 | 15.7 (2.0) | 0.95 |
| 10–20 | 131 (45) | 267 (15) | 583 (32) | Sandy loam | 4.2 (0.3) | 12.2 (0.5) | 0.91 | 12.2 (2.2) | 0.90 | |
| 20–30 | 124 (50) | 313 (45) | 540 (32) | Sandy loam | 4.1 (0.3) | 10.8 (0.4) | 0.91 | 11.6 (2.6) | 0.97 | |
| Component | Allometric Equation for AGBest | Reference |
|---|---|---|
| Cocoa | 0.1208 D1.98 | [41] |
| Generic trees, humid tropics (rainfall 1500–4000 mm yr−1) | ρ × exp (−1.499 + 2.148 ln(D) + 0.207 (ln(D))2 − 0.0281 (ln(D))3) | [40] |
| Banana | 0.030 D2.13 | [42] |
| Palm | 0.118 D2.53 | [43] |
| Type of Tree or Plant | SF | MAF45 | CAF17 | CAF10 | CAF4 |
|---|---|---|---|---|---|
| Basal area | ------------------------------- (m2 ha−1)--------------------------- | ||||
| Timber trees | 12.42 | 4.50 | 0.19 | 2.02 | |
| Fruit trees | 4.02 | 3.11 | 0.50 | 2.73 | |
| Cocoa | 0.70 | 3.71 | 2.13 | 2.71 | |
| Shade trees | 2.88 | 0.76 | 1.75 | ||
| Palms | 0.90 | ||||
| Other trees | 1.91 | 0.67 | 0.84 | ||
| Total | 14.33 a | 10.78 b | 9.88 b | 5.41 c | 8.04 bc |
| Plant density | ----------------------------- (trees ha−1)--------------------------- | ||||
| Timber trees | 498 | 79 | 5 | 5 | |
| Fruit trees | 251 | 64 | 28 | 175 | |
| Cocoa | 44 | 263 | 188 | 650 | |
| Shade trees | 225 | 87 | 469 | ||
| Palms | 5 | ||||
| Bananas | 75 | ||||
| Other trees | 550 | 183 | 25 | ||
| Total | 1048 a | 563 b | 55 6 b | 307 b | 1394 a |
© 2020 by the authors. Licensee MDPI, Basel, Switzerland. This article is an open access article distributed under the terms and conditions of the Creative Commons Attribution (CC BY) license (http://creativecommons.org/licenses/by/4.0/).
Share and Cite
Gusli, S.; Sumeni, S.; Sabodin, R.; Muqfi, I.H.; Nur, M.; Hairiah, K.; Useng, D.; van Noordwijk, M. Soil Organic Matter, Mitigation of and Adaptation to Climate Change in Cocoa–Based Agroforestry Systems. Land 2020, 9, 323. https://doi.org/10.3390/land9090323
Gusli S, Sumeni S, Sabodin R, Muqfi IH, Nur M, Hairiah K, Useng D, van Noordwijk M. Soil Organic Matter, Mitigation of and Adaptation to Climate Change in Cocoa–Based Agroforestry Systems. Land. 2020; 9(9):323. https://doi.org/10.3390/land9090323
Chicago/Turabian StyleGusli, Sikstus, Sri Sumeni, Riyami Sabodin, Ikram Hadi Muqfi, Mustakim Nur, Kurniatun Hairiah, Daniel Useng, and Meine van Noordwijk. 2020. "Soil Organic Matter, Mitigation of and Adaptation to Climate Change in Cocoa–Based Agroforestry Systems" Land 9, no. 9: 323. https://doi.org/10.3390/land9090323
APA StyleGusli, S., Sumeni, S., Sabodin, R., Muqfi, I. H., Nur, M., Hairiah, K., Useng, D., & van Noordwijk, M. (2020). Soil Organic Matter, Mitigation of and Adaptation to Climate Change in Cocoa–Based Agroforestry Systems. Land, 9(9), 323. https://doi.org/10.3390/land9090323