Article

Local Perceptions of Ecosystem Services Across Multiple Ecosystem Types in Spain

by
Marina García-Llorente
1,2,*,
Antonio J. Castro
3,4,
Cristina Quintas-Soriano
2,5,
Elisa Oteros-Rozas
2,6,
Irene Iniesta-Arandia
2,7,
José A. González
1,
David García del Amo
7,
Marta Hernández-Arroyo
8,
Izaskun Casado-Arzuaga
9,10,
Ignacio Palomo
11,12,
Erik Gómez-Baggethun
13,14,
Miren Onaindia
10,
Carlos Montes
1 and
Berta Martín-López
15
1
Social-Ecological Systems Laboratory, Department of Ecology, Universidad Autónoma de Madrid, C/Darwin 2, 28049 Madrid, Spain
2
FRACTAL Collective, San Remigio 2, 28022 Madrid, Spain
3
Andalusian Center for the Assessment and Monitoring of Global Change (CAESCG), Department of Biology and Geology, University of Almeria, La Cañada de San Urbano, 04120 Almeria, Spain
4
Department of Biological Sciences, Idaho State University, 921 South 8th Avenue, Pocatello, ID 83209, USA
5
Faculty of Organic Agricultural Sciences, University of Kassel, Steinstraße 19, 37213 Witzenhausen, Germany
6
Chair on Agroecology and Food Systems, University of Vic—Central University of Catalonia (UVic-UCC), C. de la Laura, 13, 08500 Vic, Spain
7
Institute of Environmental Science and Technology (ICTA), Universitat Autònoma de Barcelona (UAB), Edifici Z (ICTA-ICP), Carrer de les Columnes s/n, Campus de la UAB, Cerdanyola del Vallès, 08193 Barcelona, Spain
8
Asociación Ecología y Educación para una Ciudad Sostenible—Transitando, C/Cavanilles 10, 5D, 28007 Madrid, Spain
9
Departamento de Desarrollo Económico, Sostenibilidad y Medio Ambiente del Gobierno Vasco, C/Donostia-San Sebastián, 1, 01010 Vitoria-Gasteiz, Alava, Spain
10
Department of Plant Biology and Ecology, University of the Basque Country (UPV/EHU), P.O. Box 644, 48080 Bilbao, Spain
11
Basque Center for Climate Change (BC3), Alameda Donaindiae Urquijo 4, 48008 Bilbao, Spain
12
Laboratoire d’Ecologie Alpine, CNRS–Université Grenoble Alpes, 38000 Grenoble, France
13
Department of International Environment and Development Studies (Noragric), Norwegian University of Life Sciences (NMBU), 5003, N-1432 Ås, Norway
14
Norwegian Institute for Nature Research (NINA), Gaustadalléen 21, 0349 Oslo, Norway
15
Faculty of Sustainability, Leuphana University, Universitätsallee 1, 21335 Lüneburg, Germany
*
Author to whom correspondence should be addressed.
Land 2020, 9(9), 330; https://doi.org/10.3390/land9090330
Submission received: 23 July 2020 / Revised: 3 September 2020 / Accepted: 5 September 2020 / Published: 18 September 2020

Abstract

:
Combining socio-cultural valuations of ecosystem services with ecological and monetary assessments is critical to informing decision making with an integrative and multi-pronged approach. This study examined differences in the perceptions of ecosystem service supply and diversity across eight major ecosystem types in Spain and scrutinized the social and ecological factors shaping these perceptions. First, we implemented 1932 face-to-face questionnaires among local inhabitants to assess perceptions of ecosystem service supply. Second, we created an ecosystem service diversity index to measure the perceived diversity of services considering agroecosystems, Mediterranean mountains, arid systems, two aquatic continental systems, coastal ecosystems and two urban ecosystems. Finally, we examined the influence of biophysical, socio-demographic and institutional factors in shaping ecosystem service perceptions. Overall, cultural services were the most widely perceived, followed by provisioning and regulating services. Provisioning services were most strongly associated with agroecosystems, mountains and coastal systems, whereas cultural services were associated with urban ecosystems and regulating services were specifically linked with agroecosystems, mountains and urban recreational areas. The highest service diversity index values corresponded to agroecosystems, mountains and wetlands. Our results also showed that socio-demographic factors, such as place of origin (urban vs. rural) and educational level, as well as institutional factors, such as management and access regimes, shaped the perception of ecosystem services.

1. Introduction

An emerging challenge in contemporary societies is to reverse the decline of ecological life support systems and the ecosystem services they provide to humans [1,2,3]. The concept of ecosystem services (ES), which more recently incorporated the concept of nature’s contributions to people, was coined to emphasize the links between ecosystem health and human well-being. Since the publication of the Millennium Ecosystem Assessment [1], the term has become a core concept in environmental management and biodiversity conservation [4,5,6,7,8,9]. Consequently, it is now included in the agendas of global conservation initiatives, such as the international Strategic Plan for Biodiversity 2011–2020 adopted by the Convention on Biological Diversity in the Aichi Targets and by the Intergovernmental Science-Policy Platform on Biodiversity and Ecosystem Services (IPBES). In the case of Spain, the National Ecosystem Assessment was a crucial milestone for scientific legitimization of the ES concept. Later, the term was formally incorporated, but not truly operationalized, in a number of policy strategies. These initiatives include the Spanish Strategic Plan on Natural Heritage and Biodiversity [10] for the period 2011–2017, the strategic document “Society and Protected Areas Program 2020” [11] elaborated by EUROPARC-Spain (an entity comprising the organizations involved in the planning and management of protected natural areas in Spain) and recently in the draft of the National Strategy for Green Infrastructure and Ecological Connectivity and Restoration, which addresses the conservation of natural and semi-natural ecosystems to enhance the delivery of a wide range of ES [12].
The literature on ES science is increasingly emphasizing the need for integrated valuation perspectives, in which a combination of tools and valuation metrics helps to uncover the diverse values of nature [9,13,14,15,16]. For decades, ES assessments have been heavily dominated by biophysical and economic approaches [17,18,19,20], whereas socio-cultural approaches have only started to gain prominence in recent years [21,22,23,24,25,26,27].
Socio-cultural valuation moves a step beyond monetary techniques by relying on directly lived experiences with our surrounding environment and the ways in which we live in, interact with, perceive, and value our immediate environments [28]. The analysis of values, attitudes and beliefs modeling socio-cultural preferences towards ES can be especially relevant in decision-making and environmental planning processes, as the success of policies heavily depends on social acceptance and support. Accordingly, it has been suggested that the deficit of research and data on non-monetary values of ES may lead to narrow decision-making processes designed from incomplete or biased information [29]. In this study, we used a freelisting technique [30,31] to assess all ES that local people perceived from the surrounding ecosystems.
As biophysical, socio-demographic and cultural characteristics differently influence one’s experience of nature [21,32,33], many studies have focused on ES from individual ecosystems and have lacked the capacity to build simultaneous comparisons. However, stakeholder recognition regarding the capacity to provide services varies among different types of ecosystems [21]. For instance, traditionally urban areas have been considered only as areas of ES consumers. In the same way, drylands have been traditionally considered a poor ecosystem type in terms of their lower capacity to provide ecosystem services [34]. Our study approached the representative ecosystem types of Spain and explored the influence of socio-demographic variables such as age, gender, education level and place of residence on the perceptions of local residents. The preferences of individuals and communities might co-evolve with land management and land use changes, but it is difficult to demonstrate how regional cultural values, attitudes and norms shape preferences separately from other socio-demographic factors [35]. As mentioned, to date, most research has either focused on a certain ecosystem type or landscape across countries/regions (e.g., [36,37]) or on comparing land uses or ecosystem types at a local/regional scale. However, this study is, to our knowledge, the first approach employing a large sample of primary data that has explored socio-cultural preferences in different ecosystem types in the same country, i.e., in a relatively similar cultural context. In addition, given that people’s preferences also depend on institutional contexts and access regimes [15,38], we explored the influence of different governance and management regimes across ecosystems in the perception of the ES they provide. Spain, which has a wide variety of governance settings, from private to diverse commons in land ownership and use, constitutes a good setting in which to explore this influence.
Along these lines, the aim of this research was to analyze how residents perceived the supply and diversity of ES across ecosystem types of Spain and the influence of different biophysical, socio-demographic and institutional contexts on these perceptions. We only targeted residents (i.e., people living in the area) in each of the study areas because our interest was in exploring the perceptions that local communities had of their immediate natural surroundings [28]. Our specific goals were (1) to assess the perception of ES across ecosystem types and the relative importance locals attributed to them; (2) to measure the diversity of ES perceived for each ecosystem type; and (3) to explore how biophysical, socio-demographic and institutional factors affected the relative importance that local residents attributed to ES. Finally, we discussed the suitability of the freelisting technique for uncovering socio-cultural preferences towards ES.

2. Materials and Methods
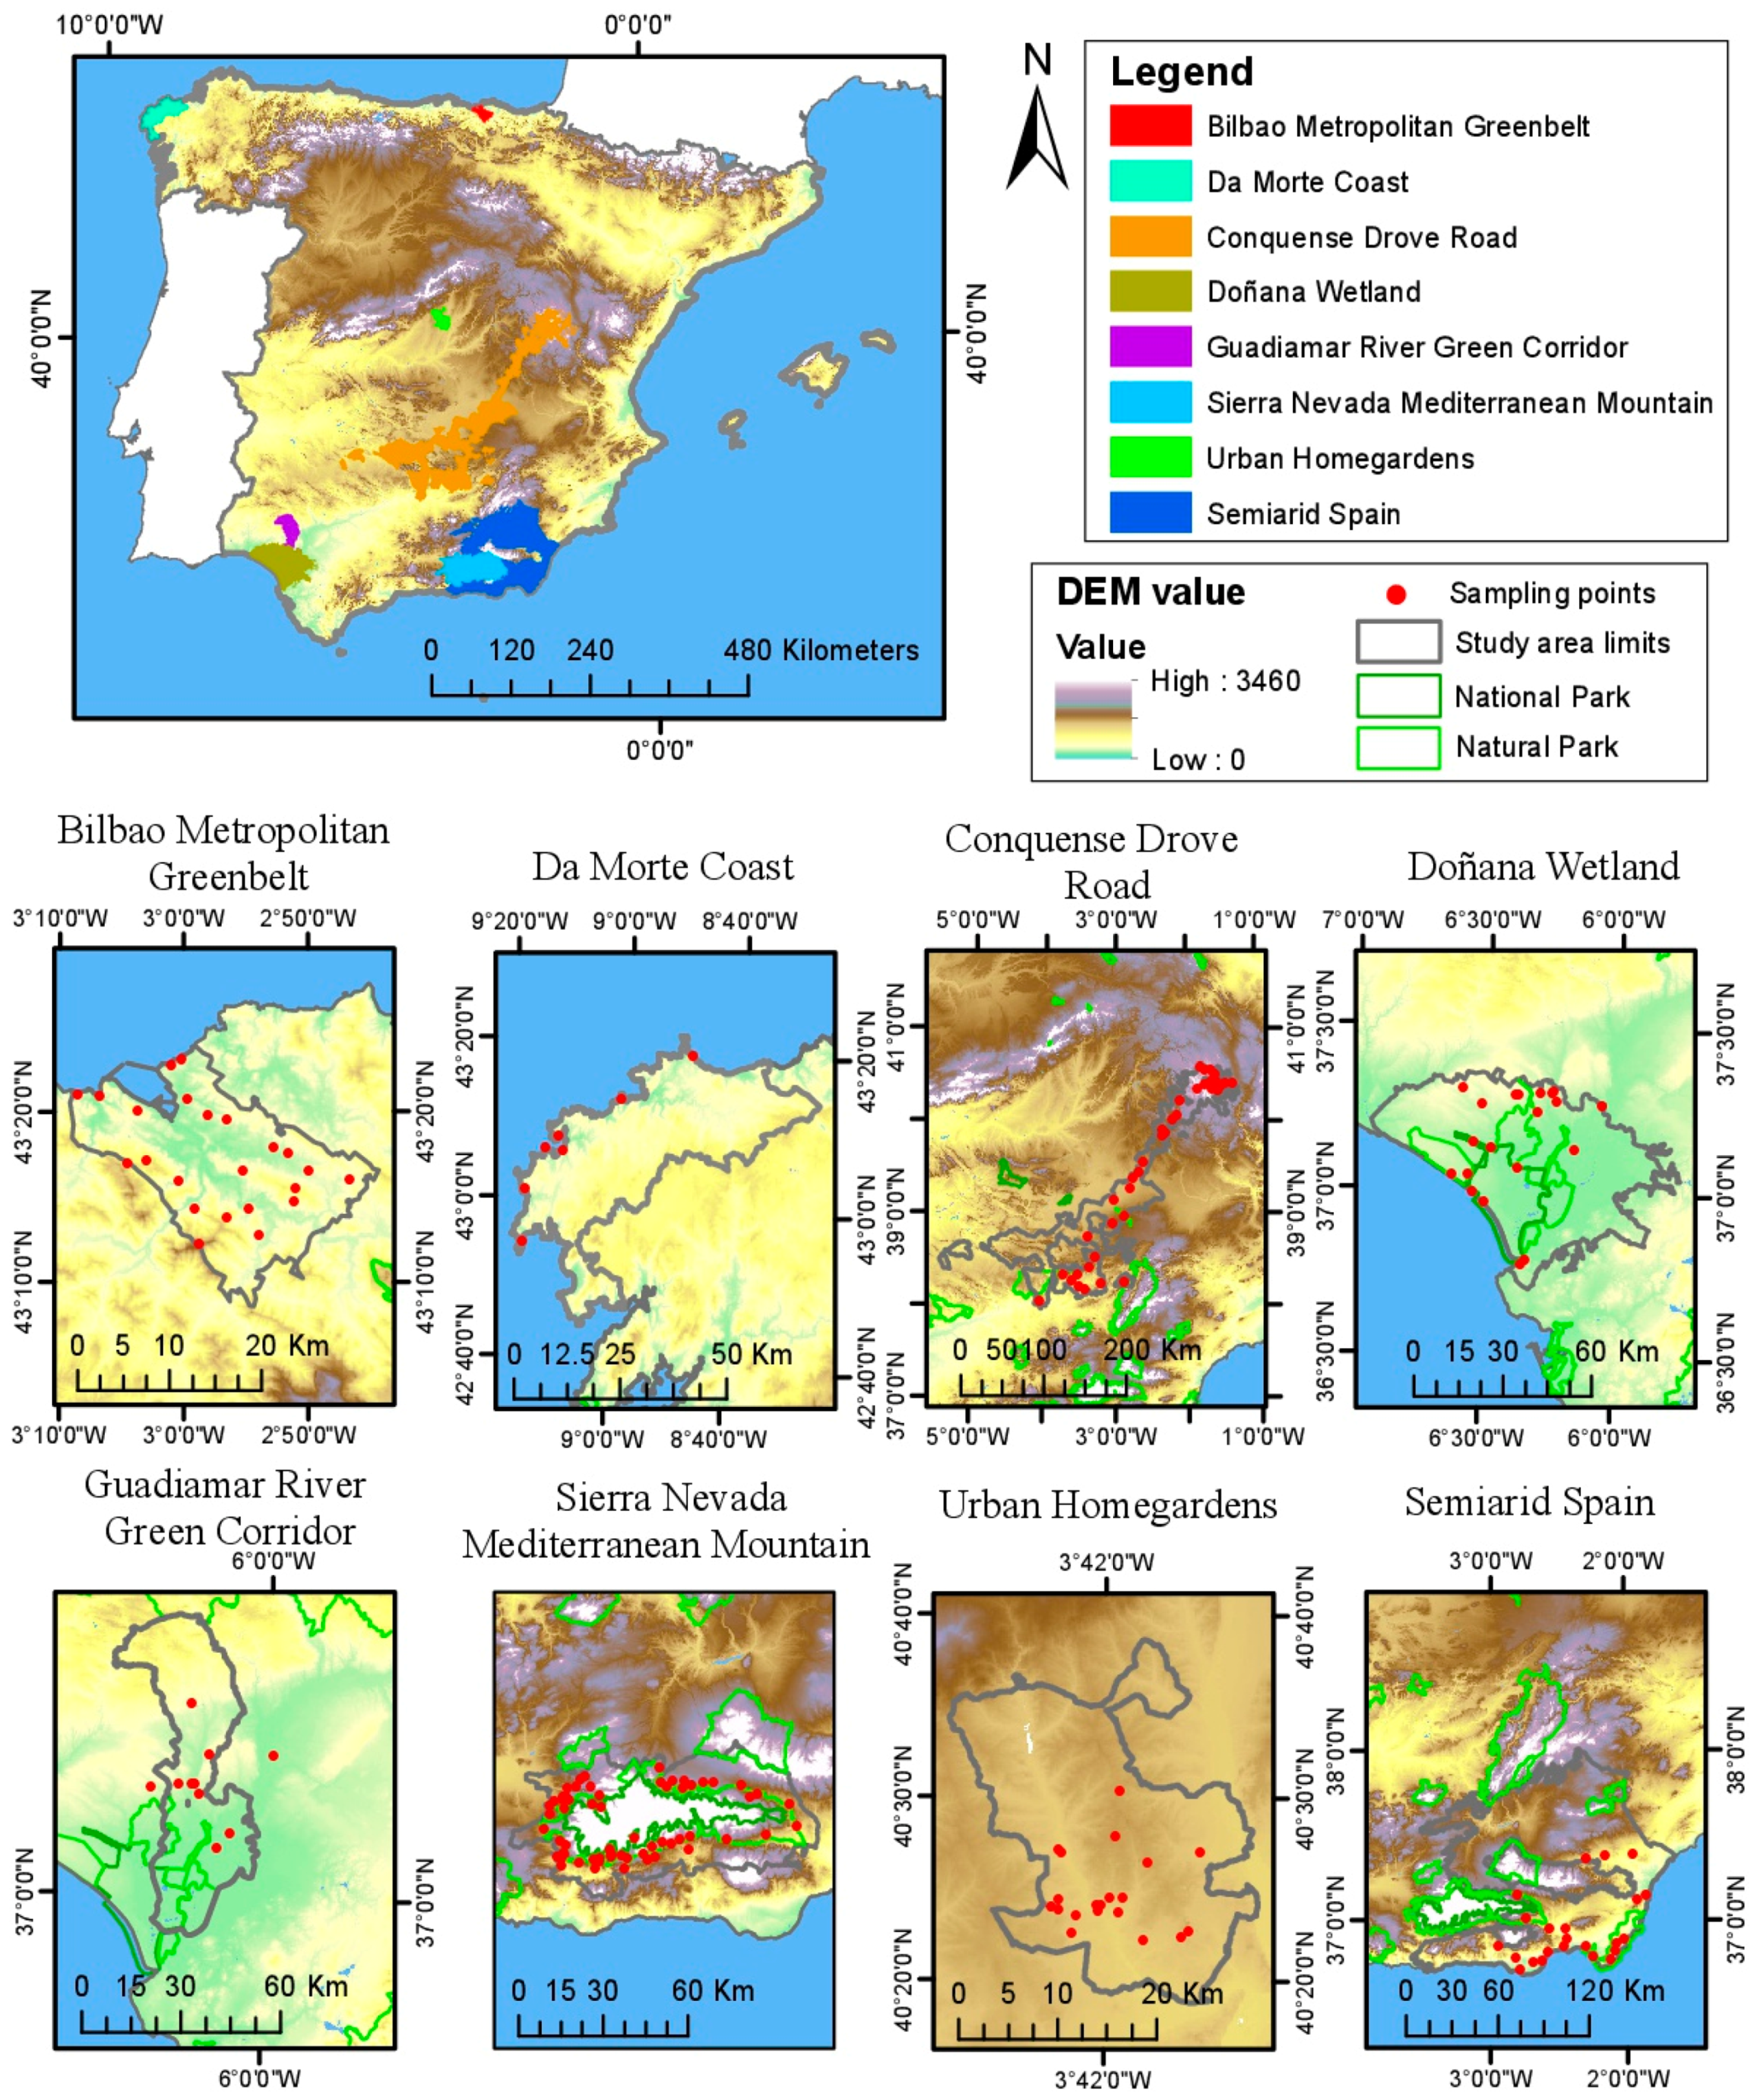
2.1. Study Sites

We worked at eight study sites in Spain that covered a wide range of eight representative ecosystems as defined in the Spanish National Ecosystem Assessment [39], including agroecosystems, Mediterranean mountains, arid systems, two aquatic continental systems (wetlands and rivers), coastal ecosystems and two urban ecosystems (homegardens and a periurban green area) (Figure 1). The study sites also covered a diversity of management systems, including urban ecosystems managed primarily for recreational purposes, intensive agriculture, extensive farming and protected areas.
The agroecosystems in our study included the Cañada Real Conquense, which is the longest drove road in Spain (approximately 410 km) that is still in use by transhumant herders who move their cattle and sheep on foot [40]. The Mediterranean mountain ecosystems included the Sierra Nevada mountains located in southeastern Spain [41] due to its botanical, geological and geomorphological interest [42]. The Spanish drylands were represented by semiarid ecosystems located in Almería Province in SE Spain. The freshwater ecosystems included the Doñana wetland on the southwestern coast of Spain, which is considered one of the most important wetland areas in Europe [43], and the Guadiamar River green corridor. Coastal ecosystems were represented by the Da Morte coast, a fishing and shell fishing rocky shore that includes European dry heaths, siliceous rock, fixed and mobile dunes and vegetated sea cliffs of the Atlantic and Baltic Coasts. Urban ecosystems included the Bilbao Metropolitan Greenbelt in Basque County in northern Spain and community gardens of Madrid, central Spain, representing orchards and ornamental plants. A summary of each study site is provided in Table 1 and Appendix A.

2.2. Sampling Strategy and Data Collection

We implemented face-to-face semi-structured questionnaires with residents (i.e., people living in one of the municipalities included in the study area) to assess the participants’ perceptions of ES delivered in the area in which they lived. A total of 1932 questionnaires were administered between 2008 and 2013 (Table 1). Random sampling was conducted by asking residents to participate in our study at representative points, such as recreational areas, visitor centers of protected areas, orchards, agricultural fields, agrarian offices, universities, city halls and other meeting points. Personal face-to-face interaction facilitated the communication between researchers and interviewees, allowed for explanation and increased the comprehension of the study questions. The same questionnaire structure was followed in the eight case studies. The first question was designed to motivate respondents to think about the study area and as a filtering question: “Do you think that the natural environment of the [sampled area] generates environmental benefits that positively affect your well-being and that of society?” We used the term environmental benefits instead of ES to facilitate understanding by respondents.
The second question aimed to elicit the ES that were identified by those respondents who answered “yes” to the first question (N = 1667). Negative answers (i.e., those people who did not recognize any ES; N = 265) were not considered in further analyses. We used a freelisting technique, i.e., respondents were requested to list all possible environmental benefits they considered the ecosystems in the study area to be providing to them. The freelisting technique is a direct consultative method aimed at obtaining spontaneous responses, in contrast with what happens when a list of given options is suggested by a questionnaire, thereby minimizing framing effects [30,44]. The application of this method resulted in a long list of aspects (qualitative data) mentioned by respondents that were later codified as ES by the authors through a collective and unified process according to the three main ES categories: provisioning, regulating and cultural (following the Common International Classification of ES, CICES, www.cices.eu). Ambiguous responses (e.g., nature, feeling good) and those that could not be defined as ES (e.g., work, money) were not codified. The final ES classification was reviewed by the first author to avoid different codifying criteria.

2.3. Data Analysis

We first calculated the share of respondents (percentage) that mentioned ES overall related to each of the three main ES categories and then per ecosystem type so that we could measure the social perception of ecosystem capacity to supply ES (specific objective 1). Then, we used a non-parametric Kruskal-Wallis test followed by Dunn’s multiple comparison test to analyze whether the relative importance given to each ES category by respondents was affected among ecosystem types.
An ES diversity index, hereafter ESDI, was calculated using the Shannon diversity index [45]. Even though other diversity indices, such as Simpson’s diversity index, have started to be applied to analyze ES [46], ESDI considers the number of ES recognized in each ecosystem type and their relative abundance so that the higher values correspond to areas where the local population shows higher and more diverse recognition of ES. This index is calculated as follows:
H = i = 1 R p i l o g 2 p i
where R is the number of ES mentioned (richness) and p i is the proportion of each ES mentioned regarding the total ES perceived in an ecosystem type (abundance). We also calculated the average number of ES recognized per person and the percentage of respondents who named at least one ES at each ecosystem type (specific objective 2).
Finally, to identify the influence of different biophysical, socio-demographic and institutional factors on the social perception of ecosystem capacity to supply ES, we conducted a redundancy analysis (RDA; specific objective 3). The biophysical characteristics were described by the share (%) of six land use covers in each ecosystem type, including agricultural lands, forest, open areas, scrublands, urban areas and water areas. The socio-demographic variables included age, formal education, place of origin (urban, rural, semiurban) and gender. Governance was analyzed following the typology of property and access regimes, including (1) private property (e.g., areas with private farms, private hunting grounds, etc.); (2) community-based land (e.g., regions with predominantly communal grasslands, communal dehesas, areas where freshwater for crop irrigation was managed following community rules, community homegardens, etc.); (3) national protected areas (where part of the ecosystem type is covered by a national protected area, even if only partially) and (4) other protected areas (e.g., such as natural protected areas or Natura 2000 areas). Management regimes were categorized in each ecosystem type along three levels: (1) market oriented (e.g., where food products were produced as an economic activity mostly oriented towards commercialization; i.e., products obtained for self-consumption would not be market-oriented); (2) intense use of human labor (e.g., the workforce is critical for land management) and (3) intense use of other inputs (e.g., productive systems based on external inputs, such as fertilizers or pesticides). As in the previous case, the categories were not mutually exclusive, so one municipality could meet more than one category. A Monte Carlo permutation test (1000 permutations) was performed to determine the significance of independent variables in explaining the relative importance of ES. We used Ward’s linkage method with Euclidean distance to identify relatedness among ES.

3. Results

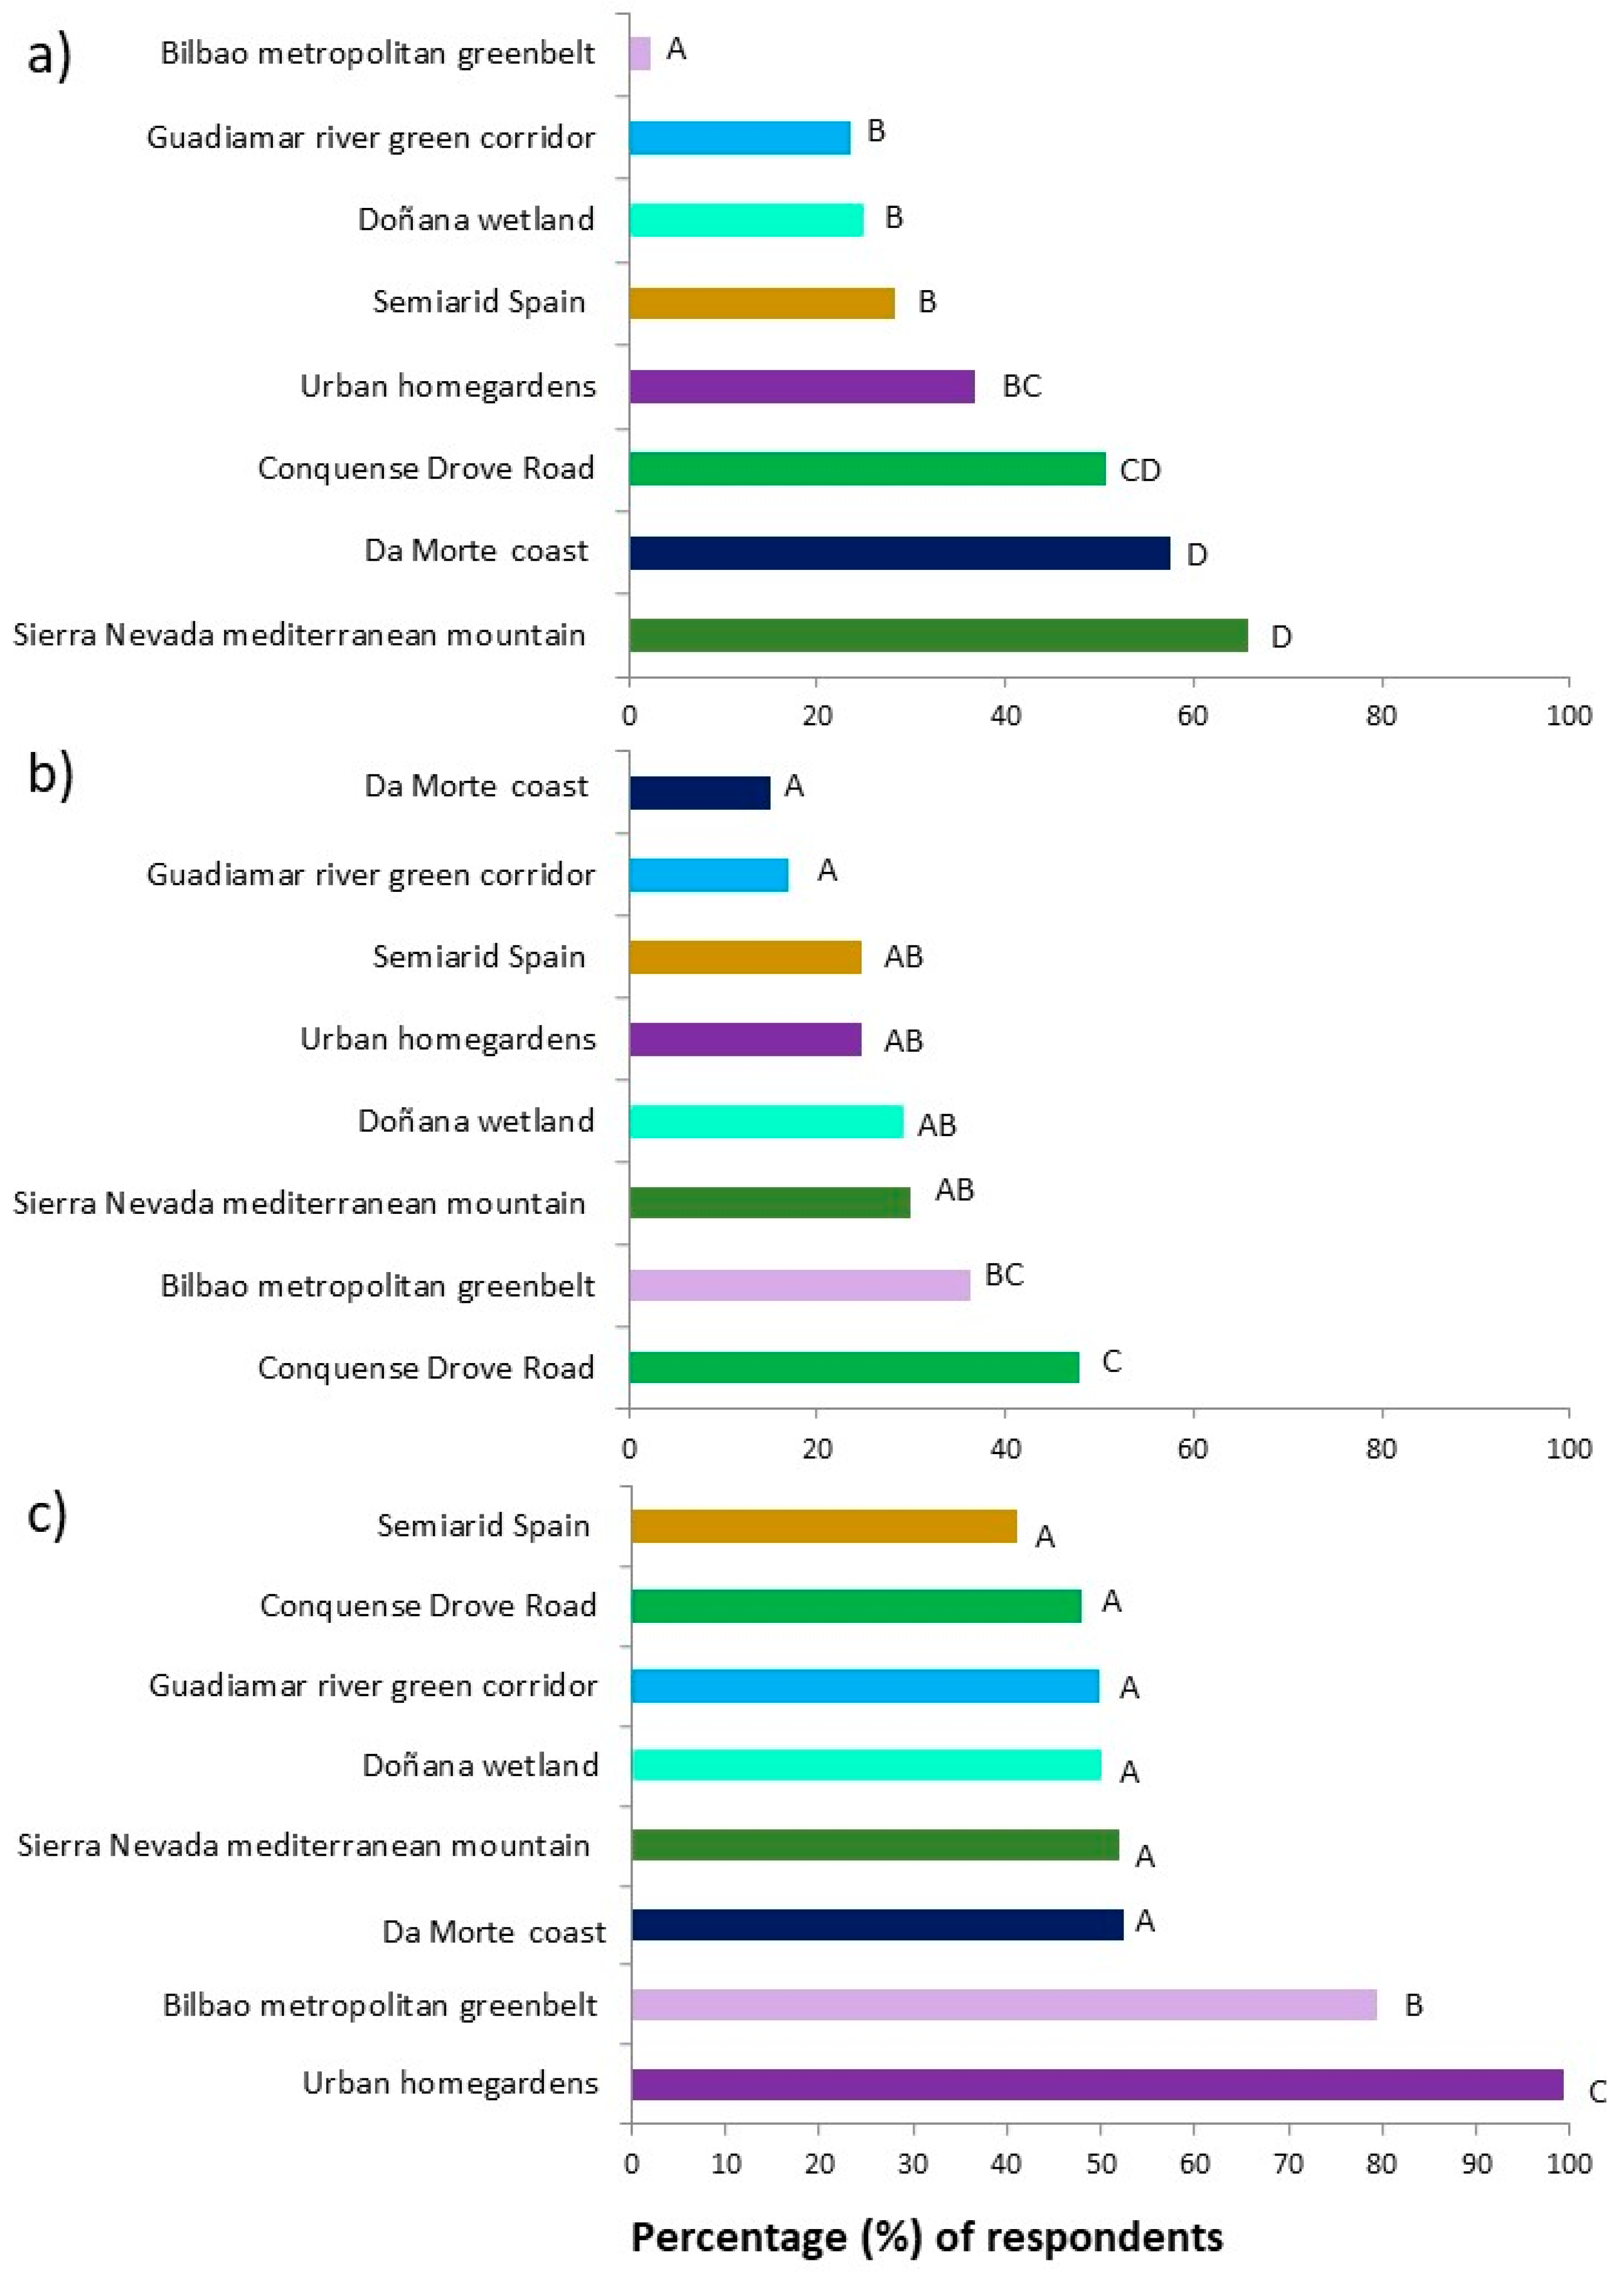
3.1. Perceptions of ES Supply

Among the different ES categories analyzed (provisioning, regulating and cultural), cultural ES were the most widely perceived; on average, 58.9% of respondents listed a cultural ES, while provisioning ES (36.3%) and regulating ES (28.1%) were less frequently listed. We found statistically significant differences regarding people’s recognition of the capacities of different ecosystem types to supply ES (Kruskal–Wallis test for provisioning ES, χ2 = 443.04, p-value < 0.01; Kruskal–Wallis test for regulating ES, χ2 = 73.41, p-value < 0.01; Kruskal–Wallis test for cultural ES, χ2 = 247.74, p-value < 0.01). In this regard, the Sierra Nevada Mediterranean mountains together with the Da Morte coast, followed by the agroecosystems of the Conquense Drove Road, were the ecosystem types where people more frequently perceived the capacity to supply provisioning ES (65.9%, 57.5%, 50.7% of participants, respectively, Figure 2a). In contrast, provisioning ES were rarely perceived in the Bilbao Metropolitan Greenbelt (2.4%). In the Sierra Nevada Mediterranean mountains, respondents further recognized the relevance of ES, such as food from livestock (25.1%), freshwater (20.0%), timber (17.4%) and forest harvesting (11.7%). Along the Da Morte coast, fishing and shell fishing services were frequently acknowledged (56.5%). Finally, food from livestock (31.0%) and timber (14.1%) turned out to be the most reported ES at the agroecosystems of the Conquense Drove Road (see Table 2).
Regulating ES were most widely recognized in the agroecosystems of the Conquense Drove Road—where they were listed by almost half of respondents (47.9%)—and in the Bilbao Metropolitan Greenbelt (36.4%) (Figure 2b). We did not find significant differences in the social perception of ecosystems’ capacity to supply regulating ES in the Sierra Nevada Mediterranean mountains (30.1%), Doñana wetland (29.2%), Madrid homegardens (24.7%) and semiarid Spain (24.7%). In particular, air quality appeared as a commonly perceived ES in the Conquense Drove Road, the Bilbao Metropolitan Greenbelt, Madrid homegardens, Sierra Nevada Mediterranean mountains and Doñana wetland. Respondents from the Conquense Drove Road equally highlighted the importance of the habitat for species (15.5%) and the prevention of natural hazards, such as fires (11.3%; Table 2).
Cultural ES were most widely recognized among urban populations connected to the Madrid homegardens (99.4%) and to the Bilbao Metropolitan Greenbelt (79.5%) (Figure 2c). We found no significant differences in the perception of cultural ES in the rest of the ecosystem types. Particularly in Madrid urban homegardens, respondents remarked certain cultural ES, such as environmental education (81.6%), recreational activities (72.2%), local identity (46.2%), tranquillity and relaxation (36.7%) and aesthetic enjoyment (31.0%). The two main cultural ES elicited in the Bilbao Metropolitan Greenbelt were recreational activities (47.7%) and tranquillity and relaxation (33.7%). Recreational activities were mentioned in all ecosystem types.

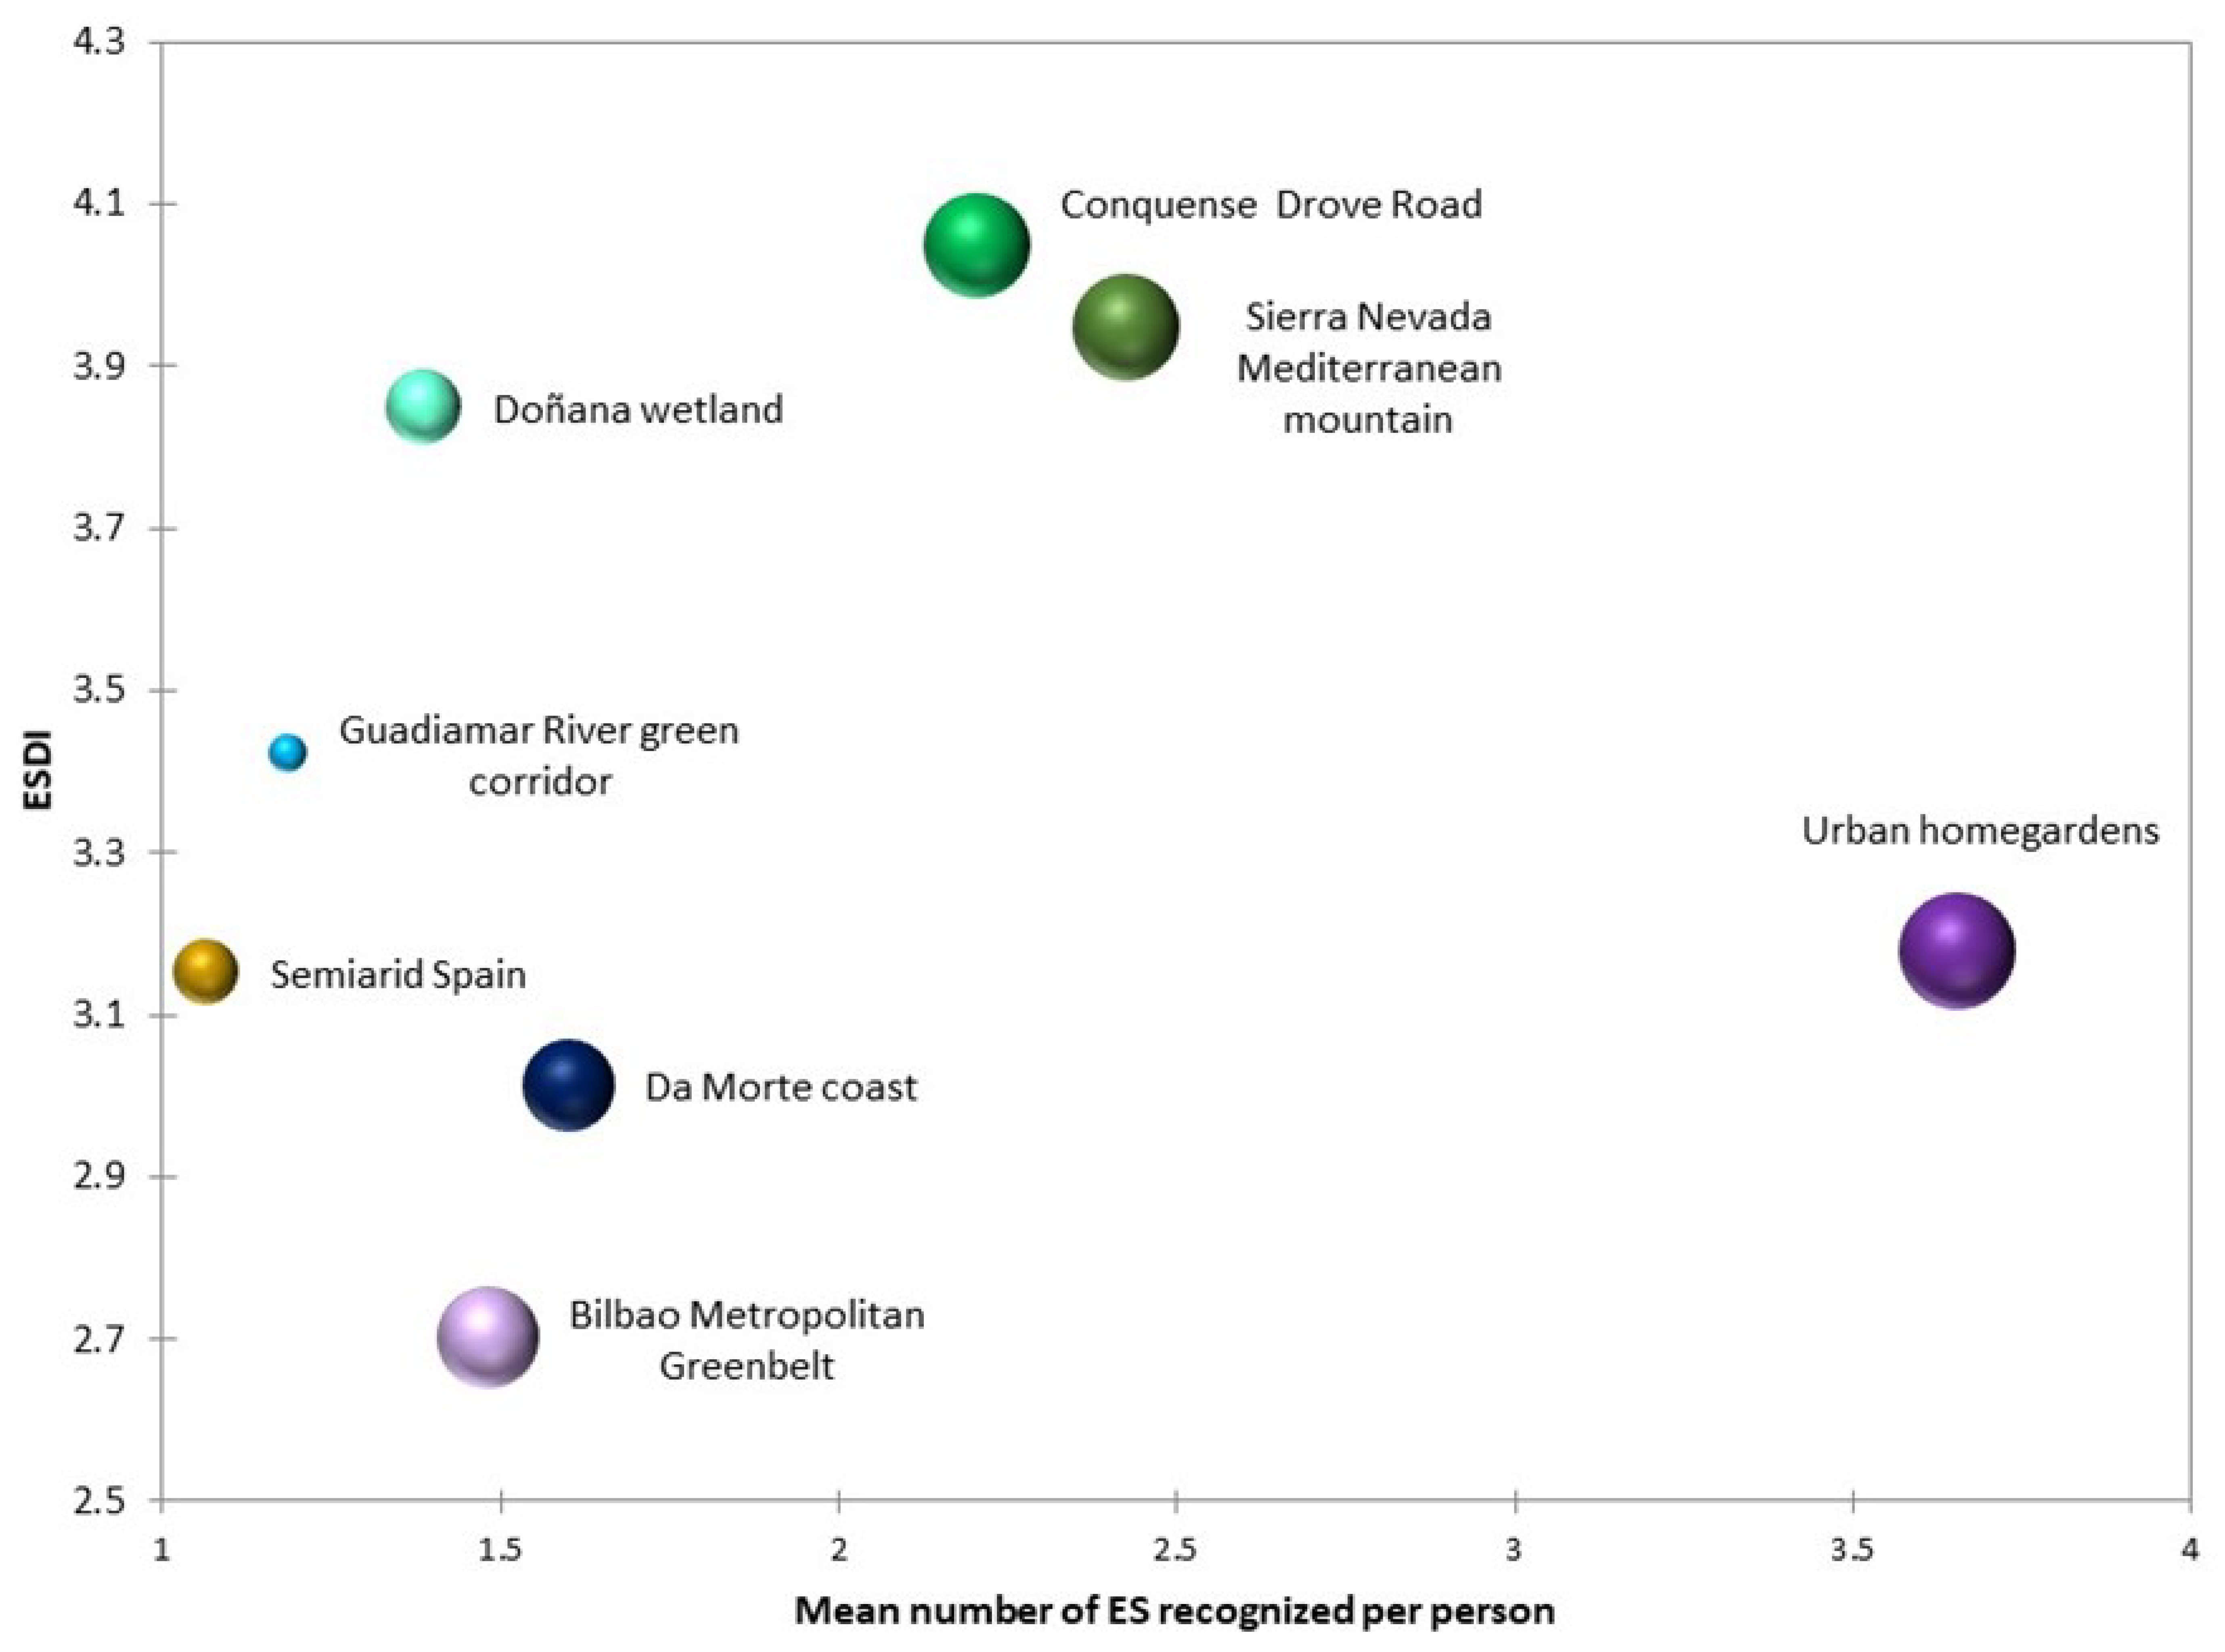
3.2. Perceptions on ES Diversity

The study areas with the highest values of the ESDI were the agroecosystems of the Conquense Drove Road, the Sierra Nevada Mediterranean mountains and the Doñana wetland. This was coherent with the high level of social recognition of those ecosystem types, particularly in the case of the Conquense Drove Road and Sierra Nevada mountains as ecosystems with a high capacity to provide ES (95.0% and 93.8% of respondents, respectively, mentioned at least one ES, Figure 3).
Semiarid, coastal and urban environments obtained the lowest ESDI values. These were mono-functional areas where respondents tended to report on one example of provisioning ES, such as intensive farming practices in semiarid environments, fishing and shell fishing in the coast, or recreation in urban areas (see Table 2). In the semiarid Spain region and the Guadiamar River green corridor, we obtained the lowest percentages of respondents who perceived that ecosystems provided at least one example of ES (75.0% and 68.0%, respectively).
The highest number of ES mentioned was obtained in the community gardens of Madrid, with 3.6 ES per person, whereas in semiarid Spain and coastal environments, respondents named on average between one and two ES. Overall, 99.0% of respondents recognized that Madrid urban homegardens supplied any kind of ES, but most of the ES listed pertained to the category of cultural ES, thereby leading to the lowest ESDI value.

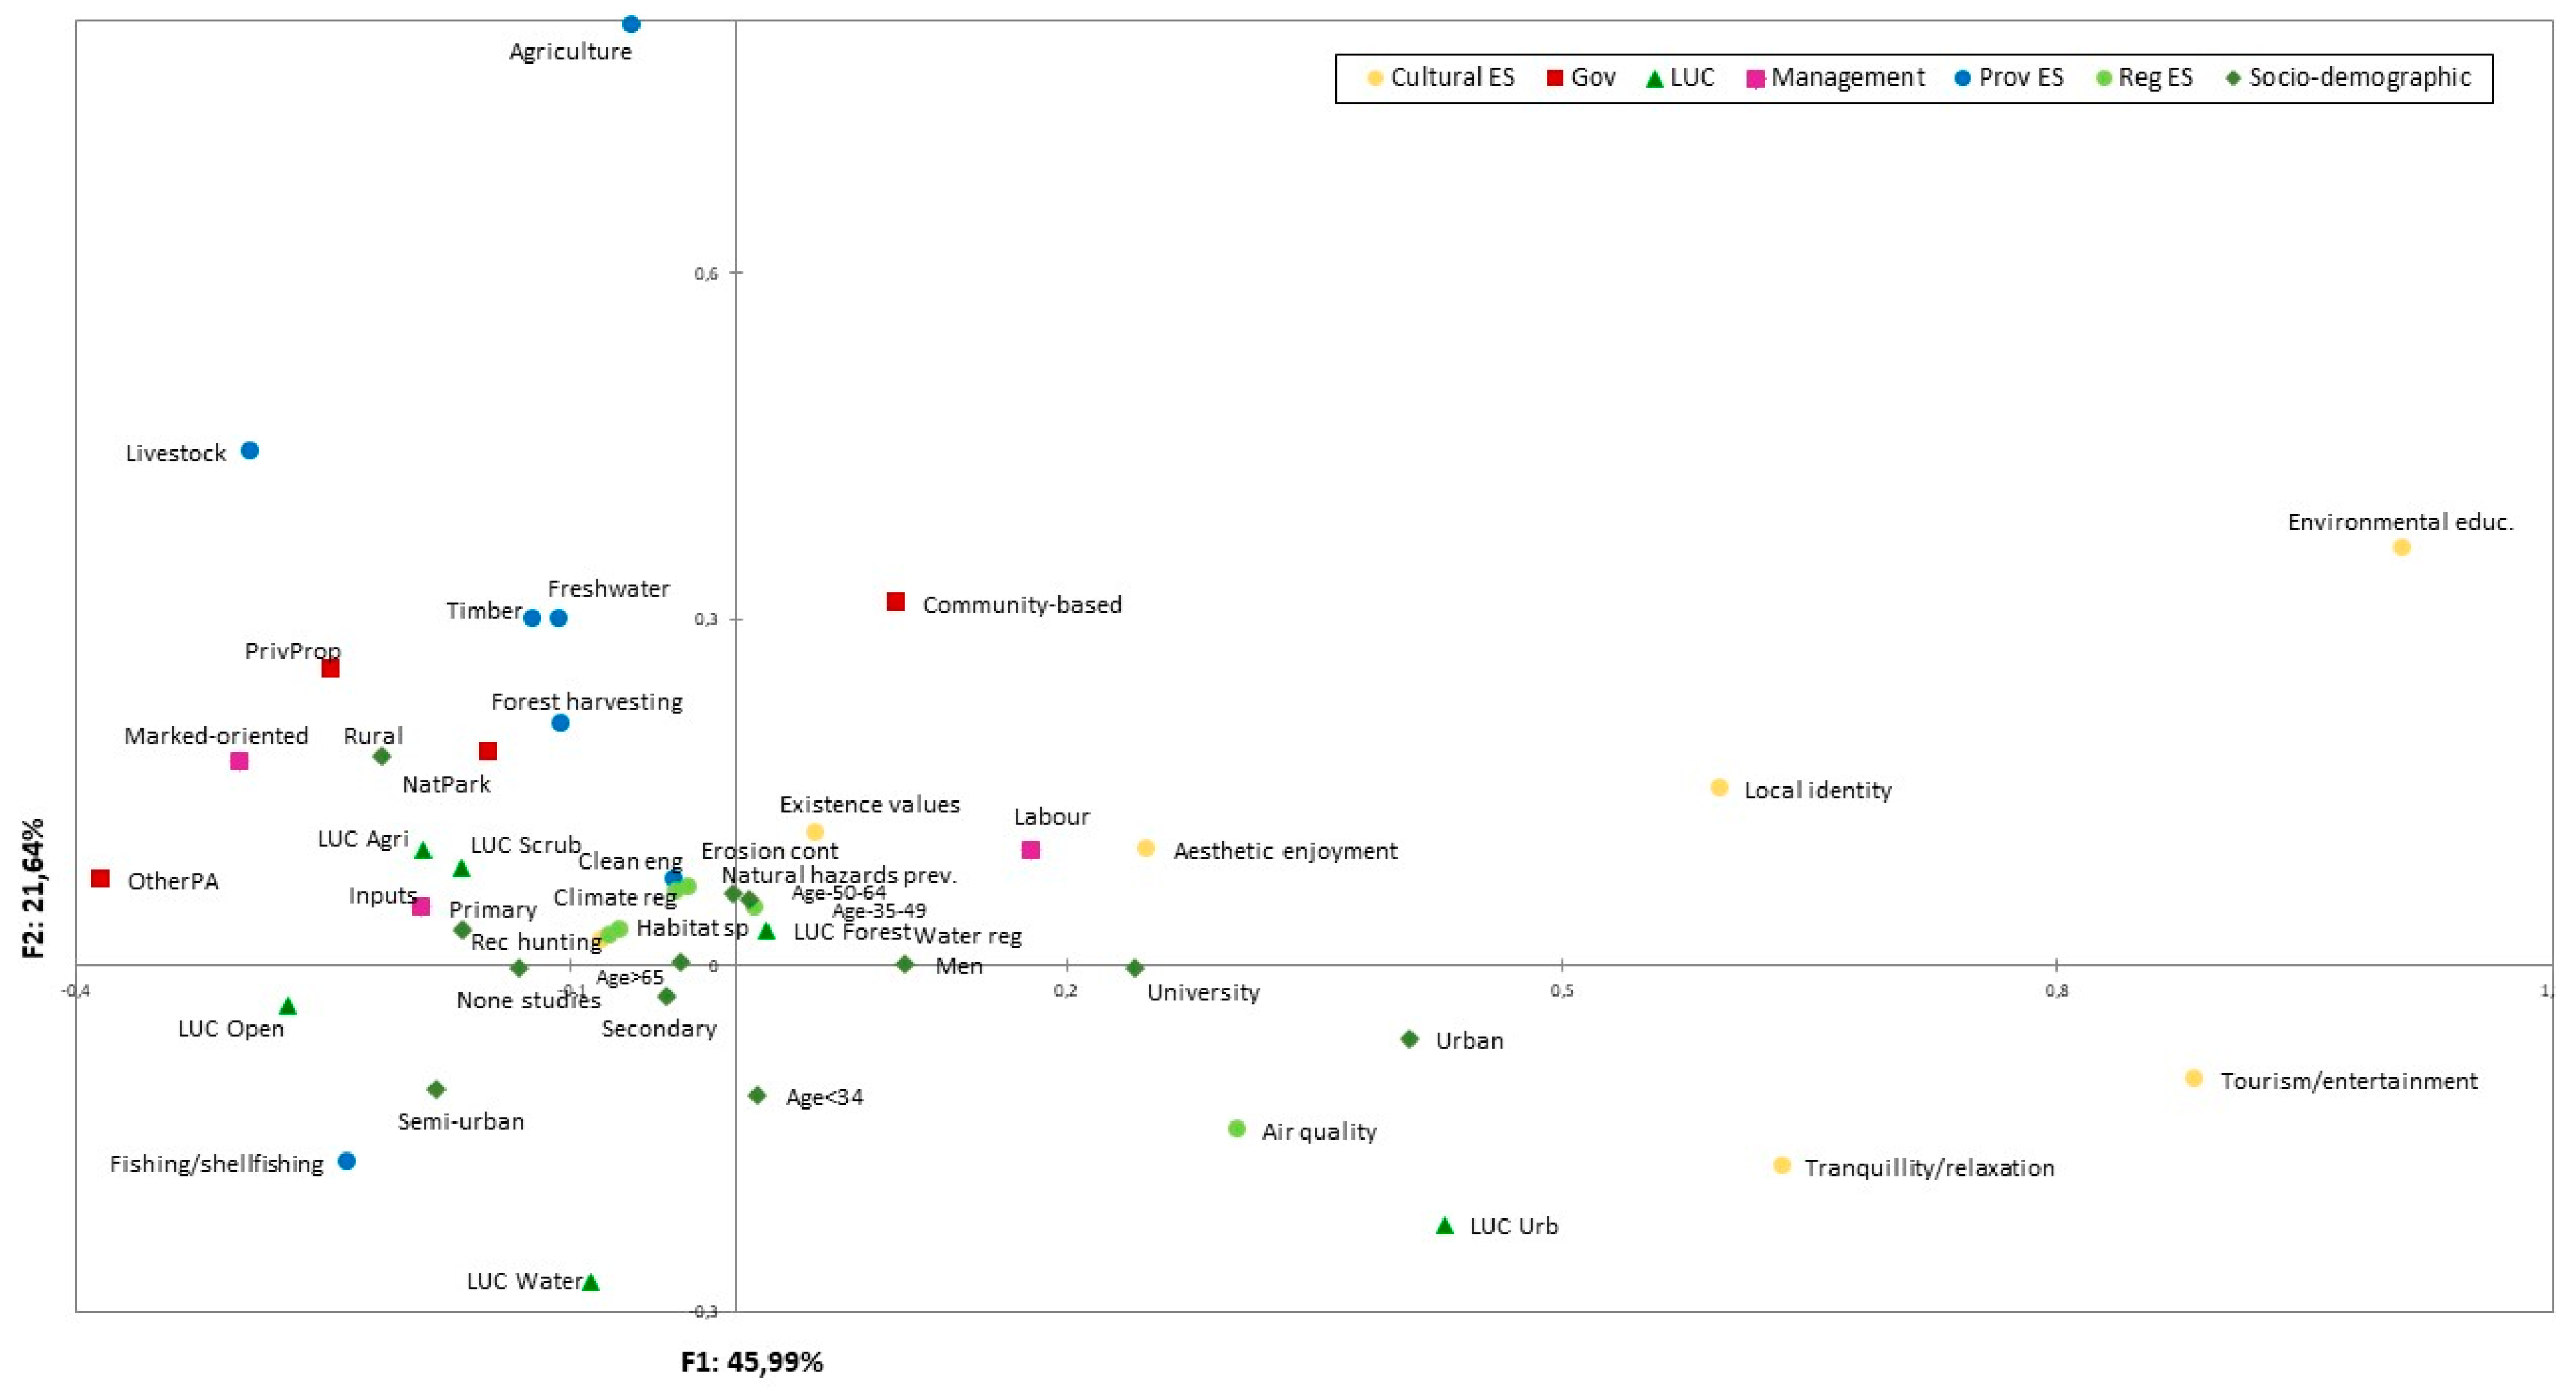
3.3. The Influence of Biophysical, Socio-Demographic and Institutional Variables on the Perception of Ecosystem Capacity to Provide ES across Ecosystem Types

The RDA indicated a statistically significant association between the relative importance of ES and the biophysical characteristics (land use covers), socio-demographic characteristics and institutional context (based on governance and management models). The first three axes explained 81.6% of the total variance (see more details in Appendix B, Table A1). The first axis of the RDA (45.99% of the variance; Figure 4) seemed to reveal a contrast between urban non-protected areas, which had positive scores, and rural areas with a certain degree of protection, which had negative scores. The positive side was also associated with the importance of cultural ES (tranquillity and relaxation, environmental education, tourism and recreation, local identity and aesthetic enjoyment) and air quality and was related to highly educated respondents (with university studies). The negative side tended to be associated with extractive provisioning ES (livestock and fishing and shell fishing), respondents with lower degrees of education and rural origin, market-oriented management systems, intense use of inputs for farming and private properties or areas under protection other than national protected areas.
The second axis of the RDA (21.64% of the variance; Figure 4) presented in its positive loads a higher perceived importance of provisioning ES, particularly food from farming activities and environmental education, in municipalities with larger areas managed under community-based and private property systems. The negative scores of the second axis seemed to be associated with the recognition of tranquillity and relaxation, fishing and shell fishing and air quality ES and were related to water spaces and urban areas. The third axis of the RDA (13.96% of the variance) was related on the positive side with fishing and shell fishing in municipalities with larger areas managed under community-based systems.

4. Discussion

4.1. Uncovering ES Preferences through the Freelisting Technique

Solid protocols for implementing socio-cultural valuations could help to better combine this information with ecological and monetary assessments and to inform decision making from an integrative and plural approach [47,48]. As noted by [49], different valuation rationalities elicited different types of responses. The social processes of ES assessment were value-articulating institutions, which means that those were constructed sets of rules that not only revealed values but also contribute to shaping and constructing them in the valuation process itself [49,50,51]. Therefore, methodologies and frameworks were not neutral instruments that merely revealed the values people held towards ES but devices that actively shaped them. The use of the freelisting technique did not explicitly adopt ES language and avoided the service production metaphor [47]. This methodology, instead, allowed spontaneous responses because interviewees could report all possible ecosystem benefits they perceived. Other advantages were the possibility of assessing a wide range of ES at the same time and the capacity to provide robust quantitative information [32]. In addition, from a methodological perspective, it avoided incommensurability issues resulting from the assigning of monetary values to ES properties that could not be monetarily measured [52] and facilitated comparisons with other case studies [21]. However, the freelisting technique is not free of limitations. One restriction is related to the exhaustion or fatigue bias of respondents mentioning the maximum number of ES they receive from nature. To minimize this effect and to avoid information biases, this open-ended question was conducted at the beginning of the survey at all study sites. Another limitation is respondents’ difficulty verbalizing all ES perceived without any prior guidance; for example, regulating ES are less obvious [25], which could explain the lower frequency of mention of regulating ES.

4.2. An ES Diversity Index for Measuring Ecosystem Multifunctionality

Over the last few years, several efforts in the ES literature have been made to define ES indices and indicators that can be used to integrate ES in decision domains and land planning. Previous authors [53] discussed the roles of ecology and economics in the construction of an ES index; although that index suggested to be valid both economically and ecologically, the authors suggested that the need for a precise definition of ES is required to avoid double-counting. Other studies [54] introduced ES provision indexes derived from a combination of field and remotely sensed data, which are useful for forming aggregated indicators of the status and trends of ES at large spatial scales. Likewise, ref. [55] proposed the multiple ES landscape index, a new integrative environmental indicator at the landscape level to measure multifunctionality based on ES provision. In this sense, the ESDI we proposed and tested is new approach for measuring the supply of ES from a social dimension. We argue that the ESDI is a useful complementary approach, since it can help to unravel stakeholders’ perceptions by integrating not only the number of ES identified per person but also the diversity of ES. Our findings showed that agroecosystems, Mediterranean mountains and wetlands were perceived as having the highest capacity to provide a diverse range of ES to society. This result was consistent with previous findings in which Mediterranean ecosystems subject to traditional management practices and customary governance (e.g., community-based governance systems) were recognized as multifunctional landscapes [38,56,57].
We also found that urban areas were not mere consumers or receptors of ES provided in rural contexts despite showing lower ESDI values, but these areas create spaces and opportunities for contact with nature through cultural ES. This finding has also been documented by studies conducted in the community homegardens of Barcelona (Spain), where cultural ES were salient due to their high social importance [25,58,59]. Ecological restoration and rehabilitation of ecosystems, such as rivers, lakes and woodlands in urban areas and agroecosystems in periurban areas, has been proven to be not only ecologically and socially desirable but also quite often economically advantageous [60,61].
Finally, it is remarkable that the Guadiamar River green corridor obtained low scores regarding the social importance of ES categories (see Figure 2) and the lowest percentage of respondents who perceived the ecosystem’s capacity to provide ES (68.0% of respondents were able to mention at least one ES). There is still a lack of scientific evidence linking indicators used to assess the ecological status of fluvial and riparian ecosystems with ES. Fluvial and riparian ecosystems are still being incorporated into the ES approach to properly value their ecological and social relevance [62].

4.3. The Influence of Socio-Demographic and Institutional Factors on ES Perceptions

We found that cultural ES were highly recognized by more educated respondents in urban contexts, while less educated and rural respondents easily identified provisioning ES, which is a pattern that has also been found in previous studies [21]. We contend that these results may be interpreted in the context of ongoing trends towards the ‘tertiarization’ (i.e., shift from agriculture and industry towards the service sector) of nature in urbanized societies. Urban cultural values and lifestyles strongly shape a population’s approach towards nature (the extinction of experience hypothesis [63,64], and displace to a secondary role the productive or economic utility (provisioning ES) along with the importance of ecological balance for ecosystems (regulating ES). Recent studies have shown that the social demand for cultural ES is increasingly evident, especially in regions, such as urban areas, where economic activities and lifestyle are less connected with extractive activities and subsistence economies [65,66].
In comparison with socio-demographic characteristics, considerably less attention has been drawn to more structural characteristics, such as the institutional contexts that mediate the experiences of people with nature or the level of involvement in decision-making and public access [15,38]. In a study on the ES provided by urban gardens, [67] found that individually managed urban allotment gardens were more likely to provide a higher supply of provisioning ES (food), while in community gardens, where participants have higher capacity to influence and determine management, nature stewardship was related to higher levels of place identity and social cohesion. Homegardens are expanding their representation in cities with a capacity to connect quality of life and green spaces and are therefore starting to become a key element in urban policies [68]. Accessibility and management regimes are also determinant institutional settings with an influence on ES perception. In accordance with previous studies in Spain, we found that market-oriented and high-input farming in private properties were more related to provisioning ES [38], while cultural and regulating ES were more related to communal or open-access environments, such urban areas and water spaces. Spanish legislation prioritizes public access and the use of spaces such as grasslands, but in certain regions such as Andalusia and Extremadura, large rangeland properties tend to limit access to avoid public uses that interfere with hunting activities [38]. However, depending on the region, private areas also appear as important providers of a diverse range of ES. Particularly for the ES that are generated at the landscape level, cooperation among multiple land users and managers improves provision by shaping the landscape [69]. The results from the present research further support the need to safeguard such cooperative systems and common access and property systems that have been proven to sustain the provision of a diverse range of ES in Spain. In this regard, homegardens can be understood as spaces for food supply but also for participation and cooperation opportunities between actors that strengthen social-ecological stewardship [67]. Similarly, drove roads and the publicly owned Bilbao Metropolitan Greenbelt, as publicly protected land with priority for common access, constitute critical green infrastructures within a mosaic landscape of agroforestry and urban systems that are able to provide a diversity of ES [23,65].

5. Conclusions

Our study used eight place-based cases to analyze how residents perceived the supply and diversity of ES across ecosystem types in Spain. Previous research from international projects has evaluated ES provision/demand in similar ecosystems across different countries and large-scale regions, but to our knowledge, this is the first attempt employing a large sample of primary data to cover different ecosystem types in the same country. With this purpose, this research addresses one of the main challenges to integrating socio-cultural values into policy domains, i.e., measuring and expressing their relevance with easy-to-use tools and accounting units different from monetary metrics [70,71]. We propose an ESDI that assesses ecosystem multifunctionality by integrating both the number of ES socially recognized in each ecosystem type and their relative abundances. Its application in the case of ES perceived by Spanish residents in different ecosystems has shown the importance for human wellbeing of multifunctional landscapes, such as agroecosystems and mountain landscapes, as well as urban settings. Socio-demographic factors, such as place of origin (urban vs. rural) and educational level, as well as institutional factors, such as management and access regimes, have also proven to shape the perception of ES. These results should be useful for decision-making and land use planning aimed at improving human wellbeing while preserving ecosystem functioning not only at the state level but also at more local scales, such as in large urban municipalities.

Author Contributions

Conceptualization, M.G.-L., B.M.-L., I.I.-A.; methodology and data acquisition, M.G.-L., A.J.C., C.Q.-S., E.O.-R., I.I.-A., D.G.d.A., M.H.-A., J.A.G., I.C.-A., I.P., B.M.-L., E.G.-B.; formal analysis, M.G.-L., A.J.C., E.O.-R., I.I.-A., B.M.-L.; investigation, M.G.-L., A.J.C., C.Q.-S., E.O.-R., I.I.-A., D.G.d.A., M.H.-A., J.A.G., I.C.-A., I.P., B.M.-L., E.G.-B., M.O., C.M.; resources, M.G.-L., B.M.-L.; visualization, C.Q.-S., I.P.; writing—original draft preparation, M.G.-L.; writing—review and editing, M.G.-L., A.J.C., C.Q.-S., E.O.-R., I.I.-A., D.G.d.A., M.H.-A., J.A.G., I.C.-A., I.P., B.M.-L., E.G.-B., M.O., C.M.; funding acquisition, M.G.-L., I.I.-A., B.M.-L., J.A.G. All authors have read and agreed to the published version of the manuscript.

Funding

Funding for the development of this research was provided by: the Andalusian Center for the Assessment of Global Change (CAESCG) (GLOCHARID project), the County Council of Biscay and the Basque Government by providing funds for this research, IMIDRA research Project Assessment of Ecosystem Services provided by Agroecosystems (FP16-ECO), funds of the European Union EU FP7 project OpenNESS (Grant Agreement No. 308428), funds of the European Union’s Horizon 2020 research and innovation programme under gGrant Agreement No. 81819, by the project entitled: Co-design of novel contract models for innovative agri-environmental-climate measures and for valorisation of environmental public goods, and SAVIA (Sowing Alternatives for Agro-ecological Innovation) project funded by R&D projects for young researchers at the Autonomous University of Madrid (ref SI1/PJI/2019-00444). E.O.-R. has been funded by Juan de la Cierva Incorporation Fellowship of the Ministry of Science Innovation and Universities (IJCI-2017-34334). I.I.-A. acknowledges financial support from the Spanish Ministry of Sciences, Innovation and Universities, through the “Juan de la Cierva-Incorporación” program (grant IJCI-2017-33405) and the “María de Maeztu” program for Units of Excellence (MDM-2015-0552).

Acknowledgments

We thank all the people who kindly responded to our questionnaire. We thank J.M. Mullor Requena for his assistance for land use covers calculations.

Conflicts of Interest

The authors declare no conflict of interest.

Appendix A. Description of the Study Sites

We worked at eight study sites that cover a wide swath of eight representative ecosystems in Spain as defined in the Spanish National Ecosystem Assessment [39], including agroecosystems, Mediterranean mountains, arid systems, two aquatic continental systems (wetlands and rivers), coastal ecosystems and two urban ecosystems (homegardens and a periurban green area).
We included the Cañada Real Conquense, the longest drove road in Spain still in use by transhumant herders who move their cattle and sheep on foot, as an agroecosystem in this study [40]. This region covers a summering area, which is located in the eastern forests of the Montes Universales (Teruel, Guadalajara and Cuenca provinces), a wintering area, which is located in southeastern Sierra Morena and the southern fields of La Mancha, and the drove road itself, which is a 75-m-wide (in most parts) corridor that crosses the central Iberian Plateau (Cuenca and Ciudad Real provinces) for ~410 km and is covered by agroforestry systems and croplands. For the present study, we included all municipalities located along the drove road, including 19 municipalities in the Teruel, Cuenca, Guadalajara and Jaén provinces, covering an area of 1554 km2.
The Mediterranean mountain ecosystems covered in our research are the Sierra Nevada mountains in the Almería and Granada provinces of southeastern Spain. Part of this area is protected because of its botanical interest and geological and geomorphological structures [42]. Traditional agriculture (i.e., olive and almond), and extensive livestock production activities have been historically relevant in the area; however, high-mountain farming has been gradually abandoned because of the rural exodus since the 1970s due to lack of farming industrialization and economic profitability and local population ageing, among other reasons. Its mountainous features and its conservation status have attracted interest for the aesthetic and recreational values of the area [52].
Arid ecosystems cover Almería Province (SE Spain). This region is considered the most arid region in continental Europe, with a predominantly Mediterranean warm and dry climate with average annual temperatures ranging between 12 and 15 °C and an average annual rainfall of less than 350 mm in most of the region [72]. Regarding socio-economic activities, the municipalities located on the coast are mainly associated with intensive agriculture and beach tourism. This area also holds one of the most important coastal protected areas in Spain: Cabo de Gata Natural Park [66].
The freshwater ecosystems covered in our research include the Doñana wetland and the Guadiamar River. The Doñana wetland is considered to stand among the most important wetland areas in Spain [43]. The site is located at the end of the Guadalquivir River basin (Seville, Cadiz and Huelva provinces) on the southwestern coast of Spain and holds protection status as a national park, biosphere reserve and Ramsar site, among other designations. Throughout the 20th century, the Doñana wetland has been subject to a prolonged processes of land use transformation through agricultural intensification [73]. As a protected area, Doñana serves a critical role in biodiversity conservation, particularly because it is embedded in a matrix of intensive land uses, with increasing conflict between biodiversity conservation and the expansion of agriculture, tourism and urbanization outside the borders of the protected area [41]. The area is also internationally recognized for the importance of its cultural and spiritual values [74]. The Guadiamar River green corridor connects the Sierra Morena Mountains and Doñana wetland following the Guadiamar River. It crosses extensive agricultural and rural lands. In 2003, it received protected status after a mining spill occurred in 1998, damaging its ecological value. The area has been subject to various restoration and conservation programs, which have increased its recreational and educational interest. Finally, the Da Morte coast, which means the “coast of death”, is part of the Atlantic rocky shore and is located in La Coruña Province in northwestern Spain. These coastal ecosystems are characterized by diverse geomorphological and vegetation formations that include European dry heaths, siliceous rock, fixed and mobile dunes (18% of the protected area are sandy beach-dune deposits) and the vegetated sea cliffs of the Atlantic and Baltic coasts. It covers 11 coastal municipalities mainly dedicated to fishing and shell fishing activities. This area has suffered several oil spills, including the Prestige oil spill in 2002, which was considered one of the main environmental catastrophes that occurred in Spain.
Regarding urban ecosystems, our research covered the green spaces of Bilbao and Madrid cities. The Bilbao Metropolitan Greenbelt is in the region of Bizkaia in Basque County, northern Spain. In this region, urban areas are situated in the valley along the estuary of the Nervión-Ibaizabal River, which is delimited by small mountains and by the coast to the north. The associated periurban ecosystems are called the “Bilbao Metropolitan Greenbelt” and cover almost 75% of the metropolitan area. These ecosystems include beaches, cliffs, rivers, meadows, scrublands, forests and plantations [65]. Finally, we studied the urban community gardens of Madrid. This area has orchards or gardens with areas between 100 and 1000 m2, providing mainly vegetables and ornamental plants. They are mostly located in previously abandoned plots that have been either occupied by grass root associations or leased by the local councils. Currently, most of them enjoy public municipal administrative support, which facilitates their access to water, fencing, etc. These homegardens are frequently self-built public spaces open to citizen participation through self-management practices that follow agroecological principles [75]. Our research covered 20 urban gardens of the so-called Madrid Community Urban Orchards Network (ReHd mad!), an initiative promoted by different groups involved in urban agriculture following agroecological practices in Madrid.

Appendix B

Table A1. Redundancy analysis scores for the first three factors obtained for ES and two dependent variables and biophysical characteristics (land use covers: LUC), sociodemographic characteristics and institutional context (based on governance and management models) as explanatory variables.
Variable TypeVariableF1F2F3
Provisioning ESFood from agriculture−0.0630.8140.085
Food from livestock−0.2940.446−0.122
Fishing and shell fishing−0.236−0.1700.813
Forest harvesting−0.1060.210−0.065
Freshwater−0.1230.300−0.087
Clean energy−0.0370.0740.013
Timber−0.1080.300−0.056
Regulating ESClimate regulation−0.0700.032−0.016
Habitat for species−0.0770.026−0.043
Air quality0.304−0.142−0.270
Water regulation0.0110.050−0.004
Erosion control−0.0290.068−0.019
Natural hazards prevention−0.0360.065−0.013
Cultural ESExistence values0.0480.1160.021
Tranquillity and relaxation0.634−0.174−0.080
Environmental education1.0100.3620.261
Recreational hunting−0.0810.022−0.008
Recreational activities0.883−0.099−0.085
Aesthetic enjoyment0.2480.1010.161
Local identity0.5960.1530.060
LUC (in Ln)Agricultural lands−0.1900.100−0.180
Forest0.0190.0300.080
Open lands−0.271−0.0350.191
Scrublands−0.1660.085−0.100
Urban0.429−0.224−0.010
Water−0.089−0.2730.090
GovernanceNational park−0.1500.185−0.120
Other protected area−0.3850.0750.169
Community-based0.0970.3140.240
Private property−0.2460.256−0.263
ManagementMarket oriented−0.3020.1780.148
Labor oriented0.1780.1010.122
Inputs−0.1900.0510.169
Socio-demographicAge: 340.013−0.1130.039
Age: 35-490.0080.057−0.006
Age: 50-64−0.0020.063−0.035
Age >65−0.0340.003−0.005
Gender: Men0.1020.001−0.013
Studies-none−0.132−0.0020.082
Studies-primary−0.1660.032−0.015
Studies-secondary−0.042−0.026−0.011
Studies-university0.241−0.002−0.008
Rural origin−0.2150.1810.021
Semi-urban origin−0.182−0.1060.030
Urban origin0.407−0.063−0.053
Eigenvalue0.0810.0380.024
Constrained inertia (%)45.99121.64113.958
Cumulative %45.99167.63281.589

References

  1. MA (Millennium Ecosystem Assessment). In Ecosystems and Human Well-Being: Biodiversity Synthesis; World Resources Institute: Washington, DC, USA, 2005.
  2. Guo, Z.; Zhang, L.; Li, Y. Increased Dependence of Humans on Ecosystem Services and Biodiversity. PLoS ONE 2010, 5, e13113. [Google Scholar] [CrossRef] [PubMed]
  3. IPBES. Summary for Policymakers of the Regional Assessment Report on Biodiversity and Ecosystem Services for Europe and Central Asia of the Intergovernmental Science-Policy Platform on Biodiversity and Ecosystem Services; Fischer, M., Rounsevell, M., Torre-Marin Rando, A., Mader, A., Church, A., Elbakidze, M., Elias, V., Hahn, T., Harrison, P.A., Hauck, J., Eds.; IPBES secretariat: Bonn, Germany, 2018; p. 48. [Google Scholar]
  4. Chan, K.M.A.; Shaw, M.R.; Cameron, D.R.; Underwood, E.C.; Daily, G.C. Conservation Planning for Ecosystem Services. PLoS Biol. 2006, 4, e379. [Google Scholar] [CrossRef] [PubMed] [Green Version]
  5. Fisher, B.; Turner, K.; Zylstra, M.; Brouwer, R.; de Groot, R.; Farber, S.; Ferraro, P.; Green, R.; Hadley, D.; Harlow, J.; et al. Ecosystem Services and Economic Theory: Integration for Policy-Relevant Research. Ecol. Appl. 2008, 18, 2050–2067. [Google Scholar] [CrossRef] [PubMed] [Green Version]
  6. Fisher, B.; Turner, R.K.; Morling, P. Defining and classifying ecosystem services for decision making. Ecol. Econ. 2009, 68, 643–653. [Google Scholar] [CrossRef] [Green Version]
  7. Lamarque, P.; Quétier, F.; Lavorel, S. The diversity of the ecosystem services concept and its implications for their assessment and management. Comptes Rendus Biol. 2011, 334, 441–449. [Google Scholar] [CrossRef]
  8. Díaz, S.; Demissew, S.; Carabias, J.; Joly, C.; Lonsdale, M.; Ash, N.; Larigauderie, A.; Adhikari, J.R.; Arico, S.; Báldi, A.; et al. The IPBES Conceptual Framework—Connecting nature and people. Curr. Opin. Environ. Sustain. 2015, 14, 1–16. [Google Scholar] [CrossRef] [Green Version]
  9. Pascual, U.; Balvanera, P.; Díaz, S.; Pataki, G.; Roth, E.; Stenseke, M.; Watson, R.T.; Başak Dessane, E.; Islar, M.; Kelemen, E.; et al. Valuing nature’s contributions to people: The IPBES approach. Curr. Opin. Environ. Sustain. 2017, 26–27, 7–16. [Google Scholar] [CrossRef] [Green Version]
  10. Ministerio de Medio Ambiente y Medio Rural y Marino. Plan Estratégico del Patromonio Natural y de la Bdiodiversidad 2011–2017; Ministerio de Medio Ambiente y Medio Rural y Marino: Madrid, Spain, 2011; p. 194. [Google Scholar]
  11. EUROPARC-ESPAÑA 2016. Programa Sociedad y Áreas Protegidas 2020. Áreas Protegidas Para el Bienestar Humano. Available online: http://www.redeuroparc.org/system/files/shared/Programa_2020/programa2020.pdf (accessed on 16 September 2020).
  12. Estrategia Estatal de Infraestructura Verde y de la Conectividad y la Restauración Ecológica. (2019-Borrador). Ministerio para la Transición Ecológica. Gobierno de España. Available online: https://www.miteco.gob.es/images/es/borradoreeivcre_infopublica_tcm30-497133.PDF (accessed on 16 September 2020).
  13. Jacobs, S.; Dendoncker, N.; Martín-López, B.; Barton, D.N.; Gomez-Baggethun, E.; Boeraeve, F.; McGrath, F.L.; Vierikko, K.; Geneletti, D.; Sevecke, K.J.; et al. A new valuation school: Integrating diverse values of nature in resource and land use decisions. Ecosyst. Serv. 2016, 22, 213–220. [Google Scholar] [CrossRef]
  14. Villegas-Palacio, C.; Berrouet, L.; López, C.; Ruiz, A.; Upegui, A. Lessons from the integrated valuation of ecosystem services in a developing country: Three case studies on ecological, socio-cultural and economic valuation. Ecosyst. Serv. 2016, 22, 297–308. [Google Scholar] [CrossRef]
  15. Gómez-Baggethun, E.; Martín-López, B. Ecological economics perspectives on ecosystem services valuation. In Handbook of Ecological Economics; Martinez-Alier, J., Muradian, R., Eds.; Edward Elgar: Cheltenham, UK, 2015; pp. 260–282. [Google Scholar]
  16. Loc, H.H.; Thi Hong Diep, N.; Can, N.T.; Irvine, K.N.; Shimizu, Y. Integrated evaluation of Ecosystem Services in Prawn-Rice rotational crops, Vietnam. Ecosyst. Serv. 2017, 26, 377–387. [Google Scholar] [CrossRef]
  17. Seppelt, R.; Dormann, C.F.; Eppink, F.V.; Lautenbach, S.; Schmidt, S. A quantitative review of ecosystem service studies: Approaches, shortcomings and the road ahead. J. Appl. Ecol. 2011, 48, 630–636. [Google Scholar] [CrossRef]
  18. Braat, L.C.; de Groot, R. The ecosystem services agenda: Bridging the worlds of natural science and economics, conservation and development, and public and private policy. Ecosyst. Serv. 2012, 1, 4–15. [Google Scholar] [CrossRef] [Green Version]
  19. de Groot, R.; Brander, L.; van der Ploeg, S.; Costanza, R.; Bernard, F.; Braat, L.; Christie, M.; Crossman, N.; Ghermandi, A.; Hein, L.; et al. Global estimates of the value of ecosystems and their services in monetary units. Ecosyst. Serv. 2012, 1, 50–61. [Google Scholar] [CrossRef]
  20. Nieto-Romero, M.; Oteros-Rozas, E.; González, J.A.; Martín-López, B. Exploring the knowledge landscape of ecosystem services assessments in Mediterranean agroecosystems: Insights for future research. Environ. Sci. Policy 2014, 37, 121–133. [Google Scholar] [CrossRef]
  21. Martín-López, B.; Iniesta-Arandia, I.; García-Llorente, M.; Palomo, I.; Casado-Arzuaga, I.; Amo, D.G.D.; Gómez-Baggethun, E.; Oteros-Rozas, E.; Palacios-Agundez, I.; Willaarts, B.; et al. Uncovering Ecosystem Service Bundles through Social Preferences. PLoS ONE 2012, 7, e38970. [Google Scholar] [CrossRef] [Green Version]
  22. Iniesta-Arandia, I.; García-Llorente, M.; Aguilera, P.A.; Montes, C.; Martín-López, B. Socio-cultural valuation of ecosystem services: Uncovering the links between values, drivers of change, and human well-being. Ecol. Econ. 2014, 108, 36–48. [Google Scholar] [CrossRef]
  23. Oteros-Rozas, E.; Martín-López, B.; González, J.A.; Plieninger, T.; López, C.A.; Montes, C. Socio-cultural valuation of ecosystem services in a transhumance social-ecological network. Reg. Environ. Chang. 2014, 14, 1269–1289. [Google Scholar] [CrossRef]
  24. Sandifer, P.A.; Sutton-Grier, A.E.; Ward, B.P. Exploring connections among nature, biodiversity, ecosystem services, and human health and well-being: Opportunities to enhance health and biodiversity conservation. Ecosyst. Serv. 2015, 12, 1–15. [Google Scholar] [CrossRef] [Green Version]
  25. Camps-Calvet, M.; Langemeyer, J.; Calvet-Mir, L.; Gómez-Baggethun, E. Ecosystem services provided by urban gardens in Barcelona, Spain: Insights for policy and planning. Environ. Sci. Policy 2016, 62, 14–23. [Google Scholar] [CrossRef]
  26. Sherrouse, B.C.; Semmens, D.J.; Ancona, Z.H.; Brunner, N.M. Analyzing land-use change scenarios for trade-offs among cultural ecosystem services in the Southern Rocky Mountains. Ecosyst. Serv. 2017, 26, 431–444. [Google Scholar] [CrossRef]
  27. Swetnam, R.D.; Harrison-Curran, S.K.; Smith, G.R. Quantifying visual landscape quality in rural Wales: A GIS-enabled method for extensive monitoring of a valued cultural ecosystem service. Ecosyst. Serv. 2017, 26, 451–464. [Google Scholar] [CrossRef]
  28. Russell, R.; Guerry, A.D.; Balvanera, P.; Gould, R.K.; Basurto, X.; Chan, K.M.A.; Klain, S.; Levine, J.; Tam, J. Humans and Nature: How Knowing and Experiencing Nature Affect Well-Being. Annu. Rev. Environ. Resour. 2013, 38, 473–502. [Google Scholar] [CrossRef]
  29. Norgaard, R.B. Ecosystem services: From eye-opening metaphor to complexity blinder. Ecol. Econ. 2010, 69, 1219–1227. [Google Scholar] [CrossRef]
  30. Bieling, C.; Plieninger, T.; Pirker, H.; Vogl, C.R. Linkages between landscapes and human well-being: An empirical exploration with short interviews. Ecol. Econ. 2014, 105, 19–30. [Google Scholar] [CrossRef] [Green Version]
  31. Kelemen, E.; García-Llorente, M.; Pataki, G. Non-monetary techniques for the valuation of ecosystem services. In OpenNESS Reference Book; Potschin, M., Jax, K., Eds.; EC FP7 Grant Agreement No. 308428; Available online: http://www.openness-project.eu/library/reference-book/sp-non-monetary-valuation (accessed on 16 September 2020).
  32. Scholte, S.S.K.; van Teeffelen, A.J.A.; Verburg, P.H. Integrating socio-cultural perspectives into ecosystem service valuation: A review of concepts and methods. Ecol. Econ. 2015, 114, 67–78. [Google Scholar] [CrossRef]
  33. Quintas-Soriano, C.; Brandt, J.; Running, K.; Baxter, C.; Gibson, D.; Narducci, J.; Castro, A. Social-ecological systems influence ecosystem service perception: A Programme on Ecosystem Change and Society (PECS) analysis. Ecol. Soc. 2018, 23. [Google Scholar] [CrossRef] [Green Version]
  34. Castro, A.J.; Quintas-Soriano, C.; Egoh, B.N. Ecosystem services in dryland systems of the world. J. Arid Environ. 2018, 159, 1–3. [Google Scholar] [CrossRef]
  35. Edwards, D.; Jay, M.; Jensen, F.; Lucas, B.; Marzano, M.; Montagné, C.; Peace, A.; Weiss, G. Public Preferences Across Europe for Different Forest Stand Types as Sites for Recreation. Ecol. Soc. 2012, 17. [Google Scholar] [CrossRef]
  36. van Zanten, B.T.; Verburg, P.H.; Koetse, M.J.; van Beukering, P.J.H. Preferences for European agrarian landscapes: A meta-analysis of case studies. Landsc. Urban Plan. 2014, 132, 89–101. [Google Scholar] [CrossRef] [Green Version]
  37. Fagerholm, N.; Torralba, M.; Burgess, P.J.; Plieninger, T. A systematic map of ecosystem services assessments around European agroforestry. Ecol. Indic. 2016, 62, 47–65. [Google Scholar] [CrossRef]
  38. Torralba, M.; Oteros-Rozas, E.; Moreno, G.; Plieninger, T. Exploring the Role of Management in the Coproduction of Ecosystem Services from Spanish Wooded Rangelands. Rangel. Ecol. Manag. 2018, 71, 549–559. [Google Scholar] [CrossRef]
  39. Spanish National Ecosystem Assessment. Ecosystems and Biodiversity for Human Wellbeing. Synthesis of the Key Findings; Biodiversity Foundation of the Spanish Ministry of Agriculture, Food and Environment: Madrid, Spain, 2013; p. 90. [Google Scholar]
  40. Oteros-Rozas, E.; González, J.A.; Martín-López, B.; López, C.A.; Zorrilla-Miras, P.; Montes, C. Evaluating Ecosystem Services in Transhumance Cultural Landscapes An Interdisciplinary and Participatory Framework. GAIA Ecol. Perspect. Sci. Soc. 2012, 21, 185–193. [Google Scholar] [CrossRef]
  41. García-Llorente, M.; Harrison, P.A.; Berry, P.; Palomo, I.; Gómez-Baggethun, E.; Iniesta-Arandia, I.; Montes, C.; del Amo, D.G.; Martín-López, B. What can conservation strategies learn from the ecosystem services approach? Insights from ecosystem assessments in two Spanish protected areas. Biodivers. Conserv. 2016, 1–23. [Google Scholar] [CrossRef] [Green Version]
  42. Gómez-Ortiz, A.; Oliva, M.; Salvà-Catarineu, M.; Salvador-Franch, F. The environmental protection of landscapes in the high semiarid Mediterranean mountain of Sierra Nevada National Park (Spain): Historical evolution and future perspectives. Appl. Geogr. 2013, 42, 227–239. [Google Scholar] [CrossRef]
  43. Serrano, L. The aquatic systems of Doñana (SW Spain): Watersheds and frontiers. Limnetica 2005, 25, 11–32. [Google Scholar]
  44. Kelemen, E.; Barton, D.; Jacobs, S.; Martín-López, B.; Saarikoski, H.; Termansen, M.; Bela, G.; Braat, L.; Demeyer, R.; García-Llorente, M.; et al. Preliminary Guidelines for Integrated Assessment and Valuation of Ecosystem Services in Specific Policy Contexts EU FP7 OpenNESS Project Deliverable 4.3; European Commission FP7: Bruxelles, Belgium, 2015. [Google Scholar]
  45. Shannon, C.E. A mathematical theory of communication. Bell Syst. Tech. J. 1948, 27, 379–423. [Google Scholar] [CrossRef] [Green Version]
  46. Raudsepp-Hearne, C.; Peterson, G.D.; Bennett, E.M. Ecosystem service bundles for analyzing tradeoffs in diverse landscapes. Proc. Natl. Acad. Sci. USA 2010, 107, 5242–5247. [Google Scholar] [CrossRef] [Green Version]
  47. Klain, S.C.; Satterfield, T.A.; Chan, K.M.A. What matters and why? Ecosystem services and their bundled qualities. Ecol. Econ. 2014, 107, 310–320. [Google Scholar] [CrossRef]
  48. Gould, R.K.; Klain, S.C.; Ardoin, N.M.; Satterfield, T.; Woodside, U.; Hannahs, N.; Daily, G.C.; Chan, K.M. A protocol for eliciting nonmaterial values through a cultural ecosystem services frame. Conserv. Biol. 2015, 29, 575–586. [Google Scholar] [CrossRef]
  49. Martín-López, B.; Gómez-Baggethun, E.; García-Llorente, M.; Montes, C. Trade-offs across value-domains in ecosystem services assessment. Ecol. Indic. 2014, 37, 220–228. [Google Scholar] [CrossRef]
  50. Jacobs, M. Environmental valuation, deliberative democracy and public decision-making institutions. In Valuing Nature Ethics, Economics and the Environment? Foster, J., Ed.; Routledge: Abingdon, UK, 1997; pp. 211–231. ISBN 978-0-415-14875-7. [Google Scholar]
  51. Vatn, A. Rationality, institutions and environmental policy. Ecol. Econ. 2005, 55, 203–217. [Google Scholar] [CrossRef]
  52. García-Llorente, M.; Castro, A.J.; Quintas-Soriano, C.; López, I.; Castro, H.; Montes, C.; Martín-López, B. The value of time in biological conservation and supplied ecosystem services: A willingness to give up time exercise. J. Arid Environ. 2016, 124, 13–21. [Google Scholar] [CrossRef]
  53. Banzhaf, H.S.; Boyd, J. The Architecture and Measurement of an Ecosystem Services Index. Sustainability 2012, 4, 430–461. [Google Scholar] [CrossRef] [Green Version]
  54. Paruelo, J.M.; Texeira, M.; Staiano, L.; Mastrángelo, M.; Amdan, L.; Gallego, F. An integrative index of Ecosystem Services provision based on remotely sensed data. Ecol. Indic. 2016, 71, 145–154. [Google Scholar] [CrossRef] [Green Version]
  55. Rodríguez-Loinaz, G.; Alday, J.G.; Onaindia, M. Multiple ecosystem services landscape index: A tool for multifunctional landscapes conservation. J. Environ. Manag. 2015, 147, 152–163. [Google Scholar] [CrossRef]
  56. Martín-López, B.; Oteros-Rozas, E.; Cohen-Shacham, E.; Santos-Martín, F.; Nieto-Romero, M.; Carvalho-Santos, C.; González, J.A.; García-Llorente, M.; Klass, K.; Geijzendorffer, I.; et al. Ecosystem services supplied by Mediterranean Basin. In Routledge Handbook of Ecosystem Services; Potschin, M., Haines-Young, R., Fish, R., Turner, R., Eds.; Routledge: Abingdon, UK, 2014; pp. 405–414. [Google Scholar]
  57. Gómez-Baggethun, E.; Mingorría, S.; Reyes-García, V.; Calvet, L.; Montes, C. Traditional Ecological Knowledge Trends in the Transition to a Market Economy: Empirical Study in the Doñana Natural Areas. Conserv. Biol. 2010, 24, 721–729. [Google Scholar] [CrossRef]
  58. Calvet-Mir, L.; Gómez-Baggethun, E.; Reyes-García, V. Beyond food production: Ecosystem services provided by home gardens. A case study in Vall Fosca, Catalan Pyrenees, Northeastern Spain. Ecol. Econ. 2012, 74, 153–160. [Google Scholar] [CrossRef]
  59. Camps-Calvet, M.; Langemeyer, J.; Calvet-Mir, L.; Gomez-Baggethun, E.; March, H. Sowing resilience and contestation in times of crises: The case of urban gardening movements in Barcelona. Partecip. Confl. 2015, 8, 417–442. [Google Scholar] [CrossRef]
  60. Elmqvist, T.; Setälä, H.; Handel, S.; van der Ploeg, S.; Aronson, J.; Blignaut, J.; Gómez-Baggethun, E.; Nowak, D.; Kronenberg, J.; de Groot, R. Benefits of restoring ecosystem services in urban areas. Curr. Opin. Environ. Sustain. 2015, 14, 101–108. [Google Scholar] [CrossRef] [Green Version]
  61. Simon Rojo, M.; Moratalla, A.Z.; Alonso, N.M.; Jimenez, V.H. Pathways towards the integration of periurban agrarian ecosystems into the spatial planning system. Ecol. Process. 2014, 3, 13. [Google Scholar] [CrossRef] [Green Version]
  62. Vidal-Abarca, M.R.; Santos-Martín, F.; Martín-López, B.; Sánchez-Montoya, M.M.; Suárez Alonso, M.L. Exploring the Capacity of Water Framework Directive Indices to Assess Ecosystem Services in Fluvial and Riparian Systems: Towards a Second Implementation Phase. Environ. Manag. 2016, 57, 1139–1152. [Google Scholar] [CrossRef] [PubMed]
  63. Pyle, R.M. The extinction of experience. Horticulture 1978, 56, 64–67. [Google Scholar]
  64. Miller, J.R. Biodiversity conservation and the extinction of experience. Trends Ecol. Evol. 2005, 20, 430–434. [Google Scholar] [CrossRef] [PubMed]
  65. Casado-Arzuaga, I.; Madariaga, I.; Onaindia, M. Perception, demand and user contribution to ecosystem services in the Bilbao Metropolitan Greenbelt. J. Environ. Manag. 2013, 129, 33–43. [Google Scholar] [CrossRef]
  66. Quintas-Soriano, C.; Castro, A.J.; Castro, H.; García-Llorente, M. Impacts of land use change on ecosystem services and implications for human well-being in Spanish drylands. Land Use Policy 2016, 54, 534–548. [Google Scholar] [CrossRef]
  67. Langemeyer, J.; Camps-Calvet, M.; Calvet-Mir, L.; Barthel, S.; Gómez-Baggethun, E. Stewardship of urban ecosystem services: Understanding the value(s) of urban gardens in Barcelona. Lands. Urban Plan. 2018, 170, 79–89. [Google Scholar] [CrossRef] [Green Version]
  68. Forster Milan Urban Food Policy Pact. Selected Good Practices from Cities. Available online: http://fondazionefeltrinelli.it/schede/ebook-utopie-milan-urban-food-policy-pact/ (accessed on 22 July 2020).
  69. Opdam, P.; Albert, C.; Fürst, C.; Grêt-Regamey, A.; Kleemann, J.; Parker, D.; Rosa, D.L.; Schmidt, K.; Villamor, G.B.; Walz, A. Ecosystem services for connecting actors–lessons from a symposium. Chang. Adapt. Socio Ecol. Syst. 2015, 1. [Google Scholar] [CrossRef]
  70. Daily, G.C.; Polasky, S.; Goldstein, J.; Kareiva, P.M.; Mooney, H.A.; Pejchar, L.; Ricketts, T.H.; Salzman, J.; Shallenberger, R. Ecosystem services in decision making: Time to deliver. Front. Ecol. Environ. 2009, 7, 21–28. [Google Scholar] [CrossRef] [Green Version]
  71. Tengberg, A.; Fredholm, S.; Eliasson, I.; Knez, I.; Saltzman, K.; Wetterberg, O. Cultural ecosystem services provided by landscapes: Assessment of heritage values and identity. Ecosyst. Serv. 2012, 2, 14–26. [Google Scholar] [CrossRef]
  72. Armas, C.; Miranda, J.D.; Padilla, F.M.; Pugnaire, F.I. Special issue: The Iberian Southeast. J. Arid Environ. 2011, 75, 1241–1243. [Google Scholar] [CrossRef]
  73. Zorrilla-Miras, P.; Palomo, I.; Gómez-Baggethun, E.; Martín-López, B.; Lomas, P.L.; Montes, C. Effects of land-use change on wetland ecosystem services: A case study in the Doñana marshes (SW Spain). Landsc. Urban Plan. 2014, 122, 160–174. [Google Scholar] [CrossRef]
  74. Gómez-Baggethun, E.; Reyes-García, V.; Olsson, P.; Montes, C. Traditional ecological knowledge and community resilience to environmental extremes: A case study in Doñana, SW Spain. Glob. Environ. Chang. 2012, 22, 640–650. [Google Scholar] [CrossRef]
  75. Alonso, N.M.; de Casadevante, J.L.F. A desalambrar. Agricultura urbana, huertos comunitarios y regulación urbanística. Hábitat Soc. 2014, 7. [Google Scholar] [CrossRef]
Figure 1. Location of the eight study sites across ecosystem types in Spain.
Land 09 00330 g001
Figure 2. Social importance of ecosystem services (ES) categories (in % of respondents) in each ecosystem type: (a) provisioning, (b) regulating, (c) cultural. Differences in perceived importance among ecosystem types were identified by letters representing significantly different groups as identified by the Dunn test at p-value < 0.05.
Land 09 00330 g002
Figure 3. Scatter plot representing the social importance of ecosystem services (ES) (mean number of ES recognized per person) and the ES diversity index (ESDI) per ecosystem type. The bubble size indicates the percentage (%) of respondents who named at least one example of ES.
Land 09 00330 g003
Figure 4. Redundancy analysis (RDA) biplot showing the relationships between social perceptions towards ecosystem services (ES) and variables related to biophysical, socio-demographic and institutional factors.
Land 09 00330 g004
Table 1. Main characteristics of sites and data sampling characteristics in each case study. The total area is expressed in km2. Population density (pop density) is expressed in inhabitants/km. N° of Muni: N° of municipalities.
Characteristics of the Case StudyData Sampling Characteristics
SiteTotal areaMain EcosystemsLand Use CoversLevel of ProtectionN° of MuniPop DensitySampling PointsDateSample Size (N)
Bilbao Metropolitan Greenbelt408Urban
Forests
33% urban
24% agriculture
19% scrublands
18% forest
None292281.8523May 2009/July 2010409
Da Morte coast1606Coastal
Agroecosystems
33% forest
28% scrublands
16% agriculture
14% open lands
6% urban
None17111.687Sep 2008212
Conquense Drove Road15297Agroecosystems 53% agriculture
27% scrublands
14% forest
There are 5 natural parks along its extent1947.3239Sep 2009/March 2010112
Doñana wetland3713Wetlands
Coastal
Rivers and streams Forests
47% agriculture
17% forest
17% scrublands
9% water
7% urban
National park-1969
Natural park-1980
1678.8120Oct 2007/March 2009772
Guadiamar River green corridor2060Rivers and streams Agroecosystems63% agriculture
16% urban
10% scrublands
5% forests
5% water
Protected landscape-20031585.6910Oct 2008/March 2009211
Sierra Nevada Mediterranean mountains3655Mountains
Forests
Drylands
36% scrublands
34% agriculture
19% forest
Natural Park-1989
National Park-1999
73230.4459May 2009/July 2011657
Urban homegardens604Urban56% urban
23% agriculture
11% scrublands
9% forest
None12 1533720Dec 2012/May 2013158
Semiarid Spain12130Drylands40% agriculture
32% scrublands
18% urban
6% open lands
Cabo de Gata Natural park-1988160379.1826Feb to April 2012304
1 The Madrid municipality was subdivided into 12 districts.
Table 2. Main ecosystem services (ES) elicited in each study site (we have included those mentioned as important by at least 10% of the respondents in a particular ecosystem type; figures (in %) are presented in parentheses).
Ecosystem TypeProvisioningRegulatingCultural
Conquense Drove RoadFood from agriculture (31.0)
Livestock (29.6)
Timber (14.1)
Air quality (16.9)
Habitat for species (15.5)
Natural hazards prevention (11.3)
Recreational activities (17.6)
Aesthetic enjoyment (11.3)
Tranquillity and relaxation (11.3)
Sierra Nevada Mediterranean mountainFood from agriculture (41.5)
Food from livestock (25.1)
Freshwater (20.0)
Timber (17.4)
Forest harvesting (11.7)
Air quality (16.5)Recreational activities (32.9)
Tranquillity and relaxation (15.0)
Aesthetic enjoyment (11.7)
Semiarid SpainFood from agriculture (23.4)Climate regulation (15.1)Recreational activities (27.3)
Aesthetic enjoyment (13.2)
Doñana wetlandTraditional agriculture (13.5)
Fishing and shell fishing (10.4)
Habitat for species (16.7)
Air quality (11.5)
Recreational activities (27.1)
Aesthetic enjoyment (12.5)
Guadiamar River green corridorFood from agriculture (12.8)Habitat for species (10.0)Recreational activities (32.7)
Aesthetic enjoyment (19.0)
Bilbao Metropolitan GreenbeltFood from agriculture (16.1)Air quality (31.5)Recreational activities (25.4)
Aesthetic enjoyment (18.1)
Tranquillity and relaxation (11.9)
Da Morte coastFishing and shell fishing (56.5)-Recreational activities (47.7)
Tranquillity and relaxation (33.7)
Urban homegardensFood from agriculture (36.7)Air quality (22.2)Environmental education (81.6)
Recreational activities (72.2)
Local identity (46.2)
Tranquillity and relaxation (36.7)
Aesthetic enjoyment (31.0)

