Effects of Urbanization on Farmland Size and Diversified Farm Activities in Japan: An Analysis Based on the Land Parcel Database

Abstract
:
1. Introduction
2. Hypothesis
3. Methodology
3.1. Targeted Areas and Datasets
3.2. Analytical Process
4. Result
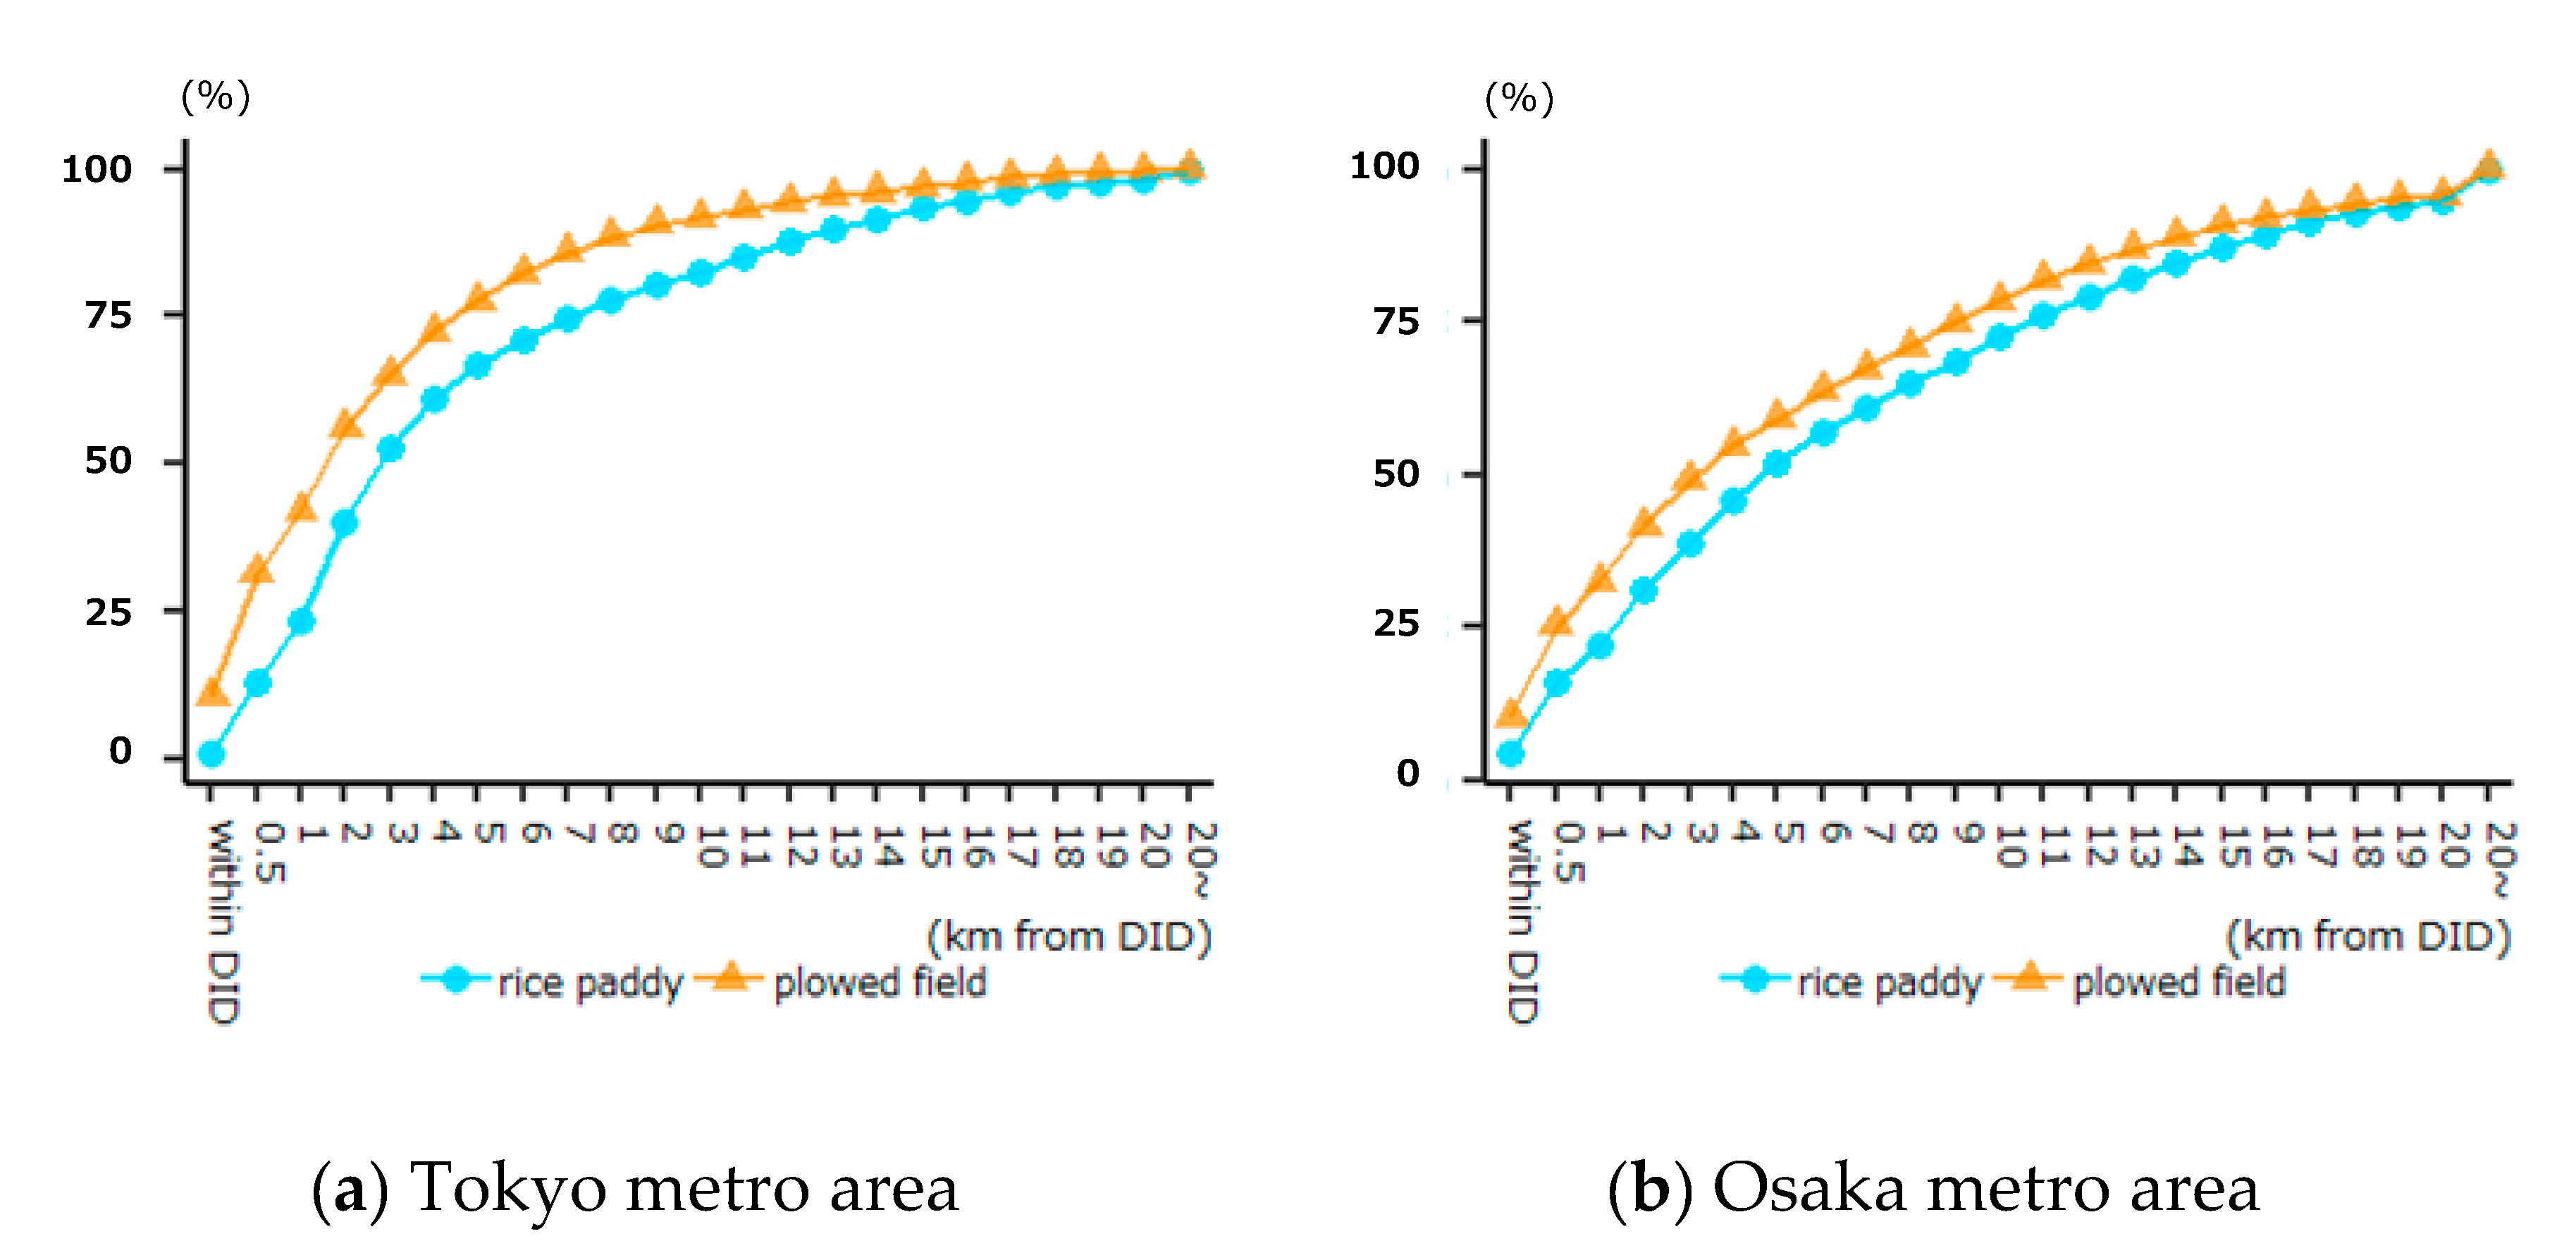
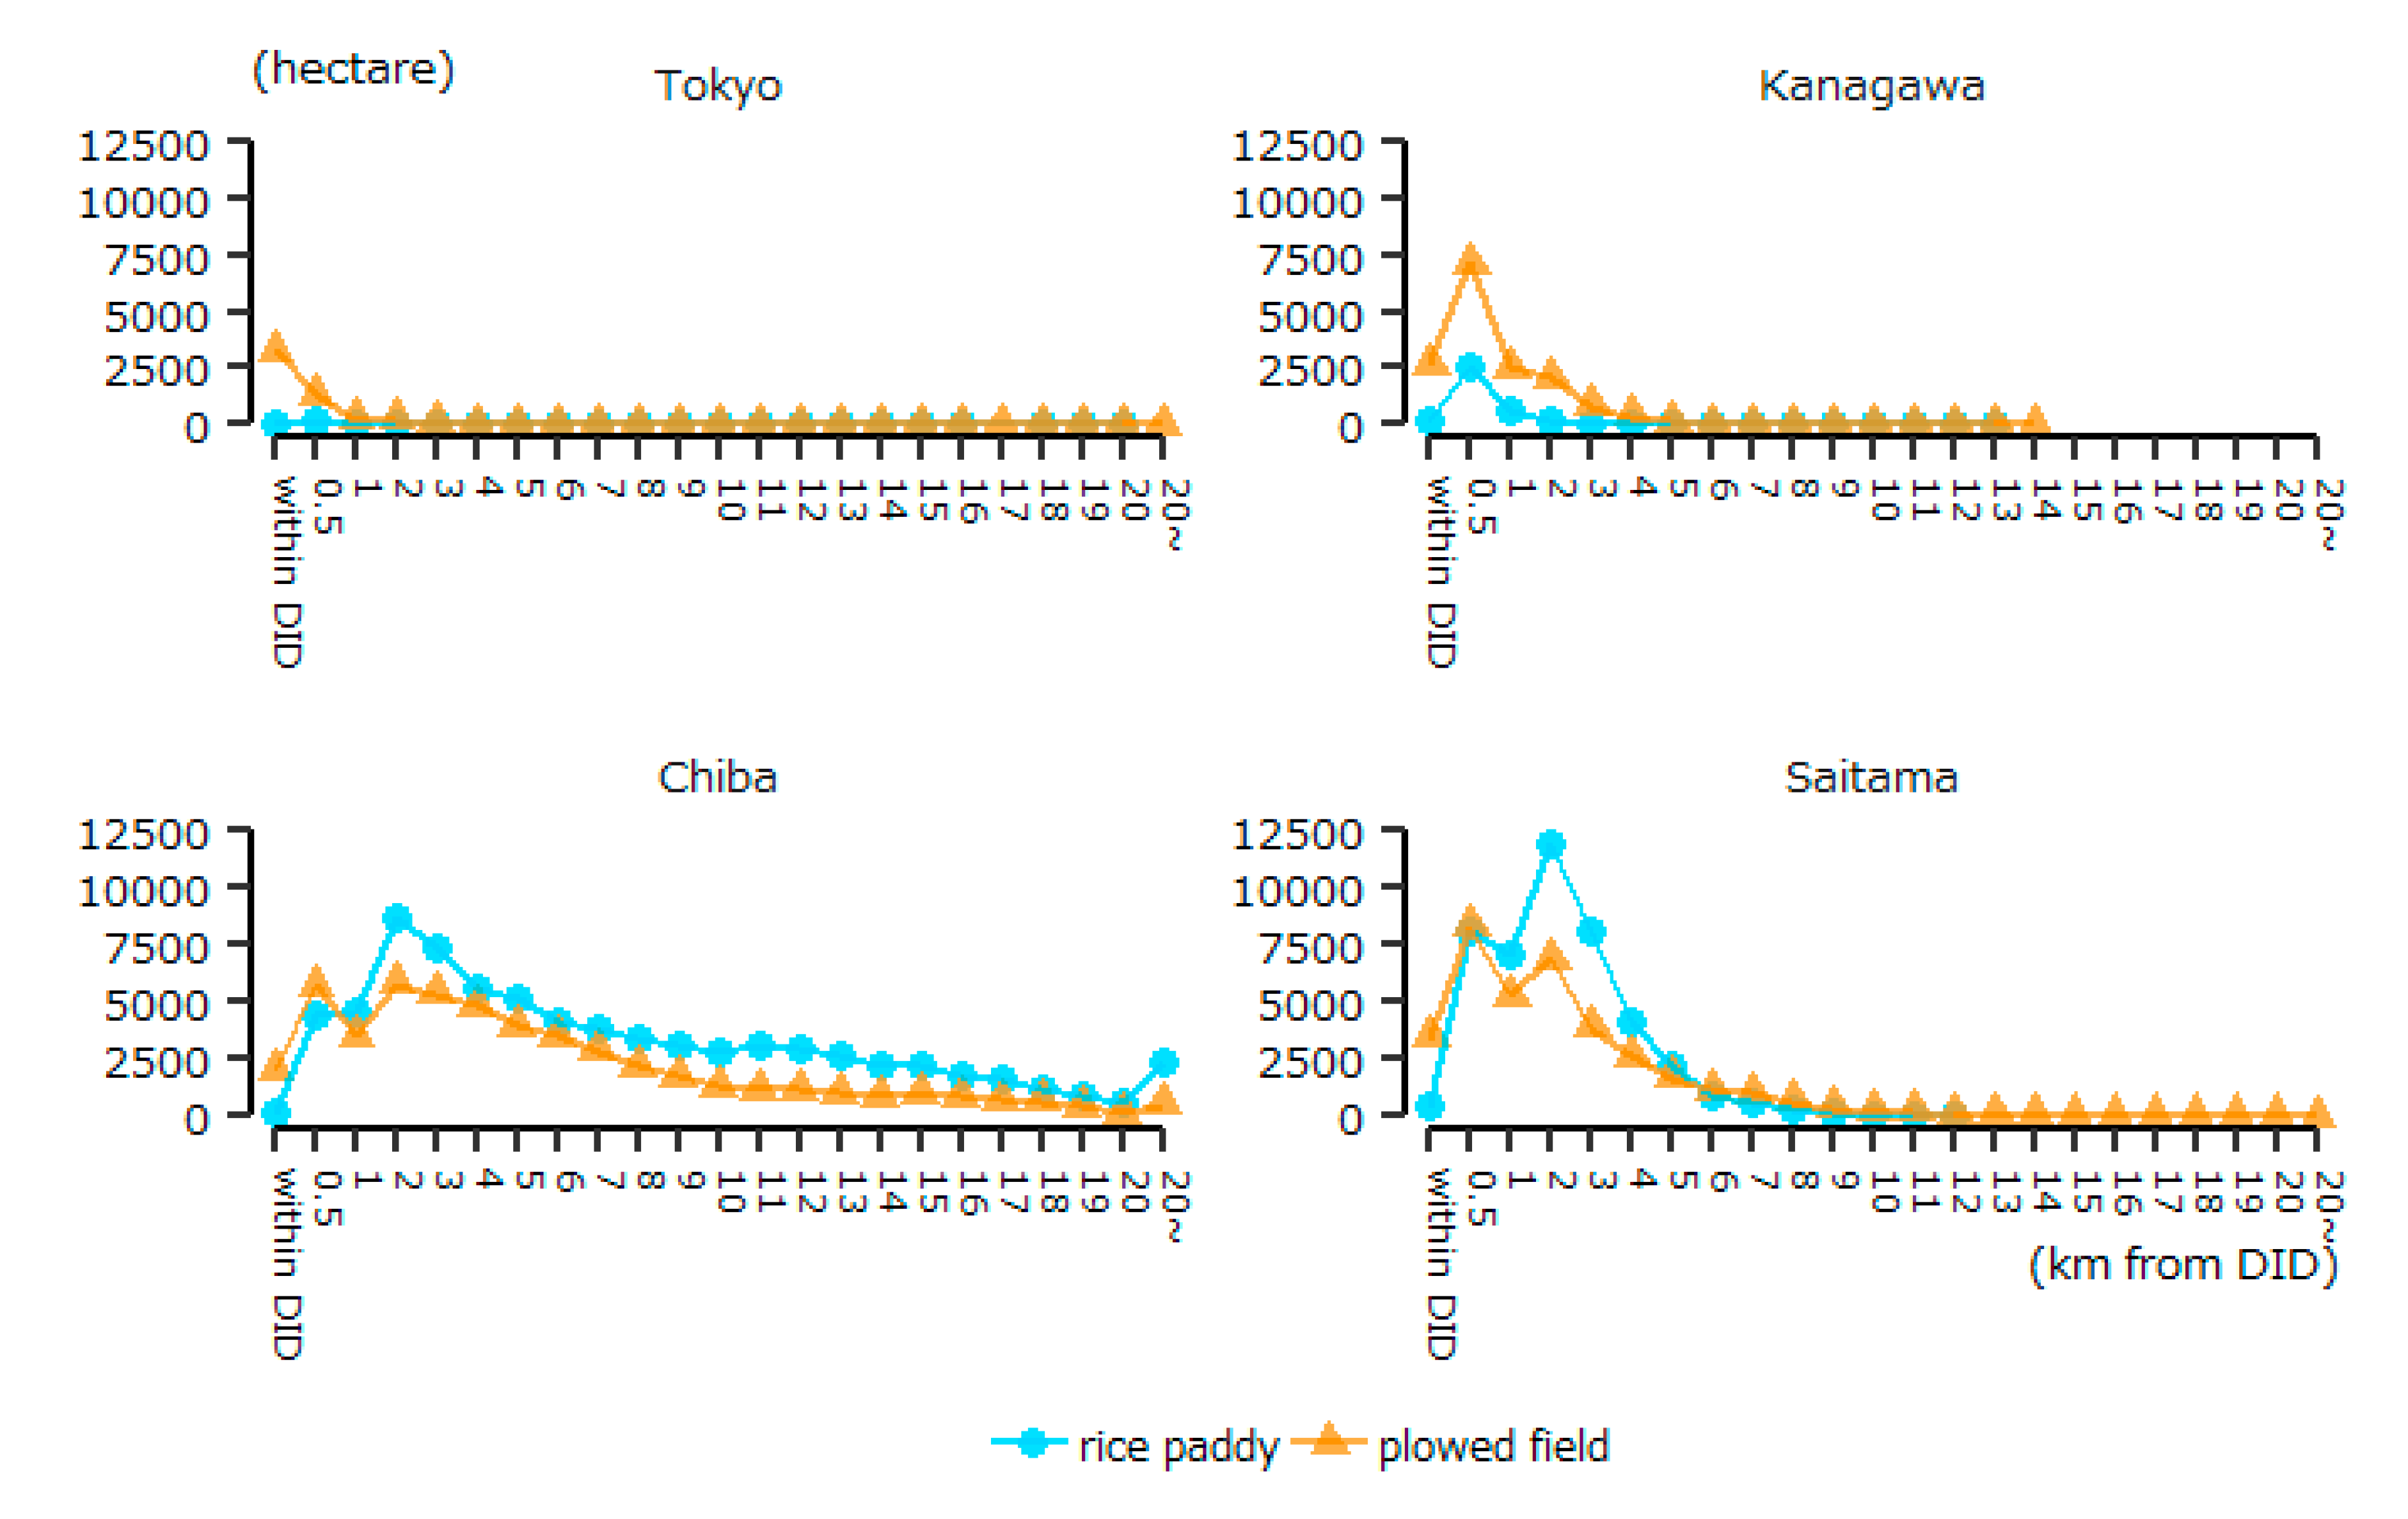
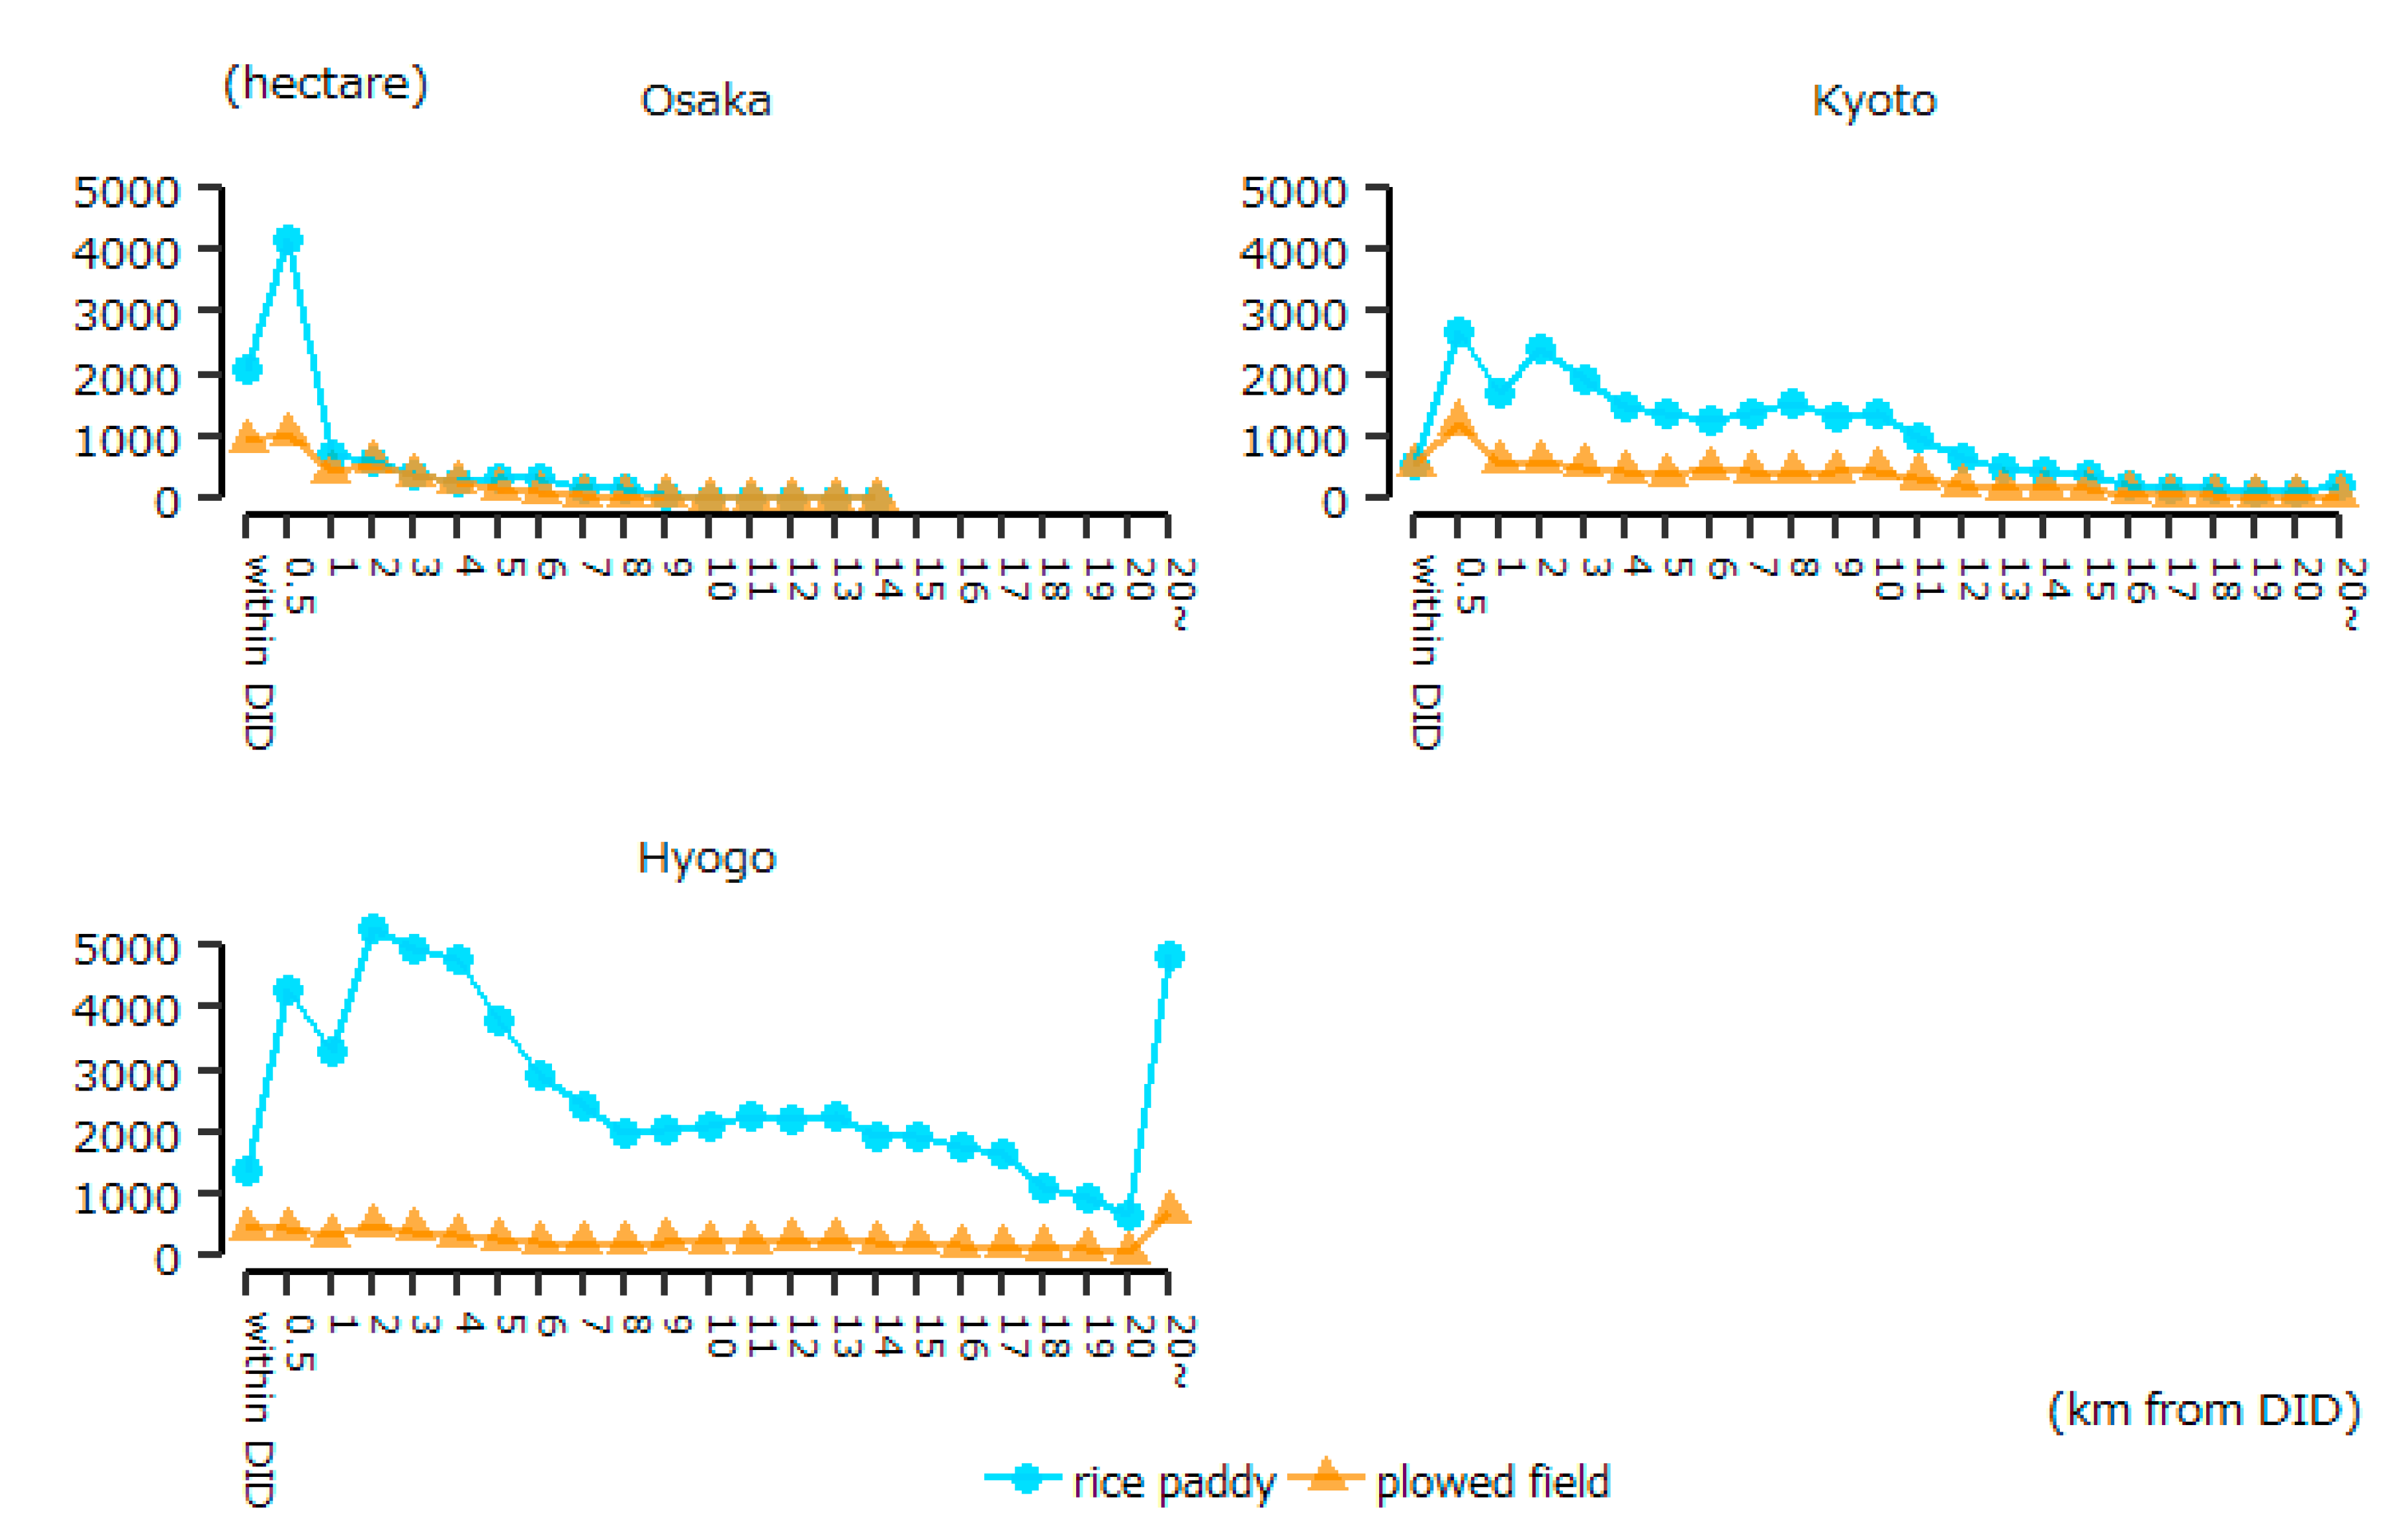
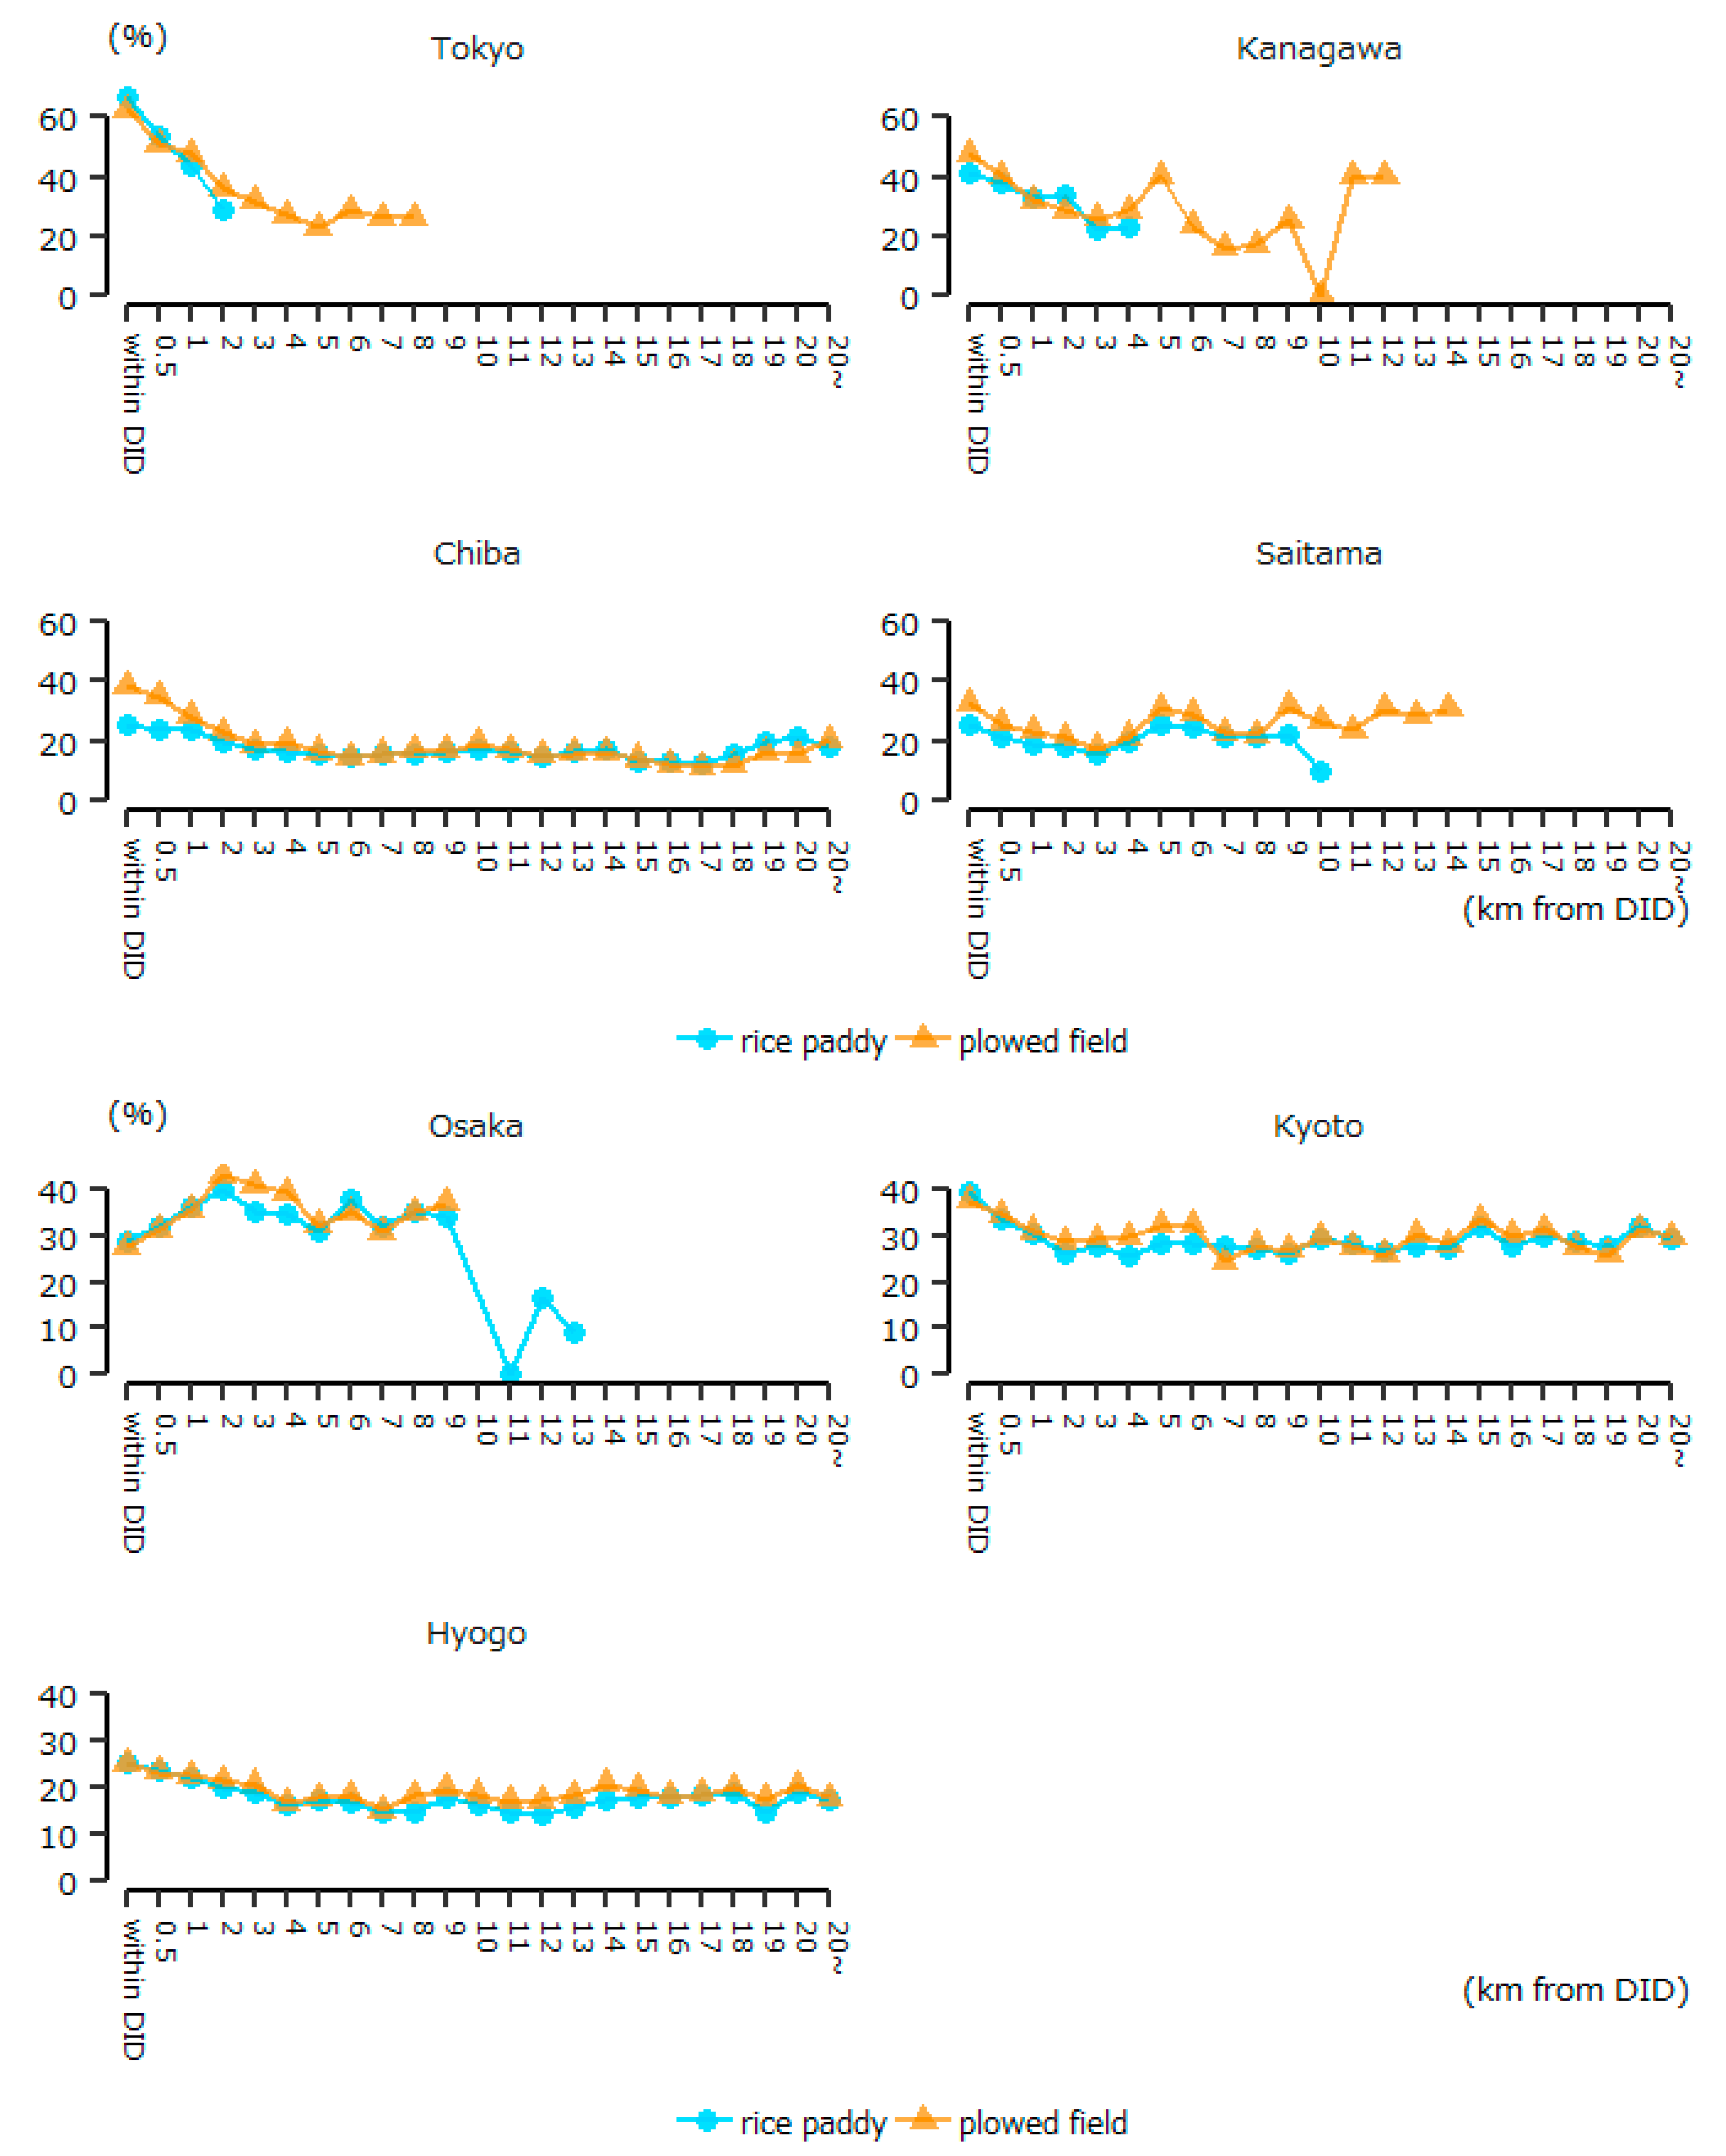
4.1. Spatial Distribution of Farmland Parcels
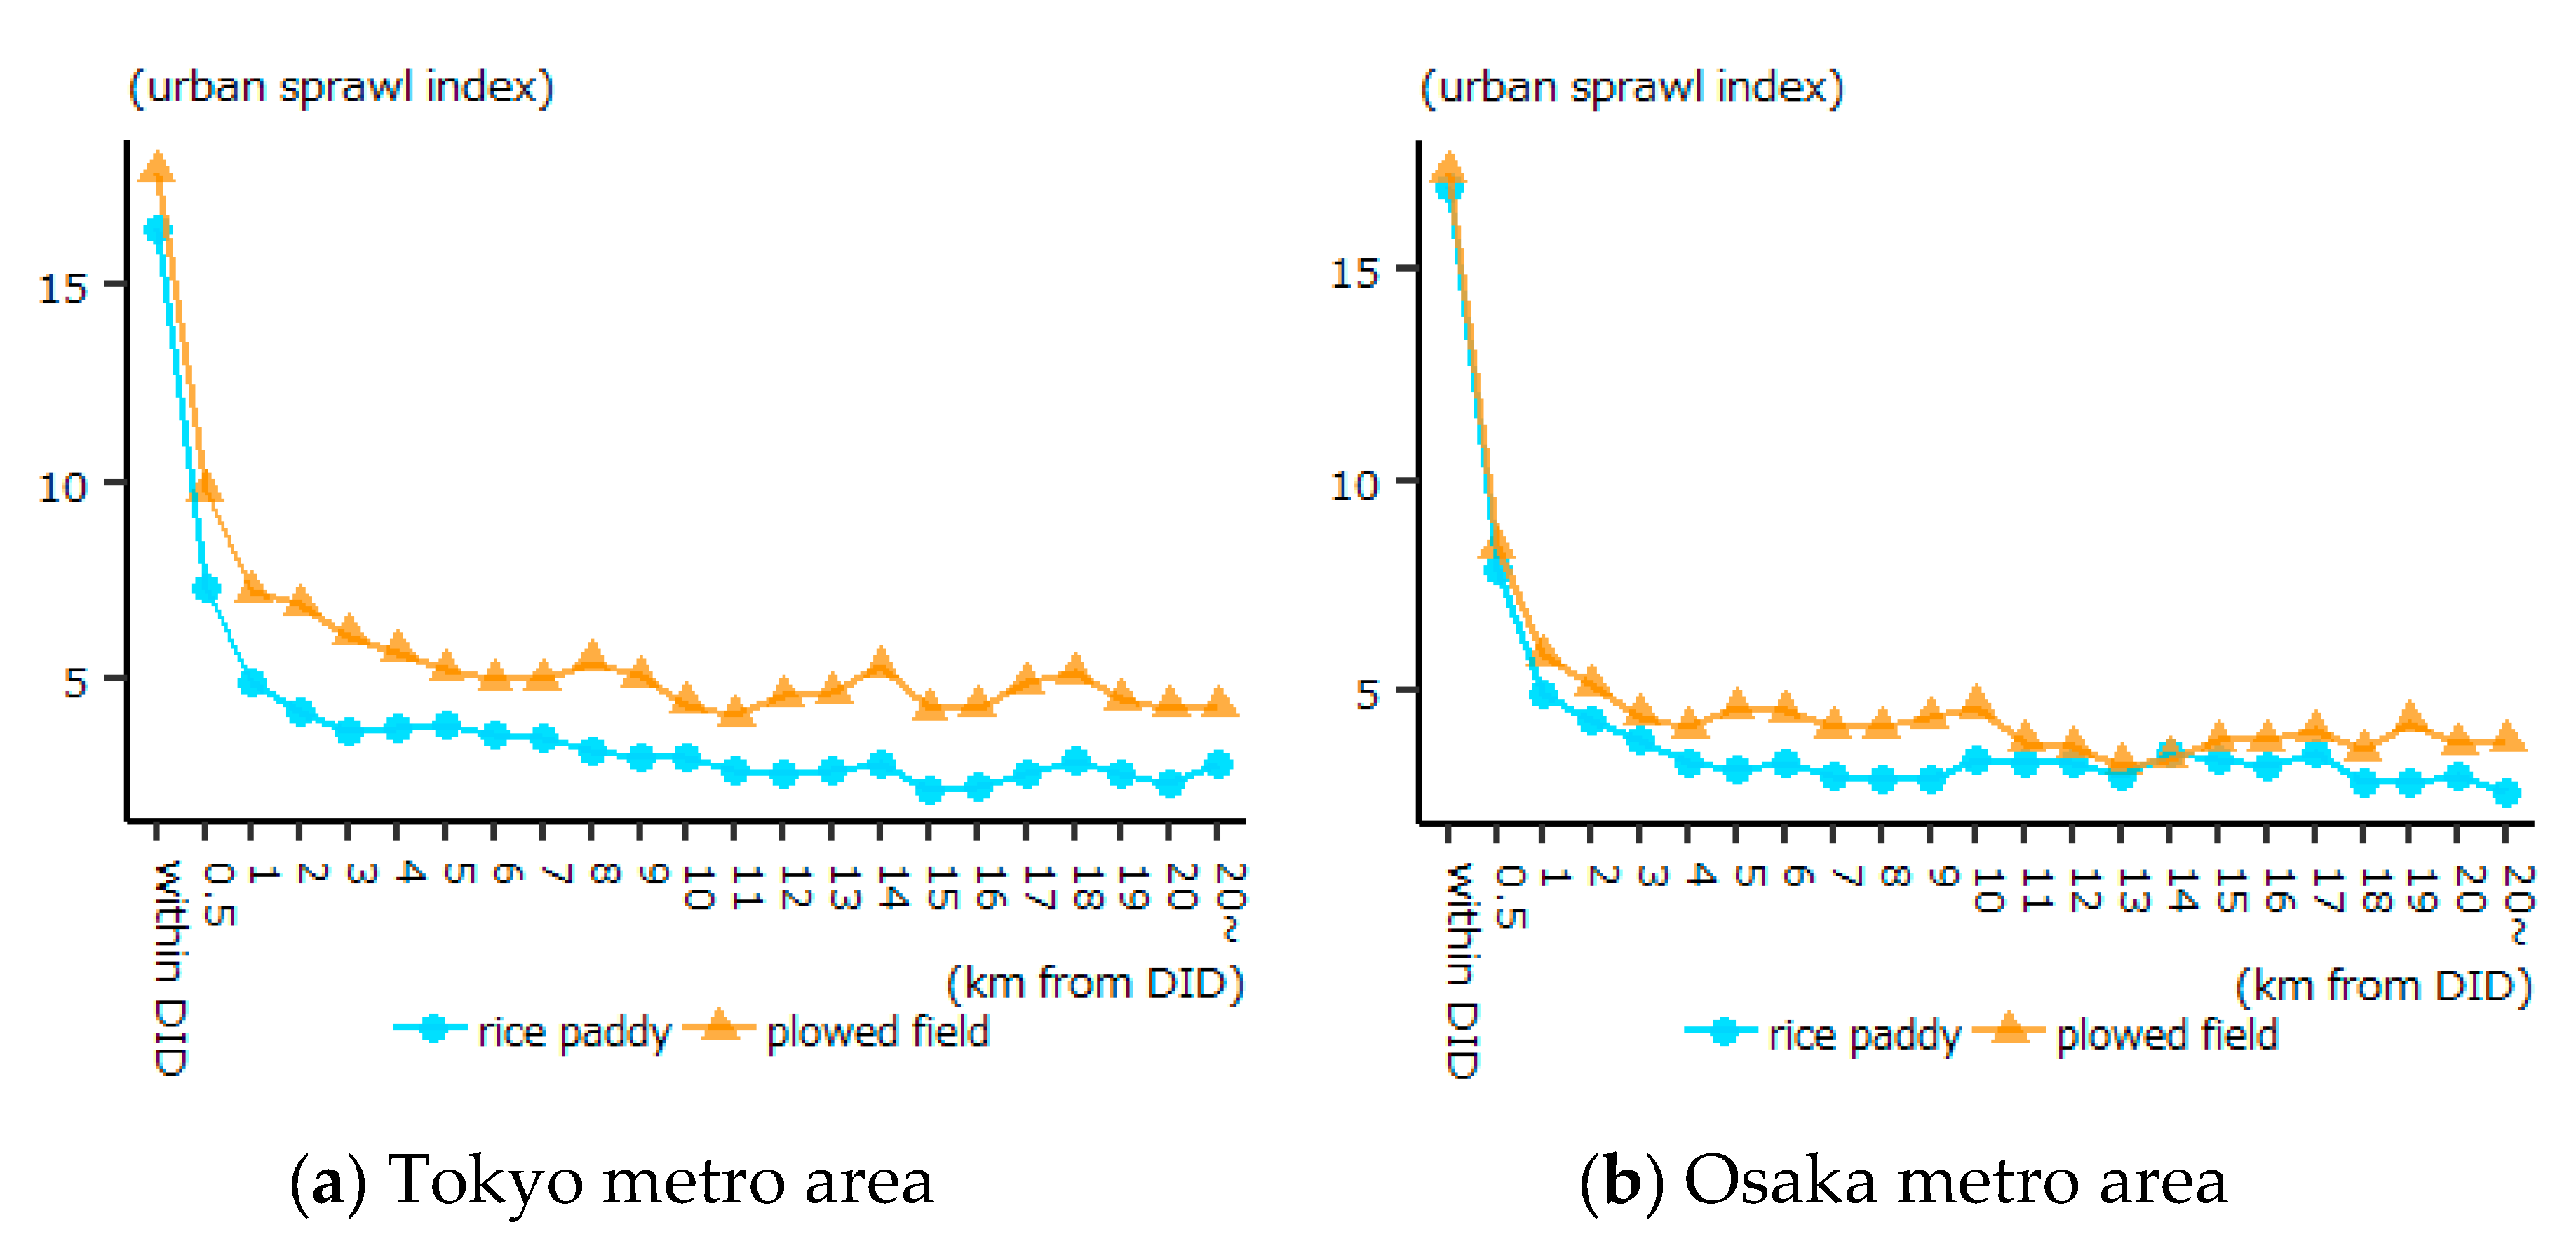
4.2. Urbanization and Farming
4.3. Effects of Urbanization on Farmland Parcels
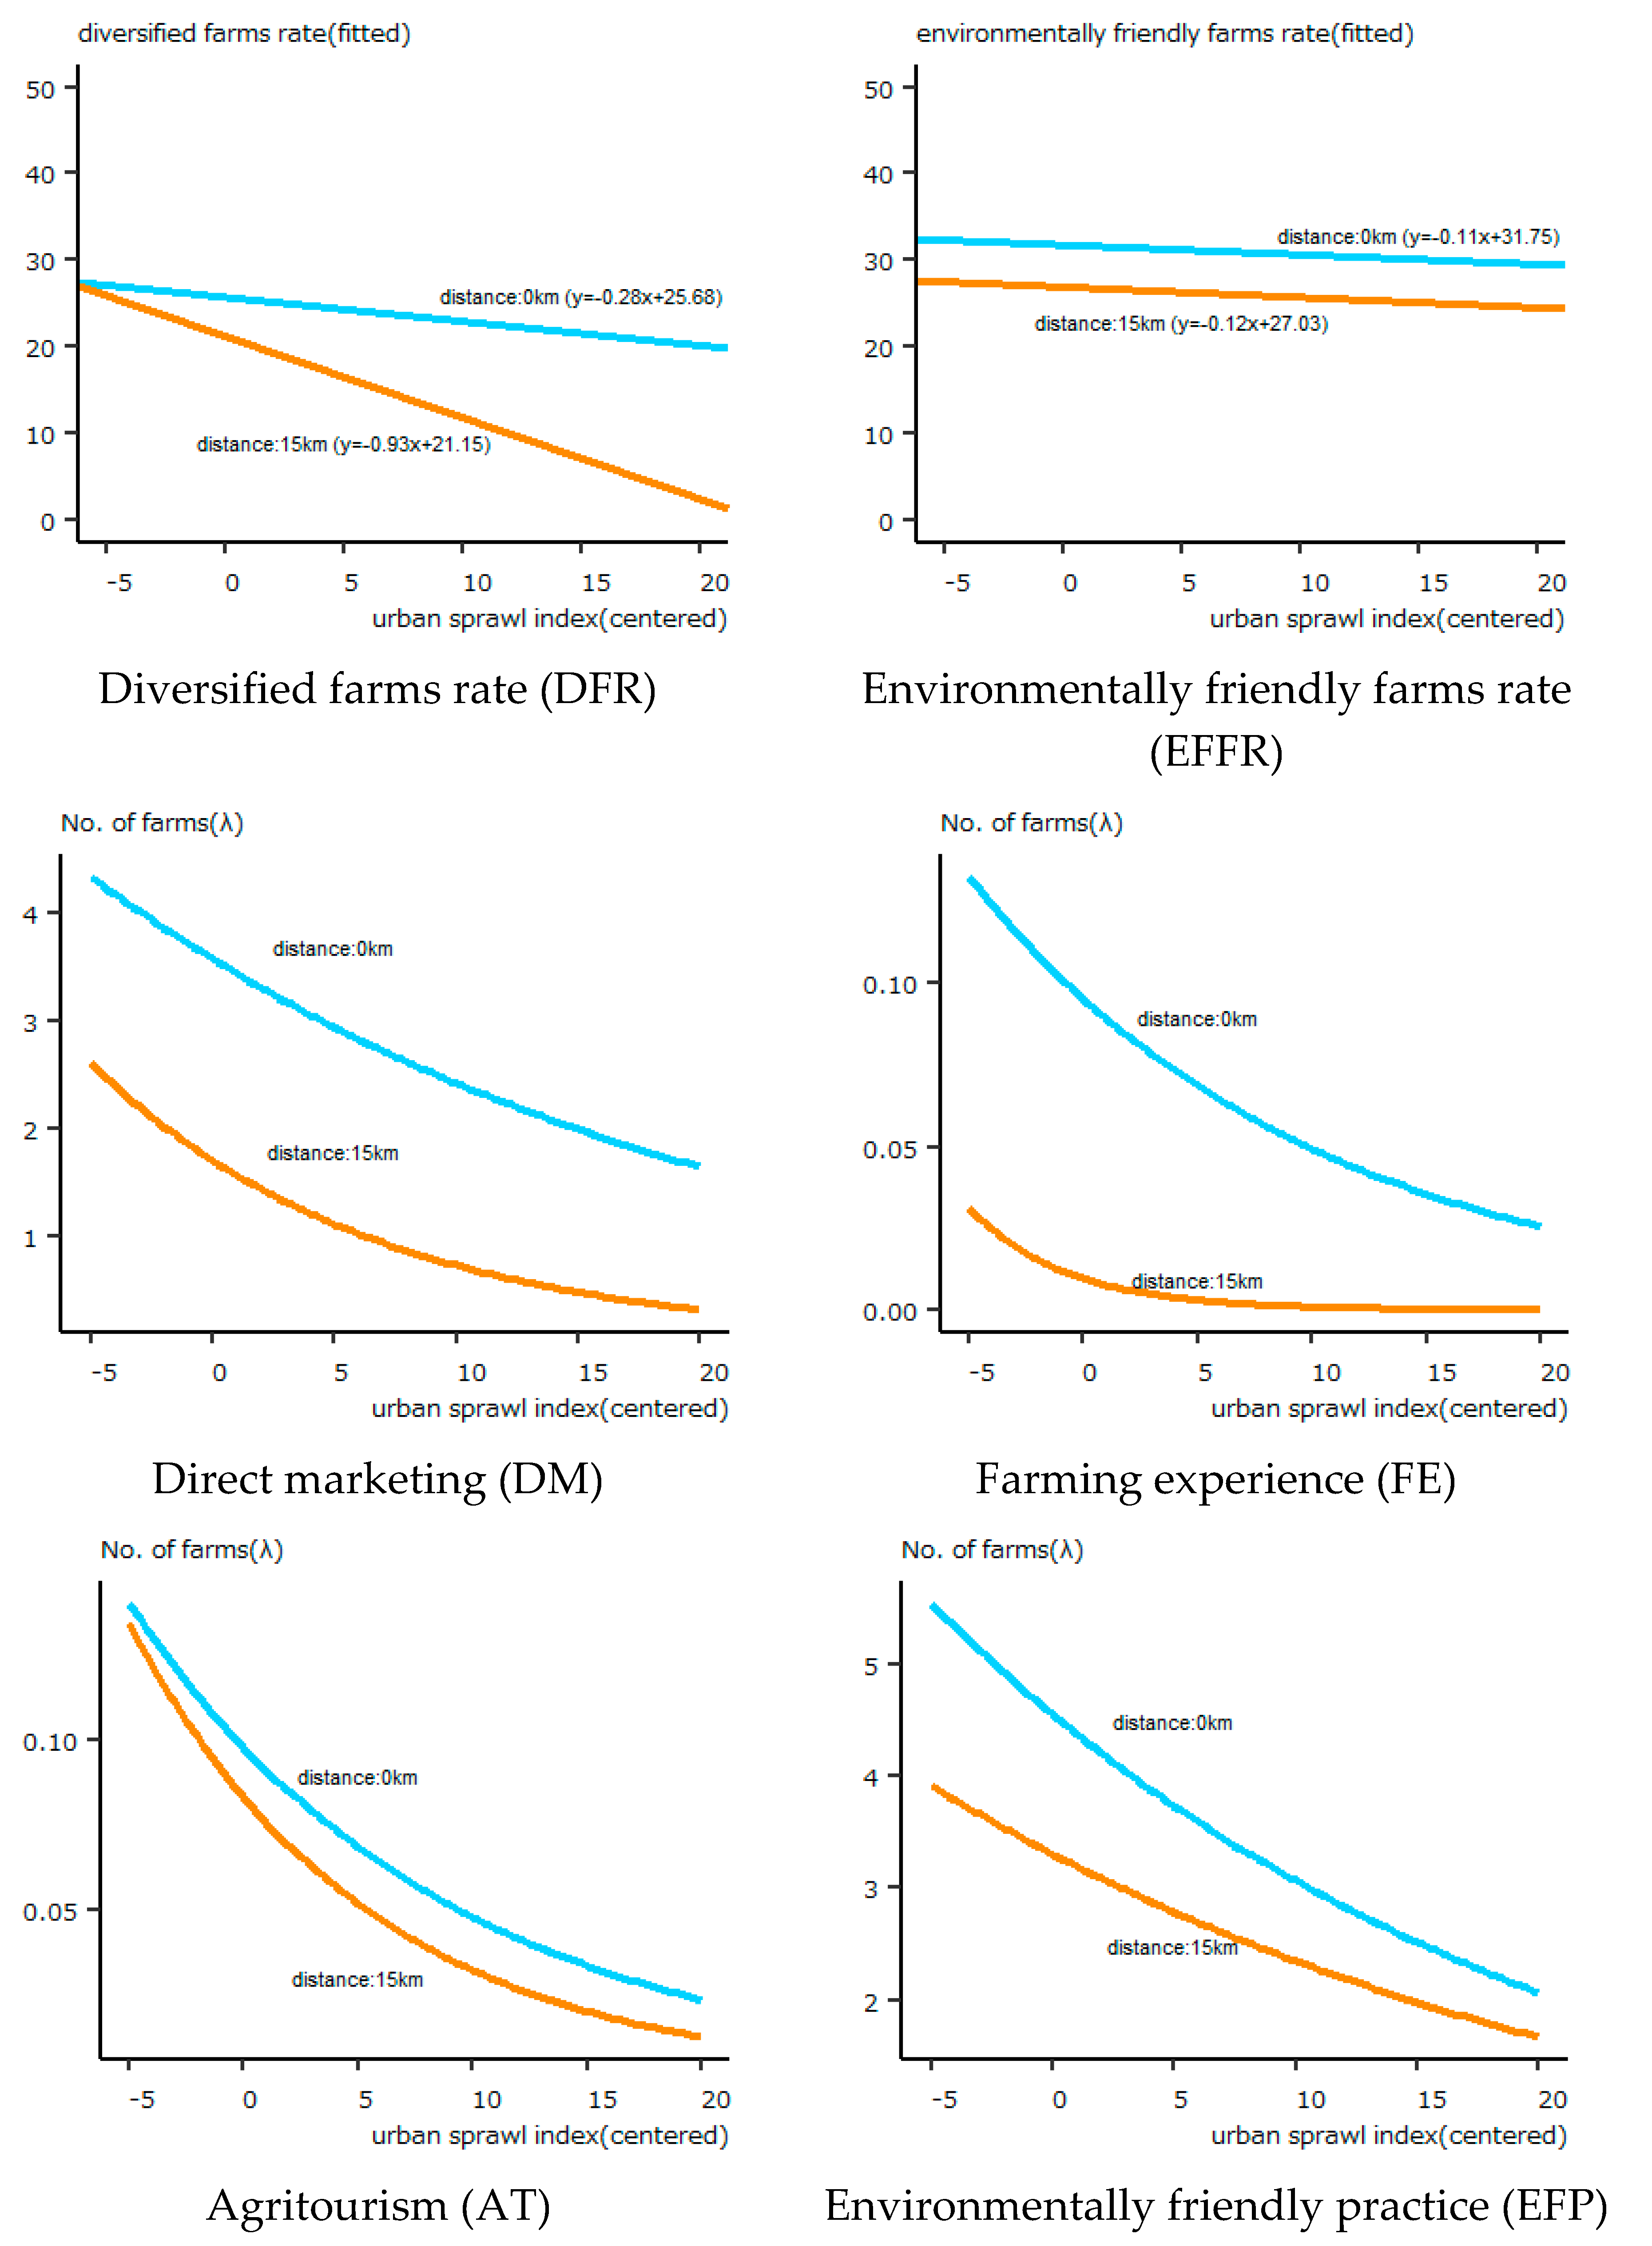
4.4. Effects of Urbanization on Farm Diversification Activities
5. Discussion
6. Conclusions
Funding
Acknowledgments
Conflicts of Interest
References
- Zasada, I. Multifunctional peri-urban agriculture—A review of societal demands and the provision of goods and services by farming. Land Use Policy 2011, 28, 639–648. [Google Scholar] [CrossRef]
- Wilson, G.A. From ‘weak’ to ‘strong’multifunctionality: Conceptualising farm-level multifunctional transitional pathways. J. Rural Stud. 2008, 24, 367–383. [Google Scholar] [CrossRef]
- Lovell, S.T. Multifunctional urban agriculture for sustainable land use planning in the United States. Sustainability 2010, 2, 2499–2522. [Google Scholar] [CrossRef] [Green Version]
- Yokohari, M.; Amati, M.; Bolthouse, J.; Kurita, H. Restoring urban fringe landscapes through urban agriculture: The Japanese experience. Disp. Plan. Rev. 2010, 46, 51–59. [Google Scholar] [CrossRef]
- Kurita, H.; Yokohari, M.; Bolthouse, J. The potential of intra-regional supply and demand of agricultural products in an urban fringe area: A case study of the Kanto Plain, Japan. Geogr. Tidsskr. J. Geogr. 2009, 109, 147–159. [Google Scholar] [CrossRef]
- Yokohari, M.; Takeuchi, K.; Watanabe, T.; Yokota, S. Beyond greenbelts and zoning: A new planning concept for the environment of Asian mega-cities. In Urban Ecology; Springer: Berlin/Heidelberg, Germany, 2008; pp. 783–796. [Google Scholar]
- Kiminami, L.; Kiminami, A.; Furuzawa, S. Impacts of multi-functionality of urban agriculture on the CCs in Japan. Asia Pac. J. Reg. Sci. 2018, 2, 507–527. [Google Scholar] [CrossRef]
- Kiminami, L.; Furuzawa, S.; Kiminami, A. Impacts of multi-functionality of urban agriculture on the creative classes in global mega city: Focusing on Shanghai in China. Asia Pac. J. Reg. Sci. 2019, 3, 487–515. [Google Scholar] [CrossRef]
- Sioen, G.B.; Terada, T.; Sekiyama, M.; Yokohari, M. Resilience with mixed agricultural and urban land uses in Tokyo, Japan. Sustainability 2018, 10, 435. [Google Scholar] [CrossRef] [Green Version]
- Hoornweg, D.; Munro-Faure, P. Urban Agriculture for Sustainable Poverty Alleviation and Food Security; Food and Agriculture Organization of the United Nations (FAO): Rome, Italy, 2008. [Google Scholar]
- Pölling, B.; Mergenthaler, M.; Lorleberg, W. Professional urban agriculture and its characteristic business models in Metropolis Ruhr, Germany. Land Use Policy 2016, 58, 366–379. [Google Scholar] [CrossRef]
- Ilbery, B.W. Farm diversification as an adjustment strategy on the urban fringe of the West Midlands. J. Rural Stud. 1991, 7, 207–218. [Google Scholar] [CrossRef]
- Pölling, B.; Mergenthaler, M. The location matters: Determinants for “deepening” and “broadening” diversification strategies in Ruhr Metropolis’ Urban Farming. Sustainability 2017, 9, 1168. [Google Scholar] [CrossRef] [Green Version]
- Gullino, P.; Battisti, L.; Larcher, F. Linking multifunctionality and sustainability for valuing peri-urban farming: A case study in the Turin Metropolitan Area (Italy). Sustainability 2018, 10, 1625. [Google Scholar] [CrossRef] [Green Version]
- Sinclair, R. Von Thünen and urban sprawl. Ann. Assoc. Am. Geogr. 1967, 57, 72–87. [Google Scholar] [CrossRef]
- Boncinelli, F.; Bartolini, F.; Casini, L. Structural factors of labour allocation for farm diversification activities. Land Use Policy 2018, 71, 204–212. [Google Scholar] [CrossRef]
- Lange, A.; Piorr, A.; Siebert, R.; Zasada, I. Spatial differentiation of farm diversification: How rural attractiveness and vicinity to cities determine farm households’ response to the CAP. Land Use Policy 2013, 31, 136–144. [Google Scholar] [CrossRef]
- Meraner, M.; Heijman, W.; Kuhlman, T.; Finger, R. Determinants of farm diversification in the Netherlands. Land Use Policy 2015, 42, 767–780. [Google Scholar] [CrossRef]
- Kiryluk-Dryjska, E.; Więkeckowska, B. Territorial Clusters of Farmers’ Interest in Diversification in Poland: Geospatial Location and Characteristics. Sustainability 2020, 12, 5276. [Google Scholar] [CrossRef]
- Delbecq, B.A.; Kuethe, T.H.; Borchers, A.M. Identifying the extent of the urban fringe and its impact on agricultural land values. Land Econ. 2014, 90, 587–600. [Google Scholar] [CrossRef]
- Chen, Y.-H.; Lee, C.-L.; Chen, G.-R.; Wang, C.-H.; Chen, Y.-H. Factors Causing Farmland Price-Value Distortion and Their Implications for Peri-Urban Growth Management. Sustainability 2018, 10, 2701. [Google Scholar] [CrossRef] [Green Version]
- Uematsu, H.; Khanal, A.R.; Mishra, A.K. The impact of natural amenity on farmland values: A quantile regression approach. Land Use Policy 2013, 33, 151–160. [Google Scholar] [CrossRef]
- Livanis, G.; Moss, C.B.; Breneman, V.E.; Nehring, R.F. Urban sprawl and farmland prices. Am. J. Agric. Econ. 2006, 88, 915–929. [Google Scholar] [CrossRef]
- Cavailhès, J.; Wavresky, P. Urban influences on periurban farmland prices. Eur. Rev. Agric. Econ. 2003, 30, 333–357. [Google Scholar] [CrossRef]
- Yoshida, S.; Yagi, H.; Kiminami, A. Determinants of Farm Diversification in Peri-Urban Agriculture: Spatial Econometric Analysis with Municipality-Level Data from the Kanto Region. Stud. Reg. Sci. 2019, 49, 17–31. [Google Scholar] [CrossRef]
- Bartolini, F.; Andreoli, M.; Brunori, G. Explaining determinants of the on-farm diversification: Empirical evidence from Tuscany region. BioBased Appl. Econ. 2014, 3, 137–157. [Google Scholar]
- Jaeger, J.A.G.; Bertiller, R.; Schwick, C.; Kienast, F. Suitability criteria for measures of urban sprawl. Ecol. Indic. 2010, 10, 397–406. [Google Scholar] [CrossRef]
- Ermer, K.; Mohrmann, R.; Sukopp, H. Stadt und Umwelt. In Umweltschutz–Grundlagen und Praxis; Buchwald, K., Engelhardt, W., Eds.; Economica Verlag: Bonn, Germany, 1994; Volume 125. [Google Scholar]
- Sharp, J.S.; Smith, M.B. Social capital and farming at the rural--urban interface: The importance of nonfarmer and farmer relations. Agric. Syst. 2003, 76, 913–927. [Google Scholar] [CrossRef]
- Bryant, C.R.; Johnston, T.R.R. Agriculture in the City’s Countryside; Belhaven Press: London, UK, 1992. [Google Scholar]
- Yoshida, S.; Yagi, H.; Kiminami, A.; Garrod, G. Farm Diversification and Sustainability of Multifunctional Peri-Urban Agriculture: Entrepreneurial Attributes of Advanced Diversification in Japan. Sustainability 2019, 11, 2887. [Google Scholar] [CrossRef] [Green Version]
- Sudhira, H.S.; Ramachandra, T.V.; Jagadish, K.S. Urban sprawl: Metrics, dynamics and modelling using GIS. Int. J. Appl. Earth Obs. Geoinf. 2004, 5, 29–39. [Google Scholar] [CrossRef]
- Brueckner, J.K.; Largey, A.G. Social interaction and urban sprawl. J. Urban Econ. 2008, 64, 18–34. [Google Scholar] [CrossRef] [Green Version]
- Brandth, B.; Haugen, M.S. Farm diversification into tourism—Implications for social identity? J. Rural Stud. 2011, 27, 35–44. [Google Scholar] [CrossRef] [Green Version]


| Tokyo Metro Area | Osaka Metro Area | ||||||
|---|---|---|---|---|---|---|---|
| Tokyo | Kanagawa | Chiba | Saitama | Osaka | Kyoto | Hyogo | |
| Area (km2) | 1783 | 2411 | 5155 | 3796 | 1908 | 4620 | 8422 |
| population | 13,159,000 | 9,048,000 | 6,216,000 | 7,195,000 | 8,865,000 | 2,636,000 | 5,588,000 |
| population density (person/km2) | 5998 | 3745 | 1205 | 1895 | 4654 | 572 | 665 |
| % of DID area | 59.67 | 39.07 | 12.49 | 18.23 | 47.24 | 5.70 | 6.93 |
| total agricultural production (billion yen) (% of horticulture) | 27 (86%) | 84 (73%) | 470 (48%) | 198 (61%) | 36 (70%) | 74 (41%) | 163 (30%) |
| Region | Prefecture | Farmland Parcels (ha) | National Survey (ha) | Excess Area Rate (%) | ||||||
|---|---|---|---|---|---|---|---|---|---|---|
| Rice Paddy | Plowed Field | Total Area | Rice Paddy | Plowed Field | Total Area | Rice Paddy | Plowed Field | Total Area | ||
| (1) | (2) | (3) | (4) | (5) | (6) | (1)/(4) *100 | (2)/(5) *100 | (3)/(6) *100 | ||
| Tokyo metro area | Tokyo | 279 | 5585 | 5864 | 249 | 5378 | 5627 | 112 | 104 | 104 |
| Kanagawa | 3782 | 16,358 | 20,139 | 3671 | 15,110 | 18,781 | 103 | 108 | 107 | |
| Chiba | 75,399 | 52,237 | 127,637 | 73,533 | 51,033 | 124,566 | 103 | 102 | 102 | |
| Saitama | 44,300 | 36,034 | 80,334 | 41,306 | 33,231 | 74,537 | 107 | 108 | 108 | |
| Total | 123,760 | 110,214 | 233,974 | 118,759 | 104,752 | 223,511 | 104 | 105 | 105 | |
| Osaka metro area | Osaka | 9430 | 4054 | 13,484 | 8880 | 3814 | 12,694 | 106 | 106 | 106 |
| Kyoto | 23,107 | 7880 | 30,987 | 23,280 | 6671 | 29,951 | 99 | 118 | 103 | |
| Hyogo | 60,853 | 6314 | 67,167 | 67,225 | 6256 | 73,481 | 91 | 101 | 91 | |
| Total | 93,390 | 18,248 | 111,638 | 99,385 | 16,741 | 116,126 | 94 | 109 | 96 | |
| Independent Variables | Unit | Full Sample N = 2,960,523 | Tokyo Metro Area N = 1,724,153 | Osaka Metro Area N = 1,236,370 | |||
|---|---|---|---|---|---|---|---|
| Mean | SD | Mean | SD | Mean | SD | ||
| area | m2 | 1054.41 | 1147.90 | 1244.44 | 1279.56 | 789.42 | 866.84 |
| urban sprawl index | ☐ | 6.01 | 5.54 | 6.77 | 5.81 | 4.95 | 4.95 |
| distance | km | 4.91 | 5.07 | 3.77 | 4.37 | 6.50 | 5.52 |
| population | persons/500 m grid | 315.63 | 596.43 | 369.72 | 658.28 | 240.20 | 487.59 |
| road | m/1 km grid | 6749.20 | 5798.11 | 7677.55 | 6112.20 | 5454.58 | 5052.06 |
| plowed field | dummy | 0.44 | 0.50 | 0.56 | 0.50 | 0.27 | 0.45 |
| high sales rate | % | 12.35 | 17.26 | 16.24 | 19.31 | 6.93 | 11.93 |
| agricultural diversification rate | % | 4.66 | 7.48 | 4.78 | 7.58 | 4.48 | 7.34 |
| vegetable farmer rate | % | 19.76 | 26.17 | 25.00 | 28.29 | 12.46 | 20.79 |
| fruit farmer rate | % | 4.81 | 13.63 | 6.13 | 15.04 | 2.95 | 11.09 |
| flower farmer rate | % | 3.36 | 9.93 | 4.44 | 10.92 | 1.86 | 8.11 |
| Independent Variables | Unit | Full Sample N = 2,960,523 | Tokyo Metro Area N = 1,724,153 | Osaka Metro Area N = 1,236,370 | ||
|---|---|---|---|---|---|---|
| Model 1 | Model 2 | Model 3 | Model 4 | Model 5 | ||
| intercept | ☐ | 1050.52 *** | 1016.00 *** | 1017.00 *** | 1311.00 *** | 813.08 *** |
| urban sprawl index | ☐ | −33.61 *** | −35.17 *** | −34.87 *** | −42.49 *** | −28.96 *** |
| distance | km | −21.27 *** | −19.82 *** | −19.16 *** | −2.27 *** | −12.08 *** |
| urban sprawl index*distance | ☐ | ☐ | ☐ | 0.32 *** | −0.45 *** | 0.54 *** |
| population | 1000 persons/500 m grid | ☐ | −30.46 *** | −24.41 *** | 53.04 *** | −14.79 *** |
| road | km/1 km grid | ☐ | 7.08 *** | 7.13 *** | −3.72 *** | 17.67 *** |
| plowed field | dummy | −318.75 *** | −316.90 *** | −316.70 *** | −360.40 *** | −444.70 *** |
| high sales rate | % | 13.74 *** | 13.82 *** | 13.80 *** | 11.75 *** | 5.05 *** |
| agricultural diversification rate | % | −1.82 *** | −1.90 *** | −1.89 *** | 0.50 *** | −0.65 *** |
| vegetable farmer rate | % | −0.50 *** | −0.71 *** | −0.70 *** | −0.94 *** | −1.66 *** |
| fruit farmer rate | % | 0.41 *** | 0.37 *** | 0.38 *** | −1.35 *** | 2.69 *** |
| flower farmer rate | % | −2.76 *** | −2.97 *** | −2.96 *** | −4.97 *** | −4.64 *** |
| R square | ☐ | 0.08 | 0.08 | 0.08 | 0.10 | 0.09 |
| Abbreviation | Unit | Tokyo Metro Area | Osaka Metro Area | ||||
|---|---|---|---|---|---|---|---|
| Mean | SD | Mean | SD | ||||
| diversified farms rate | DFR | % | 25.08 | 21.47 | 23.29 | 18.46 | |
| environmentally friendly farms rate | EFFR | % | 30.63 | 20.81 | 29.80 | 20.34 | |
| direct marketing | DM | persons | 3.57 | 5.92 | 3.30 | 3.35 | |
| breakdown | farmers gate | FG | persons | 1.34 | 3.89 | 0.59 | 1.22 |
| farmers market | FM | persons | 1.39 | 2.29 | 1.18 | 1.78 | |
| farming experience | FE | persons | 0.11 | 0.43 | 0.08 | 0.34 | |
| agritourism | AT | persons | 0.15 | 0.63 | 0.07 | 0.43 | |
| environmentally friendly practice | EFP | persons | 4.67 | 5.90 | 4.62 | 4.48 | |
| breakdown | manure management | MM | persons | 2.48 | 3.53 | 2.54 | 2.87 |
| pesticides | PS | persons | 3.65 | 4.78 | 3.48 | 3.51 | |
| chemical fertilizer | CF | persons | 2.31 | 3.98 | 2.22 | 3.04 | |
| high sales rate | HSR | % | 15.38 | 19.19 | 6.34 | 11.37 | |
| large farm rate | LFR | % | 16.80 | 18.14 | 6.90 | 9.74 | |
| plowed field | PF | dummy | 0.59 | 0.30 | 0.29 | 0.21 | |
| agricultural diversification rate | ADR | % | 4.47 | 7.74 | 4.37 | 7.42 | |
| vegetable farmer rate | VFR | % | 25.12 | 29.12 | 13.00 | 21.88 | |
| fruit farmer rate | FFR | % | 6.61 | 16.24 | 3.07 | 12.07 | |
| flower farmer rate | FLFR | % | 4.32 | 11.11 | 1.74 | 7.92 | |
| Variables | DFR | EFFR | No. Farmers | ||||||||
|---|---|---|---|---|---|---|---|---|---|---|---|
| DM | Breakdown | FE | AT | EFP | Breakdown | ||||||
| FG | FM | MM | PS | CF | |||||||
| intercept | 11.116 *** | 17.821 *** | 0.502 *** | −1.389 *** | −0.639 *** | −4.408 *** | −3.666 *** | 0.747 *** | −0.688 *** | 0.615 *** | 0.062 ** |
| urban sprawl index | −0.433 *** | −0.112 | −0.050 *** | −0.037 *** | −0.056 *** | −0.106 *** | −0.078 *** | −0.038 *** | −0.047 *** | −0.033 *** | −0.034 *** |
| distance | −0.302 *** | −0.315 *** | −0.049 *** | −0.078 *** | −0.039 *** | −0.152 *** | −0.011 | −0.021 *** | −0.009 *** | −0.023 *** | −0.015 *** |
| Urban sprawl index*distance | −0.044 *** | 0.000 | −0.003 *** | −0.003 ** | −0.003 *** | −0.011 * | −0.002 | 0.000 | −0.001 | 0.001 | 0.000 |
| population | 7.299 *** | 2.265 *** | 0.174 *** | 0.151 *** | −0.009 | 0.274 *** | 0.254 *** | 0.121 *** | 0.145 *** | 0.130 *** | 0.152 *** |
| road | 0.597 *** | 0.278 *** | 0.028 *** | 0.051 *** | 0.012 *** | 0.044 *** | 0.018 ** | 0.017 *** | 0.024 *** | 0.019 *** | 0.014 *** |
| HSR | −0.063 *** | 0.110 *** | 0.000 | 0.006 *** | −0.003 *** | −0.004 * | 0.005 ** | 0.005 *** | 0.009 *** | 0.004 *** | 0.007 *** |
| LFR | −0.068 *** | 0.097 *** | −0.002 *** | 0.000 | −0.001 | 0.001 | −0.006 ** | 0.007 *** | 0.008 *** | 0.006 *** | 0.008 *** |
| PF | −0.647 | −4.521 *** | −0.103 ** | 0.074 | 0.334 *** | 1.052 *** | 0.755 *** | −0.146 *** | 0.295 *** | −0.306 *** | −0.254 *** |
| ADR | 0.401 *** | 0.137 *** | 0.015 *** | 0.014 *** | 0.023 *** | 0.019 *** | 0.022 *** | 0.008 *** | 0.014 *** | 0.007 *** | 0.007 *** |
| VFR | 0.105 *** | 0.254 *** | 0.007 *** | 0.010 *** | 0.012 *** | 0.009 *** | 0.010 *** | 0.010 *** | 0.014 *** | 0.010 *** | 0.011 *** |
| FFR | 0.409 *** | 0.242 *** | 0.015 *** | 0.025 *** | 0.011 *** | 0.012 *** | 0.029 *** | 0.011 *** | 0.012 *** | 0.012 *** | 0.013 *** |
| FLFR | 0.057 ** | 0.022 | 0.007 *** | 0.01 *** | 0.013 *** | 0.011 *** | 0.014 *** | 0.006 *** | 0.010 *** | 0.004 *** | 0.004 *** |
| R square | 0.3875 | 0.2472 | ☐ | ☐ | ☐ | ☐ | ☐ | ☐ | ☐ | ☐ | ☐ |
| Akaike’s Information Criterion (AIC) | ☐ | 37,453 | 21,344 | 22,625 | 3998 | 5313 | 40,302 | 27,925 | 35,891 | 29,276 | |
| Variables | DFR | EFFR | Number of Farmers | ||||||||
|---|---|---|---|---|---|---|---|---|---|---|---|
| DM | Breakdown | FE | AT | EFP | Breakdown | ||||||
| FG | FM | MM | PS | CF | |||||||
| intercept | 16.100 *** | 23.070 *** | 0.935 *** | −1.224 *** | −0.324 *** | −3.563 *** | −3.747 *** | 1.359 *** | 0.490 *** | 1.046 *** | 0.663 *** |
| urban sprawl index | −0.154 | −0.160 *** | −0.038 *** | −0.048 *** | −0.049 *** | −0.167 *** | −0.079 *** | −0.037 *** | −0.050 *** | −0.033 *** | −0.034 *** |
| distance | −0.451 *** | 0.252 *** | −0.031 *** | −0.022 *** | −0.03 *** | −0.140 *** | −0.047 *** | 0.001 | 0.011 *** | −0.010 *** | −0.011 *** |
| urban sprawl index*distance | −0.028 * | 0.020 | 0.001 ** | 0.003 ** | −0.001 | −0.008 | −0.001 | 0.004 *** | 0.003 *** | 0.004 *** | 0.004 *** |
| population | 2.021 * | 2.373 * | −0.008 | 0.306 *** | −0.134 ** | 0.263 * | −0.334 | 0.004 | 0.023 | 0.052 | −0.018 |
| road | −0.082 | 0.041 | 0.015 *** | 0.025 *** | 0.004 | 0.045 *** | 0.055 *** | 0.018 *** | 0.016 *** | 0.017 *** | 0.018 *** |
| HSR | −0.083 ** | 0.185 *** | −0.001 | 0.000 | −0.001 | 0.006 | 0.005 | 0.008 *** | 0.010 *** | 0.008 *** | 0.009 *** |
| LFR | 0.123 *** | 0.216 *** | 0.001 | 0.009 *** | 0.003 * | 0.003 | 0.027 *** | 0.004 *** | 0.003 ** | 0.005 *** | 0.008 *** |
| PF | 9.239 *** | −0.224 | 0.034 | 0.092 | 0.175 ** | −0.125 | −0.345 | −0.464 *** | −0.640 *** | −0.241 *** | −0.118 ** |
| ADR | 0.490 *** | 0.204 *** | 0.018 *** | 0.02 *** | 0.032 *** | 0.019 *** | 0.024 *** | 0.004 *** | 0.008 *** | 0.006 *** | 0.005 *** |
| VFR | 0.047 *** | 0.159 *** | 0.002 *** | 0.006 *** | 0.010 *** | 0.009 *** | 0.006 * | 0.007 *** | 0.014 *** | 0.004 *** | 0.005 *** |
| FFR | 0.292 *** | 0.194 *** | 0.009 *** | 0.024 *** | 0.014 *** | 0.008 ** | 0.039 *** | 0.007 *** | 0.007 *** | 0.006 *** | 0.005 *** |
| FLFR | 0.012 | −0.129 *** | 0.000 | −0.001 | 0.01 *** | 0.016 *** | 0.014 ** | −0.003 *** | −0.002 | −0.005 *** | −0.005 *** |
| R square | 0.1398 | 0.1000 | ☐ | ☐ | ☐ | ☐ | ☐ | ☐ | ☐ | ☐ | ☐ |
| AIC | ☐ | 22,420 | 9033.6 | 13,539 | 2413 | 2072.6 | 26,403 | 19,236 | 23,132 | 20,313 | |
© 2020 by the author. Licensee MDPI, Basel, Switzerland. This article is an open access article distributed under the terms and conditions of the Creative Commons Attribution (CC BY) license (http://creativecommons.org/licenses/by/4.0/).
Share and Cite
Yoshida, S. Effects of Urbanization on Farmland Size and Diversified Farm Activities in Japan: An Analysis Based on the Land Parcel Database. Land 2020, 9, 315. https://doi.org/10.3390/land9090315
Yoshida S. Effects of Urbanization on Farmland Size and Diversified Farm Activities in Japan: An Analysis Based on the Land Parcel Database. Land. 2020; 9(9):315. https://doi.org/10.3390/land9090315
Chicago/Turabian StyleYoshida, Shingo. 2020. "Effects of Urbanization on Farmland Size and Diversified Farm Activities in Japan: An Analysis Based on the Land Parcel Database" Land 9, no. 9: 315. https://doi.org/10.3390/land9090315
APA StyleYoshida, S. (2020). Effects of Urbanization on Farmland Size and Diversified Farm Activities in Japan: An Analysis Based on the Land Parcel Database. Land, 9(9), 315. https://doi.org/10.3390/land9090315