Article

Sub-Surface Carbon Stocks in Northern Taiga Landscapes Exposed in the Batagay Megaslump, Yana Upland, Yakutia

by
Andrei G. Shepelev
1,*,
Alexander Kizyakov
2,
Sebastian Wetterich
3,
Alexandra Cherepanova
4,
Alexander Fedorov
1,5,
Igor Syromyatnikov
4 and
Grigoriy Savvinov
6
1
Laboratory of Permafrost Landscapes, Melnikov Permafrost Institute, Siberian Branch of the Russian Academy of Science, 36 Merzlotnaya St., 677010 Yakutsk, Russia
2
Cryolithology and Glaciology Department, Faculty of Geography, Lomonosov Moscow State University, GSP-1, Leninskie Gory, 119991 Moscow, Russia
3
Alfred Wegener Institute, Helmholtz Centre for Polar and Marine Research, Telegrafenberg A45, 14473 Potsdam, Germany
4
Laboratory of General Geocryology, Melnikov Permafrost Institute, Siberian Branch of the Russian Academy of Science, 36 Merzlotnaya St., 677010 Yakutsk, Russia
5
Biogeoscience Educational and Scientific Trainings, North-Eastern Federal University, 677000 Yakutsk, Russia
6
Science Research Institute of Applied Ecology of the North, North-East Federal University, 43 Lenin Avenue, 677007 Yakutsk, Russia
*
Author to whom correspondence should be addressed.
Land 2020, 9(9), 305; https://doi.org/10.3390/land9090305
Submission received: 21 July 2020 / Revised: 23 August 2020 / Accepted: 27 August 2020 / Published: 29 August 2020
(This article belongs to the Special Issue Permafrost Landscape)

Abstract

:
The most massive and fast-eroding thaw slump of the Northern Hemisphere located in the Yana Uplands of Northern Yakutia was investigated to assess in detail the cryogenic inventory and carbon pools of two distinctive Ice Complex stratigraphic units and the uppermost cover deposits. Differentiating into modern and Holocene near-surface layers (active layer and shielding layer), highest total carbon contents were found in the active layer (18.72 kg m−2), while the shielding layer yielded a much lower carbon content of 1.81 kg m−2. The late Pleistocene upper Ice Complex contained 10.34 kg m−2 total carbon, and the mid-Pleistocene lower Ice Complex 17.66 kg m−2. The proportion of organic carbon from total carbon content is well above 70% in all studied units with 94% in the active layer, 73% in the shielding layer, 83% in the upper Ice Complex and 79% in the lower Ice Complex. Inorganic carbon is low in the overall structure of the deposits.

1. Introduction

Pioneering fieldwork in the Batagay megaslump to study its cryogenic inventory and origin was undertaken in 2011 [1]. The prominent ice-rich Ice Complex units and ice-poor sand units as well as enclosed ground ice exposed in the Batagay megaslump accumulated during the Pleistocene under the continental conditions of the non-glaciated region of eastern Siberia belonging to the western part of Beringia [1]. Currently, the Batagay megaslump and its exposed permafrost are increasingly studied by various disciplines to assess its modern morphodynamics such as erosion rates and budgets [2,3] or the behavior of living microorganisms inside the frozen zone [4]. Most studies, however, deal with the Quaternary frozen deposits, the fossil inventory and ground ice.
Based on current cryolithological research and various dating approaches the permafrost exposed in the Batagay megaslump differentiates into the following seven units [1,5,6] starting from the slump bottom: (1) diamicton above slate bedrock, (2) lower Ice Complex, (3) lower sand unit, (4) prominent lenses of woody debris, (5) upper Ice Complex, (6) upper sand unit and (7) a near-surface layer. The chronological sequence is not continuous, but contains hiatuses and traces of thermo-erosional degradation, especially during multiple interglacials during the mid- and late-Pleistocene [6,7,8].
Geophysical studies and obtained data on the general permafrost structure of the Batagay megaslump show—and in the headwall of the slump exposed—multiple wedge-ice generations. These are thickest on the northwestern slope of megaslump, and thinnest on the south and southwest slopes. The distance between the ice wedges ranges from 2 to >10 m [9].
The analysis of stable water isotope (δ18O, δD) composition of the ice wedges from the upper Ice Complex revealed low winter temperatures during MIS 3 (marine isotope stage, refers to the last Ice age 57 thousand years ago) under enhanced continentality of the Yana Uplands [5,10]. Ice wedges of both sand units retain traces of rapid sand formations [5]. It was further shown that the wedge ice of multiple generations of the Batagay megalump has a hydrogencarbonate-calcium dominated composition and a homogenous content of micro- and macroelements [11], pointing to stable moisture sources, i.e., winter precipitation, for syngenetic ice wedge growth.
The reconstruction of past vegetation and landscapes of the Yana Upland indicated that the primary plant, formed in cold stages before and after the Last Interglacial, corresponds to the analogues of moderately dry meadow steppes represented by Festucetalia lenensis communities [12]. During the last interglacial period, larch was the main vegetation, and coniferous forest corresponded to modern northern taiga [8]. The meadow steppes that formed the vegetation cover during the cold periods retained their ecological properties even under warm stage conditions of the Last Interglacial, which indicates environmental stability over glacial-interglacial cycles. Such an ecological balance means a low amount of precipitation and a relatively mild growing season during and after the late Pleistocene. The studied ancient vegetation proxies are relics of a continuous steppe system, stretching from Central Siberia to Northeastern Yakutia in the Pleistocene [12].
Research and analysis of the carbon of fossil organic matter in permafrost sediments are needed because of the ongoing climate warming and increasing anthropogenic load on sensitive ecosystems of permafrost landscapes. As a result, exogenous and cryogenic processes are activated with higher intensity, leading to the formation of depressions in the landscape, melting of ground ice, active layer thickening and the inevitable loss of the once stable part of carbon. For example, fires and clear-cutting of forests adversely affect the state of permafrost [13]. It shows that ten years after continuous forest cutting, the soil temperature rose by 1 °C, and the thickness of the active layer increased to about 2 m, which led to a critical state of permafrost [13]. After 60–80 years, gradual self-healing of permafrost landscapes takes place, the thickness of the active layer decreases and secondary birch-larch forests grow. Studies [14] indicated that, after the cessation of the pyrogenic situation and the burning of all forest vegetation for about 20 years, direct sunlight penetration causes thickening of the seasonal thaw depth. Still, the gradual restoration of flora and the accumulation of peat layer initiates the reverse process and leads to a decrease of the seasonal thaw depth.
Cover deposits and underlying permafrost are a planetary reservoir of carbon (of any form) since its accumulation took place over long geological periods. Carbon preserved in the permafrost is represented by various labile fractions such as humus-like and humus compounds, as well as dissolved organic substances. However, in scientific practice, researchers use the total carbon content to assess, predict and model ecosystem changes under the influence of permafrost degradation or aggradation. About 70% of carbon in the terrestrial ecosystems of the Earth is accumulated in soils, amounting to 1395–1580 Gt C. Of this carbon stock, 14% belong to soils of tundra and forest-tundra zones and 13% to those of boreal (taiga) forests [15,16,17].
Geographically, the northern taiga forests of Northern Yakutia are isolated by the Verkhoyansk Mountains. A comprehensive analysis of the carbon content and stock in continental permafrost deposits is still lacking, and the existing scientific data are scarce. Estimates of organic carbon stocks in the northern taiga amount to about 16 to 22 kg m−2 in the uppermost 1-metre-thick soil layer [18], while 30 to 50 kg m−2 of organic carbon are stored in the uppermost 3 m of permafrost on a circum-arctic scale [19].
The carbon component in the landscapes of the circumpolar region is one of the criteria for observing the influence of anthropogenic and natural factors on permafrost. Changes occurred in the violation of pristine properties of the soil cover entail the inevitable loss of carbon from the active layer and permafrost as CO2, CH4 and physical removal by erosion into riverine and marine realms. The permafrost exposed in the Batagay megaslump is an important example of how natural permafrost feature experiences overall degradation, changing as a result of human activities, the geological structure of the territory and due to its geographical location. However, according to Masyagina and Menyailo [20], the permafrost of Siberia will remain stable soon, but it is still a potential source of a vast amount of greenhouse gases, and ongoing release into the atmosphere will result in a further temperature increase, which is the permafrost carbon feedback.
At the present time, the permafrost vulnerability is recorded by researchers in various geographic regions of the Earth. Its most severe degradation occurs in the Arctic, caused by climate change [21,22]. In Alaska, increased precipitation over the past 5 years threatens once stable frozen soil, while more precipitation leads to deeper thawing of soil [23].
Batagay megaslump is the one and only large thermokarst formation in the Northern Hemisphere of Eurasia. Its frozen rocks have not been sufficiently studied in terms of biogenic elements; therefore, we have made attempts to study one of the main elements of the ecosystem such as carbon and its fund in the distinctive elements of the megaslump. It is important to note that the aim of the article is not to compare the results with other objects of the cryolithozone, since such objects do not currently exist. Moreover, we have to show the current state of the Batagay megaslump, as well as partially and indirectly alleged reasons for its formation. Undoubtedly, this is a small part of the preliminary studies which will be continued in the future. We provide a literary analysis of previously conducted studies on Batagay megaslump from different backgrounds and the results of international teams of scientists.

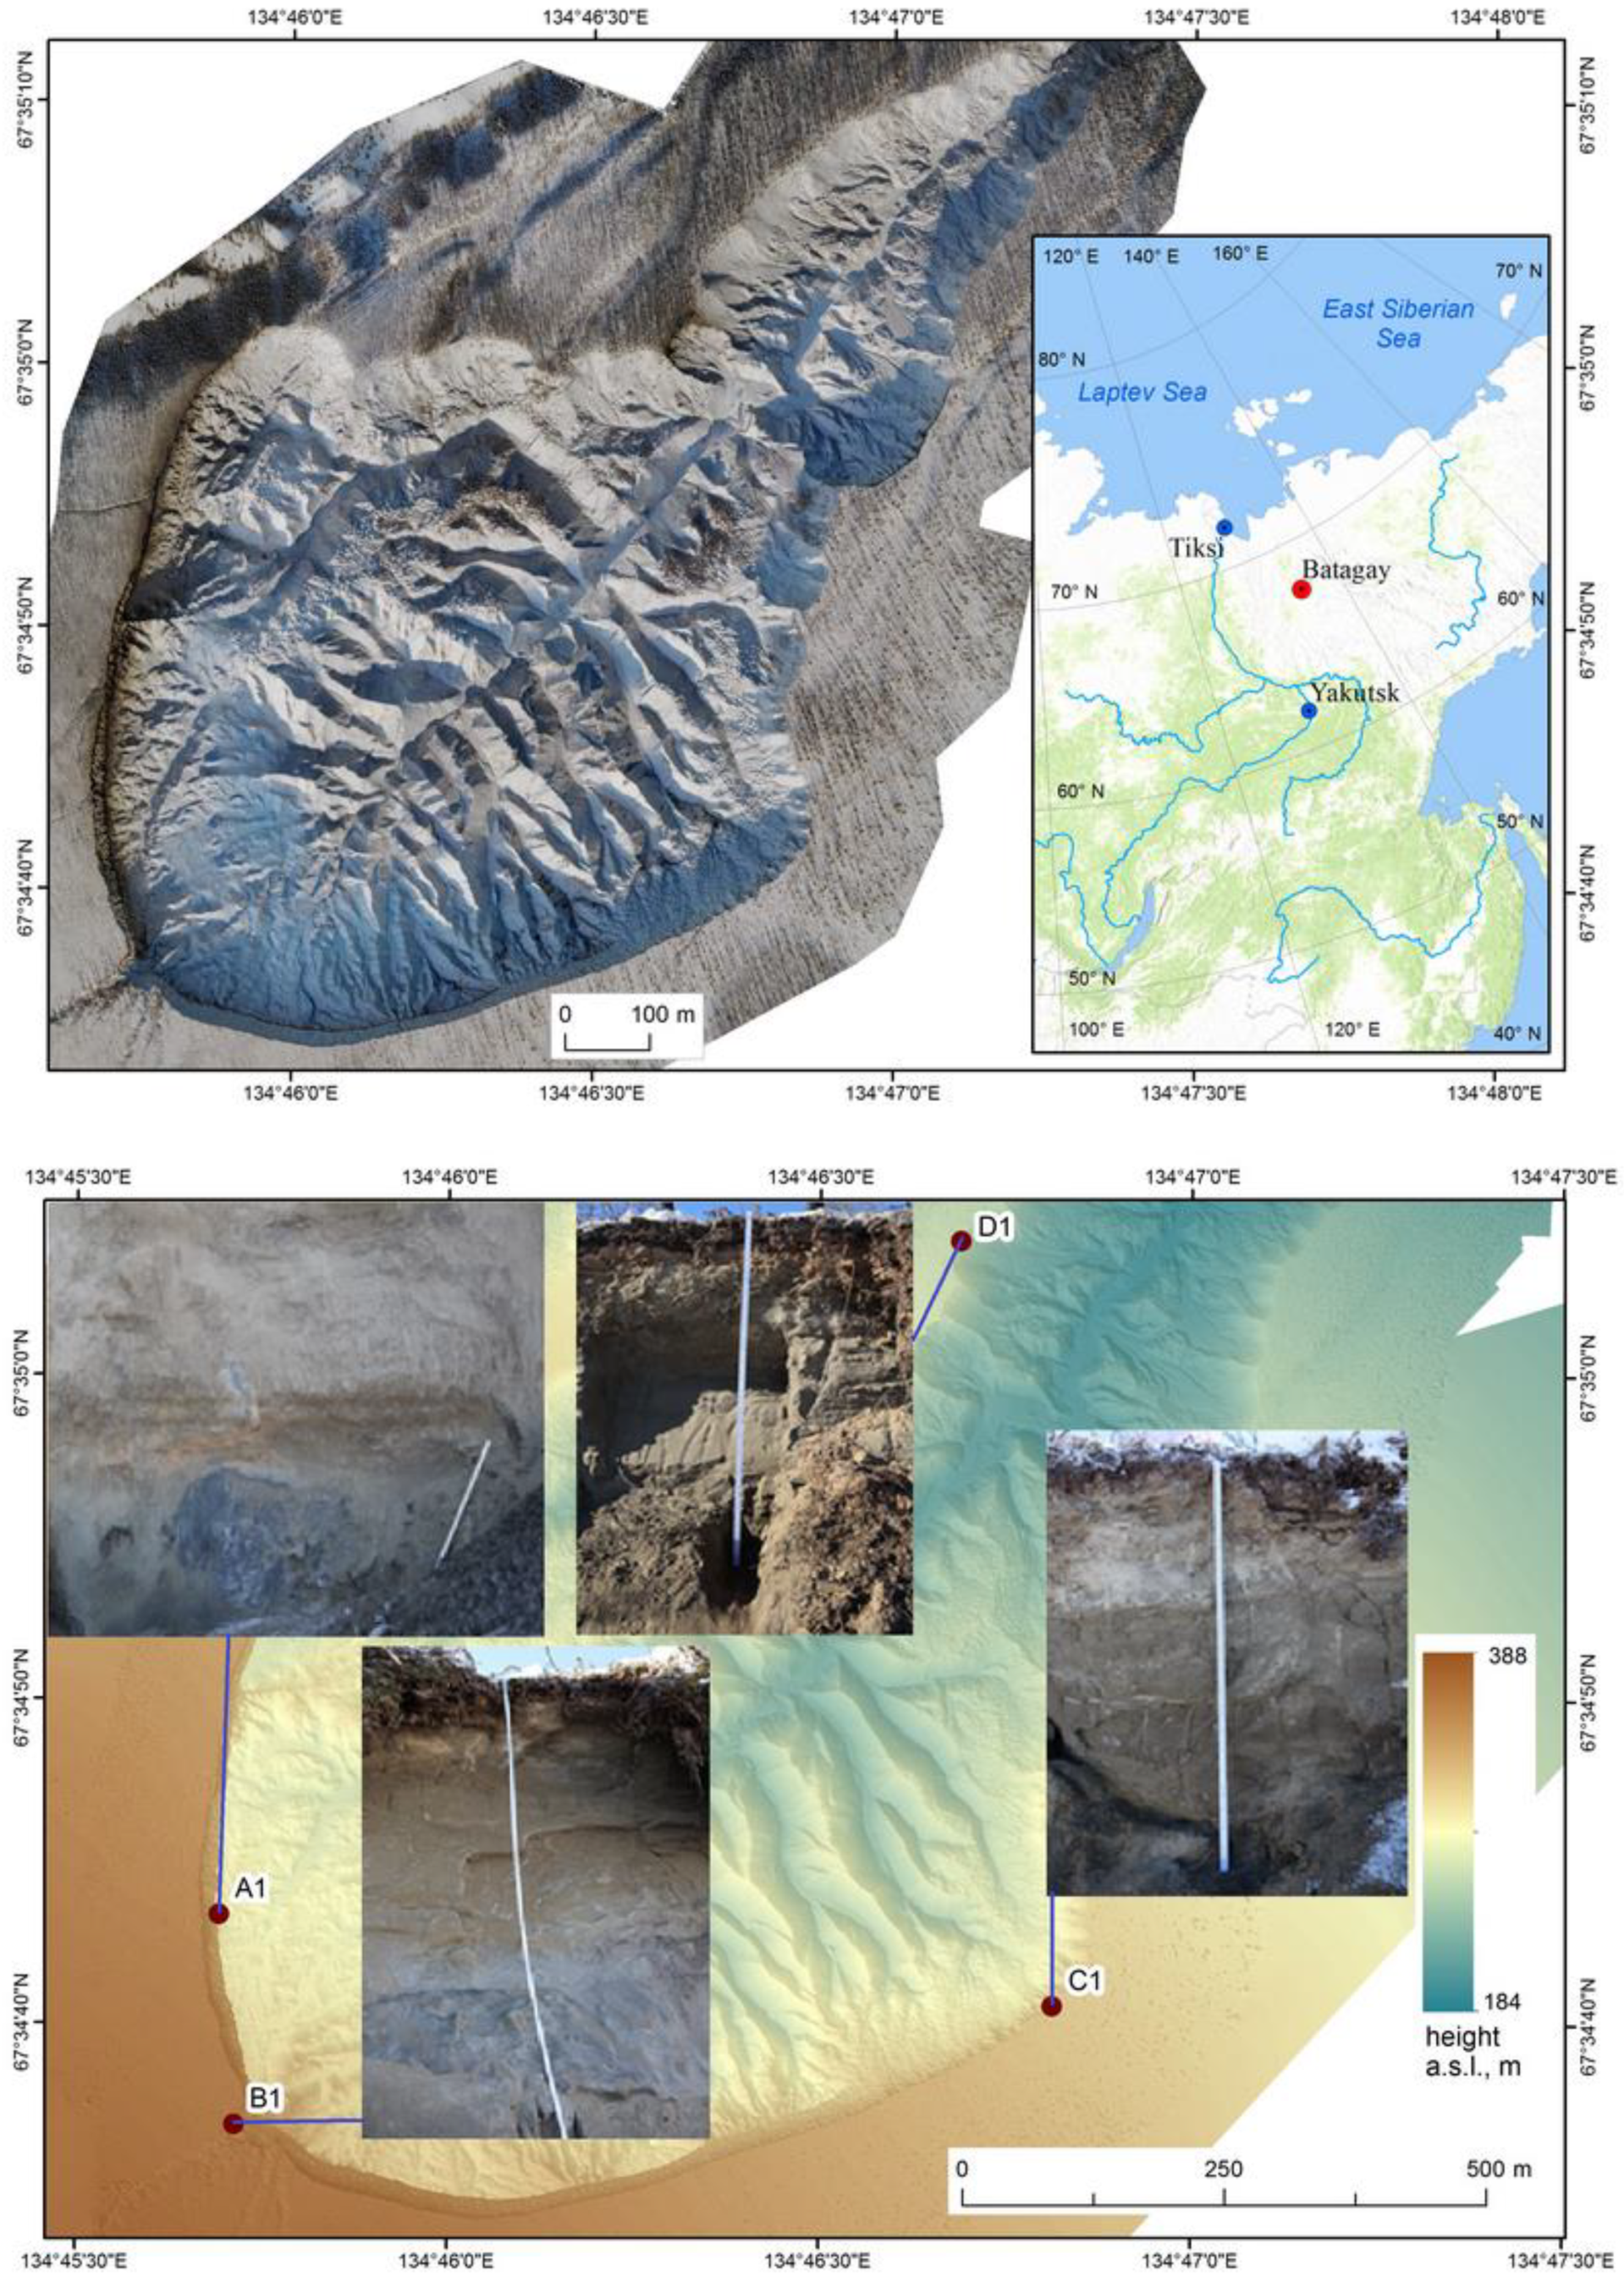
2. Brief Natural Conditions of the Study Area

The climate of the Yana Upland region is severe and sharply continental. It is affected by the geographical location between the arctic and subarctic climatic zones as well as by isolation between mountain ranges. A detailed climate description of the area is presented in publication [11], so in our article, we will not focus on this.
The vegetation of the northern taiga is characterized by low species diversity, in mountain climates with predominantly insufficient atmospheric moisture. In the study area, forests are dominated by larch (Larix cajanderi) with undergrowth of birch, cedar dwarf pine, lingonberry and moss-lichen communities [24]. Landscapes are formed on permafrost in continuous distribution with mean annual ground temperatures from −7 to −4 °C. In the Verkhoyan–Kolyma region, the maximum permafrost thickness reaches 350 m in depth [25]. The presence of ice-rich permafrost in combination with widespread cryogenic processes such as thermokarst, thermo-erosion, solifluction and frost cracking, determine the appearance of periglacial landscapes and their development.
The research area is located in the tectonic Verkhoyansk anticlinal zone. The regional structure of the Verkhoyan–Kolyma folded region, including the Verkhoyansk meganticlinorium, bordered from the west by the Priverkhoyansk trough, and from the east by the structures of the Yano–Indigir synclinal zone. The territory is strongly dissected by a mountainous relief developing on the Mesozoic folded base [26].
Currently, the Verkhoyansk-Kolyma Mesozoic folding is distinguished by its outer part, which consists of the Verkhoyansk fold-thrust belt adjacent to the Siberian platform. Internally, it has a complex structure and includes a large number of intense folded linear zones and individual exotic blocks (terranes). The border of the inner and outer zones is the Adycha–Taryn thrust, which is located 50 and 130 km away from Batagay on a section of the Srednyaya river and the Verkhnyaya Adycha river. It is also a boundary general fault of the Chersky seismic zone [27].
The loose deposits in the area are underlain by a bedrock of the Triassic age of the Ladinsky tier such as sandstones, siltstones and conglomerates. Quaternary formations are represented by undivided frozen eluvium and diluvium consisting of sand, silt and clay including ground ice and organic matter.

3. Materials and Methods

Terms Used in the Article

There are some terms from Geocryology. The object of study of Geocryology is frozen rocks, including underground and ground accumulations of ice and snow [28]. The terms are widely used by Russian researchers and a number of foreign scientific teams conducting scientific experiments on the territory of the Russian cryolithozone. For understanding the terms in our work, their main definitions are given with the reference:
Active layer is the uppermost layer of soil alternately freezing and thawing in the presence of permafrost at its base [29].
Ataxitic cryostructure is inherent only for finely dispersed biogenic soils, in which a complex combination of ice inclusions and mineral aggregates suspended in ice is observed [29].
Cryogenic processes are set of processes of physical, chemical and mineralogical changes and transformation of soils and rocks of the weathering crust, as well as hydrosphere at a negative temperature [29].
Cryolithozone or permafrost zone is part of the cryosphere, representing the upper part of the Earth’s crust, characterized by negative temperatures of soils and rocks, also by the presence of ice or supercooled water in them [29].
Dusty sandy loam contains sand particles (2–0.05 mm), % by weight ˂50. An inhomogeneous mass, mainly sand and a weak loam [30].
Ice wedge is the ice, filling frost fissure, as well as other cracks in the field of permafrost. During thawing out of ice wedges, ditches up to 5–10 m at the depth and up to 10–15 m in width are formed, which are filled with soil mass [29].
Loess rocks (sediments) or loess are the loose, silty loamy rock of a fawn or gray-yellow color. The particle size distribution is dominated by the coarse dust fraction of 0.05–0.01 mm. [31].
Permafrost is a phenomenon of long-term freezing of the upper part of lithosphere, as well as the thickness and range of permafrost [29].
Sandy loam contains sand particles (2–0.05 mm), % by weight ≥ 50 [30].
Solifluction processes are the processes of viscous-plastic movement of waterlogged dispersed soil on the slopes within the seasonally freezing-thawing layers [29].
Shielding layer is a surface layer, which thaws during favorable climatic conditions, joins the active layer, but during unfavorable conditions it does thaw and is the upper layer of permafrost [32].
Ice schlieren is the ice inclusions in frozen ground, represented by veins, interlayers, and lenses of different orientations [29].
Thermokarst is the process of thawing of frozen grounds and ground ice, accompanied by the formation of subsidence forms of relief [29].
The Ice Complex or yedoma is loess-like syngenetic frozen soils of the Pleistocene age with high thickness, forming the northern coastal lowlands, the plains of Central Yakutia and the North-East. The Ice Complex is characterized by high ice content of sediments up to 70%–90% and large syngenetic ice lodes, with heights of up to 60–80 m [29].
Frosty weathering is a process of physical destruction of rocks that occurs under conditions of frequent temperature fluctuations above and below 0 °C, i.e., phase transitions of water into ice and back. Water freezing in cracks, increasing in volume, acts as a wedge separating pieces of rock from its main mass [29].
In this work, the use of the terms such as permafrost, soil and sediments should be identified with the synonym for the word “soil”, since this group of terms is a multi-component system undergoing a complex weathering process. During fieldwork in March–April 2019, the thaw slump walls were sampled at four locations (Figure 1). The sampled stratigraphic units exposed in the wall of the slump were marked as follows: A1 (lower Ice Complex), B1 (upper Ice Complex) close to the headwall of the slump, D1 (ravine) in the south-facing exposure and C1 (upper Ice Complex) in the north-facing exposure. Firstly, the walls of the sections were carefully cleaned to remove the outermost material in order to avoid contamination. Secondly, the sampling profiles were cryolithologically described in detail. Finally, we took samples of the stratigraphical horizons for carbon analysis and soil density calculations. Soil samples were taken between ice wedges, where there were no ice inclusions. This was done in order to eliminate ice from the carbon samples. It should be noted that the outcrop of icy rocks is characteristic of southern exposure, marker A1. For the rest of megaslump, we did not observe the same situation. The Batagay natural complex provides a detailed study of the system of typical key areas, divided into the above markers; in geography, these are called facies. Key areas boil down to the fact that a number of components of the local geographic system and their interconnection with each other, in our case, involves individual elementary layers with carbon reserves. This includes the features of the complex and the current processes taking place in it. Marking the position in space and in time allows for checking the observation material at another selected time, which ensures the receiving of mass and discrete data. So, the main differences between the markers are: A1 is the lower Ice Complex (deep permafrost layer) of the southern exposure of the megaslump at the maximum possible depth from the surface of 59.6 m, composed of sandy loam and silt particles. B1 is the upper Ice Complex, an annually increasing ravine passes through it and includes all elementary layers such as active, protective, and permafrost. It is a homogeneous genetic profile. C1 is the upper Ice Complex of the northern exposure of the megaslump, which includes only the active layer. D1 is a ravine (active layer), formed and expanding by temporary streams in the spring-summer period, and water flows down into the Batagay River.
The soil density (g cm−3) in natural composition was determined by taking samples every 10 cm into steel cylinders with a defined volume of 100 cm−3. Knowing the mass of the cylinder with soil and the mass of the empty cylinder, we determined the difference in soil mass at certain moisture content. By determining the moisture percentage, we calculated the dry mass of the material. The density of the soil of undisturbed composition was obtained by dividing the mass of dry soil by cylinder volume.
The soil samples were processed in the laboratory at room temperature. The sediment was laid out on paper and dried to an air-dry state. After that, the samples were oven-dried for 10 h at a temperature of 105 °C to exclude excess moisture from the samples.
We determined the organic carbon (OC), inorganic carbon (IC) and total carbon (TC) content using a certified LECO RC612 multiphase carbon analyzer, according to DIN19539. The applied temperature programming allows dividing the various carbon forms into organic and inorganic forms. The maximum temperature for burning samples was 1100 °C in an oxidizing atmosphere.
Carbon stocks (kg m−2) were calculated for each selected layer. We calculated the stocks for the active and shielding layers and underlying permafrost and summed them to get the total carbon stock for the entire thickness. The calculation of carbon stocks was carried out, according to the Equation [33]:
S = H × p × X,
where S–carbon stock (kg m−2), H—soil layer depth, p—soil density (g cm−3) and X—average carbon content (%).
Statistical processing of the carbon data was carried out in the program StatSoft STATISTICA for Windows 13.3. To exclude distorted indicators in the sample set, a typical sample from the general set of observations was used. The data are presented as arithmetic means with the standard error of the mean values.

4. Results and Discussion

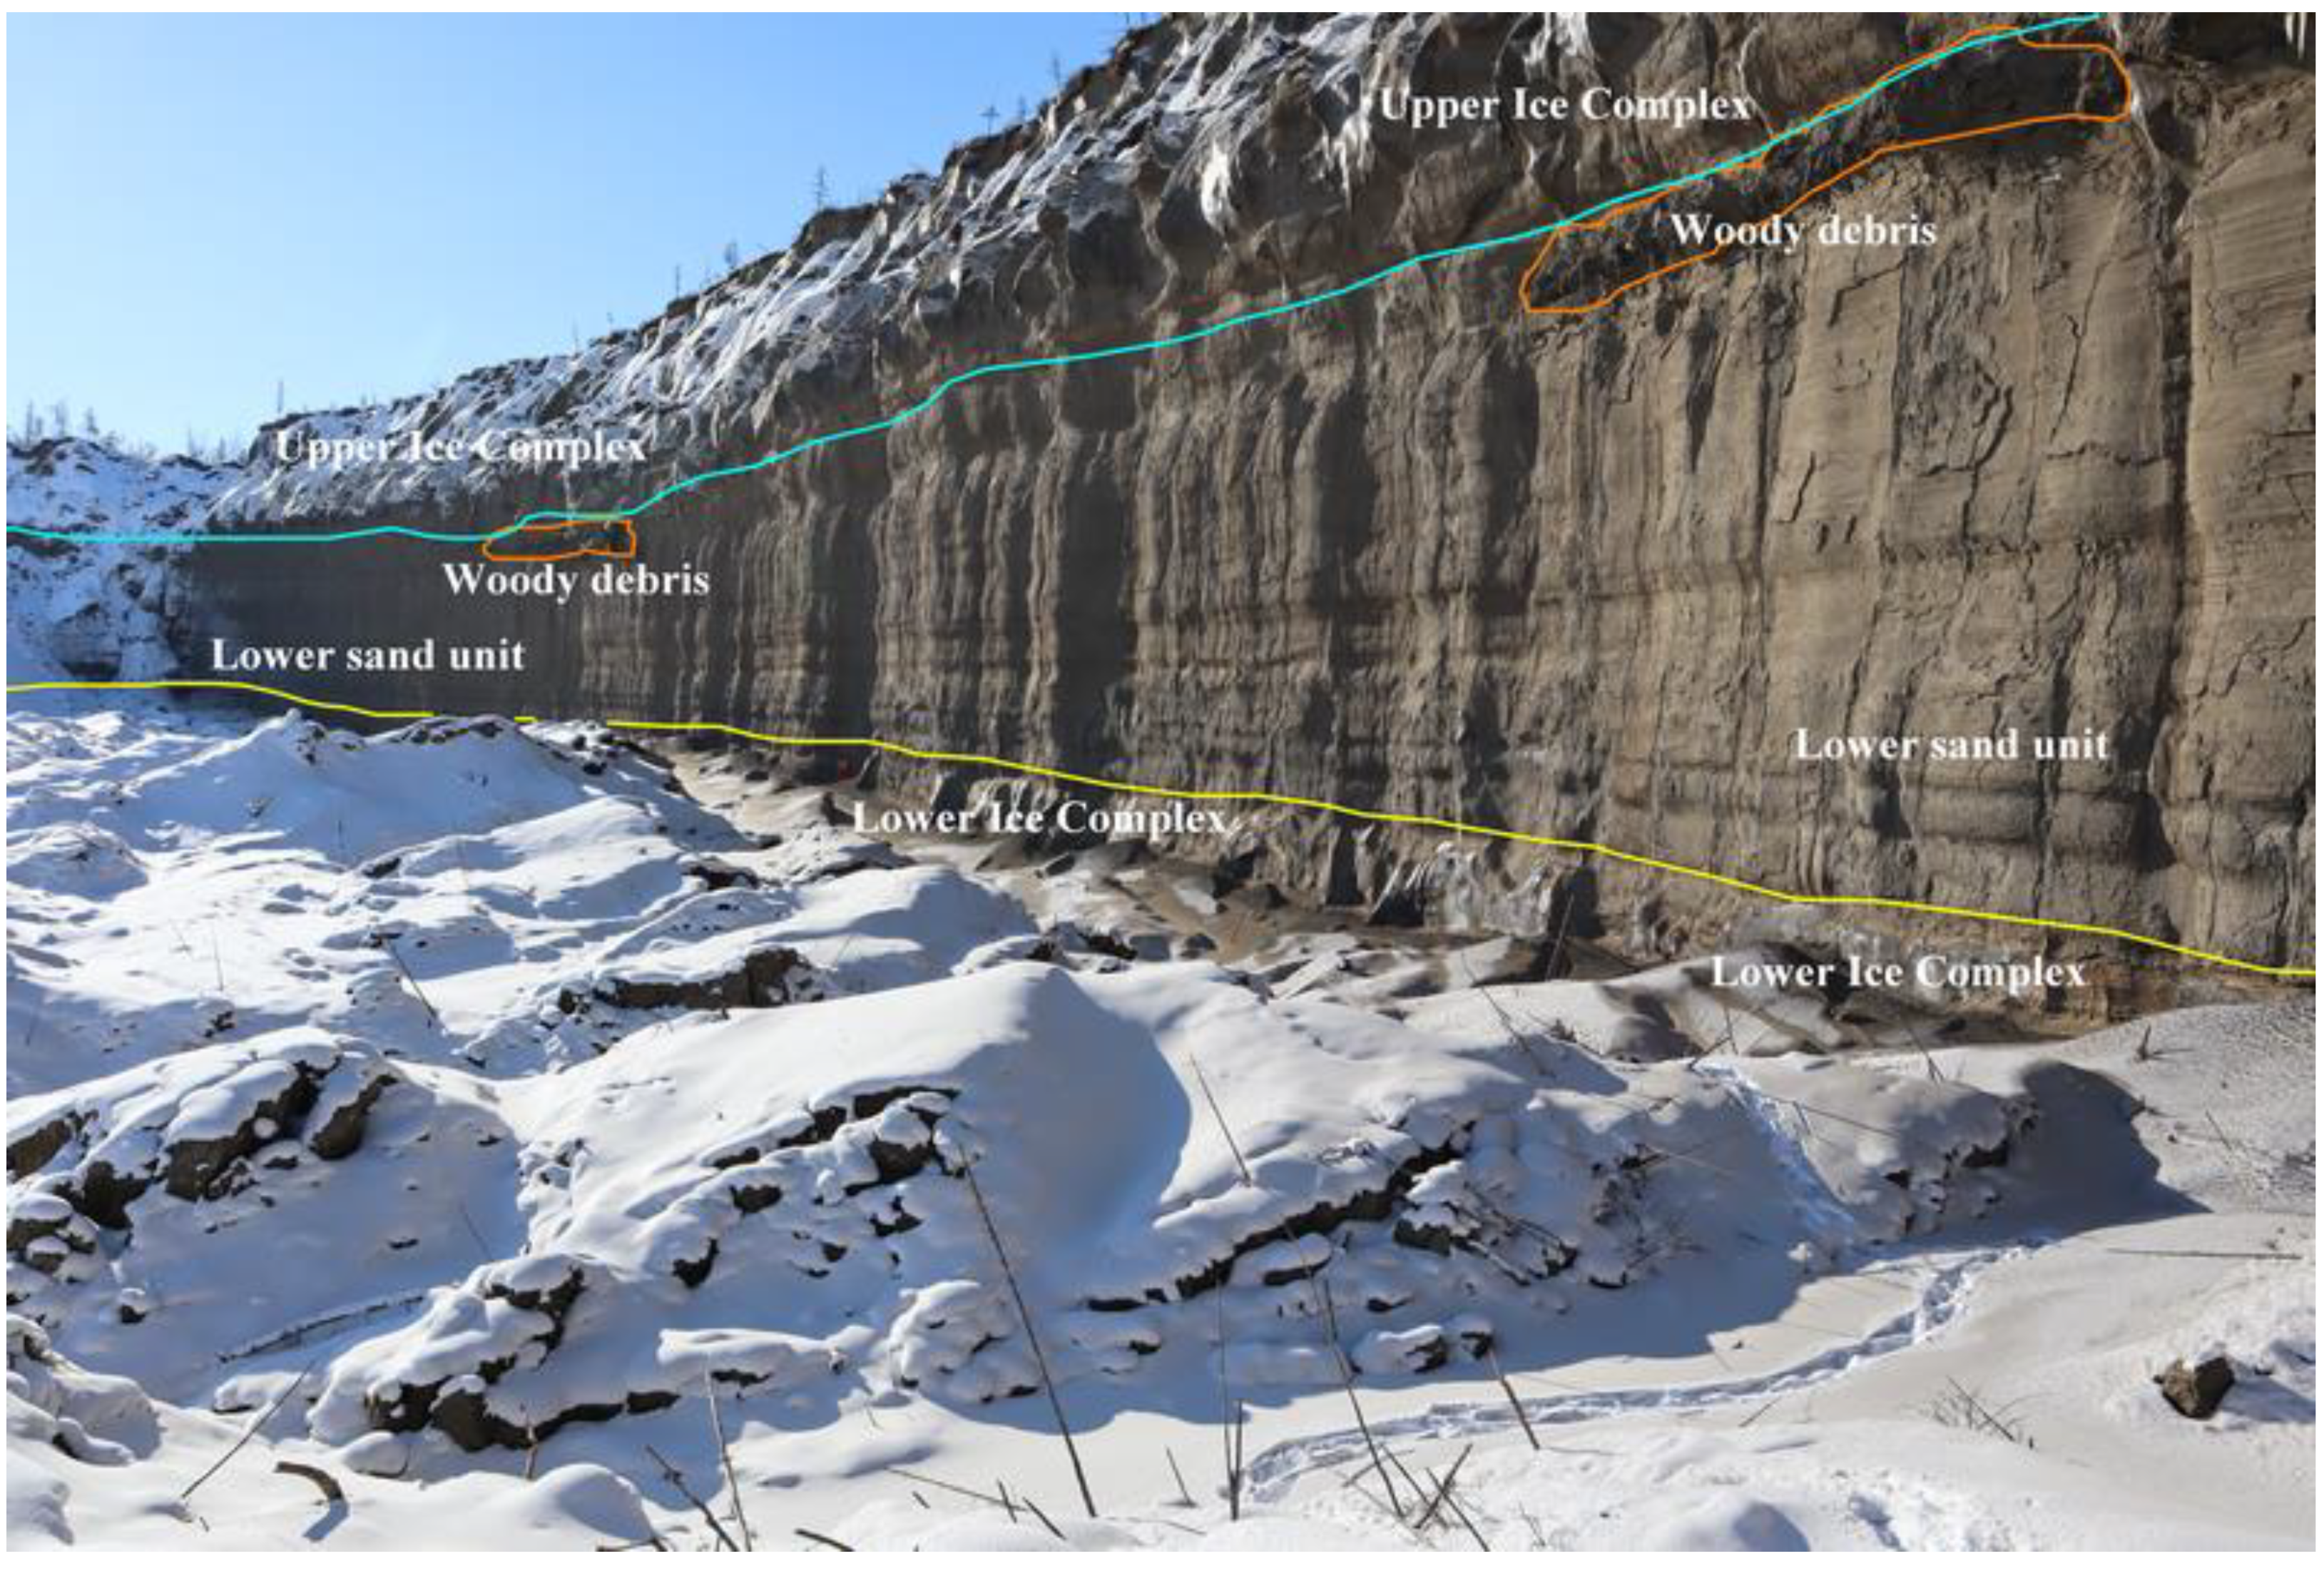
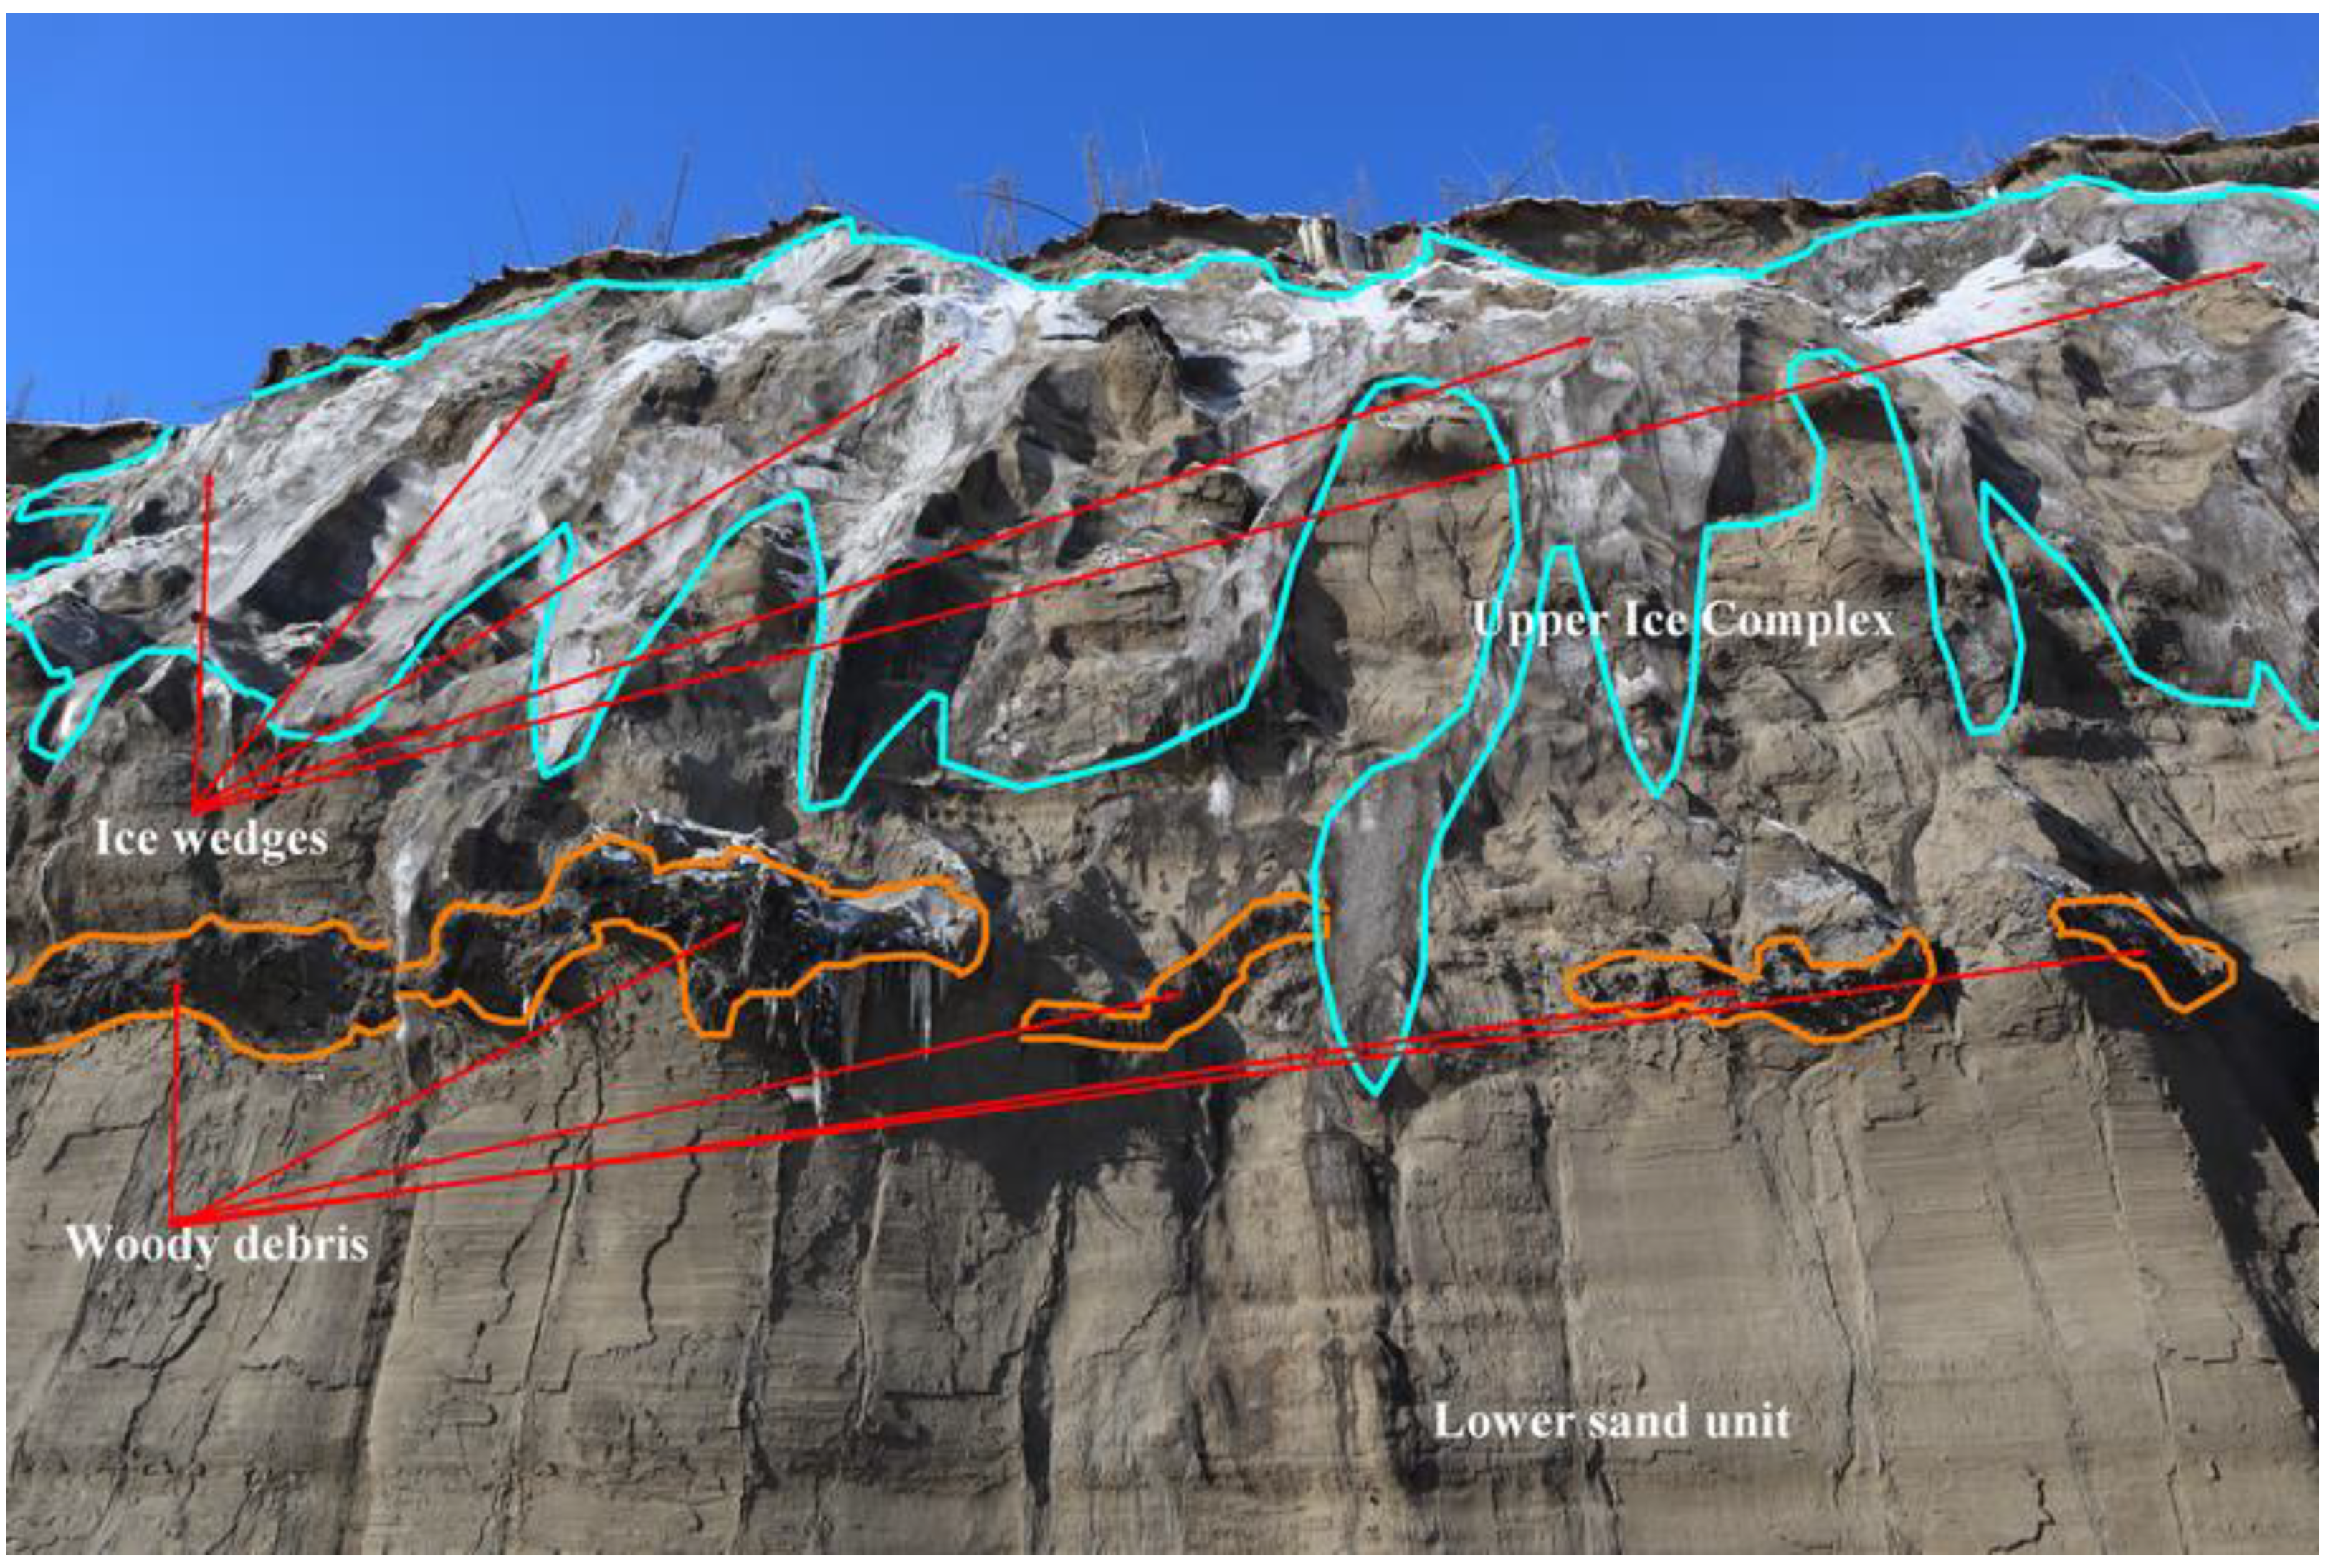
4.1. General Cryostratigraphy of Permafrost Exposed in the Batagay Megaslump

The Batagay megaslump is the largest one in the Northern Hemisphere occupying an area of 81 hectares, and with a length of more than 1000 m and a width of 800 m in 2019 (see Figure 1). The slump expands at high rates along the perimeter of up to 0.026 km2 year−1 (between 1991 and 2018) [3]. The exposed depth along the slump perimeter varies depending on the ice content of the permafrost deposits and the activity of thermo-erosion. It reaches up to about a 60 m depth in the central part of the headwall. The slope inclination is pre-defined by exogenous geological processes that formed the slopes of the adjacent Kirgilyakh and Khatyngnakh mounts, subsequent long-term aggradation of partly very ice-rich permafrost, i.e., the Ice Complex and thermo-erosion along with valley structures on the slopes by ground ice melt. The Batagay megaslump morphodynamics is characterized by active thermo-erosion at the walls and the fluvial erosion by temporary streams on the slump bottom. The latter transports eroded fine material with meltwater along the central slump channel into the floodplain of the Batagay River. However, substantial amounts of the eroded material, as well as permafrost remnants, remain on the slump bottom, forming a high relief of ridges and hills with different heights.
The stratigraphy in the southern exposure of the slump—close to the central headwall (sampling points A1 and B1)—was characterized by the lower and the upper Ice Complex units (about 3–7 m and 20–25 m thick, respectively), separated by the lower sand unit (up to about 20 m thick) and a distinct woody bed (up to about 3 m thick) at the base of the upper Ice Complex (Figure 2 and Figure 3). The upper Ice Complex was covered by the uppermost sediment layer with a thickness of 1.5 m.
Ice wedges of the upper Ice Complex were distributed to a depth of 14–24 m from the top of the slump. The upper Ice Complex contained many thin plant roots as well as large fragments of tree trunks. Below the upper Ice Complex at a depth of about 23 m, a sandy loam layer with an admixture of reddish-orange sand with a thickness of 1 m was striking. Underneath this layer with a thickness of 1.5–2.0 m, there was an organic-rich layer with numerous plant and wood fragments of different degrees of decomposition (woody bed; Figure 3). From a depth of 26 m, there was a sandy loam of gray and light brown color with narrow veins of sand of orange color with narrow composite wedges and many thin roots (lower sand unit). There were brown organic residues with a pungent odor of rotting material, as well as visible individual inclusions of charcoal.
The lower sand unit ended at a depth of 51 m and had a thickness of 25 m. Between the depths of 51 and 52 m, there was a layer of reddish-orange sand with a thickness of 0.4–0.5 m. From the depth of 51.5 m, the lower Ice Complex began with a thickness of up to 6–7 m. The upper boundary (visible part) of the ice wedges had a height of 0.4–1.2 m. There were ice schlieres with angled directions from the sides of the ice wedges. Above the ice wedges, there was a layer consisting of icy sandy loam of dark gray color which was penetrated by roots, and below was a layer of silty sandy loam of brown color alternating with crushed stones, inclusions of charcoal and narrow strips of peat.
The wedge ice of the upper Ice Complex was pillar-shaped, resembling a solid wall of ice from a distance. Table 1 summarizes descriptions of the cover deposits (samples in profiles B1, C1 and D1) of the upper Ice Complex, mainly composed of sandy and dusty particles with a localized separate newly formed structure (ironing) and individual mechanical inclusions of pebbles and gravel, which formed one soil pedon for the Batagay megaslump. The unit sampled at A1 represents a separate feature of the lower Ice Complex. The formation of the lower Ice Complex and its preservation remains uncertain. Perhaps, the lower Ice Complex survived at least partly due to the thick and rapidly accumulated lower sand unit that is up to about 25 m thick and is relatively ice-poor. But in this case, what contributed to such an active accumulation of sedimentary cover over the lower Ice Complex? The lower Ice Complex is surrounded by a heterogeneous composition of materials such as sandy loam and loess. The origin and existence of loess to a depth of 58 m suggests the accumulation of loess formations occurred as a result of frost weathering and solifluction processes due to periglacial phenomena in the Batagay area.

4.2. Carbon Stocks of the Lower and the Upper Ice Complex Units, and the Uppermost Cover

It is necessary to take into account that microorganisms begin to multiply actively in thawing permafrost [20]. When organic matter is oxidized, they remove carbon from the bound state into the atmosphere. The degree of decomposition of soil organic matter depends on the properties of the soil as well as the depth of the profile and community of bacteria, archaea and eukaryotes, which are mostly found in frozen soils. This leads to the intensification of microbial metabolic activity and the possible creation of positive feedback to the conditions of anticipating thawing of the permafrost [34,35,36,37].
The main fraction of OC was concentrated in the active layer topping the upper Ice Complex due to the productivity of this layer, both in terms of greater seasonal thawing and processing of soil organic matter by microbes (Table 2).
The resulting determinants are soil warming up to positive temperatures and activation of microbiological processes; as a result, destruction and intensive mineralization of animals and plant residues occur. Variations in the OC content in the active layer varied widely from a minimum value of 0.3% to a maximum of 12.5%. Higher content of OC was prevalent on the slopes of the southern exposure. Consequently, for the northern exposure slope (C1), the average OC value was 2.1%, while for the southern exposure (B1) and the ravine (D1) it was higher with 3.5% and 2.8%, respectively. The deep penetration of heat on the southern exposure slopes causes permafrost thaw and collapse in the warm period of the year compared with the northern exposure slopes, as is noticeable in the picture (see Figure 1). This increases the physical runoff of soil material into the Batagay River, as well as its subsidence on the bottom of the slump.
The properties of the shielding layer are closely related to the active (seasonally thawed) layer. The susceptibility of the seasonally thawed layer to the constant cycle of freezing and thawing determines the presence or absence of the frozen shielding layer at the uppermost part of permafrost. In case of destruction of the vegetation cover, the active layer degrades as a result of soil temperature increase, and the shielding layer loses its usual boundaries and merges with seasonally thawed soil, which leads to a lack of shielding properties leading to permafrost degradation and thaw subsidence. The average OC content in the shielding layer was low if compared to the active layer, reaching only 0.3%. This low OC content is most likely due to the buffer properties of the shielding layer, its low thickness, low moisture content and the paretic rate of chemical reactions. In the permafrost layer, the average OC content for the lower Ice Complex (A1) was 0.65% and for the upper Ice Complex (B1) is 1.04%. There was a concentration increase of 58.5% and 74.0% compared to the shielding layer. Perhaps this is the result of the genetic features of lower cryogenic horizon formation and the water presence in it with ongoing metabolic processes even at temperatures below 0 °C. It is worth noting that in the past, organic residues deposited in combination with heterotrophic microbial activity were capable of carbon remineralizing, despite the negative temperatures of the deposits.
The deposits of the Batagay megaslump had a small amount of carbonate in their composition. This is apparent in low inorganic carbon values, and there were no significant variations over depth. The inorganic carbon distribution was homogeneous both in the active layer and permafrost with systematic low values over the entire profile of sediments. Consequently, the oxide group of minerals took part in the formation of the deposits, for example, quaternary formations of the slump mainly consisted of quartz minerals in the form of sand and they are represented by the loess fraction.
TC content is formed from the two previous carbon fractions (OC and IC); therefore, it basically repeats the nature of their distribution in differentiated (elementary) layers.
Table 3 shows the carbon stocks of the studied stratigraphic features of the Batagay megaslump. The enormous amount of organic carbon was stored in the active layer for sections B1 and D1, where 60% of organic carbon was concentrated. At the same thickness of the active layer, the OC in C1 amounted to 9.52 kg m−2, while the OC of D1 reached 18.03 kg m−2, which was almost twice as much. Even with a changing of slope exposure, the stocks for these sections in the active layer increased from the northern to the southern exposure by 42%–47% of organic carbon.
The lowest carbon stocks of all studied stratigraphic features were recorded in the shielding layer, reaching 1.3 kg OC m−2 and 0.5 kg IC m−2. IC stocks in the active layer of section B1 did not differ from the other two profiles (C1 and D1) and ranged from 2 to 2.2 kg m−2. Carbonates enriched the first meter from the surface in non-permafrost soils. Under permafrost conditions, rather high inorganic carbon data were observed, 1.8 kg m−2 close to the level of the active layer. Section A1 had a higher IC stock of 3.6 kg m−2. By moving to the lower Ice Complex, the IC reserves were in an an inactive state due to the influence of negative soil temperature, with substances trying to penetrate with soil solutions to the Yedoma horizons, and most likely the reserves remained unchanged for an extended period. Low estimates of inorganic carbon in the deposits of the Batagay slump are the result of low natural carbonate, as well as frosty weathering of rocks. Carbonate formation occurs in soil pores and frost cracks, indicating their predominant dissolution and leaching in cold climate conditions.
The upper Ice Complex (B1) shows the distribution of the carbon in the elementary layers and the conjugation of carbon from the thickness and the amount of carbon available for mobilization in them. The maximum reserves of total carbon are contained in the active layer and amount to 18.72 kg m−2, the minimum in the shielding layer is 1.81 kg m−2, and in permafrost rocks, it is 10.34 kg m−2. In total, 30.87 kg m−2 was deposited in a two-meter thickness. The ratio of organic and inorganic carbon in the section varies in scale for the active layer-15, the shielding layer-3 and permafrost deposits-5. The ratio indicators show that organic carbon is the dominant feature in the soil horizon, layer or sediment. The higher this value, the more organic part is contained in a particular element of the Ice Complex. Also, this indicates the ability of organic carbon to be a nutrient medium for microorganisms and a source of CO2. Inorganic carbon indicates the level of carbonate in a given horizon.
In the upper two meters of the Ice Complex, carbon stocks were 30.87 kg m−2. In the study area, the dominating forest species is Larix cajanderi. Its phytomass reserves barely exceeded 6.00 kg m−2, which is formed mainly due to green, lignified aerial parts, roots and moss-lichen complexes. Stocks of dead organic matter are 3.00 kg m−2, and litter is 2.50 kg m−2. In the northern taiga zone, they are considered to be the forests with the lowest production, with about 11.50 kg m−2 per year [38]. As a result, carbon accumulation rates are low in the sediments of the upper Ice Complex. The main part of the organic matter is stored on the surface as a humus horizon of the soil, which undergoes degradation and weak decomposition, and the mineralization rate in such natural conditions remains low.
There is no doubt that the continental [1,6] genesis of the formation of the lower Ice Complex (A1) and its archaic past, compared with the upper Ice Complex (B1), affected the loss, impossibility of renewal and accumulation of plant organic matter. The cycling of the biogenic elements was interrupted by the rapid accumulation of sandy loam layers and sediment deposits [5] and most likely by the removal of organic layer beyond the meadow steppes [39] due to aeolian processes. We estimated the amount of ancient buried carbon at 17.66 kg m−2 for a thickness of 1.2 m.
Permafrost degradation caused by global warming is not always a catastrophic consequence for the ecumene. To justify this point of view, we give a few well-founded examples. Siberian larch forests occupy 40% of all coniferous wood in Russia, which develop on permafrost. The amount of accessible nutrients for trees increases with permafrost degradation, which causes an increase in their biomass [40]. An increase in the average annual temperature and rainfall contributes to the advancement of natural zones deep into the north, expanding the agricultural area and changing the structure of the soil cover with an increasing share of organic matter due to an increase in the productivity of vegetation [41].
The permafrost zone has changed repeatedly, giving way to periods of warming and cooling, which favoured the formation and accumulation of permafrost in the past. With a certain degree of probability, it can be assumed that the multi-tiered features of the Batagay megaslump and their heterogeneous origin are the results of the participation of several geological factors:
(a)
prolonged permafrost conditions of the territory with cryogenic and exogenous processes occurring in it;
(b)
the transfer of aeolian material and its accumulation;
(c)
the impact of the Quaternary climate and paleoclimate;
(d)
the movement and deformation as a result of the tectonic influence of the territory. That means the Adycha–Taryn general snap has or had an impact on the formation of the Batagay megaslump in conjunction with the other listed predictors. This is because the formation of such a large-scale current geocryological object in the North of Yakutia could not have taken place without the participation of intense seismotectonic conditions of the territory.
The anthropogenic activity was also one of the significant reasons for the formation of the megaslump. The economic and industrial development of the northern territories has never left an integral ecosystem behind, especially in such vulnerable natural conditions as boreal forests or tundra landscapes, which undoubtedly provoked the degradation of the Batagay Ice Complex through the destruction of vegetation and soil cover. Cutting down forests for timber for consumer needs, including the destabilizing pyrogenic situation at the site, has also had an impact.

5. Conclusions

In Yedoma deposits, carbon stocks are at a low level, which is typical of Northern Yakutia. The potential for the formation of organic matter in the local natural conditions of the Yana Upland is limited by climatic features and primary production of the forest. First of all, the soft parts of plants and carbon fractions that are readily accessible to microorganisms decompose to the final mineralization product, and the bulk of the organic matter reserves are stored on the soil surface, forest litter and in the first meter of the Ice Complex. As long as these reserves remain intact, the organic system is in a stable state, and there is a dynamic equilibrium between the release of carbon and its decrease in the atmosphere.
Otherwise, with the vast Ice Complex degradation on the Yansky plateau, it is possible that new large-scale sites like the Batagay megaslump will appear. This is not just about the study area, but also about the whole cryolithozone of the planet. As a result, greenhouse gas emissions will increase, and the reserves of conserved organic matter will be significantly depleted, which will lead to irreversible processes of the biological system and climate changes.
At the present time the Batagay megaslump of North-Eastern Siberia remains the only large geocryological object on Earth which is demonstrating the impact of anthropogenic and natural cause-and-effect connections on permafrost. It is also an obvious example of how permafrost is unprotected and prone to rapid degradation in a very short period of time if law enforcement measures to protect and prevent the melting of permafrost are not taken.

Author Contributions

Conceptualization: A.G.S. and A.C.; Methodology, A.G.S., S.W., A.F. and A.K.; Investigation, all authors; Writing-Original Draft Preparation: A.G.S., S.W., A.K., A.C., A.F.; Writing—Review & Editing, A.G.S., A.C., S.W., A.F., A.K., I.S., G.S. All authors have read and agreed to the published version of the manuscript.

Funding

Financial support for this study was provided by Deutsche Forschungsgemeinschaft (DFG grant no. WE4390/7-1) and project IX.127.2.3 (Siberian Branch Russian Academy of Sciences). Thaw slump relief analysis was supported by RFBR grants 18-05-60080 and 18-05-60221.

Acknowledgments

We are grateful to the researchers of the Institute of Applied Ecology of the North of North-East Federal University, Yakutsk for providing the opportunity to research the Batagay thaw slump. We are sincerely grateful to the rescuer and climber of the Ministry of Emergency Situations of Russia, the Moscow branch of the Main Directorate for Moscow, Dmitry Ukhin, for the vertical sampling of soil and ground ice in the extreme conditions of the north of Yakutia.

Conflicts of Interest

The authors declare no conflict of interest.

References

  1. Kunitsky, V.V.; Syromyatnikov, I.I.; Schirrmeister, L.; Skachkov, Y.B.; Grosse, G.; Wetterich, S.; Grigoriev, M.N. Ice rocks and thermal denudation near Batagai (Yanskoye plateau, Eastern Siberia). Earth Cryosphere 2013, 17, 56–68. (In Russian) [Google Scholar]
  2. Günther, F.; Grosse, G.; Wetterich, S.; Jones, B.M.; Kunitsky, V.V.; Kienast, F.; Schirrmeister, L. The Batagay mega thaw slump, Yana Uplands, Yakutia, Russia: Permafrost thaw dynamics on decadal time scale. In Proceedings of the PAST Gateways—Palaeo-Arctic Spatial and Temporal Gateways: Third International Conference and Workshop, Potsdam, Germany, 18–22 May 2015; pp. 45–46. [Google Scholar]
  3. Vadakkedath, V.; Zawadzki, J.; Przezdziecki, K. Multisensory satellite observations of the expansion of the Batagaika crater and succession of vegetation in its interior from 1991 to 2018. Environ. Earth Sci. 2020, 79, 1–10. [Google Scholar] [CrossRef] [Green Version]
  4. Zhurlov, O.S.; Grudinin, D.A.; Yakovlev, I.G. Phylogenetic 16S metagenomic analysis and antibiotic resistance of psychrotolerant bacteria isolated from the soil of the Batagai failure. Int. J. Appl. Basic Res. 2015, 11, 648–651. (In Russian) [Google Scholar]
  5. Opel, T.; Murton, J.B.; Wetterich, S.; Meyer, H.; Ashastina, K.; Günther, F.; Grotheer, H.; Mollenhauer, G.; Danilov, P.P.; Boeskorov, V.; et al. Past climate and continentality inferred from ice wedges at Batagay megaslump in the Northern Hemisphere’s most continental region, Yana Highlands, interior Yakutia. Clim. Past 2019, 15, 1443–1461. [Google Scholar] [CrossRef] [Green Version]
  6. Murton, J.B.; Edwards, M.E.; Lozhkin, A.V.; Anderson, P.M.; Savvinov, G.N.; Bakulina, N.; Bondarenko, O.V.; Cherepanova, M.V.; Danilov, P.P.; Boeskorov, V.; et al. Preliminary paleoenvironmental analysis of permafrost deposits at Batagaika megaslump, Yana Uplands, northeast Siberia. Quat. Res. 2017, 87, 314–330. [Google Scholar] [CrossRef] [Green Version]
  7. Wetterich, S.; Murton, J.B.; Toms, P.; Wood, J.; Blinov, A.; Opel, T.; Fuchs, M.C.; Merchel, S.; Rugel, G.; Gärtner, A.; et al. Multi-method dating of ancient permafrost of the Batagay megaslump, East. Siberia. In Proceedings of the EGU General Assembly 2020, Lund, Sweden, 4–8 May 2020. EGU2020-2999, online. [Google Scholar]
  8. Kienast, F.; Ashastina, K.; Troeva, E. Phylogeography of a west-Beringian endemic plant: An ancient seed of Stellaria jacutica Schischk. detected in permafrost deposits of the last interglacial. Rev. Palaeobot. Palynol. 2018, 259, 48–54. [Google Scholar] [CrossRef]
  9. Melchinov, V.P.; Pavlov, A.A.; Kladkin, V.P.; Bashkuev, Y.B.; Haptanov, V.B. Radio wave diagnostics of ice rocks in the zone of thermokarst failure (Batagai, Yakutia). In Proceedings of the XXVI All-Russian Open Scientific Conference, Kazan, Russian, 1–6 July 2019; Kazan (Volga) Federal University Publishing House: Kazan, Russian, 2019; Volume 1, pp. 495–498. (In Russian). [Google Scholar]
  10. Vasilchuk, Y.K.; Vasilchuk, D.Y.; Budantseva, N.A.; Vasilchuk, A.K.; Trishin, A.Y. High-Resolution Oxygen Isotope and Deuterium Diagrams for Ice Wedges of the Batagai Yedoma, Northern Central Yakutia. Dokl. Earth Sci. 2019, 487, 986–989. [Google Scholar] [CrossRef]
  11. Vasilchuk, Y.K.; Vasilchuk, J.Y.; Budantseva, N.A.; Vasilchuk, A.C.; Trishin, A.Y. Isotopic and geochemical features of the Batagaika yedoma (preliminary results). Arct. Antarct. 2017, 3, 69–96. (In Russian) [Google Scholar]
  12. Ashastina, K.; Kuzmina, S.; Rudaya, N.; Troeva, E.; Schoch, W.; Römermann, C.; Reinecke, J.; Otte, V.; Savvinov, G.; Wesche, K.; et al. Woodlands and steppes: Pleistocene vegetation in Yakutia’s most continental part recorded in the Batagay permafrost sequence. Quat. Sci. Rev. 2018, 196, 38–61. [Google Scholar] [CrossRef]
  13. Fedorov, A.N.; Konstantinov, P.Y.; Vasilyev, N.F.; Shestakova, A.A. The influence of boreal forest dynamics on the current state of permafrost in Central Yakutia. Polar Sci. 2019, 22, 100483. [Google Scholar] [CrossRef]
  14. Knorre, A.A.; Kirdyanov, A.V.; Prokushkin, A.S.; Krusic, P.J.; Büntgen, U. Tree ring-based reconstruction of the long-terminfluence of wildfires on permafrost active layer dynamics in Central Siberia. Sci. Total Environ. 2019, 652, 314–319. [Google Scholar] [CrossRef] [PubMed] [Green Version]
  15. Karelin, D.V.; Zamolodchikov, D.G.; Gilmanov, T.G. Reserves and carbon production in the phytomass of tundra and forest-tundra ecosystems of Russia. Forestry 1995, 5, 29–36. (In Russian) [Google Scholar]
  16. Chestnykh, O.V.; Zamolodchikov, D.G.; Utkin, A.I. General reserves of bioremediation of carbon and nitrogen in the soil of the forest fund of Russia. Russ. For. Sci. 2004, 4, 30–42. (In Russian) [Google Scholar]
  17. Hugelius, G.; Strauss, J.; Zubrzycki, S.; Harden, J.W.; Schuur, E.A.G.; Ping, C.-L.; Schirrmeister, L.; Grosse, G.; Michaelson, G.J.; Koven, C.D.; et al. Estimated stocks of circumpolar permafrost carbon with quantified uncertainty ranges and identified data gaps. Biogeosciences 2014, 11, 6573–6593. [Google Scholar] [CrossRef] [Green Version]
  18. Schepashchenko, D.G.; Mukhortova, L.V.; Shvidenko, A.Z.; Vedrova, E.F. Reserves of organic carbon in the soils of Russia. Soil Sci. 2013, 2, 123–132. (In Russian) [Google Scholar]
  19. Schuur, E.A.G.; McGuire, A.D.; Schädel, C.; Grosse, G.; Harden, J.W.; Hayes, D.J.; Hugelius, G.; Koven, C.D.; Kuhry, P.; Lawrence, D.M.; et al. Climate change and the permafrost carbon feedback. Nature 2015, 520, 171–179. [Google Scholar] [CrossRef] [PubMed]
  20. Masyagina, O.V.; Menyailo, O.V. The impact of permafrost on carbon dioxide and methane fluxes in Siberia: A meta-analysis. Environ. Res. 2020, 182, 109096. [Google Scholar] [CrossRef]
  21. Dao, T.T.; Gentsch, N.; Mikutta, R.; Sauheitl, L.; Shibistova, O.; Wild, B.; Schnecker, J.; Bárta, J.; Čapek, P.; Gittel, A.; et al. The fate of carbohydrates and lignin in north-east Siberian permafrost soils. Soil Biol. Biochem. 2018, 116, 311–322. [Google Scholar] [CrossRef]
  22. Bjorkman, A.; Myers-Smith, I.H.; Elmendorf, S.C.; Normand, S.; Rüger, N.; Beck, P.S.A.; Blach-Overgaard, A.; Blok, D.; Cornelissen, J.H.C.; Forbes, B.C.; et al. Plant functional trait change across a warming tundra biome. Nature 2018, 562, 57–62. [Google Scholar] [CrossRef]
  23. Douglas, T.A.; Turetsky, M.R.; Koven, C.D. Increased rainfall stimulates permafrost thaw across a variety of Interior Alaskan boreal ecosystems. Npj Clim. Atmos. Sci. 2020, 3, 1–7. [Google Scholar] [CrossRef]
  24. Isachenko, A.G. Landscapes of the USSR; Leningrad University Publishing House: Leningrad, Russia, 1985; 320p. (In Russian) [Google Scholar]
  25. Danilov, I.D. The permafrost zone of the Earth and its zoning. Bull. USSR Acad. Sci. Geogr. Ser. 1983, 1, 12–18. (In Russian) [Google Scholar]
  26. The Geography of Siberia at the Beginning of the XXI Century: Eastern Siberia; Korytny, L.M.; Tulokhonov, A.K. (Eds.) Geo Publishing House: Novosibirsk, Russia, 2016; Volume 6, 396p. (In Russian) [Google Scholar]
  27. Imaev, V.S.; Imaeva, L.P.; Kozmin, B.M. Seismotectonics of Yakutia; GEOS Publishing House: Moscow, Russia, 2000; 227p. (In Russian) [Google Scholar]
  28. Ershov, E.D. General Geocryology; Moscow State University Publishing House: Moscow, Russia, 2002; 683p. (In Russian) [Google Scholar]
  29. Baulin, V.V.; Dubikov, G.I.; Aksenov, V.I.; Koreisha, M.M.; Murzaev, V.A.; Poznanin, V.L.; Rivkin, F.M. Geocryological Glossary; GEOS Publishing House: Moscow, Russia, 2003; 140p. (In Russian) [Google Scholar]
  30. Vadyunina, A.F.; Korchagina, Z.A. Methods for Studying the Physical Properties of Soils; Agropromizdat Publishing House: Moscow, Russia, 1986; 416p. (In Russian) [Google Scholar]
  31. Trofimov, V.T.; Balykova, S.D.; Bolikhovskaya, N.S.; Andreeva, T.V.; Alekseev, B.A.; Bolikhovsky, V.F.; Dodonov, A.E.; Ermakov, Y.G.; Ershova, A.V.; Kadyrov, E.V.; et al. Loess Mantle of the Earth and its Properties; Moscow State University Publishing House: Moscow, Russia, 2001; 464p. (In Russian) [Google Scholar]
  32. Shur, Y.L. Thermokarst; Nedra Publishing House: Moscow, Russia, 1977; 80p. (In Russian) [Google Scholar]
  33. Ganzhara, N.F.; Borisov, B.A.; Baibekov, R.F. Workshop on Soils Study; Agrokonsalt Publ.: Moscow, Russia, 2002; 280p. (In Russian) [Google Scholar]
  34. Krylenkov, V.A.; Goncharov, A.E. Microbiota of the Terrestrial Cryosphere; Foliant Publishing House: St. Petersburg, Russia, 2019; 448p. (In Russian) [Google Scholar]
  35. Vincent, W.F. Microbial ecosystem responses to rapid climate change in the Arctic. Int. Soc. Microb. Ecol. 2010, 4, 1087–1090. [Google Scholar] [CrossRef] [PubMed] [Green Version]
  36. Graham, D.E.; Wallenstein, M.D.; Vishnivetskaya, T.A.; Waldrop, M.P.; Phelps, T.J.; Pfiffner, S.M.; Onstott, T.C.; Whyte, L.G.; Rivkina, E.M.; Gilichinsky, D.A.; et al. Microbes in thawing permafrost: The unknown variable in the climate change equation. Int. Soc. Microb. Ecol. 2012, 6, 709–712. [Google Scholar] [CrossRef] [PubMed]
  37. Nikrad, M.P.; Kerkhof, L.J.; Häggblom, M.M. The subzero microbiome: Microbial activity in frozen and thawing soils. FEMS Microbiol. Ecol. 2016, 92, fiw081. [Google Scholar] [CrossRef] [PubMed]
  38. Bazilevich, N.I. Biological Productivity of Ecosystems of Northern Eurasia; Nauka Publishing House: Moscow, Russia, 1993; 293p. (In Russian) [Google Scholar]
  39. Ashastina, K.; Schirrmeister, L.; Fuchs, M.; Kienast, F. Palaeoclimate characteristics in interior Siberia of MIS 6-2: First insights from the Batagay permafrost mega-thaw slump in the Yana Highlands. Clim. Past 2017, 13, 795–818. [Google Scholar] [CrossRef] [Green Version]
  40. Prokushkin, A.S.; Hagedorn, F.; Pokrovsky, O.S.; Viers, J.; Kirdyanov, A.V.; Masyagina, O.V.; Prokushkina, M.P.; McDowell, W.H. Permafrost regime affects the nutritional status and productivity of larches in Central Siberia. Forests 2018, 9, 314. [Google Scholar] [CrossRef] [Green Version]
  41. Shpedt, A.A.; Ligaeva, N.A.; Emelyanov, D.V. Transformation of soil and land resources of the Middle Siberia in the conditions of climatic changes. In Proceedings of the IOP Conference Series: Earth and Environmental Science, Krasnoyarsk, Russian, 20–22 June 2019; Volume 315, p. 052051. (In Russian). [Google Scholar]
Figure 1. Batagay megaslump location in the Yana Upland in Northeast Yakutia and orthophotomosaic overview based on unmanned aerial vehicle (UAV) data from April 2019. Digital Surface Model (DSM) based on UAV data from April 2019. Sampling locations: The lower Ice Complex (A1), the upper Ice Complex (B1, C1) and cover deposits in the ravine (D1).
Land 09 00305 g001
Figure 2. Outcrop in the form of a steep wall (southern exposure), represented by upper and lower Ice Complex units intersected by the lower sand unit and overlain by the shielding and active layers.
Land 09 00305 g002
Figure 3. The upper Ice Complex unit overlying the woody bed (orange line) and the lower sand unit.
Land 09 00305 g003
Table 1. Cryolithological characterization of the studied stratigraphic features exposed in the Batagay megaslump.
Sampled UnitsDescription of Selected Profile Sections
A1. Lower Ice Complex, southern exposure:
67°34′43.35″ N 134°45′41.58″ E
At the top there are light brown layers of loess with streaks of organic residues and hanging thin root. Single inclusions of coal are present. The width of the interlayers varies from 0.15 to 0.35 m. At the height of 1.5–1.7 m from the bottom of the slump, there is a strip of gravel of 1.2 m long. The size of the gravel varies from 3 mm to 3.5 cm. The profile is homogeneous; it is composed of sandy loam (sandy and dusty particles) of a dark gray color. The horizon is riddled with rare roots. There are inclusions of charred wood residues—small inclusions of brown decomposed organic matter. To the right of the sampling site, at a distance of 1.6 m and a height of 1.5 m, there is a light-brown interlayer with an orange tint of about 2.1 m long and 0.4 m wide. Its structure consists of small lumps with a diameter of 0.1–0.5 mm. Spots of black coal and thin roots are observed. In some sections, the material contains alternating ice schlieren. It has a conditional ataxic cryostructure. Above the interlayer, dark gray sand contains many roots.
B1. Upper Ice Complex, southern exposure:
67°34′36.87″ N 134°45′42.84″ E
Section from top to bottom at the edge of the wall:
(O) 0.0–0.04 m—forest litter (mosses, lingonberries, needles, rags).
(A) 0.04–0.14 m—humus horizon.
0.14–0.25 (0.30) m—light brown sandy loam with inclusions of coal, strongly penetrated by roots.
0.25 (0.30)–1.2 m—dark gray sandy loam, transition to the next horizon is clear, the border is even. The horizon contains many thin roots. The texture of the horizon is homogenous, with the exception of crushed stone inclusions at a depth of 0.8 m.
1.2–1.5 m—gray sandy loam with a whitish tint, a row of gravel separately located at a distance of 0.04 to 0.1 m, diameter from 0.002 to 0.01 m.
1.5 m—permafrost of the upper Ice Complex.
C1. Upper Sand, northern exposure:
67°34′40.58″ N 134°46′48.86″ E
Section from top to bottom from the edge of the wall:
(O) 0.0–0.03 m—forest litter (mosses, lingonberries, needles and rags).
(A) 0.03–0.08 m—dark brown humus horizon.
0.08–0.39 m—loam of light brown color, containing many roots. The transition to the next horizon is noticeable, the border is even, there were inclusions of pebbles with a diameter of 70–90 mm.
0.39–1.01 m—dark brown sandy loam. At a depth of 0.39–0.53 m, a large accumulation of roots from 0.53 m. At a depth of 0.74 m, there are holes with a diameter of 2 cm. The texture of the horizon is homogeneous.
D1. Ravine, southern exposure:
67°35′04.16″ N 134°46′41.34″ E
Section from top to bottom from the edge of the wall:
(O) 0.0–0.02 m—forest litter (leaves, needles, rags).
(A) 0.02–0.09 m—dark brown humus horizon, roots of different diameters abundant.
0.09–0.29 m—silt sandy loam of light brown color strongly penetrated by roots. The transition to the next horizon is subtle, the border is smooth.
0.29–1.0 m—gray sandy loam, rare thin roots, the horizon is homogeneous.
Table 2. The carbon content in the cover deposits of the upper and lower Ice Complex units. SD—standard deviation, min—minimum value, max—maximum value, mean—mean value, OC—organic carbon, IC—inorganic carbon, TC—total carbon.
B1. Upper Ice Complex. Southern Exposure of The Slump
IndexUnitOC, %IC, %TC, %
minActive layer0.270.060.36
max12.490.5913.07
mean3.500.233.74
SD1.620.081.70
minShielding layer0.260.090.36
max0.270.110.38
mean0.270.100.37
SD0.010.010.01
minUpper Ice Complex(permafrost)0.710.210.92
max1.380.231.60
mean1.040.221.25
SD0.140.010.14
A1. Lower Ice Complex. Southern Exposure of The Slump
minLower Ice Complex(permafrost)0.520.140.68
max0.890.201.08
mean0.650.170.82
SD0.030.010.03
C1. Upper Ice Complex. Northern Exposure of The Slump
minActive layer0.340.080.45
max6.850.327.13
mean2.050.152.20
SD0.790.030.81
D1. Ravine. Southern Exposure of The Slump
minActive layer0.270.100.38
max8.980.309.28
mean2.770.162.92
SD0.980.021.00
Table 3. Carbon stocks of different facies features of the Batagay megaslump.
B1. Upper Ice Complex. Southern Exposure of The Slump
Depth, mUnitDensity, g cm−3OC, kg m−2IC, kg m−2TC, kg m−2
0.04–0.14Active layer1.1511.230.6311.86
0.14–0.25(0.30)1.651.250.161.41
0.25(0.30)–1.21.654.031.425.45
Total 16.512.2118.72
SD 0.820.180.90
1.2–1.5Shielding layer1.651.310.501.81
SD 0.010.020.03
1.5–2.0 Upper Ice Complex
(permafrost)
1.658.531.8110.34
SD 1.130.031.12
Total 26.354.5230.87
SD 1.020.161.11
A1. Lower Ice Complex. Southern Exposure of The Slump
58.4–58.8Lower Ice Complex
(permafrost)
1.701.080.261.34
58.8–59.11.703.270.764.03
59.1–59.61.702.700.963.66
59.6–59.61.707.031.608.63
Total 14.083.5817.66
SD 0.580.130.71
C1. Upper Ice Complex. Southern exposure of the slump
0.0–0.03Active layer1.152.260.102.36
0.03–0.081.150.700.070.77
0.08–0,391.651.810.542.35
0.39–1.011.654.751.266.01
Total 9.521.9711.49
SD 0.450.150.58
D1. Ravine. Northern exposure of the slump
0.02–0.09Active layer1.156.650.216.86
0.09–0.291.656.510.406.92
0.29–1.01.654.871.366.23
Total 18.031.9720.01
SD 0.440.170.38

