Mapping Environmental Conflicts Using Spatial Text Mining


Abstract
1. Introduction
2. Materials and Methods
2.1. Materials
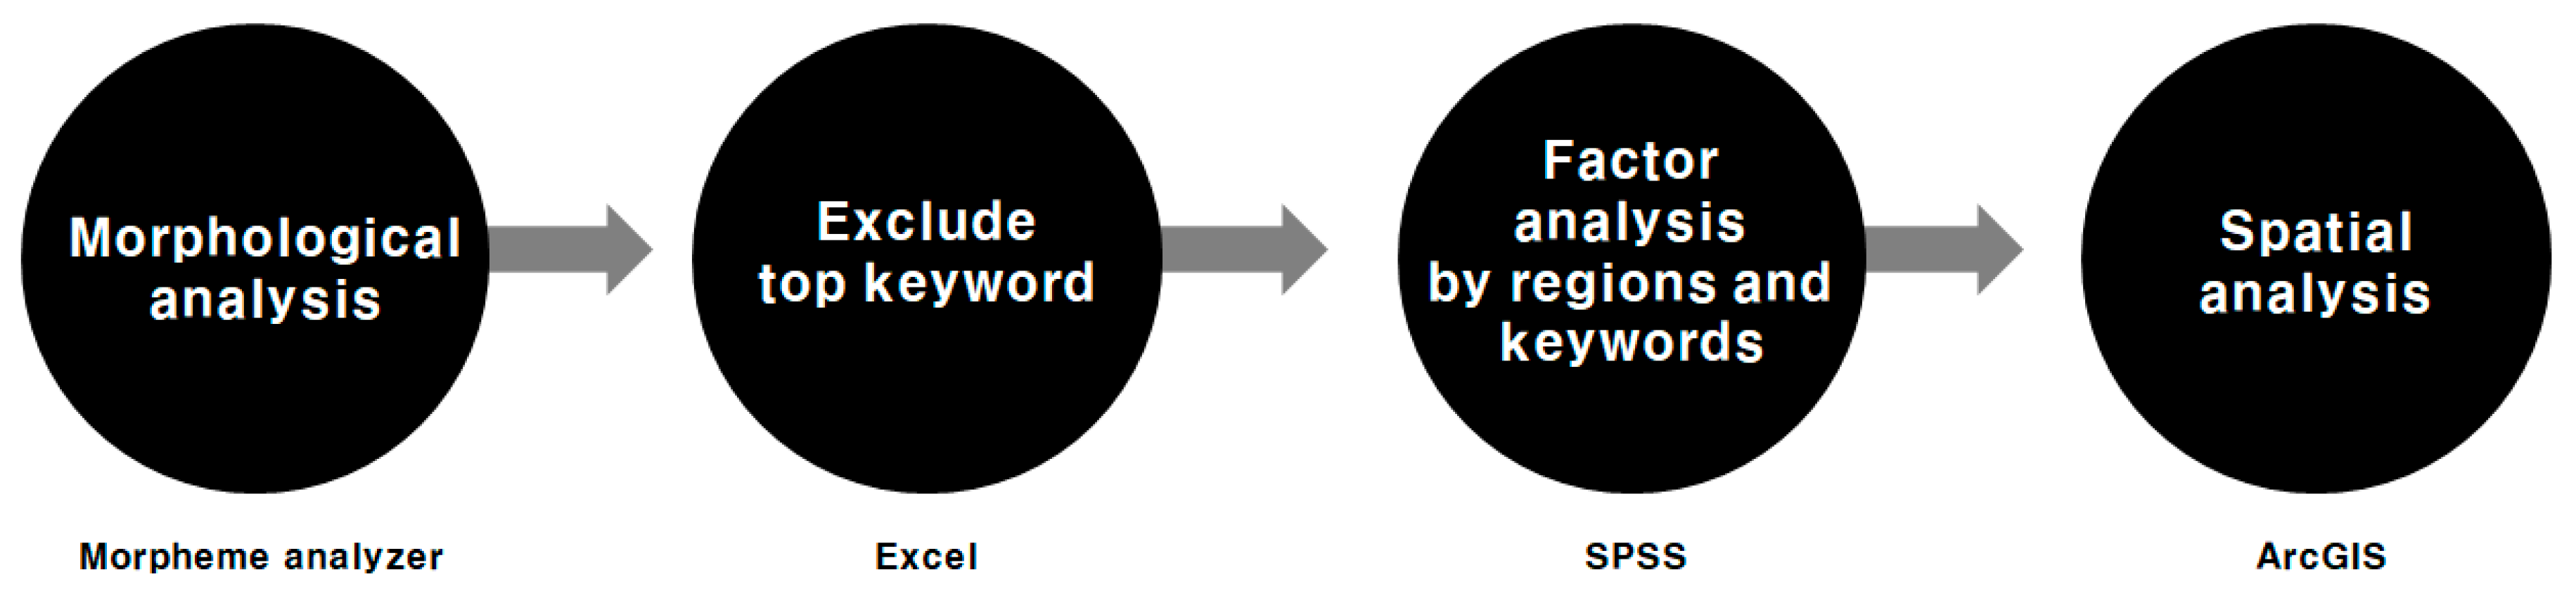
2.2. Methods
3. Results
4. Discussion
5. Conclusions
Author Contributions
Funding
Conflicts of Interest
References
- Scheidel, A.; Del Bene, D.; Liu, J.; Navas, G.; Mingorría, S.; Demaria, F.; Avila, S.; Roy, B.; Ertör, I.; Temper, L.; et al. Environmental conflicts and defenders: A global overview. Glob. Environ. Chang. 2020, 63, 102–104. [Google Scholar] [CrossRef] [PubMed]
- Le Billon, P. Wars of Plunder: Conflicts, Profits and the Politics of Resources; Columbia University Press: New York, NY, USA, 2012. [Google Scholar]
- Staniscia, B.; Komatsu, G.; Staniscia, A. Nature park establishment and environmental conflicts in coastal areas: The case of the Costa Teatina National Park in central Italy. Ocean Coast. Manag. 2019, 182, 104947. [Google Scholar] [CrossRef]
- Hanaček, K.; Rodríguez-Labajos, B. Impacts of land-use and management changes on cultural agroecosystem services and environmental conflicts—A global review. Glob. Environ. Chang. 2018, 50, 41–59. [Google Scholar] [CrossRef]
- Carranza, D.M.; Varas-Belemmi, K.; De Veer, D.; Iglesias-Müller, C.; Coral-Santacruz, D.; Méndez, F.A.; Torres-Lagos, E.; Squeo, F.A.; Gaymer, C.F. Socio-environmental conflicts: An underestimated threat to biodiversity conservation in Chile. Environ. Sci. Policy 2020, 110, 46–59. [Google Scholar] [CrossRef]
- Soytong, P.; Perera, R. Use of GIS tools for environmental conflict resolution at Map Ta Phut Industrial Zone in Thailand. Sustainability 2014, 6, 2435–2458. [Google Scholar] [CrossRef]
- Kim, I.; Arnhold, S. Mapping environmental land use conflict potentials and ecosystem services in agricultural watersheds. Sci. Total Environ. 2018, 630, 827–838. [Google Scholar] [CrossRef]
- Abram, N.K.; Meijaard, E.; Wilson, K.A.; Davis, J.T.; Wells, J.A.; Ancrenaz, M.; Budiharta, S.; Durrant, A.; Fakhruzzi, A.; Runting, R.K.; et al. Oil palm–community conflict mapping in Indonesia: A case for better community liaison in planning for development initiatives. Appl. Geogr. 2017, 78, 33–44. [Google Scholar] [CrossRef]
- Brown, G.; Kangas, K.; Juutinen, A.; Tolvanen, A. Identifying environmental and natural resource management conflict potential using participatory mapping. Soc. Nat. Resour. 2017, 30, 1458–1475. [Google Scholar] [CrossRef]
- Lee, J.-H.; Park, H.-J.; Kim, I.; Kwon, H.-S. Analysis of cultural ecosystem services using text mining of residents’ opinions. Ecol. Indic. 2020, 115, 106368. [Google Scholar] [CrossRef]
- Häberle, M.; Werner, M.; Zhu, X.X. Geo-spatial text-mining from Twitter–a feature space analysis with a view toward building classification in urban regions. Eur. J. Remote Sens. 2019, 52, 2–11. [Google Scholar] [CrossRef]
- Gulnerman, A.G.; Karaman, H. Spatial reliability assessment of social media mining techniques with regard to disaster domain-based filtering. ISPRS Int. J. Geo-Inf. 2020, 9, 245. [Google Scholar] [CrossRef]
- Ghosh, D.; Guha, R. What are we ‘tweeting’ about obesity? Mapping tweets with topic modeling and Geographic Information System. Cartogr. Geogr. Inf. Sci. 2013, 40, 90–102. [Google Scholar] [CrossRef] [PubMed]
- Park, S.B.; Kim, J.; Lee, Y.K.; Ok, C.M. Visualizing theme park visitors’ emotions using social media analytics and geospatial analytics. Tour. Manag. 2020, 80, 104–127. [Google Scholar] [CrossRef]
- Luhn, H.P. A business intelligence system. IBM J. Res. Dev. 1958, 2, 314–319. [Google Scholar] [CrossRef]
- Taminiau, Y.; Ferguson, J.; Moser, C. Instrumental client relationship development among top-ranking service professionals. Serv. Ind. J. 2016, 36, 789–808. [Google Scholar] [CrossRef]
- Soytong, P.; Perera, R. Spatial analysis of the environmental conflict between state, society and industry at the Map Ta Phut-Rayong conurbation in Thailand. Environ. Dev. Sustain. 2017, 19, 839–862. [Google Scholar] [CrossRef]
- Wittmer, H.; Rauschmayer, F.; Klauer, B. How to select instruments for the resolution of environmental conflicts? Land Use Policy 2006, 23, 1–9. [Google Scholar] [CrossRef]
- Kim, Y.; Kim, C.K.; Lee, D.K.; Lee, H.W.; Andrada, R.I.T. Quantifying nature-based tourism in protected areas in developing countries by using social big data. Tour. Manag. 2019, 72, 249–256. [Google Scholar] [CrossRef]
- Lee, H.; Seo, B.; Koellner, T.; Lautenbach, S. Mapping cultural ecosystem services 2.0–Potential and shortcomings from unlabeled crowd sourced images. Ecol. Indic. 2019, 96, 505–515. [Google Scholar] [CrossRef]
- Lee, C.H. Understanding rural landscape for better resident-led management: Residents’ perceptions on rural landscape as everyday landscapes. Land Use Policy 2020, 94, 104565. [Google Scholar] [CrossRef]
- Lee, J.H.; Choi, H. An analysis of public complaints to evaluate ecosystem services. Land 2020, 9, 62. [Google Scholar] [CrossRef]


| Keyword | Freq | Keyword | Freq | Keyword | Freq | Keyword | Freq | Keyword | Freq |
|---|---|---|---|---|---|---|---|---|---|
| Project | 253 | Construction | 68 | Jeju Island | 39 | Nuclear power plant | 33 | Restoration | 28 |
| Region | 235 | Result | 66 | Conservation | 39 | Education | 33 | Law | 28 |
| Environment | 175 | Organization | 64 | Composition | 39 | Waste | 32 | Public opinion | 28 |
| Citizen | 175 | Ecology | 63 | Create | 38 | Destruction | 32 | Case | 28 |
| Resident | 137 | Scale | 61 | Public-private | 38 | City of Incheon | 32 | Reinforcement | 28 |
| Planning | 114 | Energy | 59 | Private | 38 | State | 32 | Permission | 27 |
| Management | 113 | unit | 58 | Participation | 37 | Protection | 32 | Nuclear | 27 |
| Park | 112 | Use | 55 | Nature | 37 | Public | 32 | Budget | 27 |
| Problem | 109 | Development | 55 | Water quality | 37 | Decision | 32 | Plan | 27 |
| Development | 108 | Installation | 53 | Opposition | 37 | Thermal | 31 | Open | 27 |
| Carry forward | 100 | Prepare | 50 | Atmosphere | 37 | Applicable | 31 | Korean Federation for Environmental Movement | 26 |
| Progress | 94 | Demand | 49 | Improvement | 37 | Review | 31 | Solution | 26 |
| Investigation | 94 | Emission | 49 | Confirmation | 36 | Mud flat | 31 | Demolition | 26 |
| Need | 93 | Process | 48 | Administration | 36 | Open | 31 | Responsibility | 26 |
| Pollution | 93 | Operation | 46 | Surrounding | 36 | Conflict | 31 | Measure | 26 |
| Measure | 89 | Suspension | 45 | Accident | 36 | Bring up | 30 | Vicinity | 26 |
| Government | 87 | Enforcement | 45 | Damage | 35 | After | 30 | Land | 26 |
| Fine dust | 85 | Announcement | 45 | Continue | 35 | Schedule | 30 | Factory | 26 |
| City | 82 | Situation | 43 | Implementation | 35 | Living | 30 | Detection | 26 |
| Construction | 82 | School | 42 | Standard | 35 | Nakdong River | 30 | Sunlight | 25 |
| Power plant | 79 | Activity | 41 | Possibility | 35 | Shin-Kori nuclear power plant | 30 | Local government | 25 |
| Society | 77 | Ministry of Environment | 41 | Harm | 34 | Verification | 30 | System | 25 |
| Policy | 76 | Expansion | 41 | Evaluation | 34 | Chemistry | 29 | Purification | 25 |
| Safety | 74 | Relation | 41 | Reduction | 34 | Consultation | 29 | Apartment | 25 |
| Matter | 72 | Whole land | 40 | Asbestos | 34 | Site | 29 | Establishment | 25 |
| Committee | 71 | Incheon | 40 | Dam | 34 | Health | 29 | Habitat | 25 |
| Facility | 69 | Approximately | 40 | River | 33 | Designation | 28 | Industry | 25 |
| Occurrence | 68 | Controversy | 40 | Treatment | 33 | Concern | 28 | Extinction | 25 |
| Component | Initial Eigenvalue | Extraction Sums of Squared Load | Rotation Sums of Squared Load | ||||||
|---|---|---|---|---|---|---|---|---|---|
| Total | % of Variance | Cumulant (%) | Total | % of Variance | Cumulant (%) | Total | % of Variance | Cumulant (%) | |
| 1 | 5.863 | 36.643 | 36.643 | 5.863 | 36.643 | 36.643 | 3.445 | 21.533 | 21.533 |
| 2 | 1.417 | 8.856 | 45.500 | 1.417 | 8.856 | 45.500 | 3.007 | 18.796 | 40.328 |
| 3 | 1.285 | 8.032 | 53.532 | 1.285 | 8.032 | 53.532 | 2.113 | 13.204 | 53.532 |
| Factor | Subject Area | Factor Value | Keyword | Load | Major Conflict |
|---|---|---|---|---|---|
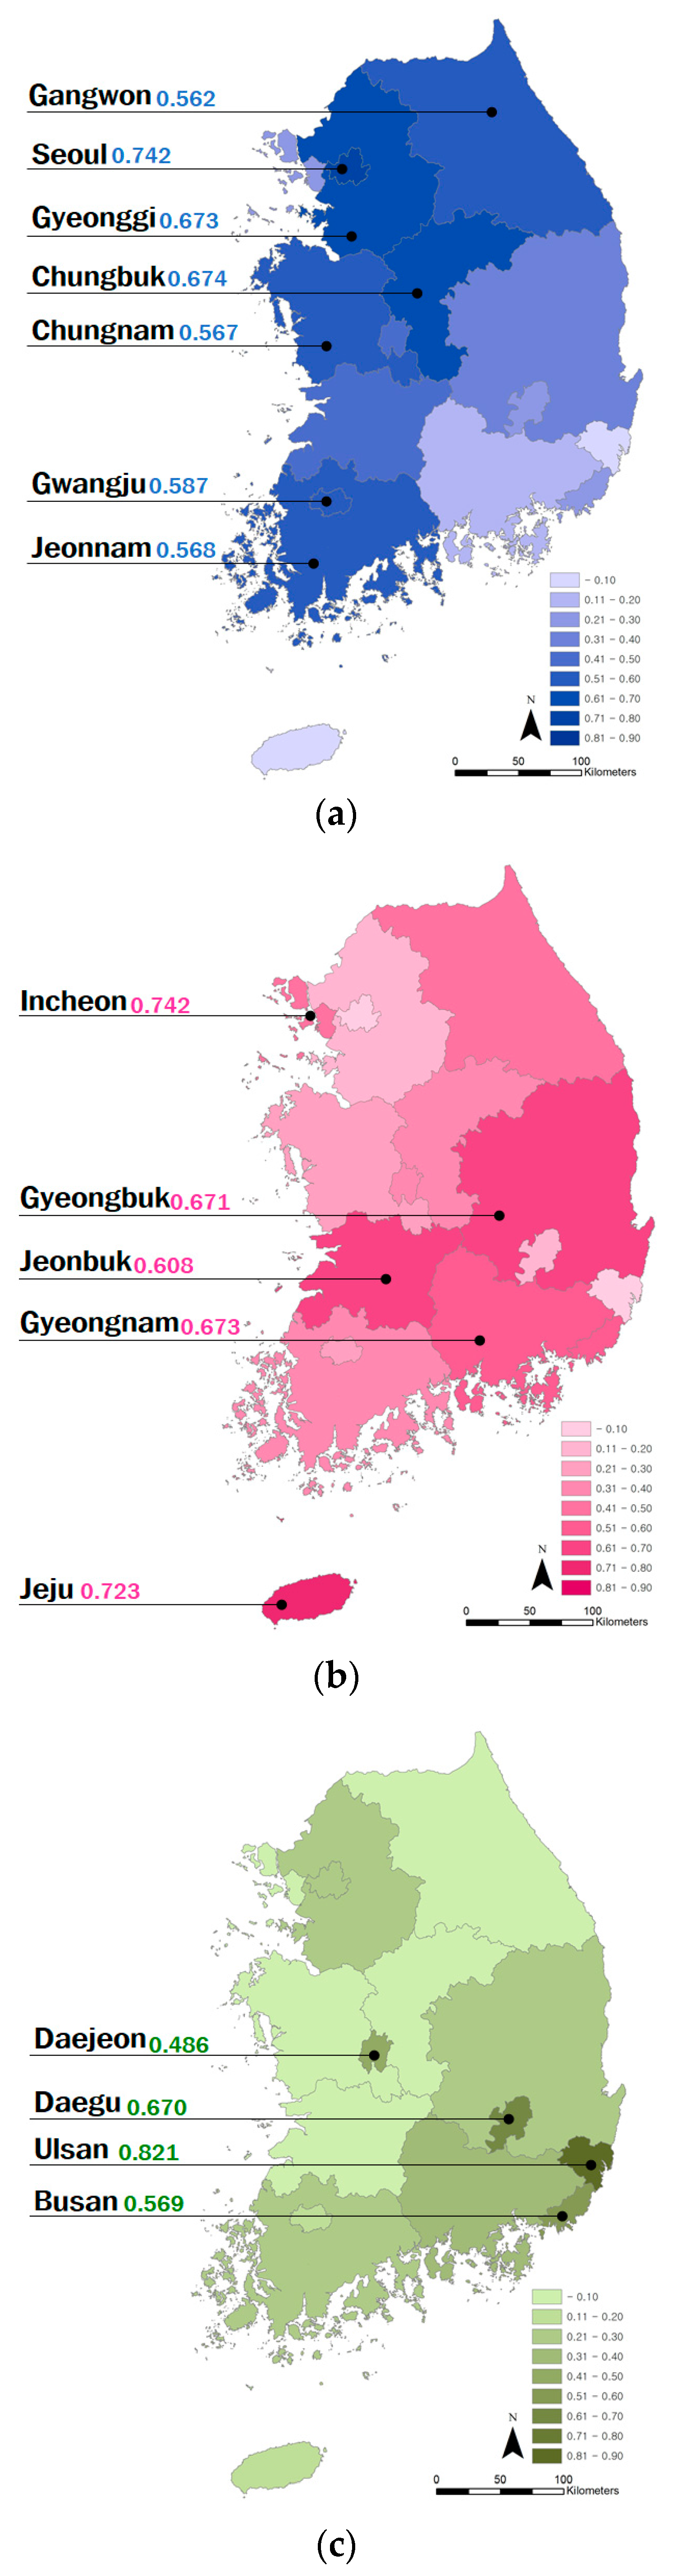
| 1: Sensitivity to “atmosphere” | Seoul | 0.742 | Citizen | 4.194 | The Seoul Federation for Environmental Movement states: “The government’s emergency reduction measures in response to high concentrations of fine dust are not practical in Seoul, where high concentrations of fine dust occur on a daily basis due to high standards for issuance. Vehicle regulation and reduced operation are limited to public administrative agencies, and the application standards and follow-up measures in case of violation are unclear. Fine dust in subways and stations is also very serious. Practical and effective measures are required that place citizens’ health first. Accordingly, Seoul Federation For Environmental Movement is conducting an intensive citizen action campaign urging additional measures against coal-fired electrical power plants and diesel vehicles, which are the main sources of fine dust.” |
| Chungbuk | 0.674 | Region | 3.758 | ||
| Gyeonggi | 0.673 | Fine dust | 3.614 | ||
| Gwangju | 0.587 | Measure | 2.442 | ||
| Jeonnam | 0.568 | Resident | 2.295 | ||
| Chungnam | 0.567 | Power plant | 2.230 | ||
| Gangwon | 0.562 | Park | 1.851 | ||
| Project | 1.760 | ||||
| Occurrence | 1.591 | ||||
| Policy | 1.550 | ||||
| Energy | 1.404 | ||||
| Need | 1.237 | ||||
| Planning | 1.037 | ||||
| 2: Sensitivity to “development” | Jeju | 0.723 | Project | 6.852 | The Jeju Federation for Environmental Movement stated: “Jeju OO recreational housing complex development project, which experienced promotion difficulties due to a Supreme Court decision, continues to be promoted by the greed of Jeju Island and OOO. In particular, despite the fact that various trial results acknowledge the fault of Jeju and OOO, the trial that is distressing local residents and landowners is continuing this year with no projected end. Along with criticism that legal costs are being wasted on the trial, which is certain to lose and which is not related to securing publicity or promoting the welfare of residents, there is growing demand to accept the ruling and return land to landowners. This demonstrates how bad development projects, such as OO recreational housing complex development project, can have a huge negative impact on the environment, society, and local economy.” |
| Gyeongbuk | 0.671 | Development | 2.881 | ||
| Jeonbuk | 0.608 | Law | 2.214 | ||
| Gyeongnam | 0.571 | Facilitation | 2.183 | ||
| Incheon | 0.412 | Region | 2.112 | ||
| Planning | 1.768 | ||||
| Jeju Island | 1.540 | ||||
| Facility | 1.470 | ||||
| Park | 1.438 | ||||
| Investigation | 1.427 | ||||
| Dam | 1.089 | ||||
| City | 1.079 | ||||
| Resident | 1.053 | ||||
| Incheon | 1.027 | ||||
| Pollution | 1.025 | ||||
| Citizen | 4.405 | ||||
| Safety | 3.001 | ||||
| 3: Sensitivity to “safety” | Ulsan | 0.821 | Construction | 2.707 | The Ulsan Federation for Environmental Movement stated: “Regarding the process of public discussion over Shin-Kori unit 5 and 6, in October, the citizen participatory deliberation process was completed, and the public opinion committee’s recommendations and the government’s final decision were made. The public discussion process was necessary, but insufficient. Each of the following problems had a profound effect on public discussion: pre-leakage of information packages and information stealing; participation of representative pro-nuclear personnel in the expert committee for objective verification; and, as a result, monopolization of the objective verification process, open intervention of government-funded research institutes, which are subordinate agencies of the state, inequality of distribution in Ulsan area, which is the affected area, and inequality for future generations. As Ulsan, which is the affected area, had the smallest citizen participation group (seven people), the anxiety within the area, which called for a safe society, was not properly conveyed to the citizen participatory group. Although the results that came out of the public discussion process are respectable, measures against damage to residents in the vicinity of the nuclear power plant should be presented, along with a declaration to reduce the construction of Shin-Kori unit 5 and 6.” |
| Daegu | 0.670 | Unit | 2.415 | ||
| Busan | 0.569 | Kori | 2.394 | ||
| Daejeon | 0.486 | Asbestos | 1.921 | ||
| Problem | 1.840 | ||||
| Damage | 1.685 | ||||
| Nakdong River | 1.555 | ||||
| Government | 1.538 | ||||
| Public opinion | 1.493 | ||||
| Construction | 1.411 | ||||
| Nuclear | 1.365 | ||||
| Law | 1.290 | ||||
| Project | 1.275 | ||||
| Project | 1.250 | ||||
| Demolition | 1.102 | ||||
| Region | 1.065 |
| Keyword | Factor 1 | Factor 2 | Factor 3 | Variance | Mean |
|---|---|---|---|---|---|
| Management | 0.636 | 0.703 | 0.773 | 0.005 | 0.704 |
| Group | 0.075 | 0.068 | −0.11 | 0.011 | 0.011 |
| Progress | 0.784 | 0.389 | 0.648 | 0.04 | 0.607 |
| Ecology | 0.253 | 0.356 | 0.751 | 0.069 | 0.453 |
| Committee | −0.178 | 0.389 | −0.116 | 0.097 | 0.032 |
© 2020 by the authors. Licensee MDPI, Basel, Switzerland. This article is an open access article distributed under the terms and conditions of the Creative Commons Attribution (CC BY) license (http://creativecommons.org/licenses/by/4.0/).
Share and Cite
Lee, J.-h.; Kim, D.-k. Mapping Environmental Conflicts Using Spatial Text Mining. Land 2020, 9, 287. https://doi.org/10.3390/land9090287
Lee J-h, Kim D-k. Mapping Environmental Conflicts Using Spatial Text Mining. Land. 2020; 9(9):287. https://doi.org/10.3390/land9090287
Chicago/Turabian StyleLee, Jae-hyuck, and Do-kyun Kim. 2020. "Mapping Environmental Conflicts Using Spatial Text Mining" Land 9, no. 9: 287. https://doi.org/10.3390/land9090287
APA StyleLee, J.-h., & Kim, D.-k. (2020). Mapping Environmental Conflicts Using Spatial Text Mining. Land, 9(9), 287. https://doi.org/10.3390/land9090287