Article

Land-Use Dynamics in Transport-Impacted Urban Fabric: A Case Study of Martin–Vrútky, Slovakia

1
Department of Ecology & Environmental Science, Faculty of Natural Sciences, Constantine the Philosopher University, Tr. A. Hlinku 1, 94974 Nitra, Slovakia
2
Transport Research Centre (CDV), Líšeňská 33a, 63600 Brno, Czech Republic
3
Silva Tarouca Research Institute for Landscape and Ornamental Gardening, Lidická 25/27, 60200 Brno, Czech Republic
4
Department of Physical Geography and Geoecology, Faculty of Natural Sciences, Comenius University in Bratislava, Mlynská dolina, Ilkovičova 6, 842 15 Bratislava, Slovakia
*
Author to whom correspondence should be addressed.
Land 2020, 9(8), 273; https://doi.org/10.3390/land9080273
Submission received: 17 July 2020 / Revised: 7 August 2020 / Accepted: 13 August 2020 / Published: 15 August 2020
(This article belongs to the Special Issue Cities' Spatial Structure and Drivers of its Transformation)

Abstract

:
The paper evaluates landscape development, land-use changes, and transport infrastructure variations in the city of Martin and the town of Vrútky, Slovakia, over the past 70 years. It focuses on analyses of the landscape structures characterizing the study area in several time periods (1949, 1970, 1993, 2003); the past conditions are then compared with the relevant current structure (2018). Special attention is paid to the evolution of the landscape elements forming the transport infrastructure. The development and progressive changes in traffic intensities are presented in view of the resulting impact on the formation of the landscape structure. The research data confirm the importance of transport as a force determining landscape changes, and they indicate that while railroad accessibility embodied a crucial factor up to the 1970s, the more recent decades were characterized by a gradual shift to road transport.

1. Introduction

The evolution of geoinformation systems and technologies and the gradual digitization of previously non-public or otherwise difficult-to-reach maps [1], together with the overall advancement in cultural landscape research, have yielded valuable information facilitating detailed monitoring and evaluation regarding historical landscape development. The latter two steps are among essential tools that allow us to solve topical problems of landscape ecology, mainly because through their informative value, they open new possibilities for historical ecology as well as the application of multiple current and potentially novel methodical approaches to enable relevant analyses [2]. Historical land cover and land use, for example, are mostly reconstructed by means of historical topographic maps combined with aerial images [3,4,5,6]. Considering a long-term perspective, namely one of about 200 years, a combination of various maps with different legends, scales, and mapping modes facilitates presenting the results of land-use development within several basic categories [7,8]. Maps generated within shorter time horizons allow us to investigate the progress in functional land use by exploiting detailed categorization of individual areas [9,10]. Another approach to the historical development of land-use/land cover (LULC) used in the Central European concept of landscape ecology is based on the summary statistics for administrative units divided into eight basic landscape element categories, with the smallest mapping unit being the cadastral area; this technique, although suitable for the LULC changes and driving forces’ analysis of landscape macrostructures, cannot be used for detailed analysis at the local level [11,12] if appliedwithout relevant aerial images.
Landscape structures are usually mapped together with the advancement of transport networks [8], a major aspect of analyzing long-term land-use changes [13]. This factor is examined in view of its impact on urban sprawl [14,15,16], the distribution of fresh industrial and retail activities [17,18,19], and local leisure and tourism potentials [20,21]. In applicable evaluations, development is classified as a key technological force behind landscape transformations [22,23,24]. More broadly, transportation and land use are part of a retroactive feedback system [25], meaning that the localization of suitable transport infrastructure and good transport accessibility define the potential of localities to sustain regional development on one hand, and the nthropogenic transformation of original landscape components into elements of the corresponding socio-economic structure on the other [26,27,28,29].
Generally, transport corridors and urban sprawl embody the most significant elements that contribute to landscape fragmentation, reducing the relevant qualitative indicator values [30,31]. The expansion and structuring of an urban area interact with other components of the transportation system, including, but not limited to, public transport accessibility [32,33,34] and the behavior of individual transit participants in choosing the means of transport [35,36,37] or negotiating the safety risks [38,39,40]. The health risks and quality of life reductions associated with human exposure to significant adverse transport-generated effects have been broadly discussed in the literature and at policy-oriented forums [41,42,43,44,45,46]. In this context, for instance, noise and air pollution manifest themselves especially in cities, where the population densities and pollution rates are high; paradoxically, such negative environmental conditions may most seriously affect population groups that actively seek and practice sustainable transportation [47,48].
Increasing the modal share between walking, cycling, and public transport services embodies the central objective of modern transport policy, as adopted by many countries and cities, aiming to lessen the volumes of individual road transportation. Encouraging these modes of transfer closely relates to the trend towards concentrating urban areas into structurally compact cities [49,50].
The criteria defining acceptable walking distance by commuters are crucial for accessibility studies. Zielstra and Hochmair [51] assumed the walking distances to urban bus and major rail stations to be 400 and 800 m, respectively, the authors point out that the existence of pedestrian-only segments of a network may increase the service area of the stations. Yang et al. [52] set up the threshold values of access to urban rail stations in Bejing to 472 m as the optimum and 862 m as the maximum acceptable walking distances. The walking acceptability rate will double in pedestrian-friendly, attractive environments [53], including parks, natural leisure sectors, and traffic-calmed residential streets. Geographical information systems (GIS) are widely used by researchers to analyze the accessibility, with the two basic options being linear buffering and network analysis [54,55].
This paper aims to identify the impact of major types of transport infrastructure on the urban structure in the historical context and to prove the connection between changes in the functional use and structure of an urbanized area on the one hand and its transportation development on the other, in the context of post-socialist countries of Central Europe. The basic hypotheses and assumptions include:
  • Constructing and developing transport (road, railroad) infrastructure may emerge as the driving forces behind the expansion of all functional types of built-up areas.
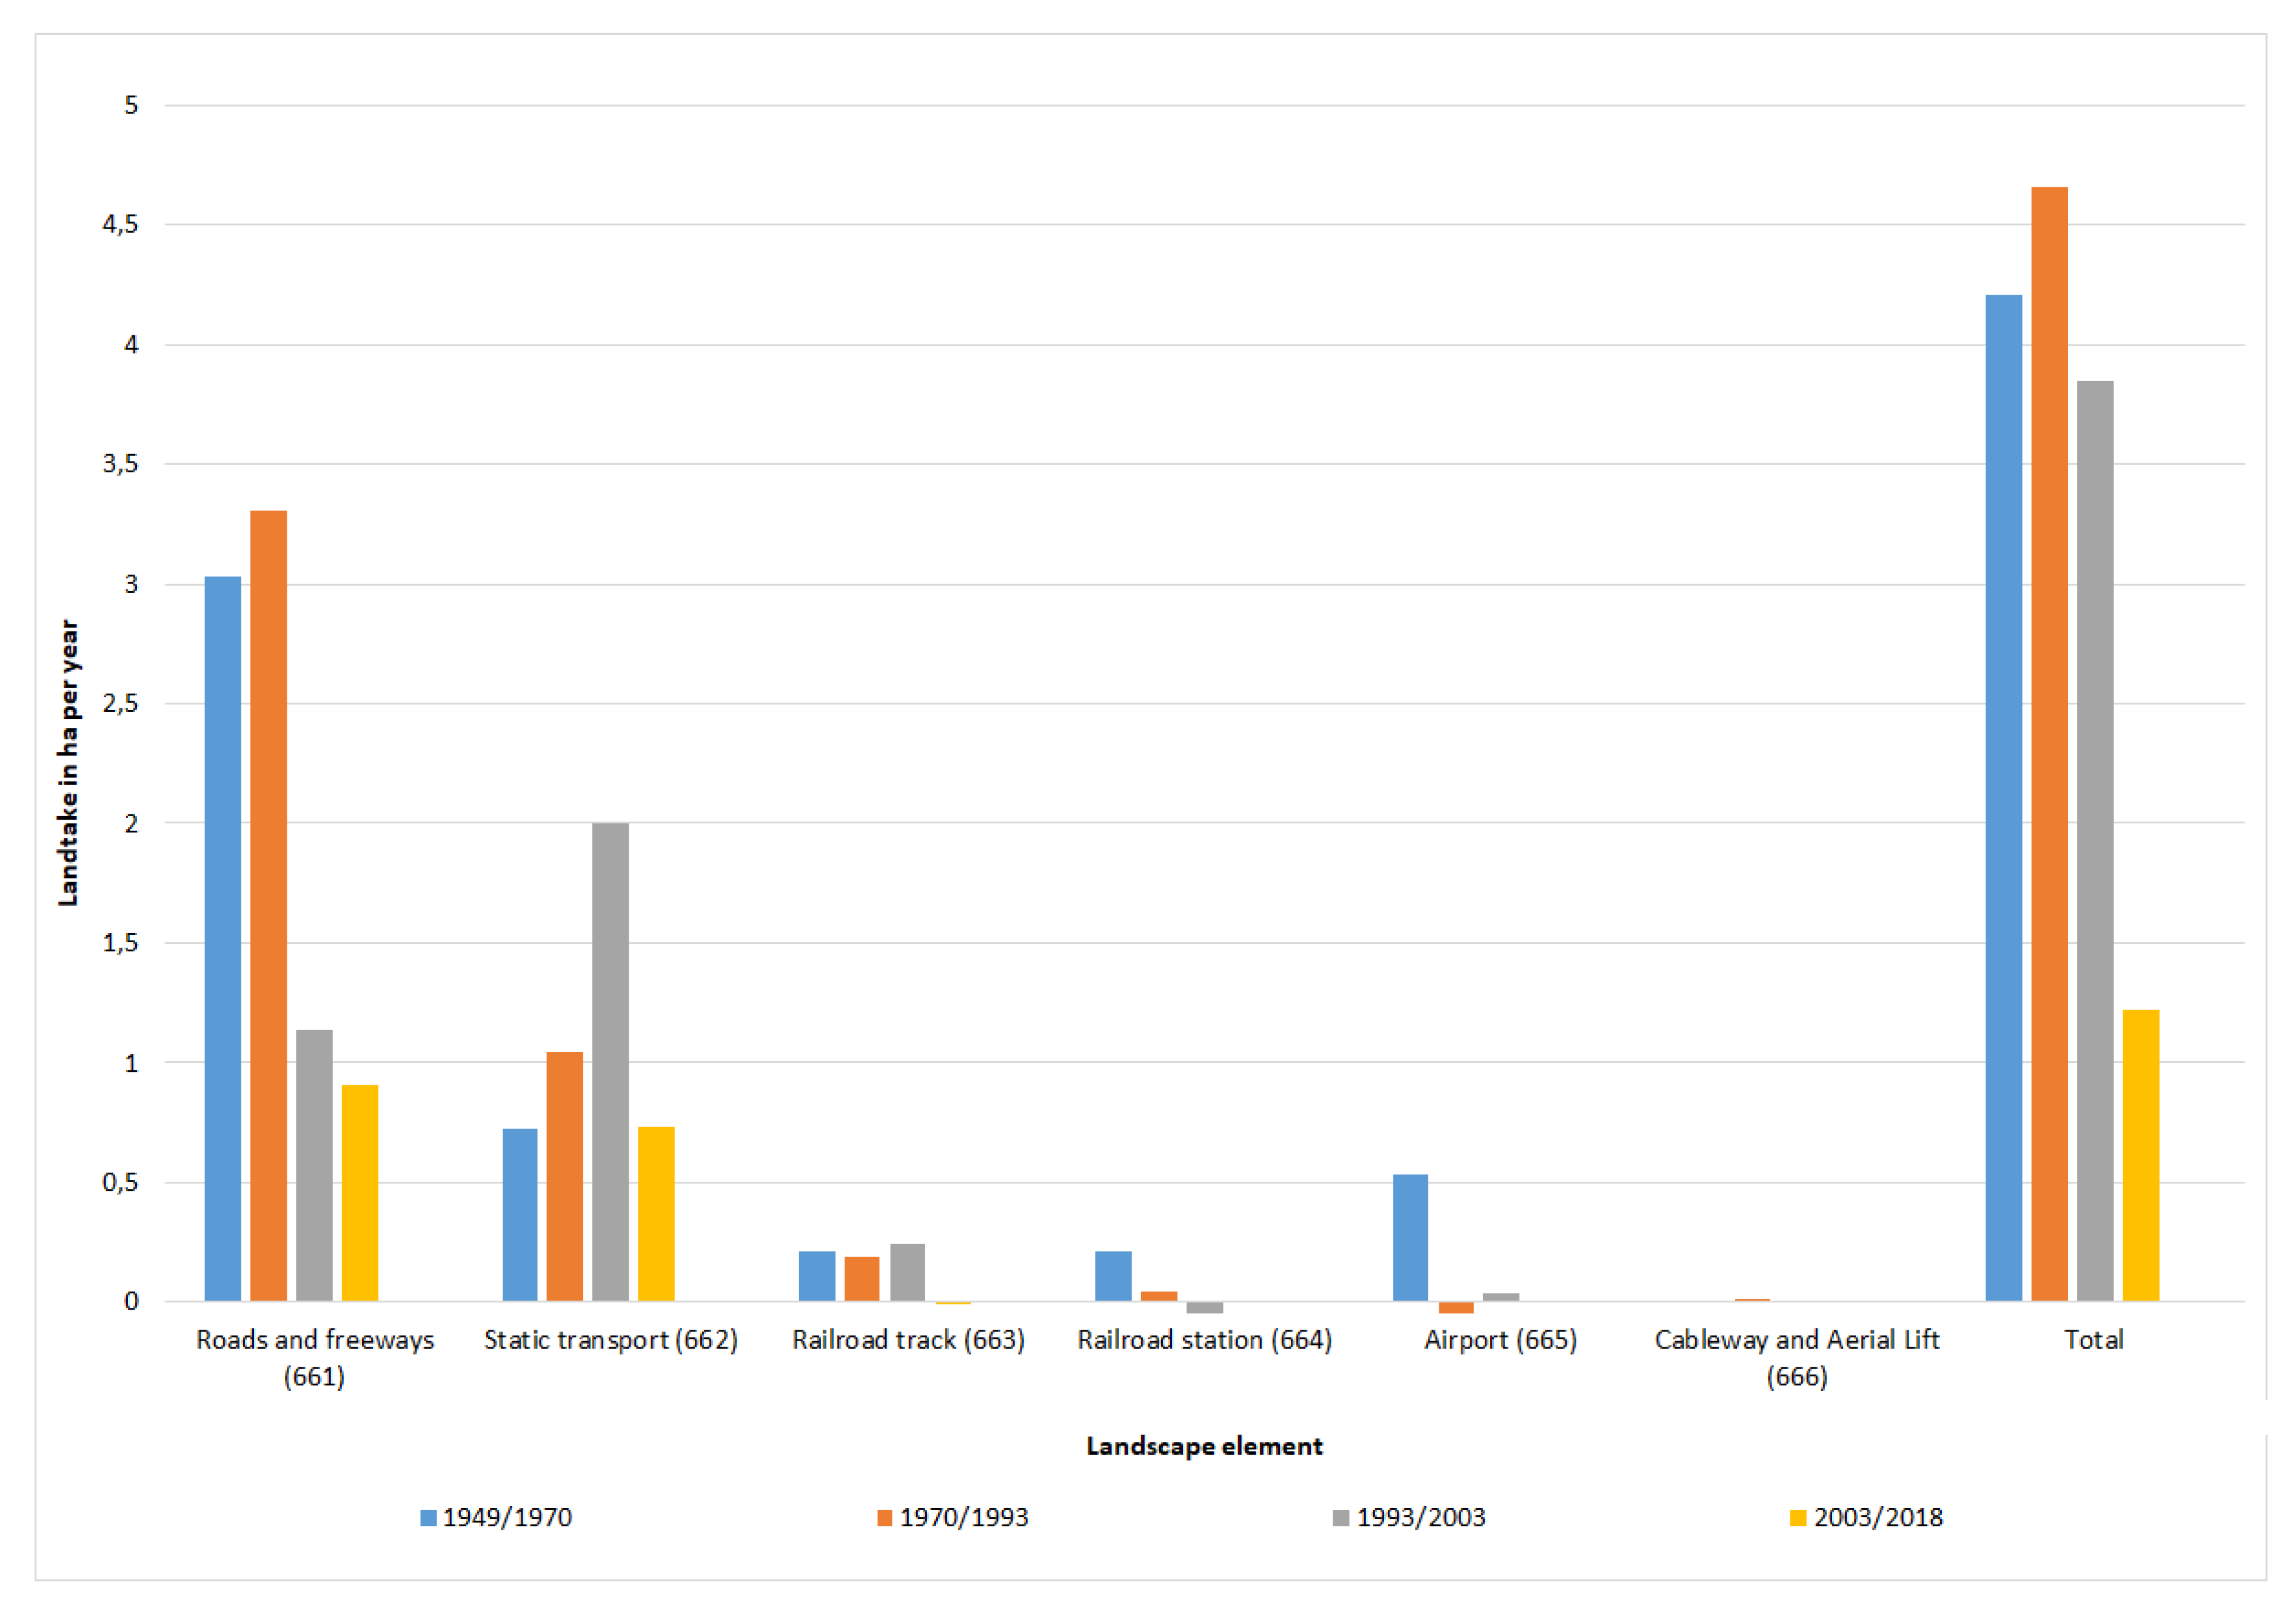
  • The intensity of landtake by transport infrastructure changed significantly in the post-socialist period as a result of general social changes.
  • The growth (or “sprawl”) of built-up areas having a residential or service character intensifies road transport volumes.
  • The accessibility of passenger railroad transport may generate increased demand for housing within a walking distance from railroad stations.

2. Materials and Methods

Landscape is a dynamic system that is constantly changing over time. The present landscape structure, consisting of land use and land cover, is the result of gradual variation in the original natural landscape caused by humans [56]. The landscape structure takes into account biotic and abiotic processes and phenomena in the landscape and expresses the spatial arrangement of landscape properties. The landscape structure elements were classified by utilizing the methodology of landscape elements mappable in Slovakia as proposed by Petrovič, Bugár and Hreško [57], which comprises six basic groups/categories: trees and shrubs; grass and herbaceous vegetation; agricultural crops; exposed bedrock and subsoil; water bodies and wetlands; residential and built-up areas. Our study employs the third hierarchy level, where 64 of the landscape elements specified in Table A1 (the Appendix A) are defined. The categories most important in this respect are:
  • Individual housing (code 611)—permanent residential built-up areas made of individual houses with private gardens or private housing estates
  • Collective housing (code 612)—various types of block of flats and apartment and multi-story housing objects. A detailed description with relevant typology is available from [58].
  • Industrial and technical building (code 651)—areas of industrial activities such as manufacturing, logistics, and public services (e.g., water supply), including associated lands and infrastructures.
  • All transport-related objects and areas—road and freeway (code 661), parking (code 662), railroad track (code 663), railroad station (code 664), and airport (code 665). When generalized into traditional means of transportation, road transport is represented by codes 661 and 662, while the corresponding railroad transport codes are 663 and 664.
The landscape structure in the targeted region was examined and evaluated in five periods, represented by the years 1949, 1970, 1993, 2003, and 2018. Software QGIS 2.16.2 to 3.4 was used for spatial data acquisition, processing, and cartographic interpretation. The manual digitization (vectorization) of the maps was carried out at the scale of 1:2000 where possible, starting from the most recent period and proceeding further into the past. Following sources were used:
  • Black/white aerial images, 1949 (Institute of Military Topography, Banská Bystrica);
  • Black/white aerial images, 1970 (Institute of Military Topography, Banská Bystrica);
  • Basic topographic maps 1:10,000, 1993 (Geodetic and Cartographic Institute Bratislava);
  • Color orthophotomaps from the year 2003 (Eurosense + Geodis Brno);
  • Color orthophotomaps from the year 2016 (website mapy.cz).
The landscape structure elements identified in 2016 were verified via field survey and updated to match the conditions of 2018; simultaneously, we clarified or eliminated the discrepancies that had occurred in the course of the mapping and photographed the region.
Differences between the individual periods were determined in the paired years 1949/1970, 1970/1993, 1993/2003, 2003/2018, and 1949/2018. Using appropriate papers by Feranec et al. [59,60], Kopecká [61], and Cebecauerová [62], 14 types of changes were established, guided by processes that indicate the formation or demise of certain landscape element.
Within Table 1, the types of changes most important for the transportation impact analysis are:
  • Urbanization, showing the expansion of residential areas and their subcomponents, such as housing units or sports and leisure grounds, in the city and the country. The relevant events and procedures take place at the expense of agricultural, forest, and marshlands, and they significantly affect the various natural or artificial water systems;
  • Industrialization and technologization, meaning a growth in the transportation, industrial, and technical or technological infrastructures occurring at the detriment of agricultural, forest, marsh, and water-retaining lands.
One of the partial processes forming industrialization and technologization is the landtake by transport infrastructure. This process represents the change of a landscape element into one from the category of transport-related objects and areas (from 661 to 666) between two mapping years, with the deduction of the original transportation areas that changed into other landscape elements. The derived indicator—the intensity of landtake by transport infrastructure—is defined as the ratio of landtake by transport infrastructure and the number of years in the respective period, so the unevenly long periods between the individual mapping years will be transformed into comparable numbers. Partial processes, such as the landtake by roads and freeways (change to landscape element code 661), can be also identified if necessary.
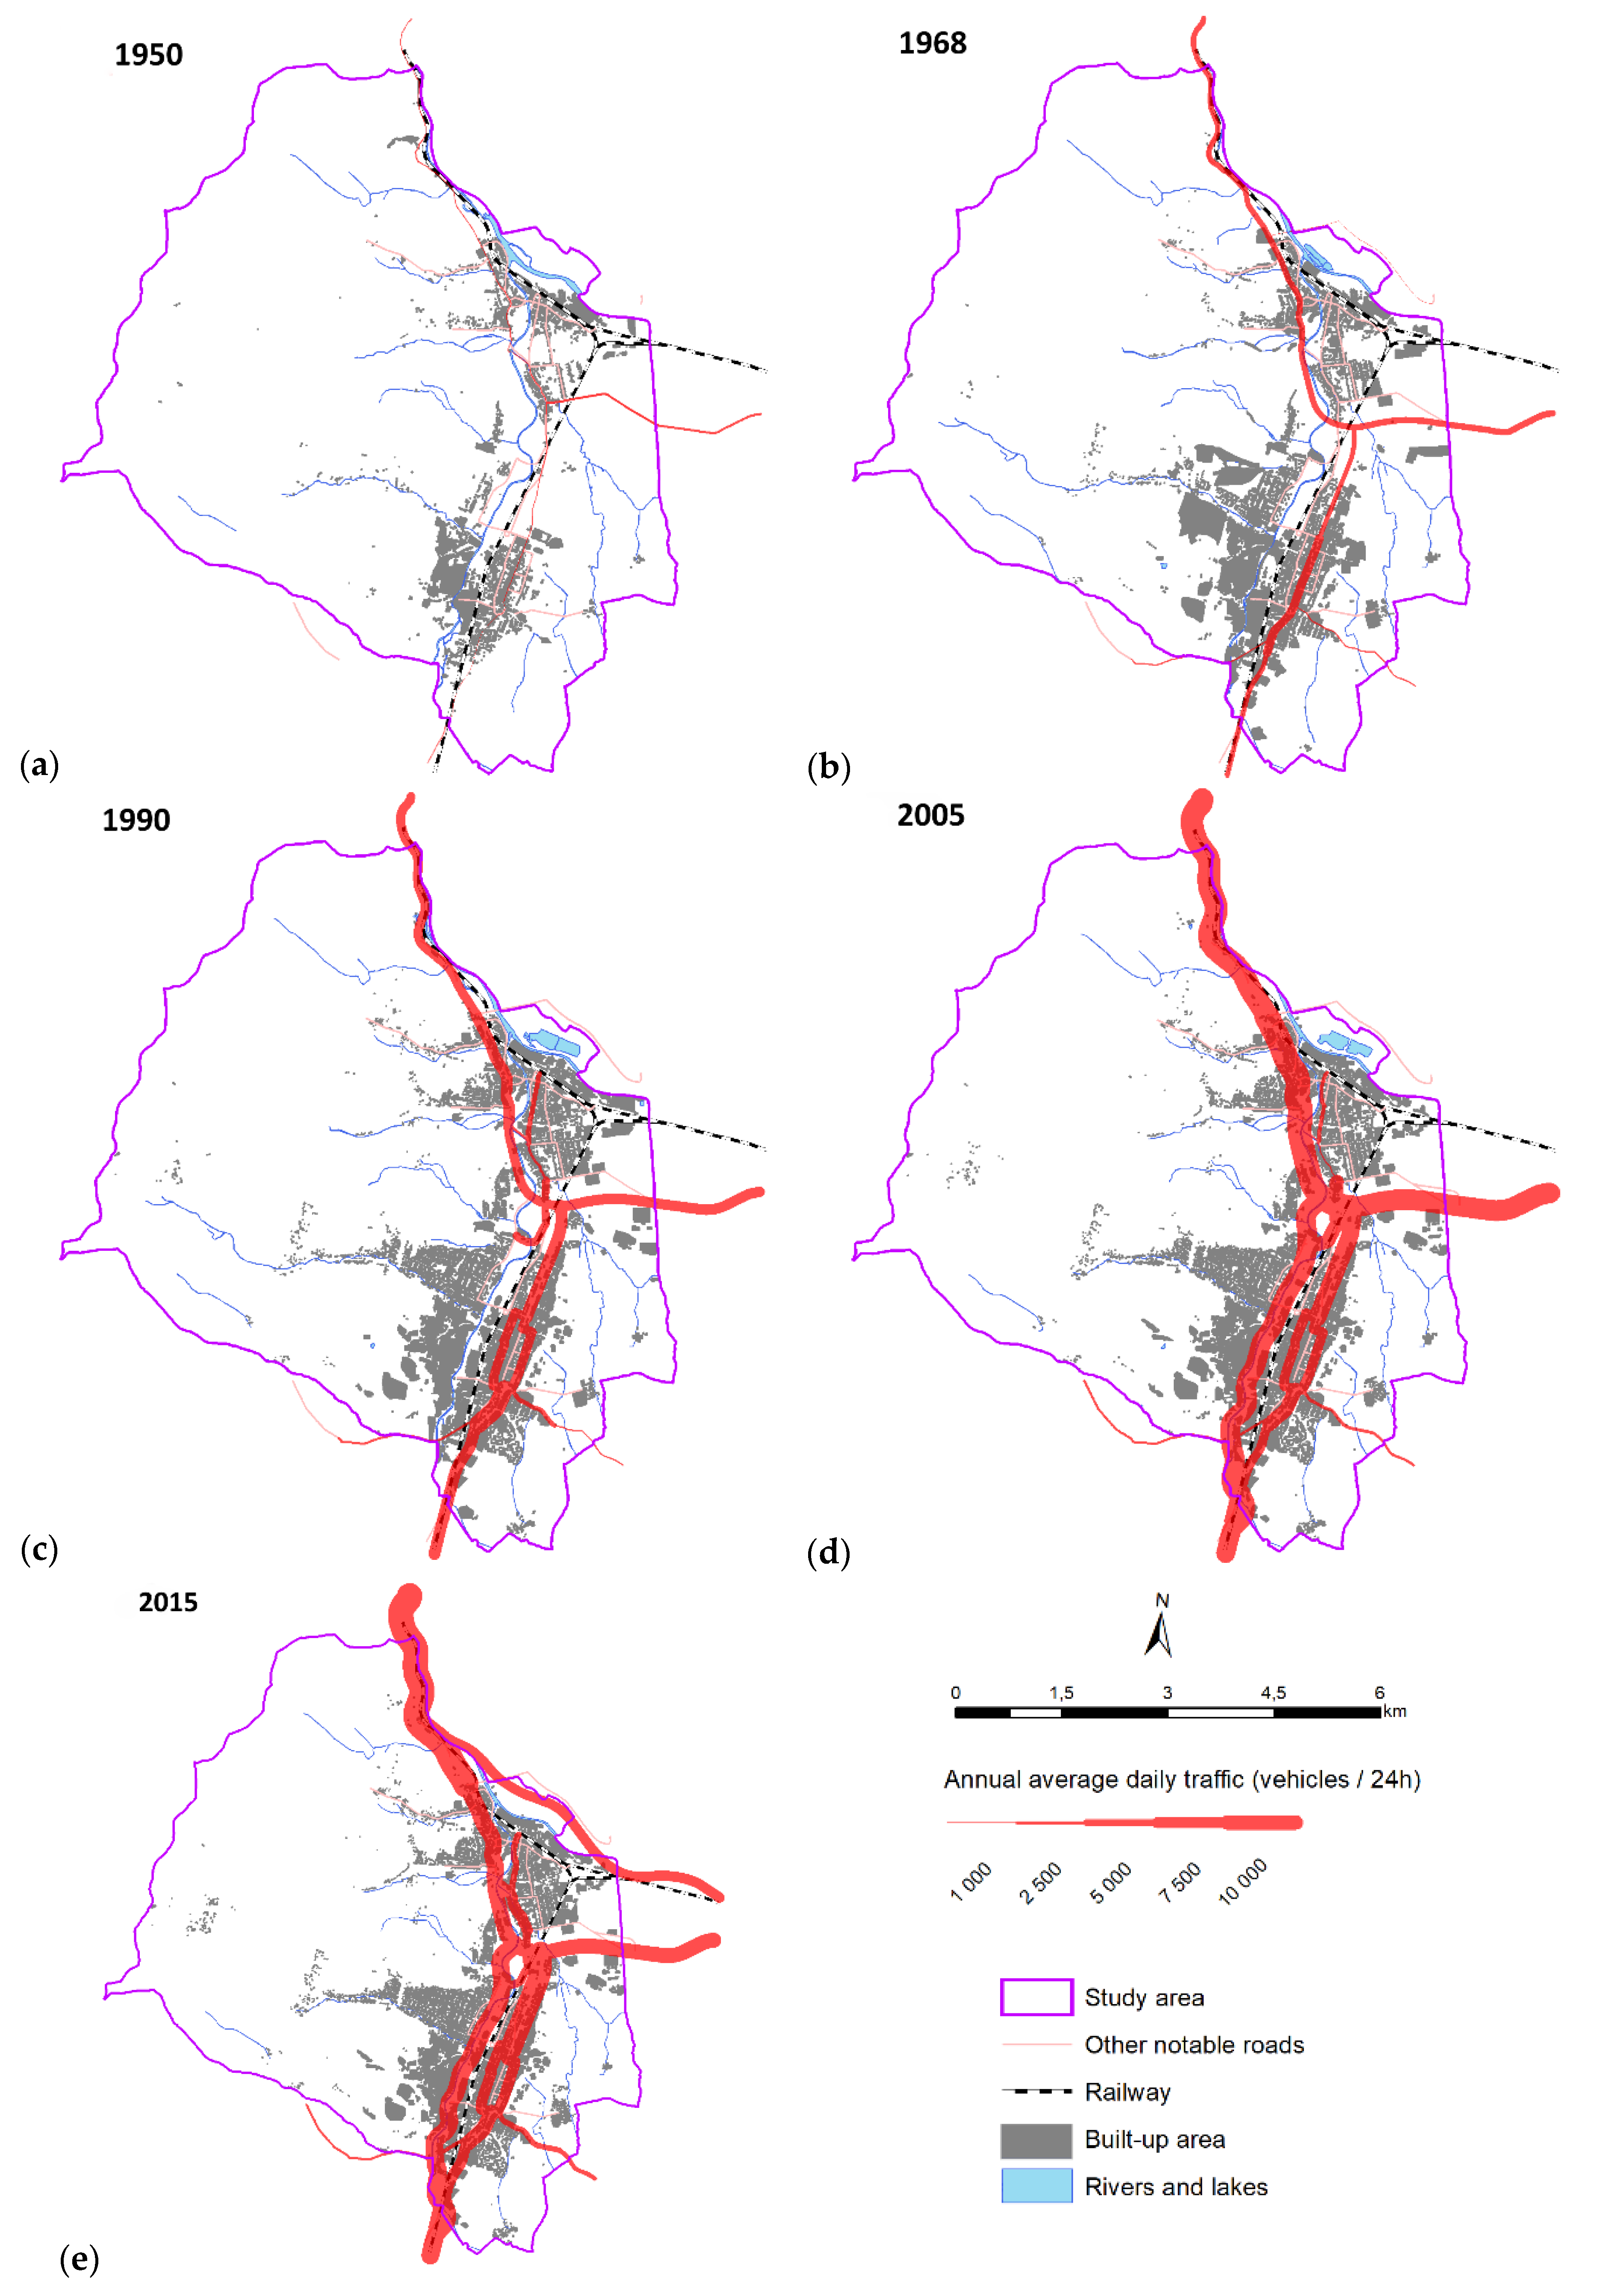
The sources that yielded the details on land use and landscape transformation further allowed us to outline the main transport networks. It was true, especially for the old topographic maps, since the aerial images cannot show the exact categorization of the identified elements to expressways, highways, or first-, second-, and, third-class roads, where first-class roads are intended mainly for long-distance and international transport, second-class road’s major use is for traffic between regions, and third-class roads are used to interconnect municipalities or to connect them to other roads. The basic transport network infrastructure was then completed with the road traffic intensity data collected from the nationwide road traffic census held in the Slovak Republic—formerly a part of Czechoslovakia—from 1949 to 1950, every five years after 1980. The census covered all expressways, highways, first- and second-class roads, and selected portions of third-class roads. Currently, following the census of 2015, a novel methodology has been applied [63], including partial changes of interpretation, by which, for example, a tractor unit towing one or more semitrailers now counts as a single vehicle. The traffic intensity is presented in the form of the traffic-engineering characteristic called Annual Average Daily Traffic (AADT) [64], where the quantity is expressed as the number of vehicles per 24 hours on a given section of the road. The characteristic represents the average value for all days of the year, comprising also weekends or less dense traffic periods (such as wintertime). The individual survey years, as related to those of the landscape structure mapping cycles, are indicated in Table 2 below. If the future traffic intensities are to be estimated, the most common approach is to use growth factors. These factors are officially published by the authorities [65] and regularly updated after each national traffic census.
For the purposes of the research, we cannot assume the total traffic volume within the study area, as the extent/length of surveyed roads differed between the years. Each of the censuses, however, comprised the first- and second-class roads. Their paths inside the study area varied through time due to modernization-induced rerouting and, most recently, the construction of a part of the D1 freeway (completed in 2015). However, the primary traffic flow directions were preserved.
The accessibility rates were computed via least-cost modeling with the use of the r.cost tool [71]. Least-cost modeling is based upon a GIS raster called a cost-surface. The values within a cost-surface are employed to represent the per unit distance cost associated with traversing different parts of a landscape [72]. The cost surface was the whole road network at the spatial resolution of 5 m. Each cell in the input cost-surface map will contain the category value five, which represents the cost of traversing that cell. The output map layer represents the accumulated traversal cost, calculated as the product of the cost and the distance (in our case, Chebyshev distance [
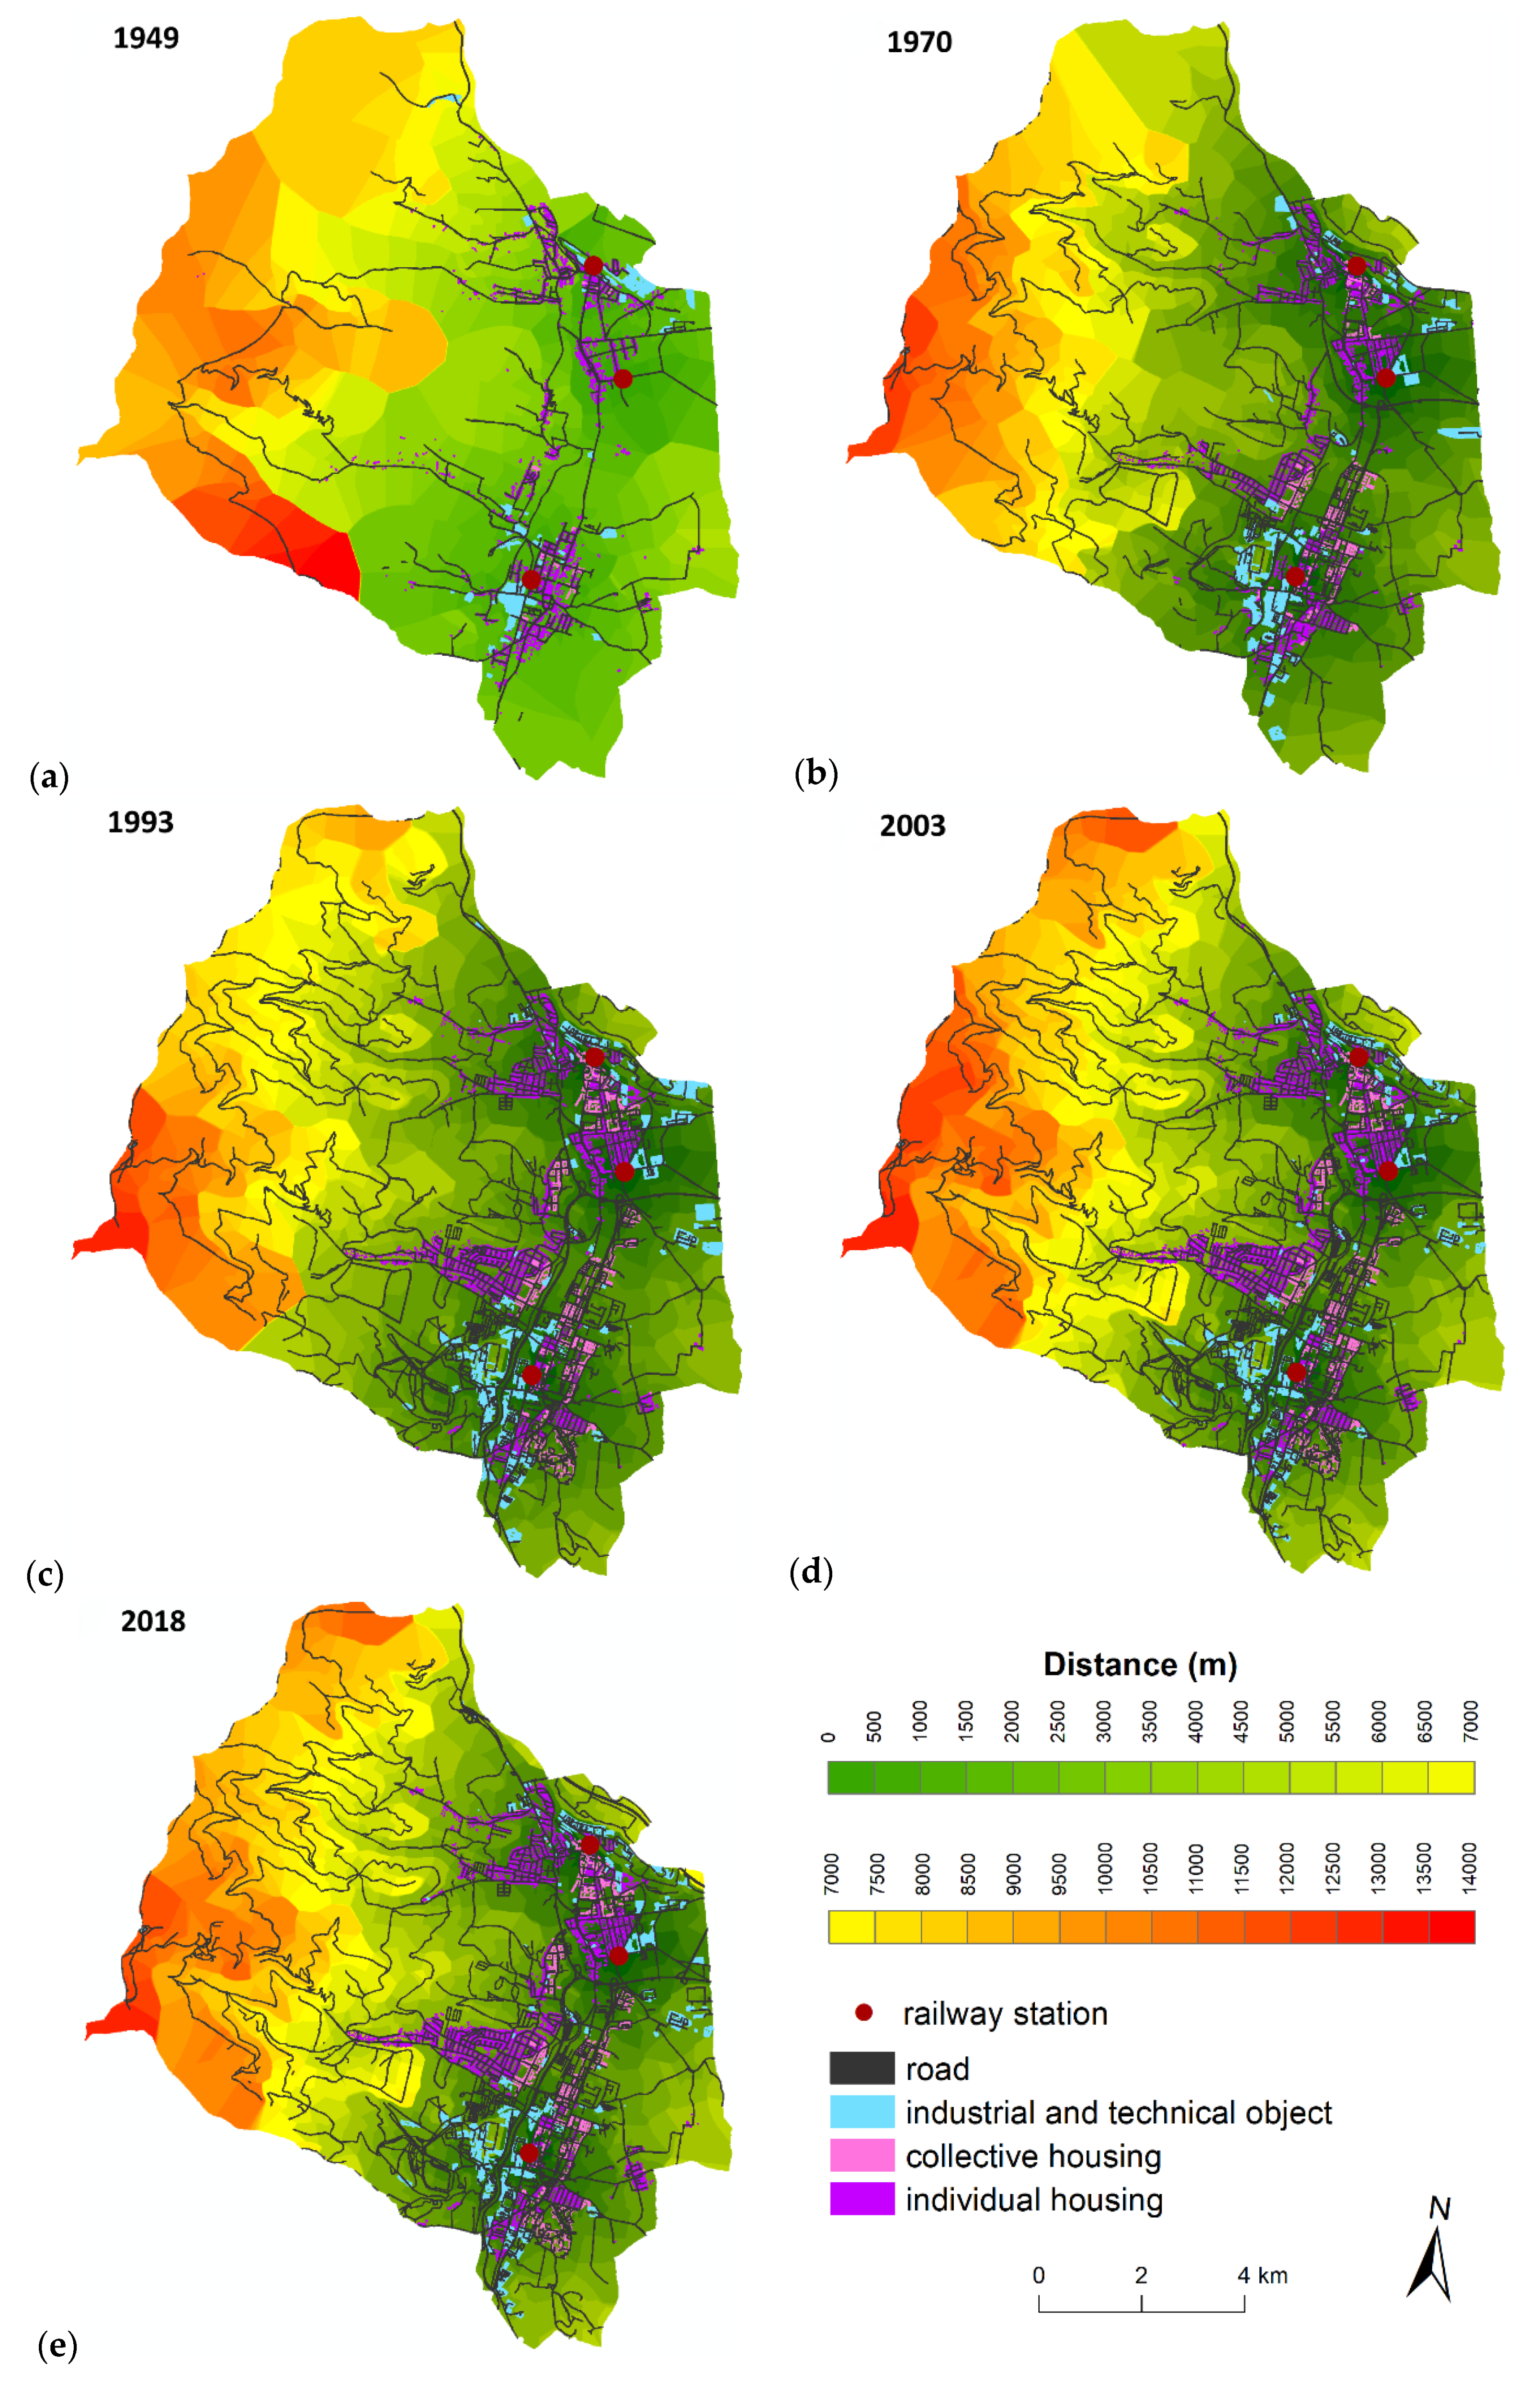
73]) traversed. As a result, an insight into the development of the networks related to the accessibility distances was gained. Subsequently, we compared these distances with the development of three selected landscape elements (individual housing (611), collective housing (612), and industrial and technical buildings (651)), emphasizing changes in distances up to 500 m, the limit widely considered the best, and from 501 to 1000 m, the range assumed to be the acceptable walking distance. Regarding the more remote zones, the effect of the station(s) may rest predominantly in the necessity or possibility of using other means of transport (including, for example, municipal transport or bikes).
For each time period, analyses in ArcGIS 10.6 were performed to investigate the relationship between each polygon’s accessibility to the railroad station. While around six to eight thousand landscape element polygons entered the analyses in the oldest periods, more than 14 thousand did so in the most recent one. Using the Zonal Statistics Tool, the statistical parameters for all types of landscape elements were obtained. Only those landscape elements that have the highest explanatory value for the relationship between the transport accessibility and the development of the urban fabric are presented in the results.

3. Study Area

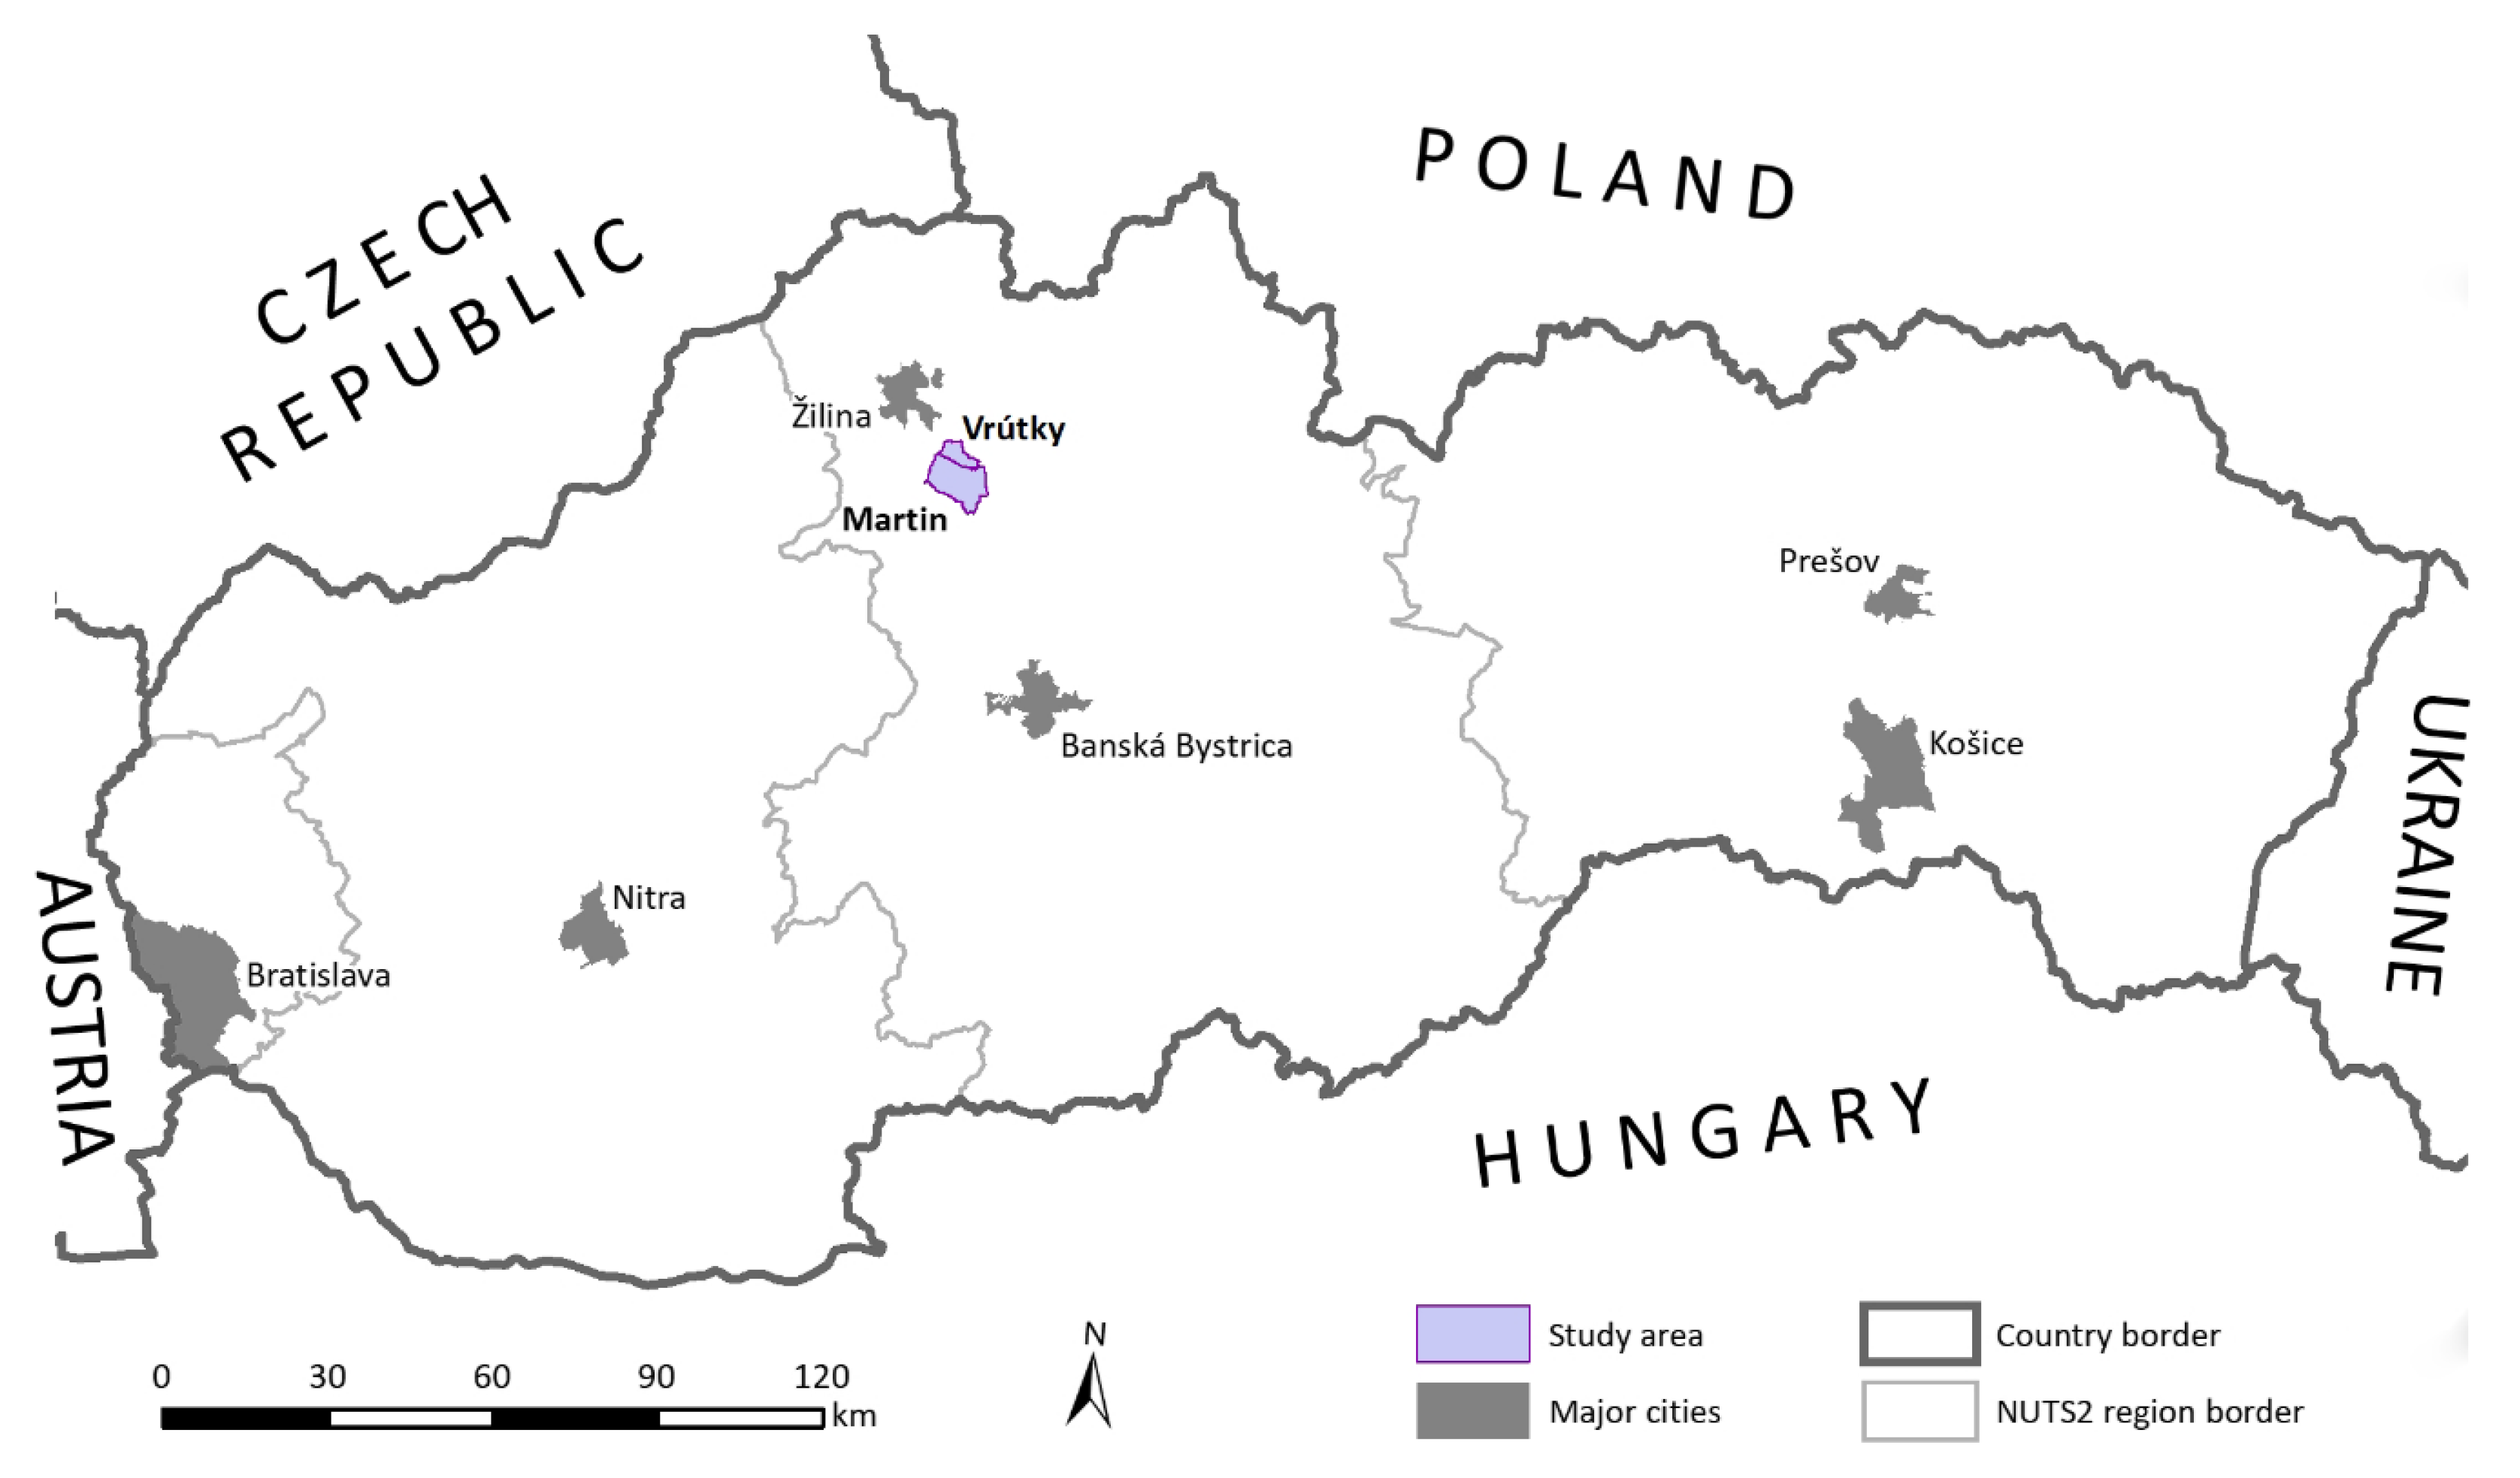
The study area is located in the Martin county, within the Žilina administrative region, which occupies a substantial part of northern Slovakia (Figure 1). The area itself comprises two major self-governing municipal units, namely, the city of Martin and the town of Vrútky. Between 1949 and 1990, the settlements formed a single city together. Currently, despite being independent of each other, Martin and Vrútky maintain close social and economic bonds within an urban agglomeration. Their total area amounts to 8604 ha (Martin: 6770 ha; Vrútky 1834 ha), and the population equaled 61,357 persons as of 31 December 2018 (Martin: 53,768; Vrútky: 7589).
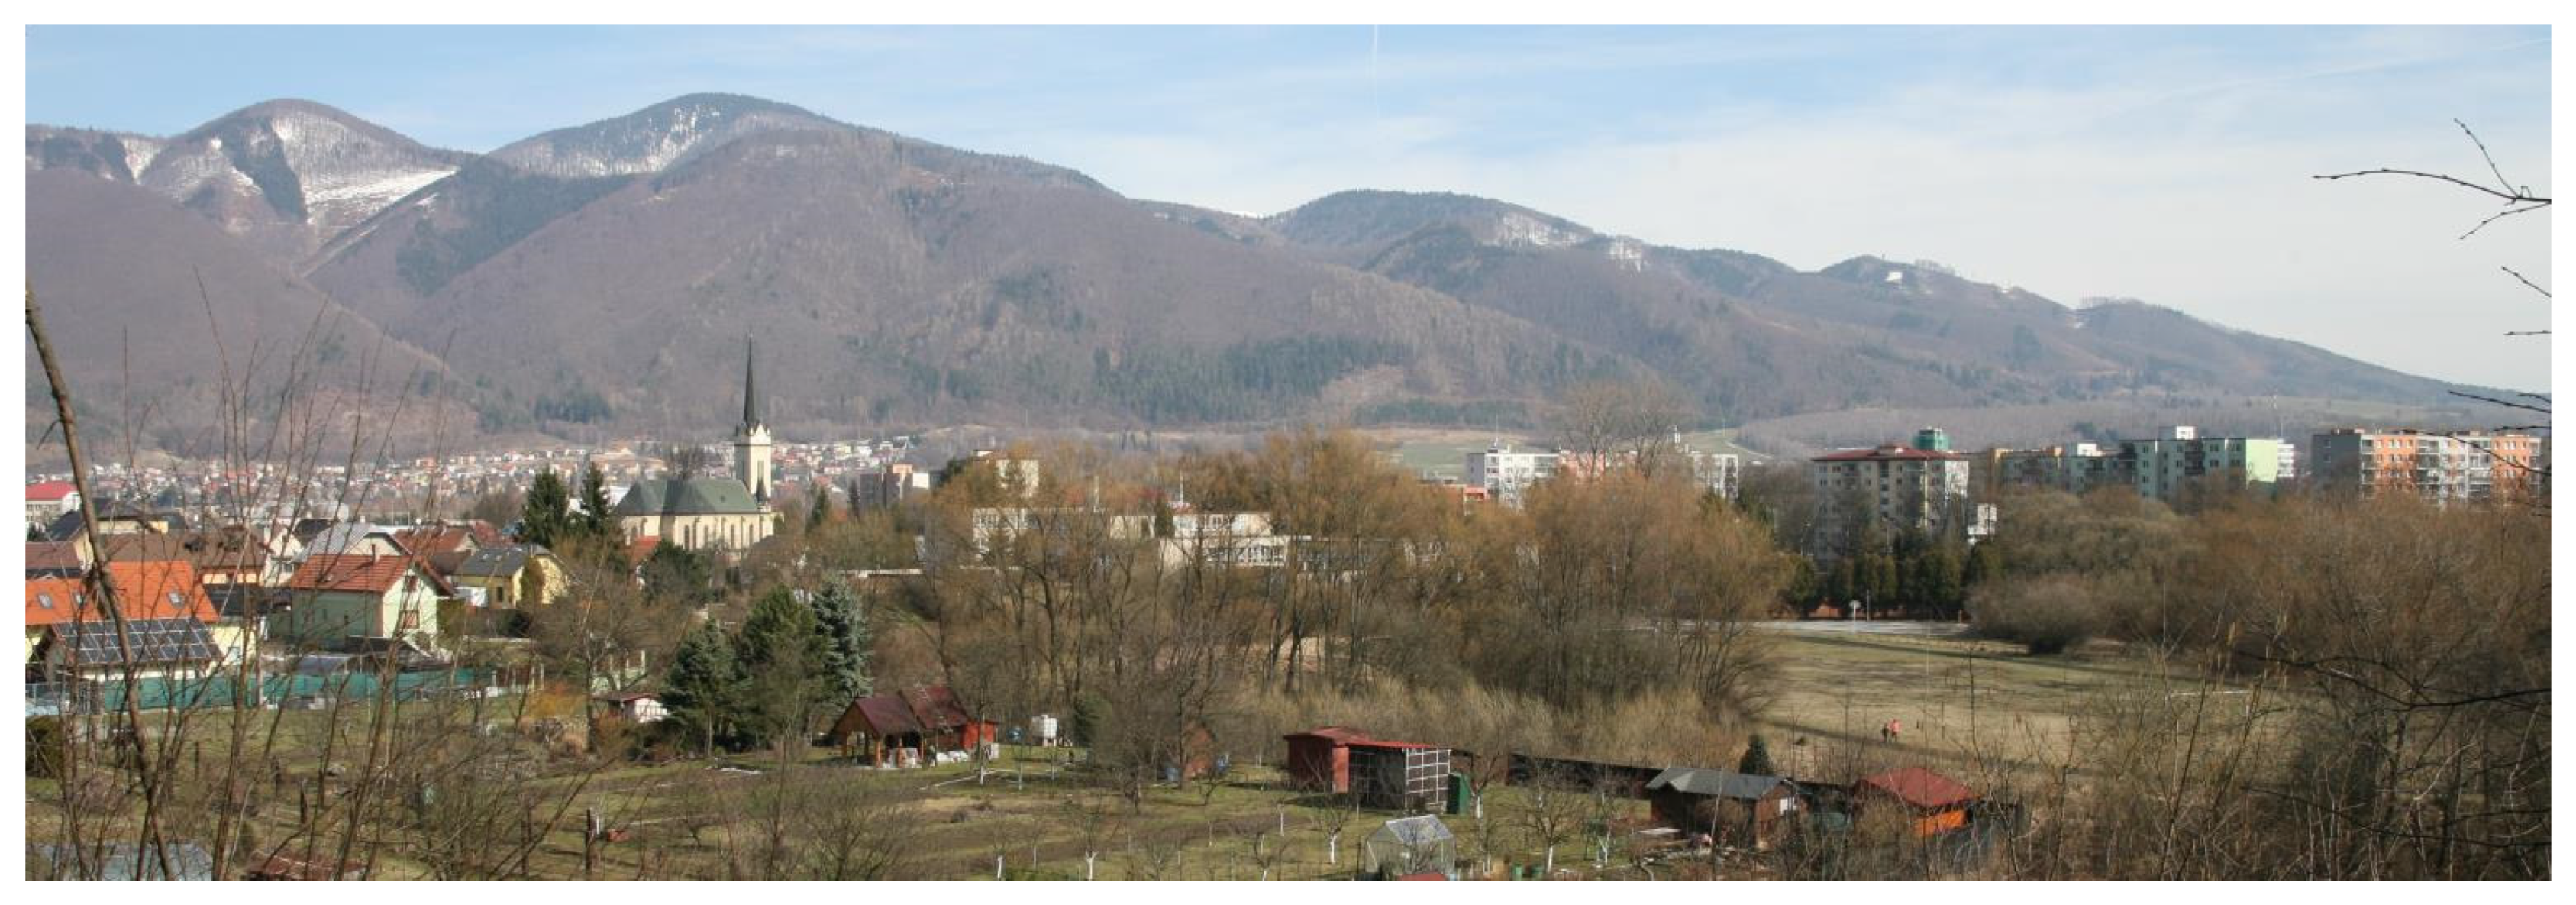
The study area is a part of the Turčianská Kotlina Basin, whose western border is formed by the Malá Fatra mountain range, which constitutes a certain transportation barrier (Figure 2). Two rivers, the Váh and the Turiec flow through the basin and both were previously regulated. The weather is characterized by frequent atmospheric inversions leading to, among other issues, air pollution.
The area was colonized in the Eneolithic period. During the second half of the 19th century, it grew into a hub of Slovak national politics and culture, thanks to the introduction of and connection to a railroad track (see below). Consequently, the population increased, and the two municipalities expanded rapidly. A further period of growth caused by industrial development followed the end of WWII.

3.1. Transportation Networks

The Y-shaped backbone transportation network within the area pursues orographically preconditioned lines that are simultaneously also defined by the Trans-European Transport (TEN-T) core network. The Váh valley conducts, in the west-to-east direction, the northern branch of the multimodal Rhine–Danube Corridor (the road and railroad components being the D1 freeway and the track Žilina–Košice–EU to Ukraine border, respectively). Concerning D1, construction work has been completed only on an isolated section between Dubná Skala and Turany (commissioned in 2015), including the access route forming the initial sector of the R3 expressway.
While the importance of the first-class road I/18, or more concretely, the portion that passes through Vrútky, decreased after the opening of the D1 section routed in parallel, the road transportation in Martin still relies on the individual branches of I/65. As the backbone network remains incomplete, most first-class roads in the Martin subregion are in an unsatisfactory condition due to being heavily overladen, carrying the burden of not only local but also transit traffic. Moreover, there are locations where the entire load has been routed via third-class or urban roads.
The planning and construction of railroads too were adjusted to respect the landscape patterns. In this context, 1871 and 1872 embodied the threshold years, marking the commissioning of the Žilina–Poprad line, a major subsection of the Košice–Bohumín railroad [74]. The track ran along the Váh valley to be joined—from the south, through the Turčianská Kotlina Basin—by the Hungarian northern railroad proceeding from Zvolen [75]. The lines met at the Vrútky station; and the route originating in Žilina to pass Vrútky and run towards Košice and Ukraine is significant even presently, having considerable importance for passenger transport and potential for long-distance freight hauling. The area comprises several sidings that interconnect the railroad network and various industrial plants or facilities, and it is served by the Priekopa stop situated between the Vrútky and Martin stations.
The air transport relies on the domestic, leisure aviation-oriented civil airport at Martin–Tomčany.

3.2. Landscape Structure

Although the entire study area of 8604 ha has experienced major landscape structure changes (see Table 3) since approximately 1950, the seven decades have been characterized by a predominance of landscape elements classified as trees and shrubs. Over time, the category has come to dominate, albeit by a relatively narrow margin, and it currently occupies more than half of the area. The second-largest share has been assigned to agricultural crops whose areal extent gradually shrank. The area of grass and herbaceous vegetation exceeded residential and built-up land; however, after 1993, the share has dropped markedly down to one-third of its original extent. Residential and built-up land, expectably, has expanded progressively to more than three times above the former proportion values. The two remaining classes have been represented only marginally, with none of them taking over 1% of the area.
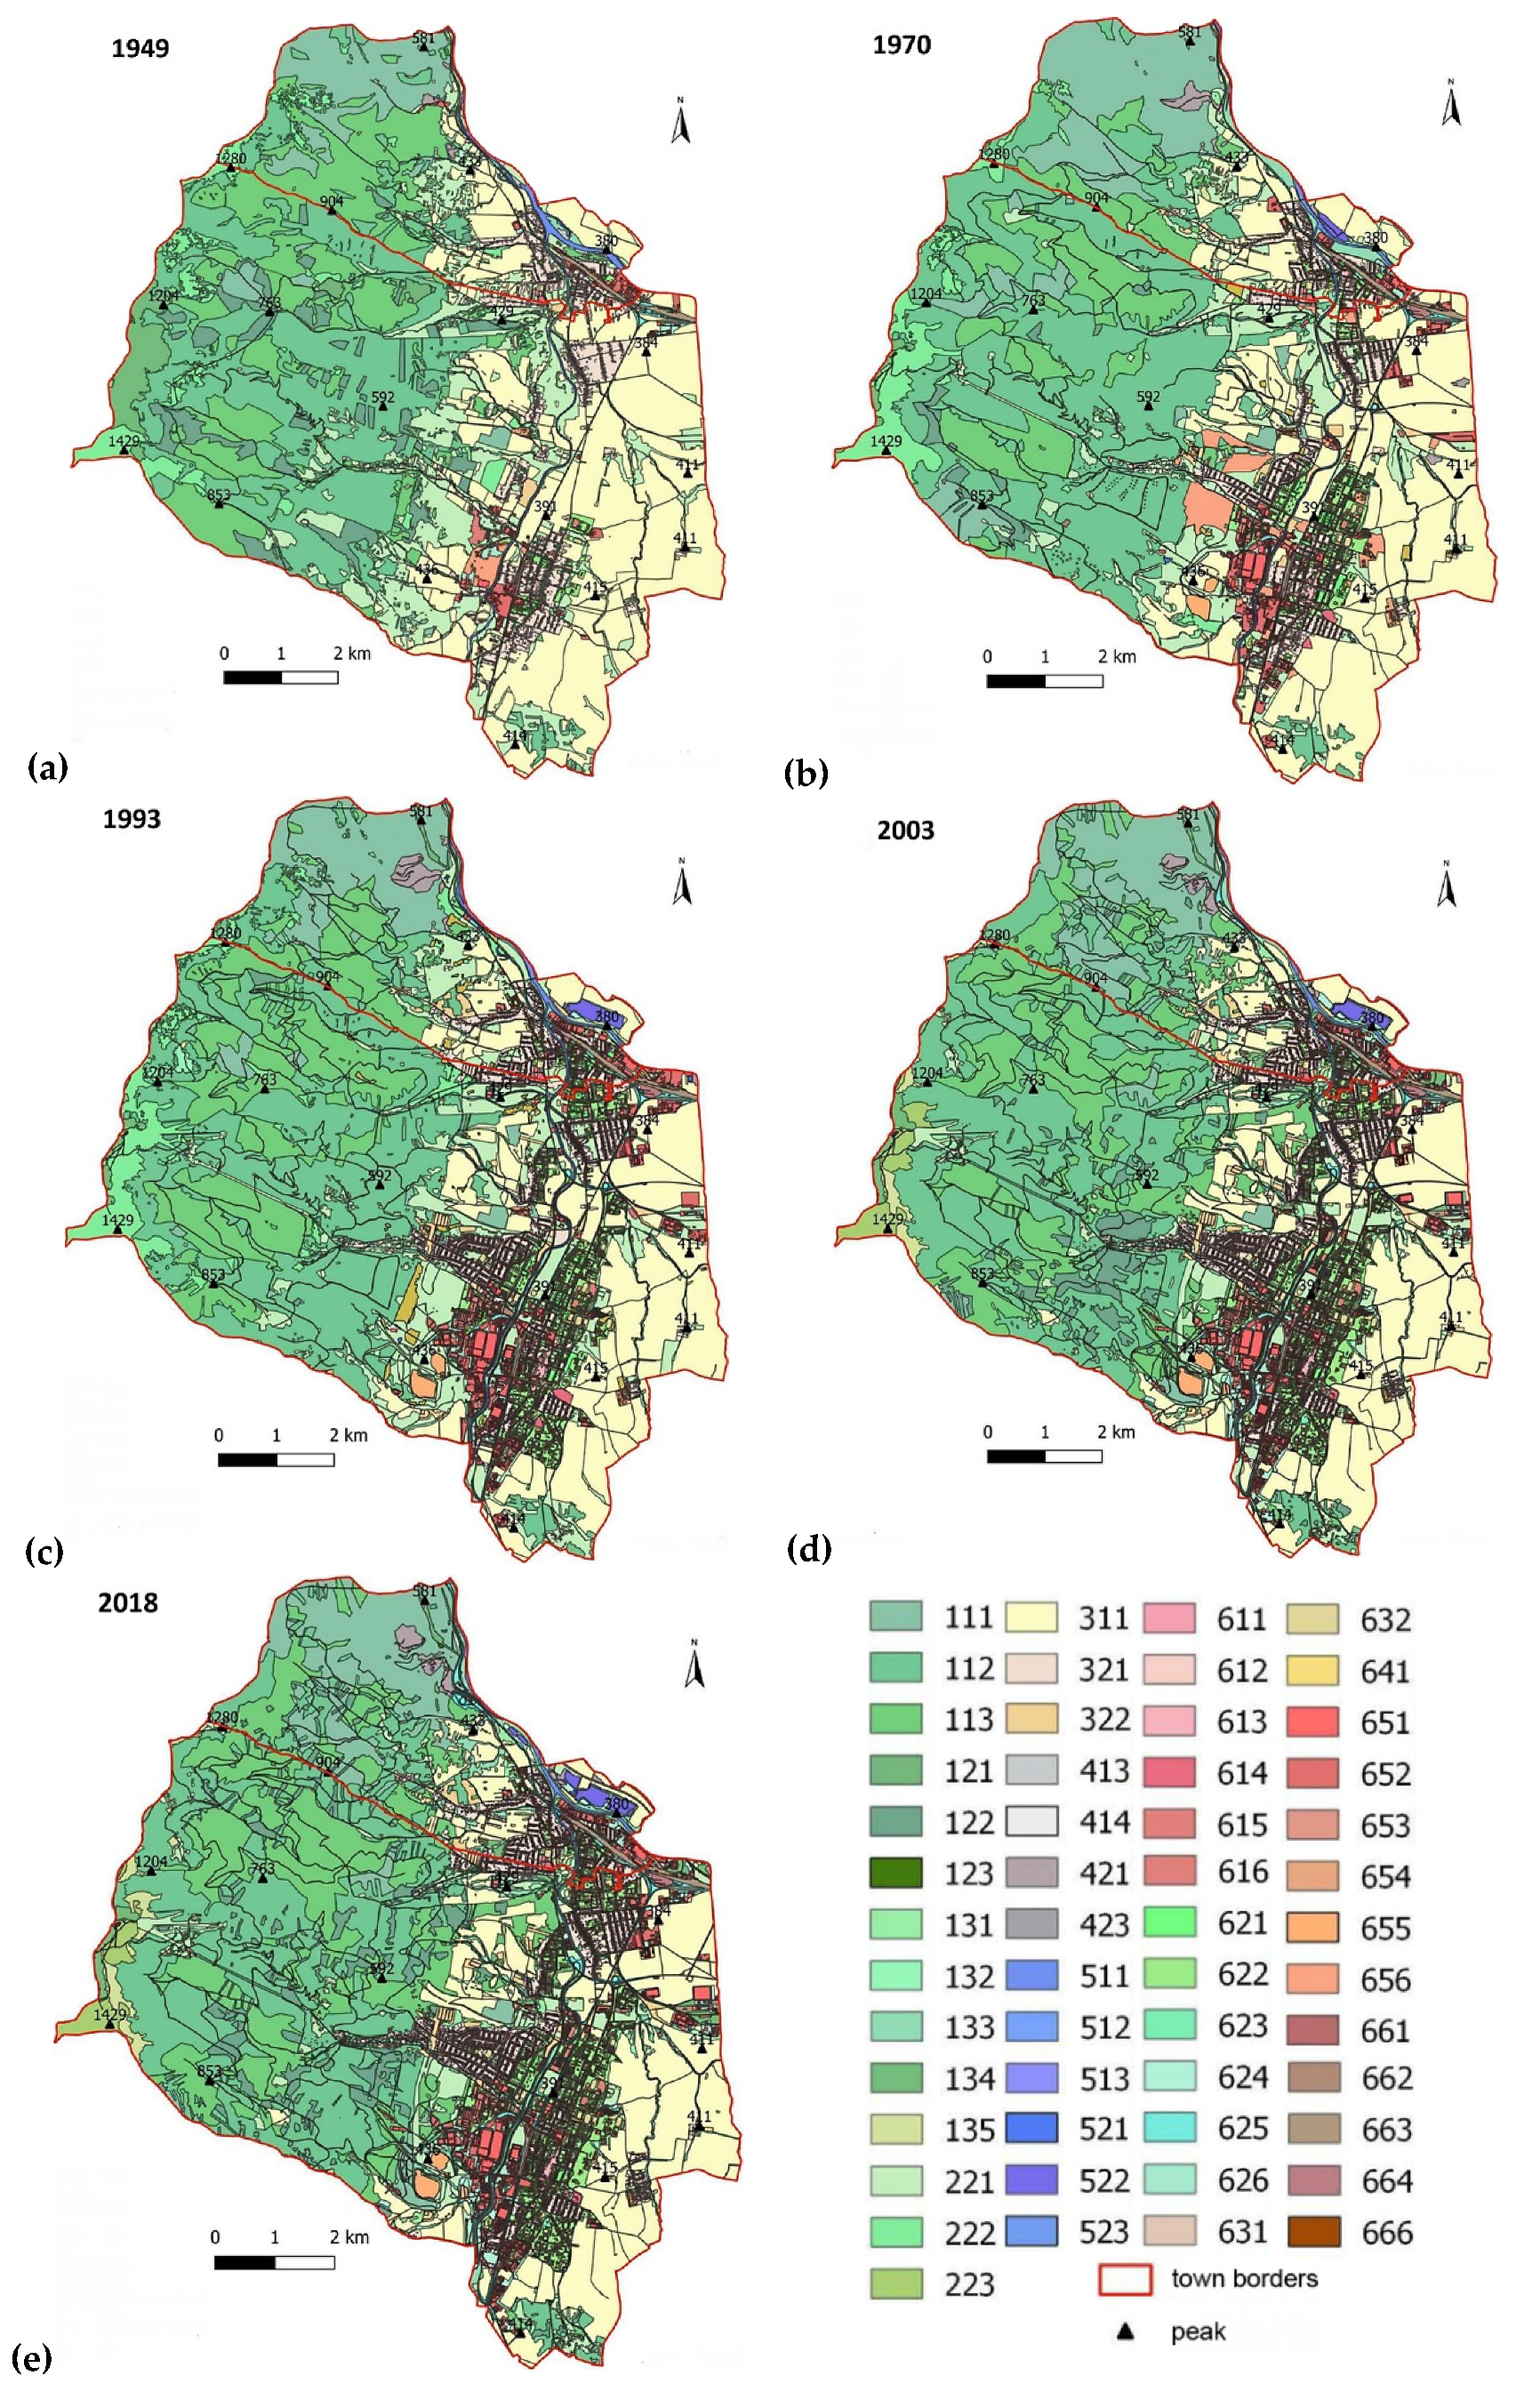
The landscape structure maps for the individual periods are presented in Appendix B, Figure A1. More details about the landscape structure development within the study area during the post-socialist decades can be found in research by Nozdrovická et al. [76].

4. Results and Discussion

4.1. Processes of Landscape Changes

Between 1949 and 2018, in the course of the evaluated period (69 years), a mere 59% of the examined area remained unchanged. A significant portion of the landscape (41%) was altered through human activity, with urbanization and industrialization-related processes affecting approximately 8% of the area (662 ha).
Urbanization proceeded at a constant intensity throughout the evaluated period, except from 2003 to 2018, when the process virtually came to a standstill (Table 4). In Central Europe, the post-2000 trends markedly favored suburbanization not only in large cities, which had experienced the process already in the mid-1990s [77,78,79] but also mid-sized settlements [80,81] such as the Martin–Vrútky conurbation. The discussed tendencies found almost no response within the study area as this encompasses only the source city and town, and settlements where built-up land could be expected to expand, by virtue of suburban processes, are located outside the area’s limits. The opposite trend, deurbanization, remained comparatively steady except for the last of the monitored periods and was induced especially by urban sanitation.
Industrialization and technologization manifested themselves in full, even dominantly, during the oldest stages of the examined time interval; in the more recent decades, the process gradually lost its initial strength. The marked expansion of industrial estates and transport infrastructure is associated with the 1950s and 1960s, correspondingly to the state-orchestrated industrialization of Slovakia, which yielded major heavy industry enterprises.

4.2. Transportation-Related Landscape Elements

Details on the evolution of the areal extent of landscape elements associated with transportation, including roads, buildings, and facilities during the individual periods of interest are summarized in Table 5. Already in 1949, the largest part of the land dedicated to transportation in Martin and Vrútky was occupied by roads (661) while railroad tracks (663) covered approximately half of the area taken by roads. Within the following decades, the areal extent of road transportation expanded rapidly, subsuming roads as well as static transport facilities (such as parking lots or multi-story car parks). The growth of railroad-occupied areas was significantly less steep, and after 1993 we can clearly recognize the onset of stagnation. The rising importance of road transportation was confirmed by its increasing share in the overall landtake of transport infrastructure: the appropriate indicator grew from 68.5% in 1949 to 84.3% in 2018. However, Figure 3 clearly shows visible deceleration after 1990.
When comparing the landtake intensity indicator (Figure 4) in each monitored interval, the total areal expansion in transport-related buildings and facilities progressed at approximately 4 ha a year, except for the last span, when the pace increased by only about one quarter. In terms of the landscape elements, the most dynamic landtaking category was that of roads (outside 1993/2003), where rapid growth in the static transportation areas can be observed.

4.3. Road Network Evolution and Traffic Intensity

Figure 5a–e display a gradual growth in traffic intensities on the major road network during the examined time periods. The highest intensity rates are invariably reached in first-class roads, or more concretely, their transit segments passing through both settlements. Such a scenario is due to the roads functioning dually as local and transit paths. Typical of the post-1990 situation, the intensities increased rapidly, especially on I/18, which substitutes for the incomplete segment of the trans-European multimodal corridor. The lack of a state-of-the-art backbone network in the study area thus requires the existing urban roads to accommodate and manage the most substantial portion of traffic, exacerbating the risk of serious population exposure.
Moreover, relevant road transport growth predictions propose a further rise in the intensities; I/65 and I/18 can then be theoretically expected to carry, before the year 2040, up to 33.2 and 39.4 thousand vehicles a day, respectively. Such an increase is far beyond the technical and structural capabilities of the regional road network, meaning that this traffic could not be effectively managed.
These adverse prospects appear to be eliminable through two steps, these being the construction of appropriate segments of the R3 expressway, conceived to form the north-to-south transportation backbone passing through the Turčianská Kotlina Basin on to the town of Zvolen and the Hungarian capital of Budapest, and the completion of further sections of the D1 freeway. At present, construction work has begun on the D1 segment between Lietavská Lúčka and Dubná Skala. For technical reasons, this portion of the freeway will nevertheless not be put in service before 2023.

4.4. Railroad Transport as a Localizing Factor in Selected Landscape Elements

The last of the analyses was designed to verify whether good accessibility of a railroad station or stop embodies a significant localizing factor in the distribution and eventual placement of individual or collective housing and industrial facilities.
At the respective stages of the research, we revealed a significant concentration of individual housing within 1500 m during the first monitored period (see Table 6). In close vicinity of the stations (up to 500 m), the areas occupied by individual housing were progressively modified to suit other forms of use, including, but not limited to, community services. Currently, individual housing has mostly shifted to the range of 1501–2000 m (Figure 6a–e). This type of area expanded significantly between 2003 and 2018, in the ranges of 2001–2500 m and 2501–3000 m. In the Martin–Vrútky conurbation, the walking distance to the closest station was the decisive developmental localizing measure only from 1949 to 1970; in the more recent decades, this factor began to be substituted by the increasingly more favored private vehicles or municipal transport.
In terms of collective housing, the study area exhibits noticeable construction rates mainly between 1970 and 1993 (Table 7), with the largest areas concentrated at 1001–1500 m and 2001–2500 m from the railroad stations; such distances are already very near the limits of effective walkability and may necessitate the use of public transport (Figure 6a–e). Through the years, apartment blocks were built also in the immediate surroundings of the stations, but the intensity of the process never matched the pace characterizing the construction activities within the farther ranges. Compared to the areas in individual housing and community services, the indicators in collective housing adjacent to the stations thus, cannot be interpreted as showing high advancement potential in the given category.
The study area’s industrial and technical facilities were originally centralized in close proximity to the railroad stations (Table 8); later, intermediate distances gained preference, and presently most of the buildings fall within the ranges 1001–1500 m, 1501–2000 m, and 2001–2500 m (Figure 6a–e). Viewed through the lens of spatial arrangement, many such facilities are comparatively well accessible from the stations, both on foot and by municipal transport. A significant portion of the areas, however, are subsumed also within other ranges (both closer and more remote), including, above all, those of 501–1000 m and 3001–3500 m. Concerning freight transport availability, a notable aspect, for large industrial premises in particular, has been embodied in autonomous connection to the nearest station via railroad sidings.
Towards the beginning of the 1970s, collective housing in the conurbation had started to exhibit rapid growth, predominantly in the ranges 1001–1500 m and 2001–2500 m (Table 7); upon evaluation, this trend indicates the rising importance of road transport as compared to railroads. Even more pronounced was the increase in industrial and technical facilities, where the relevant process manifested itself especially in the range 1001–1500 m (Table 8); at this stage, the proximity of a branch railroad track still constituted an advantage. In the same period, the new industrial premises that had begun to be developed on the outskirts of the city, usually further than 3 km from the train stations, already relied on trucks, and the employees commuted via public transport and/or passenger cars. As for individual housing, the areas increased only slightly, and the rise occurred within the range of 500 to 2500 m (Table 6). The more remote housing sites gradually disappeared, and the range above 5000 m lost almost all of the residential buildings; the secluded mountain homes were abandoned altogether with the demise of traditional mountain farming. The count of utility and other houses adjacent to the railroad stations dropped markedly, reducing the area dedicated to urban amenities.
Between 1970 and 1993, individual housing coverage decreased somewhat in the ranges extending from 0 to 1500 m but rose within the ranges delimited by 1500 and 4000 m (Table 6), meaning that the built-up pattern turned less compact. Such a tendency can be ascribed to urban sanitation, which eliminated old and/or dilapidated buildings in the city center. The vacant lots in the vicinity of the railroad stations were then used to develop, for instance, collective housing, industrial facilities, community services, and traffic areas. Over the whole study area, the collective housing construction rate increased almost threefold (Table 7), with strong dynamics especially in the range of 1000–2500 m. The discussed time-span involved a marked growth in the areal extent of industrial and technical premises, both in the vicinity of the train stations (up to the walkable distance of 1000 m) and at the more remote localities.
In 1993, the pace of transformation affecting the three monitored categories generally decelerated. Individual housing went through a minor rise, mainly in the ranges of 1001–1500 m and 2501–3000 m from the stations (Table 6), these ranges embodying the zones of potential development beyond walkable reach. Collective housing construction, however, stopped almost completely. The conurbation’s industrial and technical areas experienced steady growth, particularly in the ranges of 2501–3000 m and 1001–2000 m (Table 8). The transport connectivity of these industrial parks materializes mainly via passenger cars and trucks.
Between 2003 and 2018, the housing trends duplicated the characteristics of the previous period. While the individual housing exhibited a tendency to grow, collective housing projects came to a virtual standstill. Again, individual housing progressed further predominantly in the ranges defined by the limits of 1501 and 3500 m (Table 6), which embrace, in particular, the city’s (or town’s) suburbs and denote the necessity to use means of private and municipal transport. The areal extent of the industrial premises in some of the ranges was slightly reduced (Table 8), mainly due to the revitalization of some of the brownfields in the ranges of 0–500 m and 1501–2000 m. Conversely, the industrial and technical areas increased within the range of 2001–2500 m, resulting from suburban building schemes centered on delivering greenfield industrial parks.
In the category of individual housing (611), the median gradually increased since 1949 (Table 9), pointing to the gradual growth of the city and the possibility of building houses on the edge of a growing settlement, from which the distance separating the railroad stations rose progressively. The standard deviation was the highest in the first reference period, meaning a relatively large dispersion between the different objects in terms of railroad availability. In the collective housing category (612), the standard deviation was significantly lower in all of the periods. Sites with apartment buildings are more concentrated in certain parts of the city; however, there is also a trend towards significant increase in the median of accessibility of the railroad stations, especially until 1993. In the later period, the intensity of collective housing construction already decreased considerably. This is related to the support of the construction of collective housing in the period of socialism and later to the achievement of certain buildability limits in the area around the city center. The median availability of railroad stations increased also within the category of industrial and technical building (651), and between 1949 and 1970 there was even a jump (Table 9). In the last period, both the median and the standard deviation values for the availability of railroad stations are close to the values for individual housing. The newly built industrial and technical building is therefore already harder to access from railroad stations.
By evaluating the accessibility, we exposed the formerly pivotal role of railroad transportation in localizing residential housing projects and large industrial premises into the city and town centers; this scenario characterizes the years 1949 and (partially) 1970. In the more recent decades, however, the expanding motorization process, which arose and gained momentum in the 1960s, allowed residential, industrial, and utility grounds to spread farther from the train stations, as was also necessary due to the more densely built-up central sectors of the settlements. The above mentioned progressive evolution corresponds to the conclusions proposed in the paper by Antrop [82] and the metastudy by Kasraian et al. [83].

5. Conclusions

The paper was designed to identify and characterize the interaction of landscape structure changes and transportation systems that occurred or were adopted in the city and town of Martin and Vrútky, respectively, after 1949. The two urban units, located close together, are administratively independent of each other but share infrastructures and maintain strong social and economic bonds. Previously, the settlements were joined to form the Martin–Vrútky conurbation, and, later, Vrútky became a city district of Martin. The area is generally diversified, offering a wide variety of natural elements and landscape uses. To a great extent, the landscape structure evolution reflects significant historical events and driving forces that exerted an impact on landscape utilization in Slovakia following the mid-20th century. The political system installed in 1948 markedly influenced the development of the agricultural land in that the state had become the exclusive landowner, with private land ownership abolished [84]; analogically, ideology-induced transformations widely affected also the urbanization and industrialization of Slovakia. The results of the research confirmed transportation and the relevant infrastructure as a major factor of importance for long-term landscape changes in the monitored zones.
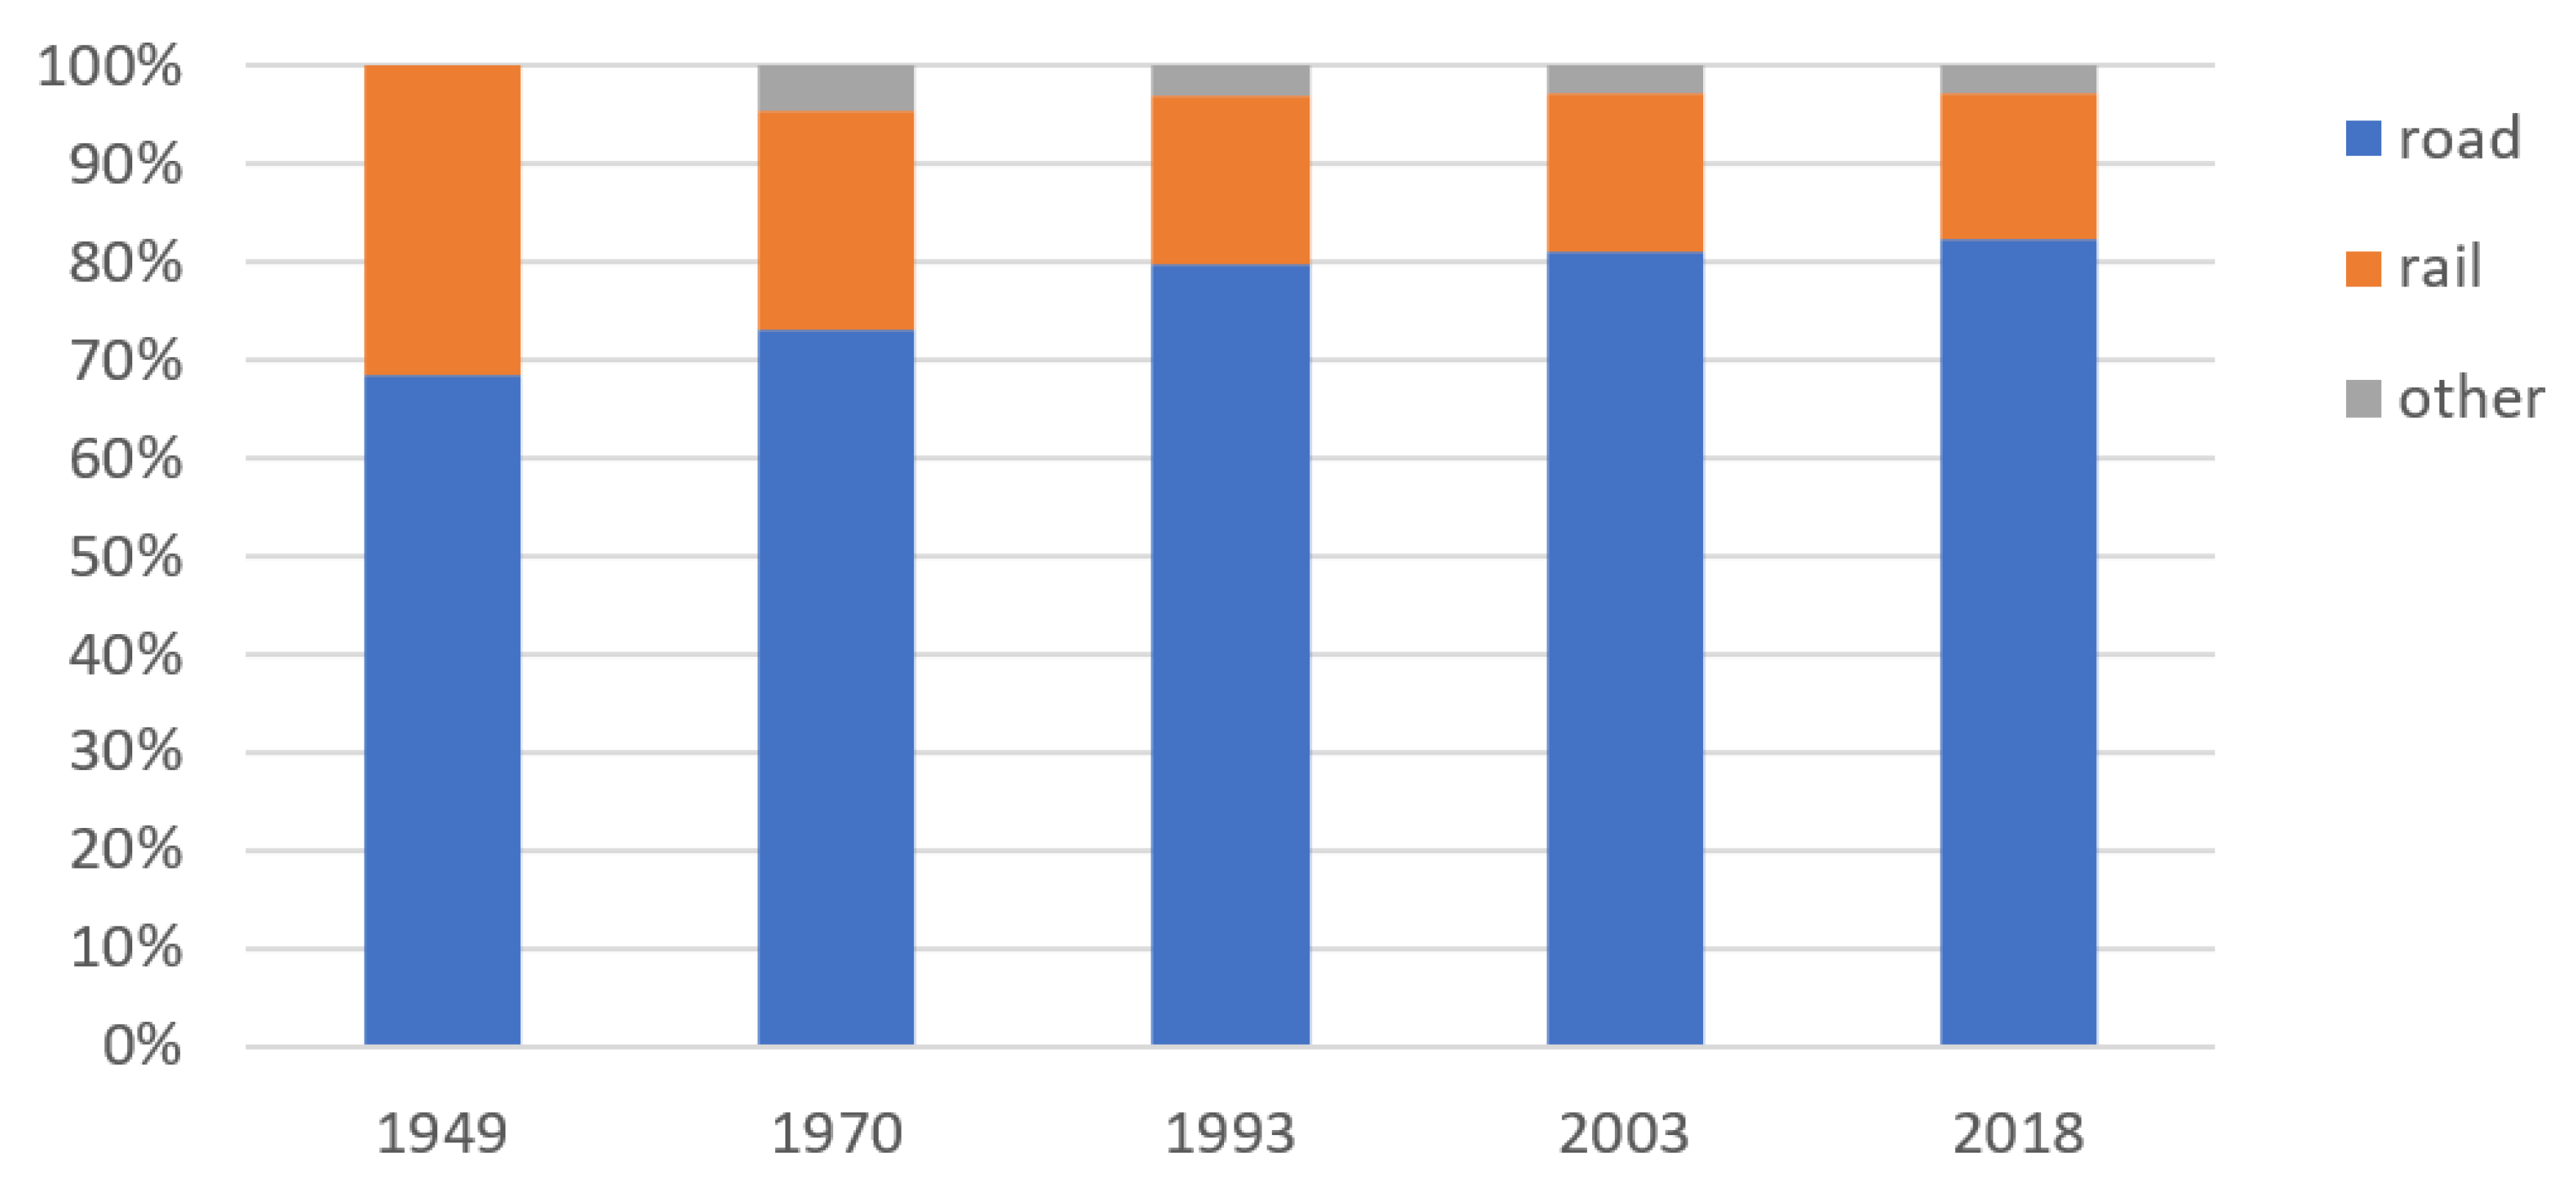
The highest traffic intensity rates determined through the series of censuses denote a gradual traffic increase; interestingly, the indicators grew ten- to twentyfold throughout the overall period, especially on the backbone routes substituting for the presently incomplete European multimodal corridor. However, the actual traffic intensity growth cannot be directly related to the expansion of the residential and utility built-up land within the area. To facilitate such a purpose, it would be necessary to know the details of both the traffic flow as regards its internal, external, and transit components and the variation in the behavior of road users. The data are obtainable exclusively via travel behavior surveys [85], direction and target questionnaires, and exact traffic models [86]. These specialized surveys and instruments, unlike common nationwide censuses to determine traffic intensities, are not conducted or applied regularly, being financially challenging and technically demanding if employed over large areas. Consequently, appropriate information on the past periods is unavailable as well.
By evaluating the accessibility of the railroad stations, we exposed the formerly pivotal role of railroad transportation in localizing individual housing and large industrial premises into the city and town centers; this scenario characterizes the years 1949 and (partially) 1970. The median availability of the railroad stations for collective housing increased significantly in 1970, with the growth completed in 1993 and remaining stable since then. The median availability of the railroad stations to the industrial and technical buildings rose markedly between 1949 and 1970; since the latter year, however, the newly built enterprises were harder to access from the railroad stations. In the more recent decades, the expanding motorization process, which formed and gained momentum in the 1960s, allowed residential, industrial, and utility grounds to spread farther from the train stations, as was also necessary due to the more densely built-up central sectors of the settlements.
The results of the relationships and links between transport accessibility, the development of transport infrastructure, and landscape elements can be important in urban spatial planning and strategic planning of city development.

Author Contributions

Conceptualization—J.N., P.M., and F.P.; methodology—J.N., P.M., and I.D.; data collection and field investigation—J.N.; analyses and map visualization—J.N., I.J., M.H., and I.D.; paper writing—I.D., J.N., and M.H.; review and editing—F.P., H.S., and V.F. All authors have read and agreed to the published version of the manuscript.

Funding

This paper was prepared with support from the Ministry of Education of the Slovak Republic and the Slovak Academy of Science [grant number VEGA 1/0706/20 - Urban sustainable development in the 21st century - assessment of key factors, planning approaches and environmental relationships]. At the Transport Research Centre, the work was supported by the Ministry of Education, Youth and Sports within the National Sustainability Programme I project of Transport R&D Centre (LO1610) based on the research infrastructure acquired from the Operation Programme Research and Development for Innovations (CZ.1.05/2.1.00/03.0064) and at the Silva Tarouca Research Institute for Landscape and Ornamental Gardening with the help of institutional support (VUKOZ-IP-00027073).

Acknowledgments

The authors would like to thank the anonymous reviewers who have made a significant contribution to the quality of the paper.

Conflicts of Interest

The authors declare no conflict of interest.

Appendix A

Table A1. The secondary landscape structure elements as classified by Petrovič, Bugár, Hreško [57].
Id1Level 1Id2 Level 2 Id3 Level 3
1 Tree and scrub vegetation 11 Forests111 Broad-leaved forest
112 Coniferous forest
113 Mixed forest
12 Transnational woodland-scrub 121 Forest aisle and firebreaks
122 Clearing
123 Windfall
124 Forest nursery
13 Non-forest tree vegetation 131 Grove
132 Groups of trees
133 Linear tree vegetation
134 Scrub
135 Bush stands
2 Herbaceous vegetation22 Permanent herbaceous vegetation 221 Grassland
222 Pasture
223 (Semi-)natural grassland
3 Agricultural areas31 Arable land 311 Annual crops
312Greenhouse
32 Gardens 321 By-house garden
322 Gardening colony
33 Perennial cultures331 Orchard
332Technical woody plants
333Vineyard
334Hop garden
34Mosaic of agricultural cultures341with the predominant culture
342with the predominance of arable land
343with the predominance of grasslands
344with the predominance of perennial cultures
4 Subsoil and raw soil outcrops41 Natural411 Compact rock formation
412Scree slope
413 Gravel and sand deposit
414 Erosive surface
42 Artificial421 Mining and quarrying
422Outcrop related to linear transport infrastructure
423 Destroyed area
5 Surface water and wetlands51 Water streams 511 Natural
512 Regulated
513 Artificial
52 Backwaters and wetlands 521 Natural
522 (Semi-)natural
523 Artificial water reservoirs or ponds
6 Urban fabric and built-up areas 61 Housing and civic amenities611 Individual housing
612 Collective housing
613 Urban downtown
614 Cultural-historical and religious objects
615 Civic amenities and services
616 Barracks
62 Settlement and technical vegetation621 Park
622 Other urban greenery
623 Vegetation at graveyard
624 Ruderal vegetation
625 Protective vegetation of technical objects
626 Other technical vegetation
63 Sports facilities and complexes631 Sports objects
632 Sports facilities
64 Recreation objects facilities 641 Recreation objects
642 Recreation facilities
65 Production and technical facilities and areas651 Industrial and technical building
652 Industrial and technical area
653 Agricultural building
654 Agricultural area
655 Dumpsite
656 Construction site
66 Transport related objects and areas661 Road and freeway
662 Static transport
663 Railroad track
664 Railroad station
665 Airport
666 Cableway or Aerial Lift

Appendix B

Figure A1. The landscape structure in 1949, 1970, 1993, 2003, and 2018 (ae).
Land 09 00273 g0a1

References

  1. Fuchs, E.; Verbung, P.H.; Clevers, J.G.P.H.; Herold, M. The potential of old maps and encyclopaedias for reconstructing historic European land cover/use change. Appl. Geogr. 2015, 59, 43–55. [Google Scholar] [CrossRef] [Green Version]
  2. Santana-Cordero, A.M.; Szabo, P. Exploring Qualitative Methods of Historical Ecology and Their Links with Qualitative Research. Int. J. Qual. Methods 2019, 18, 1609406919872112. [Google Scholar] [CrossRef] [Green Version]
  3. Boltižiar, M.; Olah, B.; Petrovič, F. Historické mapy – zdroj dát pri štúdiu krajiny a jej zmien (Historical Maps – Data Sources for the Research of Landscape Changes). Živ. Prostr. 2013, 47, 8–12. (In Slovak) [Google Scholar]
  4. Súľovský, M.; Falťan, V.; Skokanová, H.; Havlíček, M.; Petrovič, F. Spatial analysis of long-term land-use development in regard to physiotopes: Case studies from the Carpathians. Phys. Geogr. 2017, 38, 470–488. [Google Scholar] [CrossRef]
  5. Liu, D.; Toman, E.; Fuller, Z.; Chen, G.; Londo, A.; Zhang, X.S.; Zhao, K.G. Integration of historical map and aerial imagery to characterize long-term land-use change and landscape dynamics: An object-based analysis via Random Forests. Ecol. Indic. 2018, 95, 595–605. [Google Scholar] [CrossRef]
  6. Skaloš, J.; Weber, M.; Lipský, Z.; Trpáková, I.; Šantrůčková, M.; Uhlířová, L.; Kukla, P. Using old military survey maps and orthophotograph maps to analyse long-term land cover changes—Case study (Czech Republic). Appl. Geogr. 2011, 31, 426–438. [Google Scholar] [CrossRef]
  7. Kilianová, H.; Pechanec, V.; Brus, J.; Kirchner, K.; Machar, I. Analysis of the development of land use in the Morava River floodplain, with special emphasis on the landscape matrix. Morav. Geogr. Rep. 2017, 25, 46–59. [Google Scholar] [CrossRef] [Green Version]
  8. Havlíček, M.; Skokanová, H.; Dostál, I.; Vymazalová, M.; Pavelková, R.; Petrovič, F. The consequences of establishing military training areas for land use development—A case study of Libavá, Czech Republic. Land Use Policy 2018, 73, 84–94. [Google Scholar] [CrossRef]
  9. Haladová, I.; Petrovič, F. Predicted development of the city of Nitra in Southwestern Slovakia based on land cover-land use changes and socio-economic conditions. Appl. Ecol. Environ. Res. 2017, 15, 987–1008. [Google Scholar] [CrossRef]
  10. Oťahel, J.; Feranec, J.; Kopecká, M.; Falťan, V. Modification of the CORINE Land Cover method and the nomenclature for identification and inventorying of land cover classes at a scale of 1:10 000 based on case studies conducted in the territory of Slovakia. Geogr. Čas. 2017, 69, 189–224. [Google Scholar]
  11. Bičík, I.; Kupková, L.; Jeleček, L.; Kabrda, J.; Štych, P.; Janoušek, Z.; Winklerová, J. Land Use Changes in the Czech Republic 1845–2010; Springer: Berlin/Heidelberg, Germany, 2015; p. 215. ISBN 978-3-319-17671-0. [Google Scholar] [CrossRef]
  12. Štych, P.; Kabrda, J.; Bičík, I.; Laštovička, J. Regional Differentiation of Long-Term Land Use Changes: A Case Study of Czechia. Land 2019, 8, 165. [Google Scholar] [CrossRef] [Green Version]
  13. Jedlička, J.; Havlíček, M.; Dostál, I.; Huzlík, J.; Skokanová, H. Assessing relationships between land use changes and the development of a road network in the Hodonín region (Czech Republic). Quaest. Geogr. 2019, 38, 145–159. [Google Scholar] [CrossRef] [Green Version]
  14. Muller, K.; Steinmeier, C.; Kuchler, M. Urban growth along motorways in Switzerland. Landsc. Urban Plan. 2010, 98, 3–12. [Google Scholar] [CrossRef]
  15. Dostál, I.; Havlíček, M.; Huzlík, J. Evaluation of Transport Impact to the Landscape. In IV Czech-Slovak Scientific Conference: Transport, Health and Environment; Adamec, V., Jandová, V., Eds.; Transport Research Centre: Brno, Czech Republic, 2010; pp. 97–104. ISBN 978-80-7399-141-8. WOS: 000392425300013. [Google Scholar]
  16. Izakovičová, Z.; Mederly, P.; Petrovič, F. Long-term land use changes driven by urbanisation and their environmental effects (example of Trnava city, Slovakia). Sustainability 2017, 9, 1553. [Google Scholar] [CrossRef] [Green Version]
  17. Havlíček, M.; Svoboda, J.; Dostál, I. Development of Sugar Industry in Hodonín district and its Effect on Land-use Changes and Transport Infrastructure. Listy Cukrov. Řepař. 2013, 129, 312–316. [Google Scholar]
  18. Frantál, B.; Greer-Wootten, B.; Klusáček, P.; Krejčí, T.; Kunc, J.; Martinát, S. Exploring spatial patterns of urban brownfields regeneration: The case of Brno, Czech Republic. Cities 2015, 44, 9–18. [Google Scholar] [CrossRef]
  19. Damborský, M.; Wokoun, R. Location Factors of Small and Medium Entrepreneurship under the Economic Conditions of the Czech Republic. E M Ekon. Manag. 2010, 13, 32–43. [Google Scholar]
  20. Michniak, D.; Wieckowski, M.; Stepniak, M.; Rosik, P. The impact of selected planned motorways and expressways on the potential accessibility of the Polish-Slovak borderland with respect to tourism development. Morav. Geogr. Rep. 2015, 23, 13–20. [Google Scholar] [CrossRef] [Green Version]
  21. Vrbičanová, G.; Kaisová, D.; Močko, M.; Petrovič, F.; Mederly, P. Mapping Cultural Ecosystem Services Enables Better Informed Nature Protection and Landscape Management. Sustainability 2020, 12, 2138. [Google Scholar] [CrossRef] [Green Version]
  22. Bürgi, M.; Hersperger, A. Driving forces of landscape change—Current and new directions. Landsc. Ecol. 2004, 19, 857–868. [Google Scholar] [CrossRef]
  23. Skokanová, H.; Falťan, V.; Havlíček, M. Driving forces of main landscape change proceses from past 200 years in Central Europe—Differences between old democratic and post-socialist countries. Ekol. Bratisl. 2016, 35, 50–65. [Google Scholar] [CrossRef] [Green Version]
  24. Schneeberger, N.; Bürgi, M.; Hersperger, A.; Ewald, K.C. Driving forces and rates of landscape change as a promising combination for landscape change research—An application on the northern fringe of the Swiss Alps. Land Use Policy 2007, 24, 349–361. [Google Scholar] [CrossRef]
  25. Rodrigue, J.P. The Geography of Transport Systems, 4th ed.; Routledge: New York, NY, USA, 2017; p. 440. ISBN 978-1138669574. [Google Scholar]
  26. Litman, T. Land use impact costs of transportation. World Transp. Policy Pract. 1995, 1, 9–16. [Google Scholar] [CrossRef]
  27. Kraft, S.; Halás, M.; Vančura, M. The delimitation of urban hinterlands based on transport flows: A case study of regional capitals in the Czech Republic. Morav. Geogr. Rep. 2014, 22, 24–32. [Google Scholar] [CrossRef]
  28. Maier, K.; Franke, D. Assessment of territorial benefits and efficiency from the construction of motorway and speed train networks: The Czech case. Morav. Geogr. Rep. 2019, 27, 140–154. [Google Scholar] [CrossRef] [Green Version]
  29. Izakovičová, Z.; Miklós, L.; Miklósová, V.; Petrovič, F. The Integrated Approach to Landscape Management—Experience from Slovakia. Sustainability 2019, 11, 4554. [Google Scholar] [CrossRef] [Green Version]
  30. Geneletti, D. A GIS-based decision support system to identify nature conservation priorities in an alpine valley. Land Use Policy 2004, 21, 149–160. [Google Scholar] [CrossRef]
  31. Jaeger, J.A.G.; Bertiller, R.; Schwick, C.; Müller, K.; Steinmeier, C.; Ewald, K.C.; Ghazoul, J. Implementing landscape fragmentation as an indicator in the Swiss Monitoring System of Sustainable Development (MONET). J. Environ. Manag. 2008, 88, 737–751. [Google Scholar] [CrossRef] [PubMed]
  32. Hrelja, R. Integrating transport and land-use planning? How steering cultures in local authorities affect implementation of integrated public transport and land-use planning. Transp. Res. Part A Policy Pract. 2015, 74, 1–13. [Google Scholar] [CrossRef] [Green Version]
  33. Morimoto, A. Tranportation and land use. In Traffic and Safety Sciences: Interdisciplinary Wisdom of IATSS; Doi, K., Ed.; The International Association of Traffic and Safety Sciences (IATSS): Tokyo, Japan, 2015; pp. 22–30. [Google Scholar]
  34. Ratner, K.A.; Goetz, A.R. The reshaping of land use and urban form in Denver through transit-oriented development. Cities 2013, 30, 31–46. [Google Scholar] [CrossRef]
  35. Nazarnia, N.; Schwick, C.; Jaeger, J.A.G. Accelerated urban sprawl in Montreal, Quebec City, and Zurich: Investigating the differences using time series 1951–2011. Ecol. Indic. 2016, 60, 1229–1251. [Google Scholar] [CrossRef]
  36. Travisi, C.M.; Camagni, R.; Nijkamp, P. Impacts of urban sprawl and commuting: A modelling study for Italy. J. Transp. Geogr. 2010, 18, 382–392. [Google Scholar] [CrossRef]
  37. De Vos, J.; Witlox, F. Transportation policy as spatial planning tool; reducing urban sprawl by increasing travel costs and clustering infrastructure and public transportation. J. Transp. Geogr. 2013, 33, 117–125. [Google Scholar] [CrossRef]
  38. De Lavalette, B.C.; Tijus, C.; Poitrenaud, S.; Leproux, C.; Bergeron, J.; Thouez, J.P. Pedestrian crossing decision-making: A situational and behavioral approach. Saf. Sci. 2009, 47, 1248–1253. [Google Scholar] [CrossRef]
  39. Skládaná, P.; Havlíček, M.; Dostál, I.; Skládaný, P.; Tučka, P.; Perůtka, J. Land use as a motivation for railway trespassing: Experience from the Czech Republic. Land 2018, 7, 1. [Google Scholar] [CrossRef] [Green Version]
  40. Mukherjee, D.; Mitra, S. Impact of Road Infrastructure Land Use and Traffic Operational Characteristics on Pedestrian Fatality Risk: A Case Study of Kolkata, India. Transp. Dev. Econ. 2019, 5, 6. [Google Scholar] [CrossRef]
  41. WHO. Health Effects and Risks of Transport Systems: The HEARTS Project; World Health Organization: Geneva, Switzerland, 2006; p. 78. [Google Scholar]
  42. Adamec, V.; Ličbinský, R.; Cholava, R. Transport and Health Risks of Transport. Trans. Transp. Sci. 2011, 4, 115–134. [Google Scholar] [CrossRef] [Green Version]
  43. Sallis, J.F.; Bull, F.; Burdett, R.; Frank, L.D.; Griffiths, P.; Giles-Corti, B.; Stevenson, M. Use of science to guide city planning policy and practice: How to achieve healthy and sustainable future cities. Lancet 2016, 388, 2936–2947. [Google Scholar] [CrossRef] [Green Version]
  44. Huzlík, J.; Božek, F.; Pawelczyk, A.; Ličbinský, R.; Náplavová, M.; Pondělíček, M. Identifying risk sources of air contamination by polycyclic aromatic hydrocarbons. Chemosphere 2017, 183, 139–146. [Google Scholar] [CrossRef]
  45. Litman, T. Transportation and the Quality of Life. In Encyclopedia of Quality of Life and Well-Being Research; Michalos, A.C., Ed.; Springer: Dordrecht, The Netherlands, 2014. [Google Scholar] [CrossRef]
  46. Lee, R.J.; Sener, I.N. Transportation Planning and Quality of Life: Where Do They Intersect? Transp. Policy 2016, 48, 146–155. [Google Scholar] [CrossRef] [Green Version]
  47. Rojas-Rueda, D.; de Nazelle, A.; Andersen, Z.J.; Braun-Fahrländer, C.; Bruha, J.; Brůhová-Foltýnová, H.; Desqueyroux, H.; Praznoczy, C.; Ragettli, M.S.; Tainio, M.; et al. Health Impacts of Active Transportation in Europe. PLoS ONE 2016, 11, e0149990. [Google Scholar] [CrossRef] [PubMed]
  48. Raza, W.; Forsberg, B.; Johansson, C.; Sommar, J.N. Air pollution as a risk factor in health impact assessments of a travel mode shift towards cycling. Glob. Health Action 2018, 11, 1429081. [Google Scholar] [CrossRef] [PubMed] [Green Version]
  49. Rode, P.; Heeckt, C.; Ahrend, R.; Melchor, O.H.; Robert, A.; Badstuber, N.; Hoolachan, N.; Kwami, C. Integrating National Policies to Deliver Compact, Connected Cities: An Overview of Transport and Housing. Available online: http://newclimateeconomy.net/content/cities-working-papers (accessed on 12 November 2019).
  50. Stevenson, M.; Thompson, J.; de Sá, T.H.; Ewing, R.; Mohan, D.; McClure, R.; Roberts, I.; Tiwari, G.; Giles-Corti, B.; Sun, X.; et al. Land use, transport, and population health: Estimating the health benefits of compact cities. Lancet 2016, 388, 2925–2935. [Google Scholar] [CrossRef] [Green Version]
  51. Zielstra, D.; Hochmair, H.H. A Comparative Study of Pedestrian Accessibility to Transit Stations Using Free and Proprietary Network Data. Transp. Res. Rec. 2011, 2217, 145–152. [Google Scholar] [CrossRef] [Green Version]
  52. Yang, R.; Yan, H.; Xiong, W.; Liu, T. The Study of Pedestrian Accessibility to Rail Transit Stations Based on KLP Model. Procedia-Soc. Behav. Sci. 2013, 96, 714–722. [Google Scholar] [CrossRef] [Green Version]
  53. Macoun, T.; Dostál, I.; Nishimura, T. Land-use and urban development. In Sustainable Mobilitity in Urban Areas; Bronto, A., Ed.; World Road Association (PIARC): La Défense, France, 2019; pp. 103–133. ISBN 978-2-84060-527-0. [Google Scholar]
  54. Kolcsár, R.A.; Szilássi, P. Assessing Accessibility of Urban Green Spaces Based on Isochrone Maps And Street Resolution Population Data Through The Example of Zalaegerszeg, Hungary. Carpath. J. Earth Environ. Sci. 2018, 13, 31–36. [Google Scholar] [CrossRef] [Green Version]
  55. Patarasuk, R.; Binford, M.W. Longitudinal analysis of the road network development and land-cover change in Lop Buri province, Thailand, 1989–2006. Appl. Geogr. 2012, 32, 228–239. [Google Scholar] [CrossRef]
  56. Feranec, J.; Otahel, J. Krajinná Pokrývyka Slovenska (Land Cover of Slovakia); Geografický Ústav SAV: Bratislava, Slovakia, 2001; p. 124. [Google Scholar]
  57. Petrovič, F.; Bugár, G.; Hreško, J. Zoznam krajinných prvkov mapovateľných na území Slovenska (List of landscape elements in Slovakia). In GEO Information: Nitriansky Kraj v Kontexte Regionálneho Rozvoja = Nitra Region in the Regional Development Context; Dubcová, A., Boltižiar, M., Eds.; Fakulta Prírodných vied UKF: Nitra, Slovakia, 2009; pp. 112–124. ISBN 1336-7234. (In Slovak) [Google Scholar]
  58. Kohout, M.; Tichý, D.; Tittl, F. Collective Housing: A Spatial Typology; Czech Technical University: Prague, Czech Republic, 2015; p. 205. ISBN 978-80-01-05848-0. [Google Scholar]
  59. Feranec, J.; Soukup, T.; Taff, G.N.; Štych, P.; Bičík, I. Overview of Changes in Land Use and Land Cover in Eastern Europe. In Land-Cover and Land-Use Changes in Eastern Europe after the Collapse of the Soviet Union in 1991; Guttmann, G., Radeloff, V., Eds.; Springer: Berlin/Heidelberg, Germany, 2017; pp. 13–34. [Google Scholar] [CrossRef]
  60. Feranec, J.; Šúri, M.; Cebecauer, T.; Ot’ahe, J. Methodological aspects of landscape changes detection and analysis in Slovakia applying the CORINE land cover databases. Geogr. Čas. 2002, 54, 271–288. [Google Scholar]
  61. Kopecká, M. Identifikácia a hodnotenie zmien krajiny vo veľkej mierke (na príklade okolia Trnavy). (Identification and assessment landscape changes at the local scale (using the example of the Trnava surrounding)). Geogr. Čas. 2006, 58, 125–148. (In Slovak) [Google Scholar]
  62. Cebecauerová, M. Analýza a hodnotenie zmien štruktúry krajiny (na príklade časti Borskej nížiny a Malých Karpát). (Analysis and evaluation of changes in the structure of the landscape (on the example of part of the Borská nížina lowland and Malé Karpaty Mts.). Geogr. Slovaca 2007, 24, 23–26. (In Slovak) [Google Scholar]
  63. Metodika Výkonu a Vyhodnotenia Celoštátneho Sčítania Dopravy 2015 (Methodology of Performance and Evaluation of the National Traffic Census 2015); Ministerstvo Dopravy, Výstavby a Regionálneho Rozvoja Slovenskej Republiky: Bratislava, Slovakia, 2015.
  64. Bartuška, L.; Biba, V.; Jeřábek, K. Verification of Methodical Procedure for Determining the Traffic Volumes Using Short-term Traffic Surveys. Procedia Eng. 2016, 161, 275–281. [Google Scholar] [CrossRef] [Green Version]
  65. Prognózovanie Výhľadových Intenzít na Cestnej Sieti do Roku 2040 TP 07/2013; Ministerstvo Dopravy, Výstavby a Regionálneho Rozvoja SR: Bratislava, Slovakia, 2013; p. 21.
  66. Sčítání dopravy na státních silnicích v Československé republice v letech 1949-50 (Census of traffic on state roads in the Czechoslovak Republic in 1949-50); Set of Maps in Scale 1:200,000; Státní Zeměměřičský a Kartografický Ústav: Praha, Czech Republic, 1951. (In Czech)
  67. Kraj: Stredoslovenský (Stredoslovenský region). In Výsledky sčítania cestnej dopravy v r. 1968 (Results of the road traffic census in 1968); Stredisko Pre Rozvoj Ciest a Dialnic: Bratislava, Slovakia, 1970. (In Slovak)
  68. Kraj 09—Stredoslovenský (Region 09 – Stgredoslovenský). In Výsledky Sčítania Cestnej Dopravy na Diaľničnej a Cestnej Sieti r. 1990 (Results of the Census of Road Transport on the Motorway and Road Network in 1990); Ústav Cestného Hospodárstva a Dopravy: Bratislava, Slovakia, 1991. (In Slovak)
  69. Celoštátne Sčítanie Dopravy 2005 (Nationwide Traffic Census 2005); Slovenská Správa Ciest: Bratislava, Slovakia, 2006. (In Slovak)
  70. Celoštátne Sčítanie Dopravy 2015 (Nationwide Traffic Census 2015); Slovenská Správa Ciest: Bratislava, Slovakia, 2015. (In Slovak)
  71. Awaida, A.; Westervelt, J.; de Mouveaux, P. GRASS GIS Manual: R.Cost. 2015. Available online: https://grass.osgeo.org/grass70/manuals/r.cost.html (accessed on 27 December 2019).
  72. Etherington, T.R. Least-cost modelling and landscape ecology: Concepts, applications, and opportunities. Curr. Landsc. Ecol. Rep. 2016, 1, 40–53. [Google Scholar] [CrossRef] [Green Version]
  73. Cantrell, C.D. Modern Mathematical Methods for Physicists and Engineers; Cambridge University Press: Cambridge, UK, 2000; p. 784. ISBN 978-0521598279. [Google Scholar]
  74. Kohn, I. Eisenbahn-Jahrbuch der Österreichisch-Ungarischen Monarchie: Fünfter Jahrgang (Railway yearbook of the Austrian-Hungarian Monarchy, 5th ed.; Lehmann Wentzel: Wien, Austria, 1872; p. 482. (In German) [Google Scholar]
  75. Kohn, I. Eisenbahn-Jahrbuch der Österreichisch-Ungarischen Monarchie: Sechster Jahrgang (Railway yearbook of the Austrian-Hungarian Monarchy, 6th ed.; Lehmann Wentzel: Wien, Austria, 1873; p. 482. [Google Scholar]
  76. Nozdrovická, J.; Turanovičová, M.; Gašparovičová, P. Identification and Evaluation of Development Trends in the Conurbatino of the Cities Martin and Vrútky over the last 23 years. In Geografické Informácie, Proceedings of 26th International Geographical Conference on Geographical Aspects of Central Europe—Slovakia and Czechia—25 Years on the Political Map of the World, Nitra, Slovakia, 10–11 October 2018; Dubcová, A., Ed.; Univerzita Konštantína Filozofa v Nitre: Nitra, Slovakia, 2018; pp. 384–393. ISSN 1337-9453. [Google Scholar] [CrossRef]
  77. Posová, D.; Sýkora, L. Urbanization and Suburbanization in the Urban Regions of Prague and Vienna: Structural Differences in the Presence of Different Political-Economic Regimes. Geografie 2011, 116, 276–299. [Google Scholar] [CrossRef] [Green Version]
  78. Hlaváček, P.; Kopáček, M.; Horáčková, L. Impact of Suburbanisation on Sustainable Development of Settlements in Suburban Spaces: Smart and New Solutions. Sustainability 2019, 11, 7182. [Google Scholar] [CrossRef] [Green Version]
  79. Kovács, Z.; Farkas, Z.J.; Egedy, T.; Kondor, A.C.; Szabó, B.; Lennert, J.; Baka, D.; Kohán, B. Urban sprawl and land conversion in post-socialist cities: The case of metropolitan Budapest. Cities 2019, 92, 71–81. [Google Scholar] [CrossRef]
  80. Lukáčová, A. Komparatívna analýza stupňa suburbanizácie v zázemí českých a slovenských miest (prípadová štúdia Prešova a Olomouca) (Comparative analysis of the level of suburbanization in the hinterland of Czech and Slovak cities (case study of Prešov and Olomouc)). Folia Geogr. 2011, 17, 199–216. (In Slovak) [Google Scholar]
  81. Matlovič, R.; Sedláková, A. The Impact of Suburbanisation in the Hinterland of Prešov (Slovakia). Morav. Geogr. Rep. 2007, 15, 22–31. [Google Scholar]
  82. Antrop, M. Landscape change and the urbanization process in Europe. Landsc. Urban Plan. 2004, 67, 9–26. [Google Scholar] [CrossRef]
  83. Kasraian, D.; Maat, K.; Stead, D.; van Wee, B. Long-term impacts of transport infrastructure networks on land-use change: An international review of empirical studies. Transp. Rev. 2016, 36, 772–792. [Google Scholar] [CrossRef]
  84. Bezák, P.; Petrovič, F. Agriculture, landscape, biodiversity: Scenarios and stakeholder perceptions in the Poloniny National Park (NE Slovakia). Ekol. Bratisl. 2006, 25, 82–93. [Google Scholar]
  85. Šenk, P.; Kouřil, P. Průzkumy dopravního chování v ČR a zahraničí. Potřebujeme národní průzkum? (Traffic behavior surveys in the Czech Republic and abroad. Do we need a national survey)? Doprav. Inž. 2014, 9, 24–26. (In Czech) [Google Scholar]
  86. Appraisal Guidance (Transport), the Use of Transport Models in Transport Planning and Project Appraisal. Available online: http://kc-sump.eu/wordpress/wp-content/uploads/2015/04/Upotreba-Modela-u-prometnomplaniranju_JASPERS_kolovoz-2014.pdf (accessed on 22 November 2019).
Figure 1. The location of the study area.
Land 09 00273 g001
Figure 2. The Malá Fatra mountains embody an important barrier for transportation networks. A view over the individual and collective housing in the town of Vrútky (Photo: J. Nozdrovická, 2018).
Land 09 00273 g002
Figure 3. The shares of various transportation modes in the area of landscape elements in the category Transport related objects and areas.
Land 09 00273 g003
Figure 4. The intensity of landtake by landscape elements related to transportation (hectares per year and period).
Land 09 00273 g004
Figure 5. The development in the main road transport networks and traffic volume trends (ae).
Land 09 00273 g005
Figure 6. The accessibility of railroad stations and stops in 1949, 1970, 1993, 2003, and 2018 (ae).
Land 09 00273 g006
Table 1. The processes considered in landscape change evaluation.
Id Type of Change Id Type of Change
1No change 8Extensification of agriculture
2Urbanization 9Forestation
3Deurbanization 10Deforestation
4Industrialization and technologization11Irrigation
5Deindustrialization 12Draining
6Exploitation of mineral resources 13Redevelopment
7Intensification in agriculture 14Agricultural land loss
Table 2. The national traffic censuses and landscape structure mapping in Slovakia.
Landscape MappingTraffic CensusReference
19491949–1950[66]
19701968[67]
19931990[68]
20032005[69]
20182015[70]
Table 3. The landscape structure elements and their shares in percent related to the survey periods.
Category of Elements19491970199320032018
1Trees and shrubs48.148.446.154.054.1
2Grass and herbaceous vegetation16.312.015.15.34.7
3Agricultural crops29.627.122.923.523.1
4Exposed bedrock and subsoil0.20.40.50.40.5
5Water and wetlands0.80.81.00.80.9
6Residential and built-up land5.011.314.416.016.7
Total100.0100.0100.0100.0100.0
Table 4. Landscape change categories and their proportion rates in percent.
Landscape Change1949/19701970/19931993/20032003/20181949/2018
1No change70.880.979.691.059.1
2Urbanization1.92.11.70.44.1
3Deurbanization0.30.30.30.00.2
4Industrialization and technologization2.91.30.80.33.0
5Deindustrialization0.31.40.10.00.1
6Exploitation of mineral resources0.30.20.20.10.3
-Other processes23.513.817.38.233.2
Total100.0100.0100.0100.0100.0
Table 5. The development of the areas (in hectares) of landscape elements in the category transport-related objects and areas.
Landscape Element19491970199320032018
661Roads and freeways96.7160.4236.4247.8261.4
662Static transport0.615.839.959.970.9
663Railroad tracks38.542.947.349.749.6
664Railroad stations6.110.611.711.211.2
665Airports0.011.210.210.610.6
666Cableways and Aerial lifts0.00.00.30.30.4
Total141.9240.9345.8379.5404.1
Table 6. The areas of individual housing related to railroad station accessibility (in hectares).
Distance19491970199320032018
0–500 m6.793.783.553.754.00
501–1000 m13.4214.0211.4411.6612.09
1001–1500 m10.4912.9112.6513.5913.73
1501–2000 m3.656.407.047.438.75
2001–2500 m3.416.7510.3111.4612.12
2501–3000 m3.934.698.179.4511.39
3001–3500 m3.141.275.255.906.82
3501–4000 m1.650.631.522.122.40
4001–4500 m1.390.670.650.590.82
4501–5000 m0.270.220.130.230.29
Over 5001 m0.300.030.000.020.02
Total48.4451.3760.7066.2072.44
Table 7. The areas of collective housing related to railroad station accessibility (in hectares).
Distance19491970199320032018
0–500 m0.171.462.152.142.18
501–1000 m1.713.104.764.594.69
1001–1500 m0.695.419.489.689.95
1501–2000 m0.104.517.697.617.95
2001–2500 m0.143.889.1710.0810.07
2501–3000 m0.160.302.041.491.56
Over 3001 m0.000.050.000.000.00
Total2.9518.7235.3035.6036.40
Table 8. The areas of industrial and technical facilities related to railroad station accessibility (in hectares).
Distance19491970199320032018
0–500 m1.404.954.024.053.52
501–1000 m7.006.3514.0914.2315.25
1001–1500 m4.4812.2017.7321.6323.46
1501–2000 m2.695.9917.9121.2818.89
2001–2500 m3.187.5216.8114.3218.11
2501–3000 m0.032.676.9812.3512.76
3001–3500 m0.068.5512.3111.5111.30
3501–4000 m0.357.876.576.226.22
4001–4500 m0.030.930.140.120.17
4501–5000 m0.000.000.000.220.20
Over 5001 m0.130.000.000.120.23
Total19.3557.0296.55106.06110.12
Table 9. Statistical analysis of the accessibility of selected landscape elements from railroad stations (in meters).
Landscape ElementStatistical ParameterPeriod
19491970199320032018
Individual housing (611)Median11831295166617311833
Standard deviation1147883955967978
Collective housing (612)Median8101450157715871582
Standard deviation563603640630629
Industrial and technical building (651)Median10991950186618401851
Standard deviation8291143949938939

