Article

Research on Urban and Rural Coordination Development and Its Driving Force Based on the Space-time Evolvement Taking Guangdong Province as an Example

School of Economics and Management, Tongji University, Shanghai 200092, China
*
Author to whom correspondence should be addressed.
Land 2020, 9(8), 253; https://doi.org/10.3390/land9080253
Submission received: 6 July 2020 / Revised: 26 July 2020 / Accepted: 28 July 2020 / Published: 30 July 2020
(This article belongs to the Section Urban Contexts and Urban-Rural Interactions)

Abstract

:
Based on the background of the change in the urban–rural relationship in Guangdong Province, this paper constructs an analysis framework of urban and rural coordination development. Using the data of 19 administrative units above prefecture level in Guangdong Province, this paper studies the space–time evolution of urban and rural coordination development during 2000–2015 through Principal Component Analysis (PCA) and Exploratory Spatial Data Analysis (ESDA) and explores the influencing factors and driving forces behind it. It is found that there is club convergence in the urban and rural coordination development in Guangdong Province. This kind of convergence is reflected in the findings that the east bank of the Pearl River estuary is the best area for the urban and rural coordination development where Guangzhou, Dongguan, Shenzhen is the core and the level of urban and rural coordination development in the east, west and north of Guangdong Province is relatively low, which also reflects a geographical polarization feature. Based on the analysis of the factors that promote the urban and rural coordination development in the main years of 2000–2015, it can be concluded that location, economic development and urbanization level are the most important driving forces, followed by industrial structure. This research can be used as a decision-making reference for urban and rural coordination development and new countryside construction in China in the New Era.

1. Introduction

According to the development experience of a large number of countries and regions globally, the evolution process of urban–rural relationships has common features; that is, it takes on specific characteristics over time. In the early stage of development, there is a special binary opposition between urban and rural areas. Cities absorb a large amount of rural labor through the industrialization process and the gap between urban and rural areas gradually becomes prominent [1,2,3]. With the process of industrialization, cities further spread their development effects to the countryside and drive rural development, gradually forming the “core-periphery” [4], “growth pole” [5] and “circle layer” models [6]. With further improvement of the urbanization level, the relationship between cities and between urban and rural areas is strengthened. Concepts of urban agglomerations have formed in different countries and regions, such as “Desakota” [7], Megalopolis [8] and Ecumenopolis [9]. In addition, many scholars believe that because of continuous development and evolution of urban agglomerations, cities and rural areas will eventually be in a relatively harmonious relationship [10], which means adoption of an appropriate urbanization model could promote urban and rural coordination development [11]. Through the optimal allocation of various development factors and the optimal adjustment of the economic and social structure within urban agglomerations, the healthy development of the regional urbanization process can be promoted and thus play an important role of promotion across a larger region [12].
Similarly, China’s urban and rural development has also experienced a series of stages since the founding of the People’s Republic of China. Before the Reform and Opening-up, due to the restrictions of a series of control measures, such as the planned economic system and household registration system, the production factors of population and capital were unable to flow freely between urban and rural areas and cities were unable to spread their industrialization achievements to the countryside. An obvious binary opposition structure existed between urban and rural areas [13]. After the Reform and Opening-up in 1978, with the formation of the market economy system and the implementation of the Opening-up policy, China entered the process of rapid marketization and urbanization. At this stage, cities and rural areas began to develop together. As a result, a large portion of the rural labor force entered cities to engage in non-agricultural industries [14]. In addition, the government began to pay attention to the development of rural areas and encouraged rural township enterprises to develop non-agricultural industries [15,16]. Scholars generally believe that, in terms of the time dimension, urban and rural areas at this stage experienced considerable development of their social, economic and environmental aspects [17]. In rural areas in particular, significant changes were made in lifestyles [18], employment [19], industrial development [20], land use [21,22], infrastructure conditions [23,24,25] and medical services [26]. Researchers have also noted that, in the process of development, many gaps existed between urban and rural areas, which were mainly reflected in the provision of public goods [27], urban and rural income [28,29], infrastructure allocation [30], education resource investment [31] and land resource utilization rationality [32,33]. Li et al. identified the lag of population urbanization and the over-utilization of land as the main reasons for the lack of urbanization coordination [34].
In addition to the above common factors, China has unique problems in the process of urban and rural development. After more than 30 years of rapid development, although the government intends to promote development in the countryside, China’s urban and rural development has not naturally transitioned to a scenario in which urban areas support the countryside. In contrast, a large number of conflicts exist in terms of development opportunities, resource acquisition and other factors that affect urban and rural society, economy, environment and so forth [35,36]. These conflicts often lead to further social problems, such as loss of cultivated land [37,38] and imbalance of the economic burden of urban and rural sewage treatment [39]. In addition, even in the more developed urban agglomerations, differentiated spatial patterns exist. Therefore, the issue of urban and rural coordination development has become an important livelihood issue that concerns the Chinese government [40]. For this reason, in 2003 and 2012, the development strategies of “urban and rural coordination development” and “new urbanization” were advanced, respectively. In addition, urban and rural coordination development has also become one of the main tasks of China’s development in the New Era.
To date, numerous researchers have examined urban and rural coordination development, including investigations of theoretical combing [41], promotion measures [42,43] and coordination mode [44]. In addition, the intension of urban and rural coordination development has been studied from numerous perspectives. For example, Dou et al. believed that urban and rural coordination development is a process of promoting balanced allocation of urban and rural resources and free flow of factors [45]. Liu et al. believed that the coordinated development of urban and rural areas refers to the formation of a special relationship between urban and rural areas in terms of spatial distribution, economic investment, eco-environment and social services [17]. Long et al. believed that the coordination of urban and rural development refers to the distribution of regional resources between urban and rural areas [15]. If the coordination of urban and rural development is high, resources can be evenly distributed between urban and rural areas, otherwise, cities will further deprive rural areas of development resources. Chen and Gao believed that urban and rural coordination development includes three dimensions [46], that is, the release of the rural labor force through land policy reform, the employment and citizenization of the rural labor force in the city and the effect of rural scale economies such as collective farms and agricultural mechanizations. Gross et al. believed that urban and rural coordination development means that residents may have different lifestyles in urban and rural areas but can enjoy similar basic living conditions [47]. Researchers have also used the geographic information system (GIS) approach to study related issues [48]; however, since the space–time evolution of urban and rural development is a dynamic process, the widely used GIS method is inappropriate for studying related issues.
In further research of the driving forces, as an extension tool of GIS, the cellular automata (CA) model has become the main tool for some scholars to study the dynamic changes in urban and rural areas [49]. However, the CA model pays more attention to the monitoring and simulation of space–time changes and lacks the integration and explanation of driving forces. As a result, system dynamics (SD) modelling has been introduced into the research of related fields. This approach describes the complex interaction between each element by treating urban and rural systems as a set of interrelated elements [50,51]. However, this method also has the disadvantage of lacking a spatial dimension in model variables.
In general, deficiencies remain in the existing research. First, although the indicators selected by scholars in the evaluation of urban and rural coordination development level are appropriate [15,52], they can be subjected to further classification, for example, by comprehensively evaluating urban and rural coordination development from two aspects of urban and rural development and urban and rural coordination. Second, in the study of the driving forces of urban and rural coordination development, few scholars have considered the impact of spatial effects, which can result in deviation in the exploration of the driving force. Therefore, this paper constructs a comprehensive evaluation index system of urban and rural coordination development, evaluates the comprehensive level of urban and rural coordination development using the statistical data of 19 administrative units above the prefecture level in Guangdong Province, studies its spatial evolution pattern and explores the driving forces of urban and rural coordination development while taking the spatial effect into consideration. Finally, the results of this study provide the basis for policy making.

2. Methods and Materials
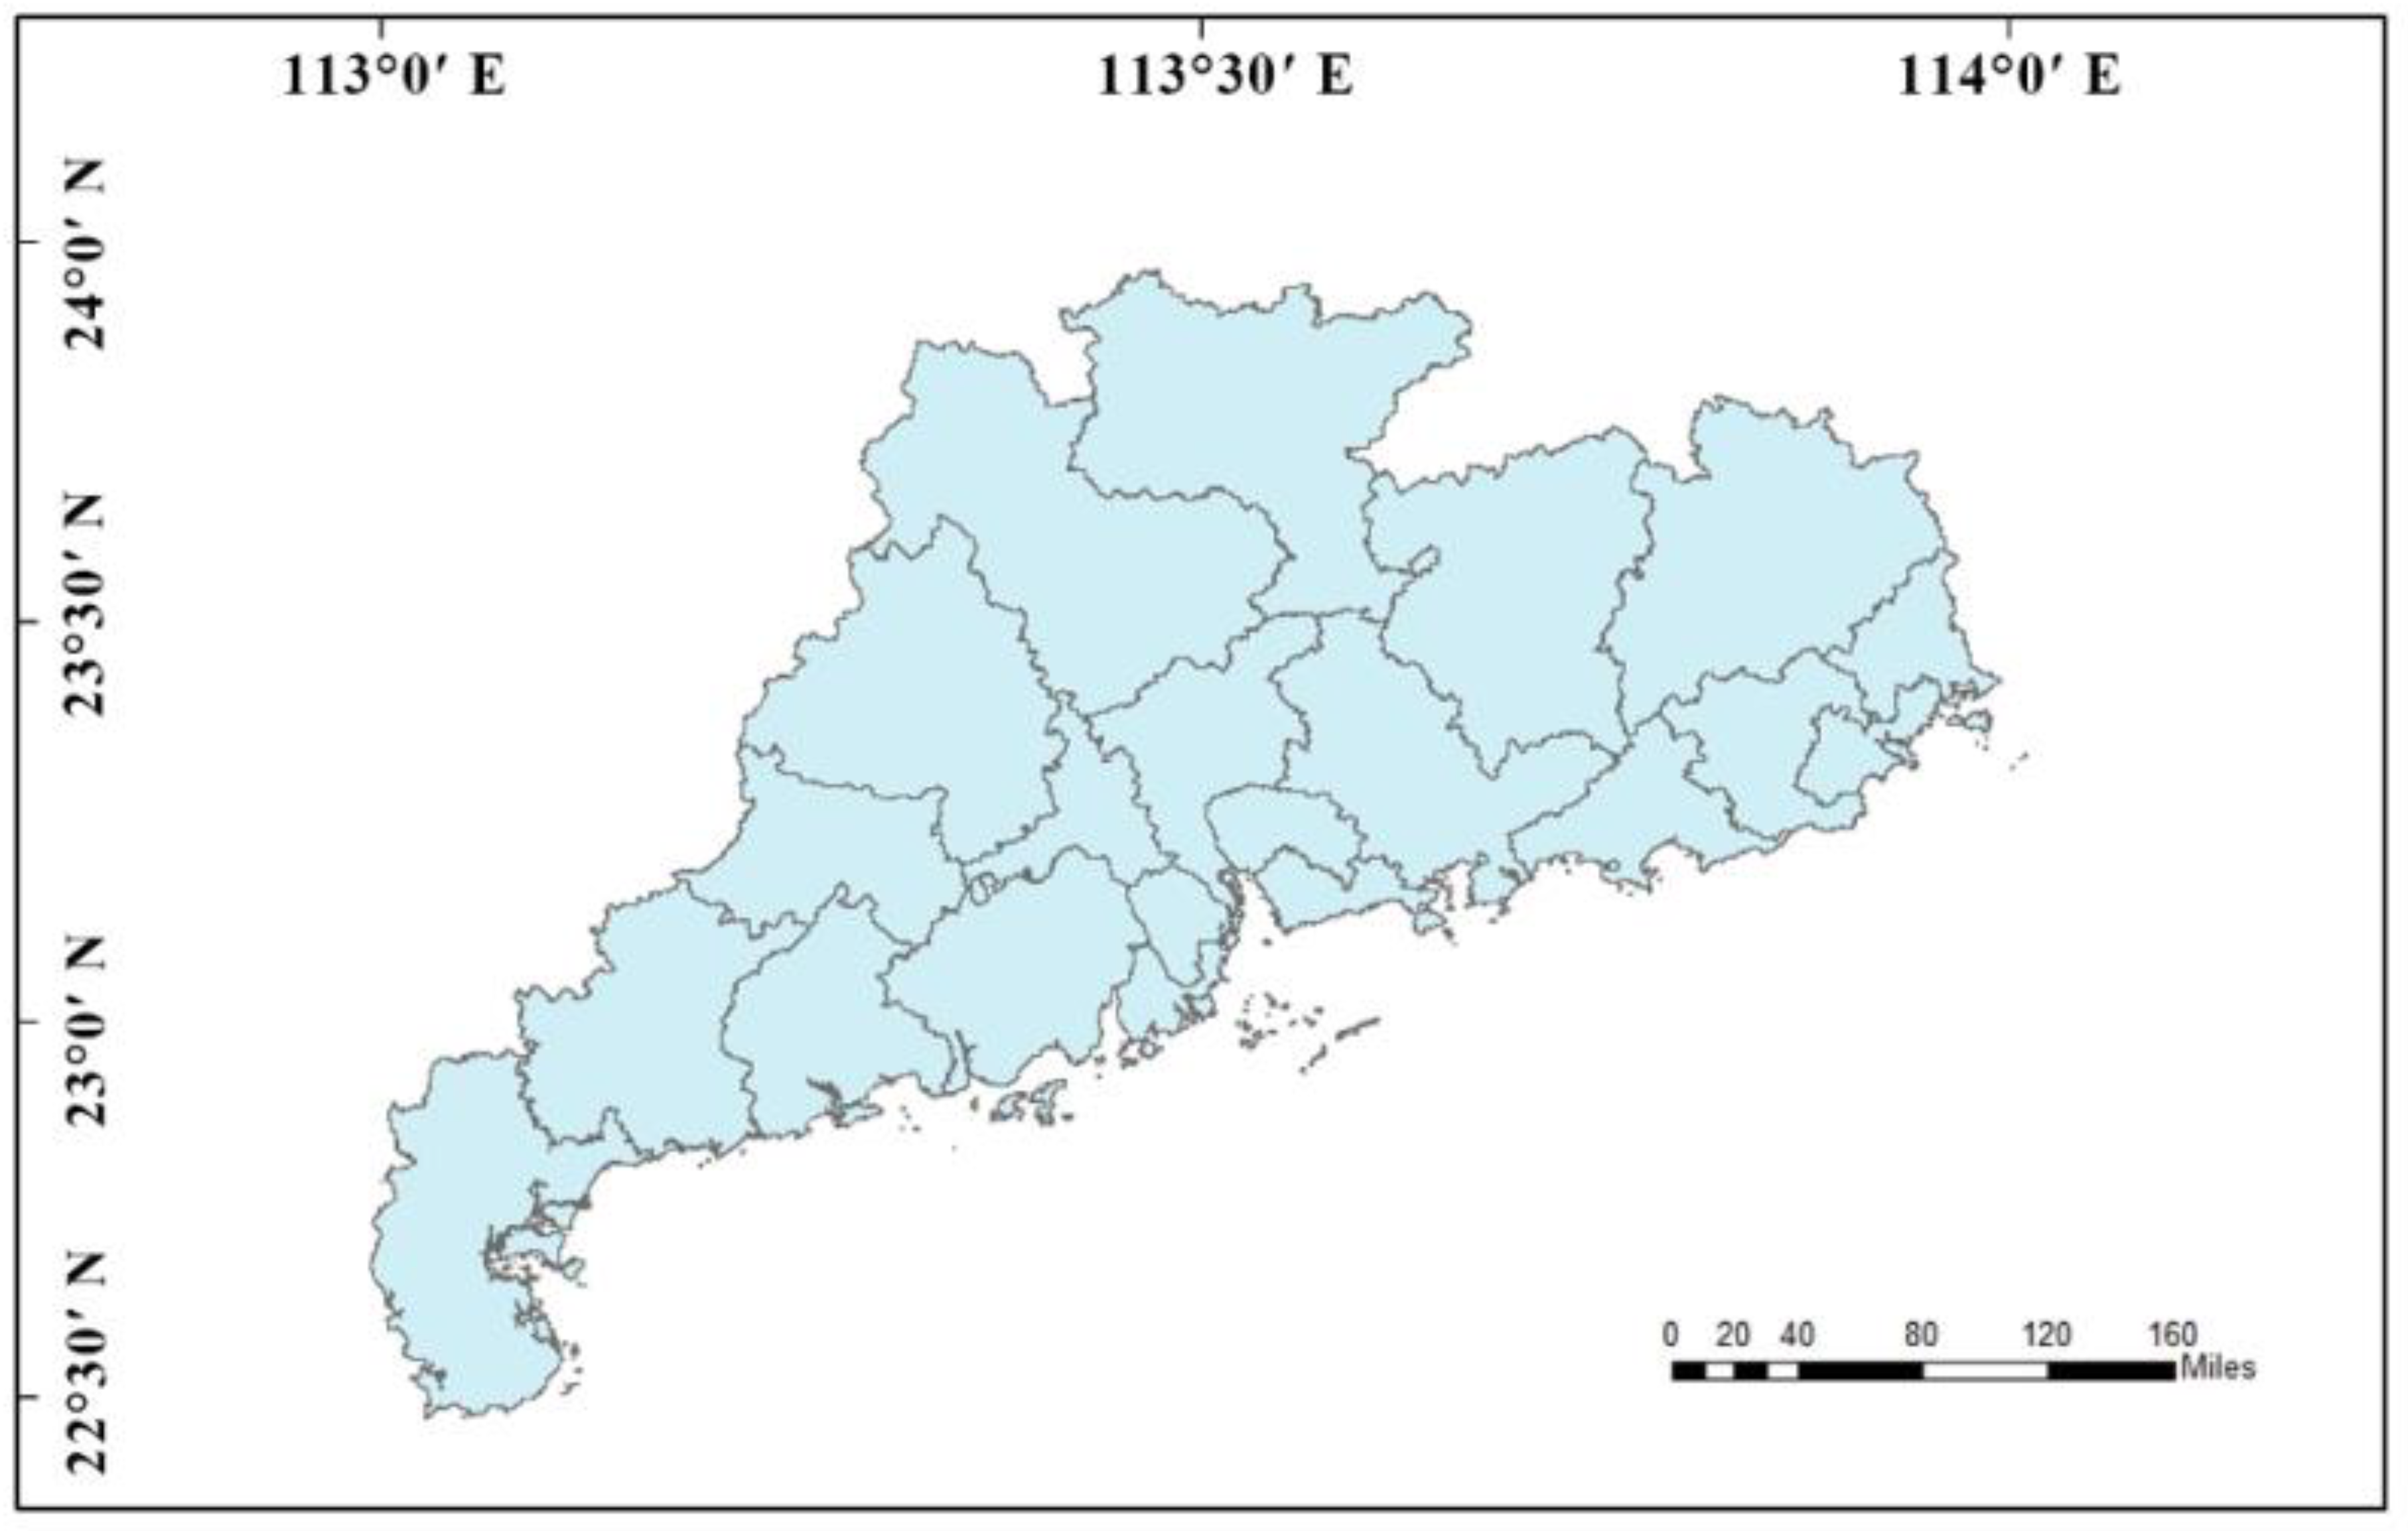
2.1. Study Area

Guangdong is a provincial administrative region of the People’s Republic of China, located in South China, bordering Hong Kong and Macao, with a total land area of about 17,977 km2, a permanent population of about 115.21 million and 21 prefecture level cities, as shown in Figure 1. Considering the consistency and availability of data, this paper defines 19 administrative units above the prefecture level in Guangdong Province as the research object. Guangdong Province has one of the highest degrees of openness and the strongest economic vitality in China. Since 1989, Guangdong’s GDP has ranked first in China. Guangdong thus became China’s largest economic province, accounting for 1/8 of the country’s total economic output and reached a level equivalent to that of middle- and upper-income countries and middle-developed countries. The comprehensive competitiveness of the Guangdong provincial economy ranks first in China. Nine cities in the Pearl River Delta will connect with Hong Kong and Macao to comprise the Guangdong–Hong Kong–Macao Greater Bay Area, which will become one of the four major bay areas in the world, together with the New York, San Francisco and Tokyo bay areas. In 2019, Guangdong achieved a GDP of 10,767.107 billion yuan with an increase of 6.2% over the previous year. However, there are significant differences in the development inside Guangdong. In general, the development level of the Pearl River Delta is relatively high, while the development level of eastern, western and northern Guangdong is relatively low. These three regions have relatively low levels of urbanization. Thus, it can be seen that the development of urban and rural areas in Guangdong is quite different. Rural development cannot be ignored because it is fundamental to the issues of agriculture, farmers and rural areas. Rural development also plays an important role in alleviating poverty. Because Guangdong Province has experienced an early and high degree of development, it is of great practical significance to study the province’s urban and rural coordination development.

2.2. Index System of Evaluation of URCD

At present, the academic community has not yet formed a consensus on an index system for the evaluation of urban and rural coordination development (hereafter referred to as URCD). Different scholars have their own views on the construction of such a system and the selection of indicators. Liu et al. made a series of studies and achieved some success in the selection of indicators [53]. In addition, Wang et al., Zeng and Wu and other scholars also made contributions to the construction of an indicator system [54,55]. In evaluating the degree of urban and rural coordination development, two main points need to be quantified—the coordination degree and the degree of development. Therefore, considering the availability, measurability and generality of indicators, based on the dimensions of coordination degree and development degree, this study used a corresponding index system based on the indicators of the growth rate of urban and rural GDP; the difference between urban and rural per capita GDP; the wages of urban and rural workers; the investment in urban and rural fixed assets; and the ratio of total retail sales of urban and rural consumer goods. Then, we classified the proportion of secondary and tertiary industries in GDP, education development, medical development, income level and per capita GDP as indicators of the urban and rural development degree. As a result, a comprehensive evaluation system was formed, as shown in Table 1.
The establishment of the indicator system was mainly divided into two parts, X1–X5 and X6–X10. Of these, X1–X5 mainly measures the differences between urban and rural areas in a region through indicators, so the indicators were compared by dividing rural indicators by urban indicators. To measure the urban and rural coordination development, however, we needed to measure not only the level of coordination degree but also the development degree. Therefore, X6–X10 were calculated by the sum index value of rural and urban measures.

2.3. Data Source

In this study, 19 cities in Guangdong Province in 2000, 2005, 2010 and 2015 were selected as research samples. Shenzhen was not selected because it is a city with a urbanization rate of 100% and there are no relevant indicators of rural areas, so we were unable to select X1–X5. Foshan was also not selected; due to various factors, the statistical yearbook of Foshan lacks relevant data and is incomplete, so could not be supplemented by the interpolation method of similar years. The reasons for choosing four yearly data points are as follows—First, these four time nodes are consistent with the closing year of the national economic development plan implemented every five years in China and thus can be used to compare the changes of urban and rural development before and after the implementation of the five-year plan. Second, choosing equal five-year intervals as the divisions of the whole research sequence was conducive to the subsequent objective. Finally, 2010 is also the year when the Chinese government issued the regional planning for the Pearl River Delta (2010–2015) and is the key node for the implementation of regional coordinated development in the Pearl River Delta. Therefore, these four years can be regarded as appropriate for the study of the urban and rural coordination development in the Pearl River Delta. In addition, in order to ensure the comparability between the data, all of the original economic data in the study period were calculated based on the comparable price in 2000.
All of the original data used in this research were taken from the China Statistical Yearbook, China Rural Statistical Yearbook, China Urban Statistical Yearbook, statistical yearbooks of each city, Guangdong statistical yearbook, statistical reports issued by the National Bureau of Statistics and the China economic and social statistical database from 2000 to 2016. Due to the lack of some index data in some research areas, necessary linear fitting or averaging of adjacent years was carried out.

2.4. Evaluation Method

2.4.1. Principal Component Analysis (PCA)

Principal Component Analysis is an important objective evaluation method. Its essence is to synthesize multiple variables describing a system and simplify them into a smaller number of comprehensive indicators (potential variables) through reasonable linear transformation and information selection. The aim is to ensure the minimum loss of data and information to reveal the main factors affecting the system and, at the same time, to reduce the high dimensional variable space [56].

2.4.2. Exploratory Spatial Data Analysis Model (ESDA)

Exploratory Spatial Data Analysis (ESDA) is a kind of spatial statistical analysis method that can help to analyze the spatial effect of a phenomenon. It can be used to analyze spatial autocorrelation to study spatial dependence and heterogeneity. This method comprises a collection of various spatial data analysis techniques, which can be used to explore the spatial distribution characteristics of data, reveal the spatial mechanism of action between observation units and express it through visualization [57]. Spatial autocorrelation is an index method to measure the strength of the relationship between neighboring elements. This method deals with the covariant relationship between variables in adjacent observation units, that is, the similarity between comparative observation values and the similarity between observation spatial locations [58]. Spatial autocorrelation can be divided into two types—global spatial autocorrelation (such as Moran’s I index, Geary’s C index, etc.) and local spatial autocorrelation (such as Getis-Ord Gi*, Moran scatter, etc.).
In this study, Moran’s I test was used as an index to measure the level of spatial interdependence among variables and to explore the spatial autocorrelation and spatial differentiation of urban and rural coordination in Guangdong Province. The calculation formula is as follows:
I = n i j w i , j i j w i , j ( x i x ¯ ) ( x j x ¯ ) i ( x i x ¯ ) 2 ,
where w is the spatial weight matrix expressing the proximity between regions and x is the URCD value.

3. Space-time Analysis

3.1. Calculation of Urban and Rural Coordination Development Value

To effectively evaluate the actual level of urban and rural development, based on the specific data of 19 cities in Guangdong Province, PCA was implemented using SPSS. First, we preprocessed the original data, that is, the forward and standardized data (in which the reciprocal method was used for the forward and the Z-fraction method was used for the standardization). Second, the model was calculated by the comprehensive principal component evaluation value and extraction of the specific expression of the m principal components Fi via PCA. Finally, the comprehensive level of urban and rural coordination development of 19 cities in each year was calculated according to the model.
There are numerous criteria for principal component extraction. This study extracted principal components of variance decomposition according to the principle of eigenvalues greater than 1. In 2000, we extracted four principal components and the cumulative variance contribution rate was 73%, which passed the test of the above criteria. Principal component extraction in 2005, 2010 and 2015 also passed the above criteria. These results show that the extracted principal component contains most of the information of the 10 original index variables, thus demonstrating that PCA is suitable for evaluating the comprehensive level of urban and rural coordination development of 19 cities in Guangdong Province. To summarize, the standardized values of each city’s indicators in each year were substituted into the evaluation value calculation model based on the PCA, as shown in Table 2 and the comprehensive level value and ranking of urban and rural coordination development of 19 cities in Guangdong Province in 2000, 2005, 2010 and 2015 were calculated.
In the measurement of the level of urban and rural coordination development, the greater the value of the coordination degree (i.e., the score of the comprehensive principal components), the higher the degree of urban and rural coordination development. In contrast, the smaller the value, the lower the degree of coordination development. A negative coordination degree shows that the level of urban and rural coordination development is lower than the average level in the region over the study period.
From Table 2, we can obtain the following conclusion. From the perspective of the city with the highest score, Guangzhou ranked first in four periods; Zhuhai ranked second in 2000 and was surpassed by Dongguan in 2005 and 2010 but retained second place in 2015. Dongguan and Zhuhai were consistently in second or third place, while Huizhou and Zhongshan were consistently in fourth or fifth place. From the perspective of the city with the lowest score, Heyuan ranked lowest in three time periods but its specific value increased, indicating that its urban and rural coordination development level increased. Yunfu’s ranking fell during the study period, until 2015, which means its urban and rural coordination development level declined. Zhanjiang ranked last in 2000 but in the latter three time periods, it increased rapidly and its ranking rose. Although the score of the urban and rural coordination development level in Heyuan and other cities ranked last increased, as previously mentioned, the score gap between Heyuan and Guangzhou was not reduced. The cities with the highest score and the lowest score had differences of 3.991, 3.944, 4.505 and 4.053, respectively, in the four periods. The trend was not reduced. According to the scores of individual cities, the unbalanced development intensified, which means the variables X1–X5 calculated in Table 1 decreased, showing that the differences in development levels between urban and rural areas were more obvious. Such unbalanced development may bring about social problems, such as widening the gap between the rich and the poor and unbalanced regional development and result in conflicts between the government and farmers. The coordination development gap between the cities with the highest score and the cities with the lowest score was relatively small in 2005 but widened further in 2010 before narrowing again in 2015, which shows that the urban and rural coordination development was repeated in these years. In terms of overall scores, the average scores of cities in Guangdong Province in the four years were −0.326, 0.093, 0.112 and 0.637, respectively, demonstrating a significant upward trend. From the horizontal comparison of the scores of each city, most cities’ scores had an obvious upward trend. Among these, although the overall score trends of Shantou, Meizhou and Maoming were rising, the volatility was large. The scores of Jiangmen and Yunfu decreased.

3.2. The Spatial Pattern of URCD

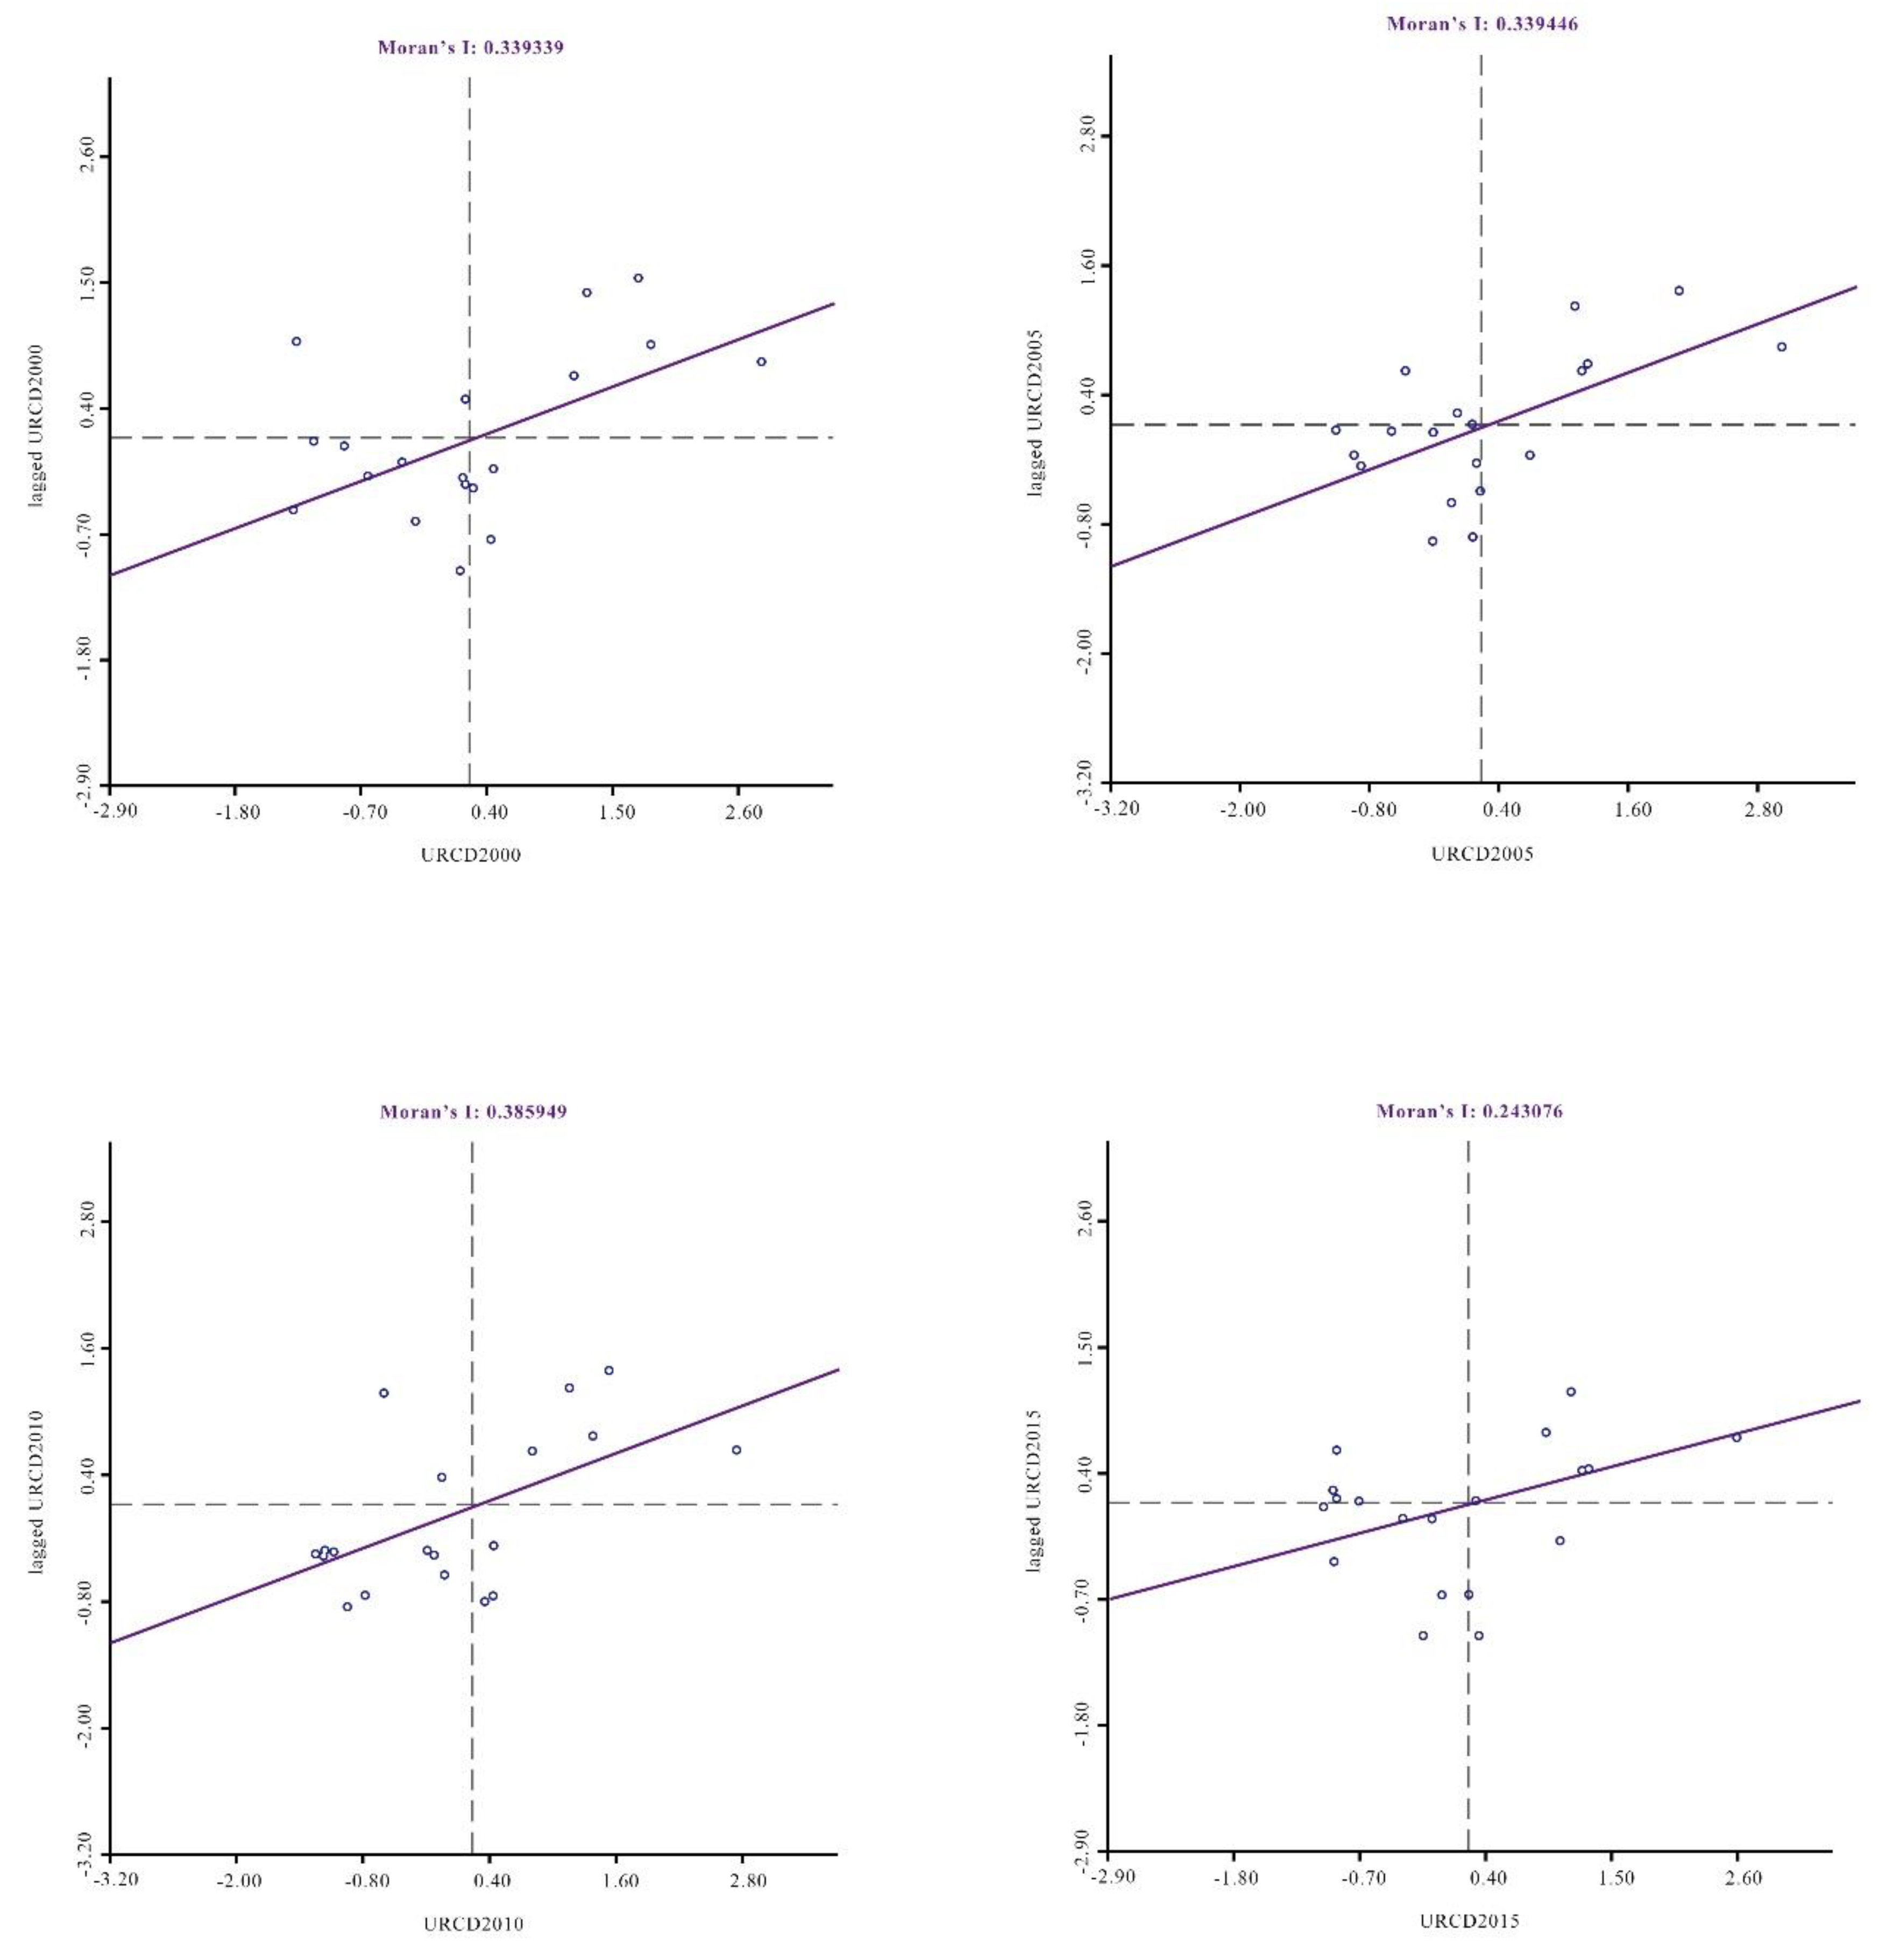
3.2.1. Spatial Autocorrelation Analysis of URCD

The global spatial autocorrelation coefficient—Moran’s I—of urban and rural coordination in Guangdong Province in 2000, 2005, 2010 and 2015 was calculated using the software Geoda and its significance test was carried out at the level of 0.05. The results were 0.339339, 0.339446, 0.385949 and 0.243076, respectively. During the whole research period, all derived Moran’s I values were positive, which shows that the urban and rural coordination among all cities reflects the trend of agglomeration distribution. The high-level areas are adjacent to other high-level areas and the low-level areas are adjacent to other low-level areas. Compared with 2000, Moran’s I increased slightly in 2005, which indicates that the overall spatial difference between urban and rural areas in Guangdong Province experienced a trend of narrowing during 2000–2005. Moran’s I in 2010 was 0.385949, which represented a rapid increase compared with Moran’s I in 2000 and 2005. This indicates that the overall spatial difference between urban and rural areas in Guangdong Province decreased significantly during 2005–2010. However, in 2015, the Moran’s I value was 0.243076, which indicated that the spatial positive correlation of cities’ urban and rural coordination development in this period decreased; that is, in 2010–2015 the spatial difference between cities intensified and the overall spatial difference between urban and rural coordination in Guangdong tended to expand. The magnitude of the change in the Moran’s I index was 0.000107 from 2000 to 2005, which is very small and can be ignored. The magnitude of the change of the Moran’s I index from 2005 to 2010 was 0.046503, which indicates that the spatial positive correlation of cities’ urban and rural coordination development increased from 2005 to 2010 and was further concentrated in geographical space. However, this situation changed from 2010 to 2015, with the index falling to 0.243076 (i.e., a change of −0.142873). This was the lowest level in the four-year Moran’s I index, which tended to be less stable overall but maintained a positive correlation.
As the Global Moran’s I is a general average statistical index, it can only reflect the degree of spatial agglomeration of attributes and cannot determine the specific agglomeration area. Generally, the change of the overall spatial difference is not the same as that of the local spatial difference. The Moran’s I index alone is not enough to fully reflect the internal characteristics of the spatial difference of the research unit. Therefore, we drew Moran scatter maps of 19 cities in Guangdong Province in 2000, 2005, 2010 and 2015, as shown in Figure 2.
In the scatter diagram, the horizontal axis represents the comprehensive level value of urban and rural coordination development and the vertical axis represents the spatial lag value. The upper left represents the LH area, which means a lower level of a city’s own and a higher level of its surrounding areas, a higher degree of spatial difference between them and stronger spatial negative correlation, that is, prominent heterogeneity. The upper right is the HH area, which means a higher welfare level of a city’s own and surrounding areas, a smaller degree of spatial difference between them and stronger spatial positive correlation, that is, the hot spot area. The lower left is the LL area, which means a lower welfare level of a city’s own and surrounding areas, a smaller degree of spatial difference between them and stronger spatial positive correlation, that is, the blind spot area. The lower right is the HL area, which means a higher level of a city’s own and a lower level of its surrounding areas, a higher degree of spatial difference between them and a stronger spatial negative correlation, that is, the prominent heterogeneity.
Take 2005 as an example. Five cities are located in the first quadrant (HH), namely, Guangzhou, Zhuhai, Foshan, Dongguan and Zhongshan. These cities and their surrounding areas have a high urban and rural coordination level and strong economic and social ties between urban and rural areas and belong to the high–high agglomeration spatial connection type. There are 10 cities in the third quadrant (LL), namely, Shanwei, Chaozhou, Zhaoqing, Yunfu, Maoming, Zhanjiang, Yangjiang, Heyuan, Meizhou and Jieyang. These areas are underdeveloped areas in the province with weak urban–rural economic and social ties between themselves and adjacent areas and lower urban and rural coordination levels. Moreover, the level in the surrounding cities is also relatively low and these cities belong to the low–low agglomeration spatial connection type. The other cities are located in quadrants II and IV, which show negative spatial correlations. Cities located in quadrant II (Shaoguan, Qingyuan, Jiangmen and Huizhou) have a low urban and rural coordination degree, weaker urban–rural economic and social ties than adjacent areas and a lower urban and rural coordination level and thus belong to the low–high agglomeration spatial connection type. Located in quadrant IV (HL), Shantou’s urban and rural coordination level is obviously higher than that of the surrounding areas, which belong to the high–low agglomeration spatial connection type. It was also found from the visualization of natural breakpoint method that Shantou was red.
From the overall analysis of the four figures, the proportions of HH and LL type cities were more than 60% in the four research periods, among which the proportion of LL type cities was the highest, reaching more than 50% in the first three periods. This shows obvious club convergence. The fact that most cities fell into the quadrants of HH and LL shows that the regional differences of urban and rural coordination in Guangdong Province have an obvious dual spatial structure. The hot spots of urban and rural coordination development have always been in the Pearl River Delta, while the blind spots are mainly distributed in the eastern and western regions of Guangdong Province, which is consistent with the real regional differences in economic development in Guangdong Province. The urban and rural coordination development (at the municipal level) of Guangdong Province has a trend of polarization and is characterized by urban agglomeration with low urban and rural coordination level. From the perspective of the quantitative transformation relationship, the number of HH type cities was unchanged at five. The number of LL type cities was generally unchanged in the first three periods but decreased in 2015. As shown in the scatter diagram, the transformation from LL to LH took place.

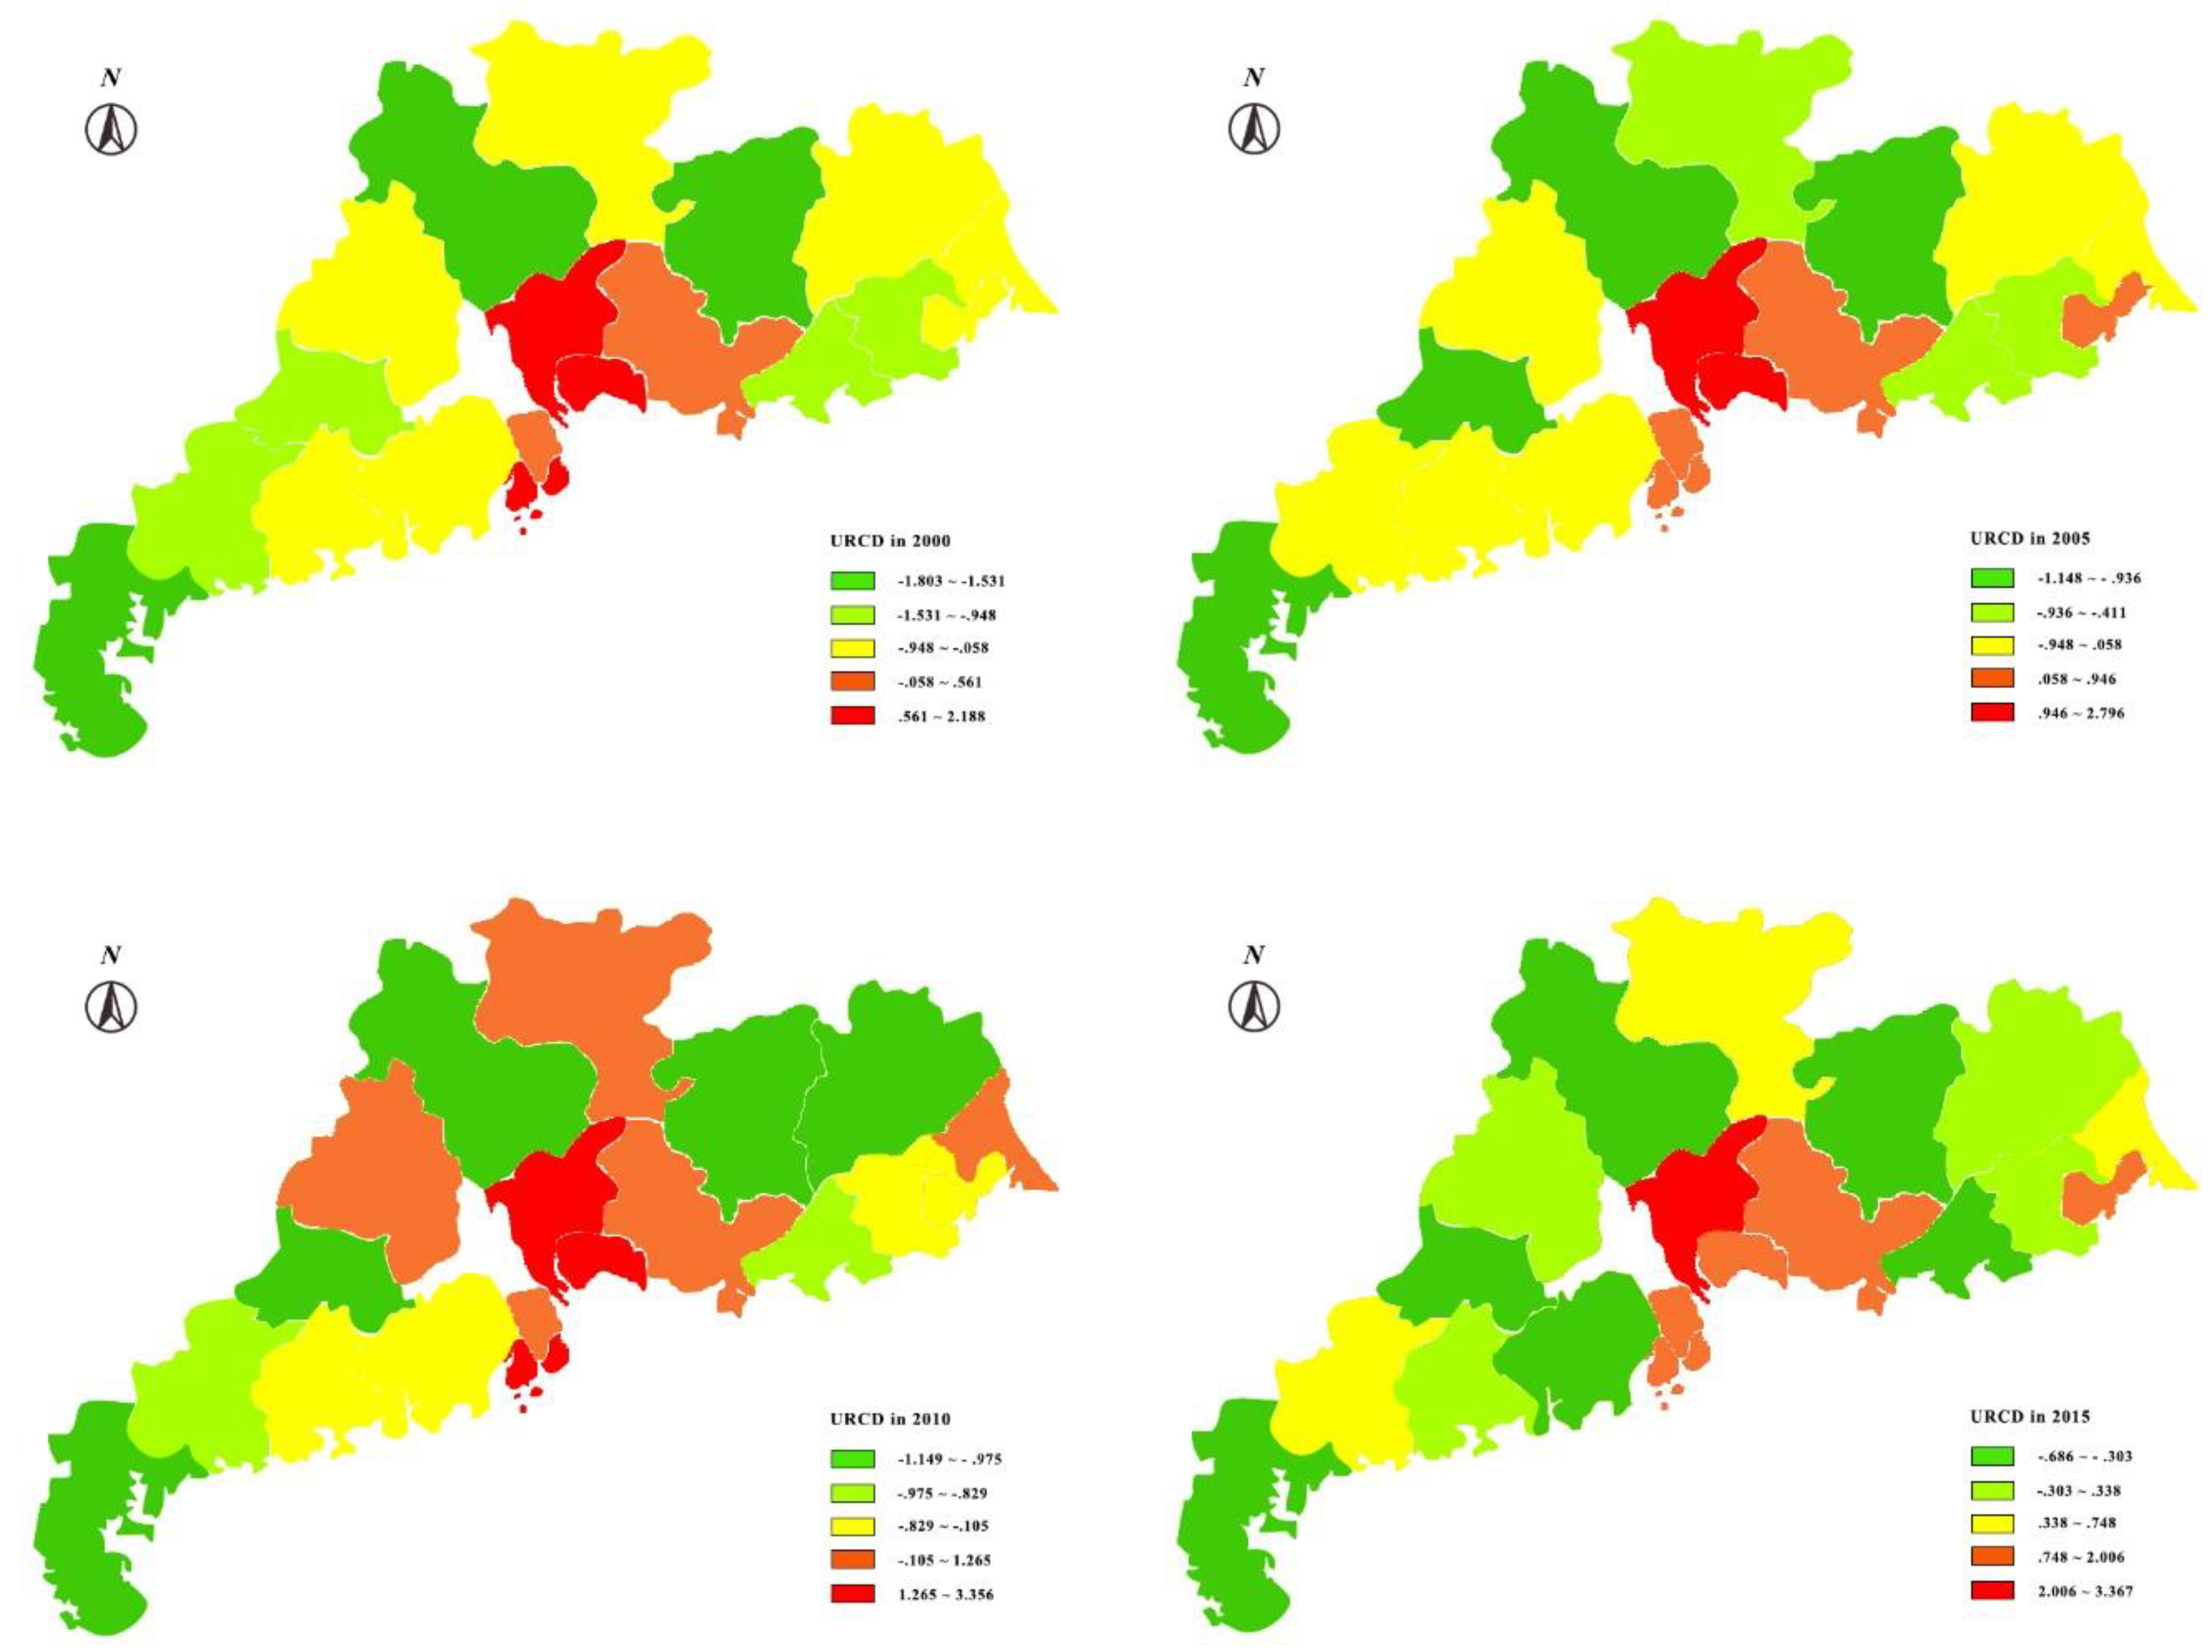
3.2.2. Spatial Pattern Evolution of URCD

Based on an Arcgis spatial analysis model, the URCD of 19 cities in Guangdong Province in 2000, 2005, 2010 and 2015 was divided into five levels—highest, higher, medium, lower and lowest. These five levels were derived using natural breaks classification (NBC), which is a statistical method of grading and classifying according to the distribution of numerical statistics and is widely used in Arcgis when differences are maximized among classes. The corresponding spatial distribution diagrams are shown in Figure 3. The color sequence of “dark red, brown red, yellow, light green and dark green” corresponds to the five levels from high to low.
The coordination development level gradually decreased from the center to the outside. The east bank of the Pearl River estuary, with Guangzhou, Dongguan and Shenzhen as the core, is the best area of urban and rural coordination development. The coordination level in the eastern and western areas and the north of Guangdong Province is relatively poor and shows the spatial pattern of “north > east > west,” which is largely consistent with the distribution of the city system in Guangdong Province. The formation of this spatial pattern is mainly determined by location, economic, social and urban and rural circulation factors. As is known, Guangzhou, Dongguan and Shenzhen are located on the east bank of the Pearl River estuary. Due to the location advantages of their proximity to Hong Kong, they have formed a strong “Guangzhou–Shenzhen–Hong Kong Corridor” that drives the development of the region. The economy in the region is developed and the central city has a strong radiation driving effect. In addition, these areas have perfect transportation and communication infrastructure conditions and more convenient and more frequent circulation of people, capital, information and goods between urban and rural areas. The interaction between urban and rural elements is strong and refers to the movement of production elements between urban and rural areas, such as the movement of labor, capital and land ownership. This has played a significant role in promoting urban and rural coordination development in this region. Foshan, Zhongshan, Zhuhai and other areas on the west bank of the Pearl River estuary are slightly lower than those on the east bank due to the lack of a strong economic core in the south. Compared with the above-mentioned core areas, there is a large gap in other areas within the province, regardless of location conditions, economic and social development level or infrastructure conditions. It should be noted that due to the outward radiation from the east bank of the Pearl River Delta and the driving role of the Shantou Special Economic Zone as an economic growth pole in the east of Guangdong, the urban and rural coordination development level in the east of Guangdong is better than that in the west. Ecologically sensitive areas such as Heyuan and Yunfu (Dongjiang Water Source Protection Area and Xijiang River Basin Area) and ecologically vulnerable areas with serious soil erosion in Meizhou (ecological vulnerable areas in the upper reaches of the Hanjiang River), are green ecological barriers and resource guarantee bases in Guangdong Province. Their environmental capacity is highly limited, which results in the lagging development in these rural areas. One of the major reasons for the low level of urban and rural coordination is the restriction of natural ecological environment factors. This refers to the environment factors that have a negative influence on the economic development. For example, it is forbidden to establish factories and develop aquaculture in the Dongjiang Water Source Protection Area to protect the drinking water source for Heyuan, Huizhou, Guangzhou and so forth. Such natural resource conditions restrict the development of the social economy and the accumulation of capital in these areas [59,60]. These areas lack economic strength to take measures to promote urban and rural coordination development. On the whole, the urban and rural coordination development presents an obvious dual spatial structure, which means it gradually decreases from the core area of the Pearl River Delta to the outer areas. Guangzhou, Dongguan, Zhuhai and Shenzhen, which are located on the east bank of the Pearl River estuary, are in the first tier. Due to their location advantages, more developed economies and better infrastructure, they represent the best area of urban and rural coordination development. Foshan and Zhongshan, which are located on the west bank of the Pearl River estuary, are in the second tier. Due to the lack of a strong economic core such as Hong Kong, the level of urban and rural coordination development is slightly lower than that of the east bank cities. The east wing, west wing and the mountainous areas of northern Guangdong are in the third and fourth tiers. Compared with the Pearl River Delta, there is a large gap in terms of location conditions, economic development level and infrastructure and the urban and rural coordination development is poor. This spatial distribution pattern of urban and rural coordination is largely consistent with the law of regional economic differences in Guangdong Province, which shows the differences in the economic development levels within the province. This means that the level of economic development has a greater impact on the urban and rural coordination development. Thus, the economic development level can be an important factor in subsequent research. The Pearl River Delta has better economic conditions to promote urban and rural coordination development than the north, east and west wings of Guangdong.

4. Driving Forces

4.1. PCA Analysis of Dynamic Mechanism

Table 3 was obtained from the weighted scores of the main component loads and contribution degree. Since X2–X5 are the indicators of urban and rural coordination, that is, the ratio of rural to urban, the indicators of urban and rural were added. After the data was processed, it was transformed into the indicator of the dynamic mechanism. The processing was carried out as follows—the dynamic mechanism represented by X2 is GDP growth; X3 is employment and on-the-job wage; X4 is fixed asset investment; and X5 is the consumption level. Since X2 and X10 are duplicates, X2 was deleted.
In 2000, GDP growth, employment, total retail sales of consumer goods and fixed asset investment were the most important driving factors and were significantly higher than other driving factors. In 2005, the most important driving forces were education, income per capita, employment and GDP per capita In 2010, the most important driving forces were similar to those in 2005, followed by education, per capita income, employment and GDP growth. In 2015, the main driving forces were fixed asset investment, total retail consumption and education. Overall, the indicators related to education, employment and the economy were consistently the main driving forces.
The vertical comparison shows that the effect of the industrial structure, as a driving mechanism, improved in each time period. The growth rate of health care, GDP and employment as a driving mechanism steadily become less important. The importance of fixed asset investment and total retail sales of urban and rural consumer goods was positively correlated in 2000 and 2015 but negatively correlated in 2005 and 2010. In contrast were education and GDP per capita—these had positive correlation in 2005 and 2010 and a negative correlation in 2000 and 2015.

4.2. ESDA’s Analysis of Dynamic Mechanism

4.2.1. Location Factors

It can be seen from Figure 2 that almost all of the areas with high levels of urban and rural coordination are located in the Pearl River Delta area with good location conditions. However, those with relatively backward urban and rural coordination development are located in the west, east and north of Guangdong areas with poor location conditions and particularly in the areas with fragile ecological environments, such as Heyuan, Yunfu and Meizhou. This reflects the poor anti-interference ability of the ecological environment in these areas, which can be easily damaged but are difficult to recover. The Pearl River Delta area is adjacent to Hong Kong and Macao, so its economy is greatly driven by these two cities. In addition, it is located in the Pearl River Estuary with convenient maritime transportation, which also provides a high level of urban and rural coordination development. The western, eastern and northern regions of Guangdong are distant from Hong Kong and Macao, meaning that these cities have a smaller impact on these regions. One of the major reasons for the low level of urban and rural coordination development in these areas is the location factor, which restricts the development of the social economy and the accumulation of capital and further restricts the improvement of the level of urban and rural coordination development.

4.2.2. Economic Development Level

There is a close relationship between the level of regional economic development and the urban and rural coordination development. The former PCA method was verified and the related conclusions were verified again in Geoda. Economic growth promotes the development of regional urbanization and economic and social coordination development, which determines the evolution of the urban and rural coordination development. According to the bivariate spatial autocorrelation analysis of urban and rural coordination degree and per capita GDP in 2000, 2005, 2010 and 2015, the estimates of Global Moran’s I were 0.3811563, 0.415313, 0.31531 and 0.356422. There was a significant positive correlation between these results. The higher the level of economic development, the easier it is to drive the optimization of the regional industrial structure (which relates to the adjustment of the industrial proportion to improve the coordination of the development of industries in the region) and enhance the absorption capacity of the rural labor force; furthermore, the stronger the interaction between urban and rural elements, the more helpful it is to narrow the gap between urban and rural areas. The Pearl River Delta is a region with a high degree of urban and rural coordination in Guangdong Province. Its total GDP in 2010 accounted for 78.96% of the total of the province. The industrial structure is mainly non-agricultural and the secondary and tertiary industries are highly developed. In 2010, the proportions of secondary and tertiary industries in Dongguan and Zhuhai reached levels of 99.6% and 97.6% respectively. The proportion of primary industries in the northern, eastern and western wings of Guangdong is relatively large. The interaction between urban and rural areas is weak where the traditional urban–rural relationship is the main relationship. It is also a challenge for the government to overcome such weak traditional interactions. More investment and infrastructure construction in rural areas and increased jobs for peasant workers in cities are potential solutions to this problem.

4.2.3. Urbanization Level

Geoda was also used to carry out the same steps for the level of urbanization, during which we undertook bivariate spatial autocorrelation analysis on the urban and rural coordination degree and urbanization level of each city in 2000, 2005, 2010 and 2015. The result shows that there is a significant positive correlation between them. The global Moran’s I estimates were 0.378654, 0.345334, 0.354534 and 0.35632, respectively, which means areas with a high urbanization level have a high urban and rural coordination degree and areas with a low urbanization level have relatively low urban and rural coordination. The high level of urban and rural coordination in the Pearl River Delta is realized by the constant city-on-countryside encroachment. For example, Shenzhen is a fully urbanized area, while the mountainous area in the north of Guangdong and the east and west wings are the ecological development and main agricultural product supply areas in Guangdong Province. So it is impossible to promote its urban and rural coordination development in accordance with the Pearl River Delta model. Urban and rural coordination development in these mountainous areas must be promoted at the provincial level.

5. Conclusions and Discussion

Based on the development and evolution of the relationship between urban and rural areas in Guangdong Province, this study explored the level and dynamic mechanism of urban and rural coordination development. In the evaluation of the urban and rural coordination development level and the dynamic mechanism, due to the fact that the urbanization rate of Shenzhen is 100% and the lack of data in Foshan, 19 cities in Guangdong Province were taken as the research object. This study constructed an evaluation index system, including the measurement of urban and rural coordination and the measurement of urban and rural development, which could effectively cover all aspects of urban and rural coordination.
According to the Principal Component Analysis (PCA), the URCD level of the 19 cities during four periods can be determined. In 2005, the coordination development gap between the highest scoring cities and the lowest scoring cities was small. In 2010, the gap widened but narrowed in 2015. This indicates that the urban and rural coordination development in Guangdong Province repeated. In terms of overall scores, the average scores of 19 cities in Guangdong Province in 2000, 2005, 2010 and 2015 were −0.326, 0.093, 0.112 and 0.637, respectively, indicating a significant upward trend.
Through the Exploratory Spatial Data Analysis (ESDA), it is concluded that in terms of the global spatial autocorrelation, there is a strong positive spatial autocorrelation in the level of urban and rural coordination development of each city in Guangdong Province; that is, cities with similar urban and rural coordination development levels tend to show spatial aggregation. From 2000 to 2005, the overall spatial difference of urban and rural coordination development levels in Guangdong Province tended to narrow. From 2005 to 2010, it narrowed more clearly. From 2010 to 2015, however, it tended to widen. In terms of spatial autocorrelation, Guangzhou, Zhuhai, Foshan, Dongguan and Zhongshan were classified to the HH type and the number of cities with this classification was constant. The number of LL type cities remained unchanged in the first three periods but decreased in 2015. Shantou was consistently a LH type city and Huizhou changed gradually to a LH type city. Visualization shows that the east bank of the Pearl River estuary, with Guangzhou, Dongguan and Shenzhen as the core, is the best area for the urban and rural coordination development and the level of urban and rural coordination development in the east and west wings and the north of Guangdong is relatively low. The level in these three areas also shows the spatial pattern of “north > east > west.”
Using PCA and ESDA to study the driving mechanism of urban and rural coordination development, it is concluded that location, economic development and urbanization level are the most important driving forces. These are followed by industrial structure, which played an important role in every period. The importance of health care, growth rate of GDP and employment as driving mechanisms gradually decreased. The importance of fixed asset investment and total retail sales of urban and rural consumer goods in 2000 and 2015 showed a positive correlation, while showing a negative correlation in 2005 and 2010. Education and GDP per capita showed the opposite—there was a positive correlation in 2005 and 2010 and a negative correlation in 2000and 2015.
Based on the study of dynamic mechanisms, in order to improve the coordination development level of urban and rural areas in Guangdong Province, this paper proposes the following two suggestions. First, non-western Guangdong should further optimize its industrial structure. High-level cities drive the development of surrounding low-level cities. Advantages of the LH cities should be fully used. This means cities with good self-development and general surrounding development, such as Shantou and Huizhou, exert their influence on their surrounding areas and drive the development of western Guangdong. Cities in the Pearl River Delta should further optimize the industrial structure according to the conclusion of the dynamic mechanism. Second, western Guangdong and other regions should promote population urbanization in rural areas. At present, most of the rural poor in Guangdong Province live in areas with poor ecological environments. Local development has fallen into a vicious circle of development of “Fragile environment—Poverty— Plunder resources—Environmental degradation—Further poverty.” A common situation in early years existed in which areas with fragile environments had a lower development level and lower urban and rural development levels, than those of most other provinces. The government cared more about the GDP growth rate and less about environment protection in these early years. However, this development was based on the use of resources, which caused further damage to the environment. Due to their low environmental recovery ability, these areas returned to poverty after a very short period of development. In such areas, effective policies should be formulated to guide population transfer, promote the employment and settlement of rural population in urban areas, provide free employment training for peasant workers to enhance employment opportunities and optimize the rural industrial structure. This would change the traditional model in which development is solely driven by industry to one of agricultural industrialization. For example, most of the small and medium-sized enterprises in the Pearl River Delta are located in villages, towns or rural areas. Furthermore, most of these enterprises are engaged in foreign trade processing, which causes great damage to the environment. Guangdong’s urban and rural coordination development is hoped to evolve from a high-speed mode to a high-quality mode. However, the pattern of “treatment after pollution” cannot meet the requirements of the high-quality mode. This transformation needs support at the policy level, since market participants may only care about maximizing their own interests rather than the maximization of social interests. Thus, the government should issue a series of preferential policies to encourage the acceleration of the transformation and upgrade, promote the development of service industry and reasonably adjust the proportion of primary, secondary and tertiary industries. Overall, this will prevent environmental damage from the source as an alternative to “treatment after pollution.”
The main limitation of this study is that the methods proposed measure the URCD level at the city level rather than a higher regional level. Furthermore, issues such as the coordination of the development of Pearl River Delta (PRD) areas and non-PRD areas require further study. Additionally, the mode of “Fragile environment—Poverty—Plunder resources—Environmental degradation—Further poverty” would also be a topic of future interest.

Author Contributions

Conceptualization, D.T.; supervision, D.T.; visualization, B.L. and L.Z.; writing—original draft, B.L. and Y.Q.; writing—review and editing, B.L. and L.Z. All authors have read and agreed to the published version of the manuscript.

Funding

This work was supported by the National Social Science Foundation of China (19BGL274) and the National Natural Science Foundation of China (71473179).

Conflicts of Interest

The authors declare no conflict of interest.

References

  1. Liu, Y.; Cai, E.; Jing, Y.; Gong, J.; Wang, Z. Analyzing the decoupling between rural-to-urban migrants and urban land expansion in Hubei Province, China. Sustainability 2018, 10, 345. [Google Scholar] [CrossRef] [Green Version]
  2. Deng, X.; Gong, L.; Gao, Y.; Cui, X.; Xu, K. Internal differentiation within the rural migrant population from the sustainable urban development perspective: Evidence from China. Sustainability 2018, 10, 4839. [Google Scholar] [CrossRef] [Green Version]
  3. Ma, L.; Long, H.; Zhang, Y.; Tu, S.; Ge, D.; Tu, X. Agricultural labor changes and agricultural economic development in China and their implications for rural vitalization. J. Geogr. Sci. 2019, 29, 163–179. [Google Scholar] [CrossRef] [Green Version]
  4. Zhang, W.; Fang, C.; Zhou, L.; Zhu, J. Measuring megaregional structure in the pearl river delta by mobile phone signaling data: A complex network approach. Cities 2020, 104, 102809. [Google Scholar] [CrossRef]
  5. Jin, X.; Hu, G.; Ding, H.; Ye, S.; Lu, Y.; Lin, J. Evolution of spatial structure patterns of city networks in the Yangtze River economic belt from the perspective of corporate pledge linkage. Growth Change 2020, 51, 833–851. [Google Scholar] [CrossRef]
  6. Gao, W. Urban circle layer discussion. Urban Plan. Forum 2002, 3, 61–65. [Google Scholar]
  7. Ortega, A.A.C. Desakota 2.0: Worlding hybrid spaces in the global urban. Urban Geogr. 2020, 1, 1–14. [Google Scholar] [CrossRef]
  8. Zheng, D.; Zhang, G.; Shan, H.; Tu, Q.; Wu, H.; Li, S. Spatio-temporal evolution of urban morphology in the Yangtze River middle reaches megalopolis, China. Sustainability 2020, 12, 1738. [Google Scholar] [CrossRef] [Green Version]
  9. Samalavičius, A. Urban Development and Rhetoric of Rationality: The fate of C. A. Doxiadis’ concepts. Town Plan. Archit. 2008, 32, 28–33. [Google Scholar] [CrossRef]
  10. Zhu, X. Research on the realization path of urban-rural integration in China: A case study of Suzhou. Ph.D. Thesis, Suzhou University, Suzhou, China, 2014. (In Chinese). [Google Scholar]
  11. Zhang, R.; Jiang, G.; Zhang, Q. Does urbanization always lead to rural hollowing? Assessing the spatio-temporal variations in this relationship at the county level in China 2000–2015. J. Clean. Prod. 2019, 220, 9–22. [Google Scholar] [CrossRef]
  12. Wang, F.; Liu, J. Research on the Integration of Central Henan Urban Agglomeration; Science Press: Beijing, China, 2007; pp. 23–35. (In Chinese) [Google Scholar]
  13. Gustafsson, B.; Li, S. Economic transformation and the gender earnings gap in urban China. J. Popul. Econ. 2000, 13, 305–329. [Google Scholar] [CrossRef]
  14. Xie, Y.; Jiang, Q. Land arrangements for rural–Urban migrant workers in China: Findings from Jiangsu Province. Land Use Policy 2016, 50, 262–267. [Google Scholar] [CrossRef]
  15. Long, H.; Zou, J.; Pykett, J.; Li, Y. Analysis of rural transformation development in China since the turn of the new millennium. Appl. Geogr. 2011, 31, 1094–1105. [Google Scholar] [CrossRef]
  16. Chen, F.; Yu, M.; Zhu, F.; Shen, C.; Zhang, S.; Yang, Y. Rethinking rural transformation caused by comprehensive land consolidation: Insight from program of whole village restructuring in Jiangsu Province, China. Sustainability 2018, 10, 2029. [Google Scholar] [CrossRef] [Green Version]
  17. Liu, J.; Liu, Y.; Yan, M. Spatial and temporal change in urban-rural land use transformation at village scale—A case study of Xuanhua District, North China. J. Rural Stud. 2016, 47, 425–434. [Google Scholar] [CrossRef]
  18. Goodman, D.S.G. China’s Regional Development, 5th ed.; Royal Institute of International Affairs: London, UK, 2008. [Google Scholar]
  19. Zhang, L.; Rozelle, S.; Huang, J. Off-farm jobs and on-farm work in periods of boom and bust in Rural China. J. Comp. Econ. 2001, 29, 505–526. [Google Scholar] [CrossRef]
  20. Tilt, B. Smallholders and the household responsibility system, adapting to institutional change in Chinese agriculture. Hum. Ecol. 2008, 36, 189–199. [Google Scholar] [CrossRef]
  21. Lin, G.; Ho, S.P. China’s land resources and land-use change: Insights from the 1996 land survey. Land Use Policy 2003, 20, 87–107. [Google Scholar] [CrossRef]
  22. Guo, L.; Di, L.; Tian, Q. Detecting spatio-temporal changes of arable land and construction land in the Beijing-Tianjin corridor during 2000–2015. J. Geogr. Sci. 2019, 29, 702–718. [Google Scholar] [CrossRef] [Green Version]
  23. Fan, S.; Chan-Kang, C. Regional road development, rural and urban poverty: Evidence from China. Trans. Policy 2008, 15, 305–314. [Google Scholar] [CrossRef]
  24. Chen, J.; Guo, F.; Wu, Y. One decade of urban housing reform in China: Urban housing price dynamics and the role of migration and urbanization. Habitat Int. 2011, 35, 1–8. [Google Scholar] [CrossRef]
  25. Wang, J.; Li, Y.; Wang, Q.; Cheong, K. Urban–rural construction land replacement for more sustainable land use and regional development in China: Policies and practices. Land 2019, 8, 171. [Google Scholar] [CrossRef] [Green Version]
  26. Zhang, L.; Luo, R.; Liu, C.; Rozelle, S. Investing in rural China: Tracking China’s commitment to modernization. Chin. Econ. 2006, 39, 57–84. [Google Scholar] [CrossRef]
  27. He, C.; Peng, L.; Liu, S.; Xu, D.; Xue, P. Factors influencing the efficiency of rural public goods investments in mountainous areas of China—Based on micro panel data from three periods. J. Rural Stud. 2016, 47, 612–621. [Google Scholar] [CrossRef]
  28. Molero-Simarro, R. Inequality in China Revisited. The effect of functional distribution of income on urban top incomes, the urban-rural gap and the gini index, 1978–2015. China Econ. Rev. 2017, 42, 101–117. [Google Scholar] [CrossRef]
  29. Li, L.; Liu, Y. Spatial-temporal patterns and driving forces of sustainable urbanization in China since 2000. J. Urban Plan. Dev. 2019, 145, 05019014. [Google Scholar] [CrossRef]
  30. Li, Y.; Dacosta, M.N. Transportation and income inequality in China: 1978–2007. Trans. Res. Part A-Policy Pract. 2013, 55, 56–71. [Google Scholar] [CrossRef]
  31. Wang, D.; Wang, J.; Li, H.; Li, L. School context and instructional capacity: A comparative study of professional learning communities in rural and urban schools in China. Int. J. Educ. Dev. 2017, 52, 1–9. [Google Scholar] [CrossRef]
  32. Huang, M.; Chen, M.; Zhang, J. The linkage plan of urbanerural construction land-use: Necessity and must of urbanization and farmland protection. Modern Urban Res. 2011, 1, 61–65. [Google Scholar] [CrossRef]
  33. Qu, L.; Liu, Y.; Chen, Z. Spatio-temporal evolution of ecologically-sustainable land Use in China’s loess plateau and detection of its influencing factors. J. Mt. Sci. 2019, 16, 120–129. [Google Scholar] [CrossRef]
  34. Li, S.; Ying, Z.; Zhang, H.; Ge, G.; Liu, Q. Comprehensive assessment of urbanization coordination: A case study of Jiangxi Province, China. Chin. Geogr. Sci. 2019, 29, 128–142. [Google Scholar] [CrossRef] [Green Version]
  35. Liu, Y.; Huang, J.; Zikhali, P. The bittersweet fruits of industrialization in rural China: The cost of environment and the benefit from off-farm employment. China Econ. Rev. 2016, 38, 1–10. [Google Scholar] [CrossRef]
  36. Yu, A.T.W.; Wu, Y.; Shen, J.; Zhang, X.; Shen, L.; Shan, L. The key causes of urban-rural conflict in China. Habitat Int. 2015, 49, 65–73. [Google Scholar] [CrossRef]
  37. Xiao, D.; Niu, H.; Fan, L.; Zhao, S.; Yan, H. Farmers’ satisfaction and its influencing factors in the policy of economic compensation for cultivated land protection: A case study in Chengdu, China. Sustainability 2019, 11, 5787. [Google Scholar] [CrossRef] [Green Version]
  38. Deng, X.; Gibson, J. Improving eco-efficiency for the sustainable agricultural production: A case study in Shandong, China. Technol. Forecast. Soc. Change 2019, 144, 394–400. [Google Scholar] [CrossRef]
  39. Wang, M.; Gong, H. Imbalanced development and economic burden for urban and rural wastewater treatment in China—Discharge limit legislation. Sustainability 2018, 10, 2597. [Google Scholar] [CrossRef] [Green Version]
  40. Chen, C.; Legates, R.; Fang, C. From coordinated to integrated urban and rural development in China’s megacity regions. J. Urban Aff. 2018, 41, 1–20. [Google Scholar] [CrossRef]
  41. Wen, F.; Wang, X. Quality development of urban-rural integration in the new era: Scientific connotation, theoretical basis and promotion path. Expand. Horiz. 2020, 3, 39–44. (In Chinese) [Google Scholar]
  42. Wang, R.; Tan, R. Rural renewal of china in the context of rural-urban integration: Governance fit and performance differences. Sustainability 2018, 10, 393. [Google Scholar] [CrossRef] [Green Version]
  43. Guo, R.; Bai, Y. Simulation of an urban-rural spatial structure on the basis of green infrastructure assessment: The case of Harbin, China. Land 2019, 8, 196. [Google Scholar] [CrossRef] [Green Version]
  44. Cullingworth, J.B.; Nadin, V. Town and Country Planning in the UK; Routledge: London, UK, 2001. [Google Scholar]
  45. Dou, W.; Wang, C.; Jiang, X.; Liu, Y. Research on the urban-rural integration development level of Shandong Province from the perspective of rural revitalization. J. Nat. Sci. Hunan Normal Univ. 2019, 42, 1–8. [Google Scholar]
  46. Chen, A.; Gao, J. Urbanization in China and the coordinated development model—The case of Chengdu. Soc. Sci. J. 2011, 48, 500–513. [Google Scholar] [CrossRef]
  47. Gross, C.; Ritzinger, A.; Magel, H. Searching for the village of tomorrow scenarios on the functionality of bavarian villages in 2020. DISP 2011, 47, 44–55. [Google Scholar] [CrossRef]
  48. Xu, X.; Liu, J.; Xu, N.; Wang, W.; Yang, H. Quantitative study on the evolution trend and driving factors of typical rural spatial morphology in southern Jiangsu Province, China. Sustainability 2018, 10, 2392. [Google Scholar] [CrossRef] [Green Version]
  49. Han, J.; Hayashi, Y.; Cao, X.; Imura, H. Application of an integrated system dynamics and cellular automata model for urban growth assessment: A case study of Shanghai, China. Landsc. Urban Plan. 2009, 91, 133–141. [Google Scholar] [CrossRef]
  50. White, R.; Engelen, G. High-resolution integrated modelling of the spatial dynamics of urban and regional systems. Comput. Environ. Urban Syst. 2000, 24, 383–400. [Google Scholar] [CrossRef] [Green Version]
  51. Shen, Q.; Chen, Q.; Tang, B.; Yeung, S.; Hu, Y.; Cheung, G. A system dynamics model for the sustainable land use planning and development. Habitat Int. 2009, 33, 15–25. [Google Scholar] [CrossRef]
  52. Wang, Y.; Liu, Y.; Yan, B. Spatial patterns and influencing factors of urban-rural coordinated development in China. Sci. Geogr. Sin. 2016, 36, 20–28. [Google Scholar]
  53. Liu, Y.; Lu, S.; Chen, Y. Spatio-temporal change of urban–rural equalized development patterns in China and its driving factors. J. Rural Stud. 2013, 32, 320–330. [Google Scholar] [CrossRef]
  54. Wang, Y.; Liu, Y.; Li, Y.; Li, T. The spatio-temporal patterns of urban–rural development transformation in China since 1990. Habitat Int. 2016, 53, 178–187. [Google Scholar] [CrossRef]
  55. Zeng, F.; Wu, X. Dynamic evaluation of urban-rural coordination development: Evidence from Hunan Province. J. Agrotech. Econ. 2011, 1, 86–92. (In Chinese) [Google Scholar]
  56. Lv, D.; Wang, W. A study on the relationship between urban-rural integration and economic development. China Soft Sci. 2018, 5, 179–192. [Google Scholar]
  57. Wu, X.; Cui, P. A study of the time-space evolution characteristics of urban-rural integration development in a mountainous area based on ESDA-GIS: The case of the Qinling-Daba Mountains in China. Sustainability 2016, 8, 1085. [Google Scholar] [CrossRef] [Green Version]
  58. Anselin, L.; Sridharan, S.; Gholston, S. Using exploratory spatial data analysis to leverage social indicator databases: The discovery of interesting patterns. Soc. Indic. Res. 2007, 82, 287–309. [Google Scholar] [CrossRef]
  59. Li, Z.; Deng, X.; Jin, G.; Mohmmed, A.; Arowolo, A.O. Tradeoffs between agricultural production and ecosystem services: A case study in Zhangye, Northwest China. Sci. Total Environ. 2020, 707, 136032. [Google Scholar] [CrossRef]
  60. Bai, Y.; Deng, X.; Jiang, S.; Zhang, Q.; Wang, Z. Exploring the relationship between urbanization and urban eco-efficiency: Evidence from prefecture-level cities in China. J. Clean. Prod. 2018, 195, 1487–1496. [Google Scholar] [CrossRef]
Figure 1. Guangdong Province.
Land 09 00253 g001
Figure 2. Moran’s I value and Moran scatter diagrams of the comprehensive level of urban and rural coordination development.
Land 09 00253 g002
Figure 3. Spatial distribution of URCD (2000–2015).
Land 09 00253 g003
Table 1. Indicator system of urban and rural coordination development.
DimensionCodeCriteria LayerIndex LayerIndex Description
Urban and rural coordinationX1Economic developmentUrban and rural GDP growth rateRural GDP growth rate/urban GDP growth rate
X2Economic levelPer capita GDP difference between urban and rural areasRural per capita GDP/urban per capita GDP
X3EmploymentWages of urban and rural workersWages of rural workers/wages urban employees
X4FinanceFixed assets investment in urban and rural areasAnnual fixed assets investment in rural areas/total fixed assets investment in urban areas
X5ConsumptionRatio of total retail sales of urban and rural consumer goodsTotal retail sales of rural consumer goods/total retail sales of urban consumer goods
Urban and rural developmentX6Industrial structureProportion of secondary and tertiary industries in GDPProportion of the second and third industries in GDP/proportion of the first industry in GDP
X7EducationEducation developmentNumber of primary and secondary school teachers/number of primary and secondary school students
X8Medical careMedical developmentNumber of registered population/total number of beds in medical institutions
X9IncomeIncome levelPer capita disposable income of urban and rural residents
X10Gross domestic productGDP per capitaTotal GDP/registered population
Table 2. The value and range of the Urban–Rural Coordination Development (URCD).
CityURCD2000R2000URCD2005R2005URCD2010R2010URCD2015R2015
Guangzhou2.18820912.79611413.35611413.3670421
Shantou−0.45955110.6424766−0.38468121.5399066
Shaoguan−0.6712−0.50285140.41634870.7484087
Heyuan−1.5315217−1.1487319−1.149419−0.6865219
Meizhou−0.40861100.0204998−1.08687180.33868410
Huizhou0.47409850.85201750.91232151.938964
Shanwei−1.1544515−0.7230815−0.8350314−0.5590615
Jiangmen−0.370149−0.2818112−0.2590310−0.613418
Yangjiang−0.2645380.0583597−0.1054590.3201711
Zhanjiang−1.803119−0.9365816−1.0427617−0.3038814
Maoming−0.9482313−0.2194611−0.82919130.643349
Zhaoqing−0.058566−0.02038100.32011280.08744712
Qingyuan−1.7642718−1.0043518−0.9751715−0.5867216
Chaozhou−0.161557−0.0003990.44532260.7074738
Jieyang−0.9855314−0.4117313−0.28897110.08066713
Yunfu−1.2556316−0.9762617−1.00616−0.5938117
Dongguan1.1851331.79890821.76340421.9837783
Zhuhai1.23502720.94627131.61201132.0060012
Zhongshan0.56192940.87118241.26567941.6761935
Table 3. Principal Component Analysis (PCA) weighted average.
2000200520102015
X13.1256551.2251931.569287−0.4636
X32.9262131.938062.088529−1.11756
X42.617476−1.39773−1.18314.414266
X52.839276−1.65386−1.379334.173691
X6−1.27066−1.20417−1.0121.475609
X70.3178563.2812052.9582482.111217
X80.866319−1.66349−1.32669−2.07601
X9−0.166952.8455912.5873211.335861
X100.8577341.7939031.413026−0.9013

