Article

Connectivity of Protected Areas: Effect of Human Pressure and Subnational Contributions in the Ecoregions of Tropical Andean Countries

by
Luis Santiago Castillo
1,2,*,
Camilo Andrés Correa Ayram
1,
Clara L. Matallana Tobón
1,
Germán Corzo
1,
Alexandra Areiza
1,
Roy González-M.
1,
Felipe Serrano
2,
Luis Chalán Briceño
2,
Felipe Sánchez Puertas
2,
Alexander More
3,
Oscar Franco
3,
Henry Bloomfield
4,
Victoria Lina Aguilera Orrury
4,
Catalina Rivadeneira Canedo
4,
Vilisa Morón-Zambrano
5,
Edgard Yerena
5,
Juan Papadakis
5,
Juan José Cárdenas
6,
Rachel E. Golden Kroner
7 and
Oscar Godínez-Gómez
8
1
Instituto de Investigación de Recursos Biológicos Alexander von Humboldt, Bogotá 111311, Colombia
2
Naturaleza y Cultura Internacional, Loja 1101332, Ecuador
3
Naturaleza y Cultura Internacional, Lima 15047, Peru
4
Fundación Natura Bolivia, Santa Cruz de la Sierra 951, Bolivia
5
Universidad Simón Bolívar, Caracas 1086, Venezuela
6
Interalianza Consultores, Caracas 1071, Venezuela
7
Moore Center for Science, Conservation International, Arlington, VA 22202, USA
8
Comisión Nacional para el Conocimiento y Uso de la Biodiversidad, Mexico City CDMX 14010, Mexico
*
Author to whom correspondence should be addressed.
Land 2020, 9(8), 239; https://doi.org/10.3390/land9080239
Submission received: 26 June 2020 / Revised: 18 July 2020 / Accepted: 19 July 2020 / Published: 23 July 2020

Abstract

:
Conservationists recognize the value of protected area (PA) systems, with adequate coverage, ecological representation, connection, and management to deliver conservation benefits. Yet, governments primarily focus on coverage, disregarding quantification of the other criteria. While recent studies have assessed global representation and connectivity, they present limitations due to: (1) limited accuracy of the World Database of Protected Areas used, as governments may report areas that do not meet the IUCN or CBD PA definitions or omit subnational PAs, and (2) failure to include human impacts on the landscape in connectivity assessments. We constructed a validated PA database for Tropical Andean Countries (TAC; Bolivia, Colombia, Ecuador, Perú, and Venezuela) and used the existing Protected-Connected-Land (ProtConn) indicator—incorporating the Global Human Footprint as a spatial proxy for human pressure—to evaluate TAC ecoregions’ representation and connectivity. We found that just 27% of ecoregions in the TAC are both protected and connected on more than 17% of their lands. As we included human pressure, we conclude that previous global ProtConn studies overestimate PA connectivity. Subnational PAs are promising for strengthening the representation of PA systems. If nations seek to meet Aichi target 11, or an upcoming post-2020 30% target, further efforts are needed to implement and report subnational conservation areas and appropriately evaluate PA systems.

1. Introduction

At least 73% of the land surface of the earth has been transformed by human activities [1]. Habitat loss, shrinkage, and degradation commonly have negative effects on biodiversity and ecological processes [2,3,4,5], such as the isolation of populations of many wildlife species (e.g., terrestrial carnivores [6]). Thus, the persistence of numerous species and ecosystems depends not only on local actions but also on landscape management approaches [3,7,8]. Countries and regions have established systems of protected areas (PAs) as the primary landscape strategy for biodiversity conservation [9]. As a single PA may seek to protect a remnant of natural or semi-natural habitat or a specific population, well-designed networks of PAs (i.e., an ecologically representative, well-connected, and properly managed system [9,10,11]) can contribute to the persistence of species and ecosystems [2,7,8,12,13].
There is no clear consensus about how much of these terrestrial landscapes should be covered by systems of PAs to guarantee the conservation of biodiversity. The Strategic Plan of the Convention on Biological Diversity (CBD) Aichi Target 11 sets a goal of 17% PA coverage for terrestrial systems, especially areas of particular importance for biodiversity and ecosystem services [10]. This target explicitly considers equity and effective management, connectivity, and ecological representation as the main criteria to be reached by 2020. Beyond 2020, initiatives including the Global Deal for Nature (GDN) initiative promotes a 30% target by 2030 [14], while the Half-Earth Project (see http://half-earth.org) and other scientists are promoting 50% PA coverage [15,16,17].
Governments and official agencies focus on Aichi target 11 to evaluate their PA international commitments. However, they focus primarily on quantifying how much of their land is protected (i.e., coverage of PAs), and less on the other criteria that define a well-designed system. By focusing solely on area, countries around the world might be overestimating their conservation performance, misinforming decision-makers, and affecting future global commitments [18,19]. To ensure that protected areas live up to their potential to conserve biodiversity, it is imperative to understand the enabling conditions for their success, including adequate PA management, ecological representation, and structural and functional connectivity [18,20,21].
Aside from PA management, recent studies have examined PA systems’ representation and connectivity at global or regional scales. For instance, Santini et al. [22] use a graph-theory metric called Equivalent Connected Area (ECA), proposed by Saura et al. [23], to measure the connectivity of PA systems at country and continent levels. Based on a wide range of median dispersal distances of terrestrial mammal species, this study found that less than half of the world’s land covered by PAs (in categories I–IV from the International Union for Conservation of Nature, IUCN) is well-connected. Similar results were later demonstrated by other authors [24,25,26] using an advanced version of ECA’s indicator called Protected-Connected-Land (ProtConn). Overall, they found that although ca. 15% of the global land surface is protected (IUCN categories I–VI), only 7.5% to 9.3% is covered by well-connected PA systems, and that only one third of countries and terrestrial ecoregions globally reach the 17% target, both protected and connected. More recently, using a new map of world ecosystems, Sayre et al. [27] also found that just one third of terrestrial ecological units exceed the Aichi 11 protection target.
However, these results should be interpreted with caution. First, as has been acknowledged [22,24,28], these analyses do not consider human-driven landscape heterogeneity in PA connectivity equations. Thus, the aforementioned ProtConn values might be overestimated, as species movements between PAs are sensitive to landscape permeability. Second, all previous studies have used Protected Planet (the World Database of Protected Areas, WDPA) as the source of PA spatial information. This database is the only freely available source of PA data on a global scale and is managed jointly by the World Conservation Monitoring Center (WCMC) of the United Nations Environment Program (UNEP) and the IUCN [9]. However, as the database primarily depends on governments’ official reports or validation, which in many cases are not accurate (see results below), it is expected that this database is neither fully updated nor completely inventoried for accuracy [29,30,31]. For instance, in some countries where subnational PAs are recognized by local legislation, they barely appear in national databases, and are therefore excluded from monitoring and reporting to the WDPA (e.g., Ecuador, see results below, or USA [32]). This also affects ProtConn calculations and hinders evaluations of subnational PAs contributions [33]. Finally, while PA evaluations provide valuable insights at global scales, results are compromised at sub-global analyses, due to the ecological and regulatory particularities of each territory (e.g., which regional mammal dispersal distances are best suited to the model, or what should be considered as a protected area).
Understanding some of the limitations of PA global evaluation efforts and using Tropical Andean Countries (TAC) as our geographical model, our study uses a comprehensive, validated, and updated database of PAs to (1) evaluate how landscape heterogeneity affects the connectivity of PA systems, (2) assess—under this new approach—the region’s performance in achieving 17%, 30%, and 50% of representation and connectivity targets, and (3) determine the contribution of subnational protected areas to protection, representation, and connectivity. Here, we propose an improved application of the ProtConn indicator and identify gaps for better design and reporting of PA systems toward the achievement of international conservation targets.

2. Materials and Methods

2.1. Geographical Scope

Our study used the terrestrial administrative limits of Tropical Andean Countries (TAC; includes Bolivia, Colombia, Ecuador, Perú, and Venezuela) as the geographical model that can inform global decision-making (Appendix A Figure A1). Country boundaries were obtained from the Global Administrative Unit Layers, developed by the Food and Agricultural Organization (FAO) [34].
TAC frames a subcontinental region in northern South America that shares an ecological and geographical identity. These tropical countries—all considered as some of the most biodiverse nations in the world [35]—have territories in both the Amazon basin and the Andes mountain range and hold two hot-spots of global biodiversity (i.e., the Tropical Andes and the Chocó/Darien/western Ecuador) [36]. Further, due to similar cultural and historical backgrounds, these countries are linked politically and economically. For instance, they integrate the Andean Community of Nations (CAN; Venezuela was originally part of the community but is not anymore), a multi-government arrangement that influences the financial, political, social, and environmental policies across the region. Thus, an evaluation of PAs in one of the most biodiverse regions on the planet will inform not only local governments and decision-makers but also regional or global agencies involved in PA evaluation and nature protection.

2.2. Database of Protected Areas

We involved one leading organization or expert for each TAC country with expertise in PA creation, management, research, or normativity, and close relations with local government agencies, thus ensuring a rigorous understanding of local PA performance and on the decision-making contexts. Each team evaluated the regulatory and geographical data of PAs established before November 2019. We only considered conservation areas that (i) are legally recognized as protected areas according to the relevant national or subnational governmental regulations, (ii) have clear spatial limits and conservation purposes, and (iii) can be assigned to any IUCN PA category (see Dudley [37]). In some cases, especially for Venezuela, Bolivia, and Ecuador, we reconstructed the geographical limits of some PAs if a more accurate description was found in legal documents. For coastal and marine PAs, we only considered their terrestrial portions. We excluded conservation areas that: (a) do not have a national or subnational legal designation as a protected area despite their potential for positive impacts on conservation or even community or international recognition (e.g., IBAs, Biosphere Reserves, Ramsar or indigenous lands), (b) do not have clear spatial limits (e.g., only a geo-referenced point or a vague description of limits), even if the spatial extent is reported, (c) do not have conservation of nature as the primary objective, so they do not meet the CBD or IUCN PA definition, (d) do not meet any IUCN category, or (e) are entirely located in insular or marine areas. For each PA, the following information was compiled: country, year of designation, name, national category, IUCN category, and level of governance (i.e., national or subnational). For PAs that were not given an IUCN category by the government, we assigned the appropriate category. When a PA was created and managed by subnational authorities, communities, or private owners, regardless of whether the legal document was issued by a national authority, we classified it as a subnational PA.
PAs that met these criteria were compiled in a geo-database and standardized to the Mollweide geographical projection, which is best suited for continental or global analyses. The full database of PAs can be downloaded from https://doi.org/10.6084/m9.figshare.12568502. Note that this database does not replace official information and will not be updated regularly, as the WDPA. For a full description of how we built the database for each country, see Supplementary Table S1.

2.3. Ecological Units of Analysis

We used Ecoregions 2017© Resolve, also standardized to Mollweide, as the source of our units of analysis [17]. This world map is an improved and updated version of Olson’s original Ecoregion map [38]. Each ecoregion represents a spatial unit that has a biological and ecological identity, in which similar species composition and vegetation structures are expected [17]. Although some TAC countries have national maps of ecosystems or ecological units, the Ecoregions 2017© Resolve map is a comprehensive source of information that enables comparable and compatible evaluations at transnational scales. As this ecoregion map has been used widely to evaluate connectivity or representation of PA systems [17,24,39,40,41], our results can be compared to other published studies.

2.4. Network Connectivity and Landscape Heterogeneity

We calculated the ProtConn indicator proposed by Saura et al. [24] to assess PA network connectivity. Here, PA connectivity is defined as the facility of species movements and other ecological flows among protected areas [24]. Protconn easily informs users and decision-makers about the connectivity state in PA systems and helps to identify priorities for their improvement. It has recently been used by the Digital Observatory of Protected Areas (DOPA) to compare progress toward national and global PA targets [9,24,26]. ProtConn is based on the Probability of Connectivity Index (PC) and Equivalent Connected Area (ECA), formerly proposed graph-metrics that take into account inter-patch and intra-patch connectivity [23,42]. ProtConn corresponds to the percentage of a study area (here, each ecoregion) covered by protected and connected lands [24,25].
According to Saura et al. [24,25], ProtConn in each ecoregion can increase in two ways: first, through the designation of larger PAs, even if this results in a single PA covering several smaller, well-interconnected PAs, and second, through more numerous or stronger connections between different PAs. ProtConn may decrease if PAs are downsized or degazetted [43], or replaced by multiple smaller PAs that cover a reduced proportion of what was originally protected. Additionally, we considered Prot and ProtUnconn, also proposed by Saura et al. [24]. Prot corresponds to the percentage of each ecoregion covered by PAs (i.e., coverage) and ProtUnconn corresponds to the percentage of the ecoregion covered by unconnected PAs. ProtUnconn is calculated as the difference between Prot and ProtConn.
We calculated ProtConn and ProtUnconn considering six different median dispersal distances (dmed): 1, 5, 10, 30, 50, and 70 km, where dmed refers to the median distance traveled by a disperser (e.g., an animal) from its current home to a new one [44]. While Saura et al. [24] suggest a median dispersal range between 1 and 100 km, we selected this range up to 70 km because it covers the entire dispersal threshold of terrestrial vertebrate species that inhabit the TAC with better accuracy. For instance, a maximum dispersal of 68.4 km has been reported for carnivores such as pumas (Puma concolor, which has one of the greatest terrestrial dispersal capacities among neotropical mammals [45]), on a neotropical-like open ecosystem (i.e., grasslands and savannas) [46,47].
Considering that PAs outside of the TAC region can contribute to PA connectivity [24,25], we selected a 350 km buffer from the TAC study area to include all transnational PAs reported in the WDPA until November 2019 (Appendix A Figure A1). All PAs that totally or partially intercept this buffer were referred to as transboundary areas that potentially influence connectivity between PAs within ecoregions. To define transboundary areas, we applied the same method for global analyses used by Santini et al. [22] and Saura et al. [24,25], but we applied a maximum dmed = 70 km, which also differs from Saura’s dmed = 100 km. Considering a dmed = 70 km, the probability of dispersal movements between PAs > 350 km apart from each other is only 0.03. See Saura et al. [24,25] for more details.
As suggested by different authors [22,24,28], it may be instructive to present a version of these connectivity indicators that includes the degree of resistance offered by the landscape heterogeneity to the movement of species between PAs. Thus, to replace the commonly used Euclidean distance measurements (ProtConnEu) (e.g., References [24,25,32]), we integrated the Global Human Footprint (GHF) map of 1 km2 of spatial resolution [48]. This map incorporates the land-cover change, presence of infrastructure, and access to natural areas to measure the degree of human pressure on the landscape and allows for quantifying the matrix-resistance for the mobility of a wide range of species (as is needed in a transnational assessment). This approach has been widely used in connectivity analyses because it works as a good generic proxy of landscape heterogeneity [49,50,51,52,53]. ProtConn and ProtUnconn were again calculated under the same parameters as previously noted, using the resistance surface and incorporating the resulting cost-distances (i.e., distances weighted by the landscape resistance) to connectivity (ProtConnCD). To determine the contribution of sub-national PAs in each ecoregion, we evaluated the differences in the values of Prot, ProtConnCD, and ProtUnconnCD when they are excluded from the PA network as compared to when they are included. All protection and connectivity indicators were calculated using the R Makurhini package [54], specifically designed for this study, and further similar research to optimize landscape connectivity measures. This package is available online at https://github.com/connectscape/Makurhini.

2.5. Data Analyses

To evaluate how landscape heterogeneity affects the connectivity of PAs, we tested the 1:1 relationship between the Euclidean connectivity (ProtConnEu) and the cost–distance connectivity (ProtConnCD), and their variation as median dispersal distances (dmed) increased from 1 to 70 km. Thus, we performed a linear regression model (lm) for each dmed range with ProtConnEu and ProtConnCD as regressors. Then, we used the linear hypothesis test (lth) from the R car package [55] to assess the extent to which both methods are over- or under-estimated between them (null hypothesis β = β0,1 is not rejected with p-values > 0.05). Here, a significant slope above 1:1 (p < 0.05) indicates that ProtConnEu overestimates the dispersal distance of a specific range. By contrast, if a significant slope is found below 1:1 (p < 0.05), it indicates that the overestimation comes from the ProtConnCD.
To assess the region’s performance in the achievement of international targets—in terms of coverage, connectivity, and representation of PA systems—we counted the number of ecoregions whose Prot, ProtConnEu, and ProtConnCD values are in one of the following categories and protection ranges: omission (i.e., <1%), insufficient for all targets (i.e., 1–16.9%), sufficient for Aichi 11 target because it surpasses the 17% mark, but not the GDN or Half-Earth targets (i.e., 17–29.9%), sufficient for the GDN, as it surpasses the Aichi 11 and GDN, but not the Half-Earth target (i.e., 30–49.9%), and sufficient for all targets (i.e., ≥50%). We later extrapolated the number of ecoregions in each range as a percentage of the TAC extension to evaluate how much land of TAC fits in each category. We consider that an ecoregion is well represented in the PA system if its ProtConnCD at least surpasses the Aichi target 11 of 17%.
To test if the ProtConnCD varies with the inclusion or exclusion of subnational PAs for all ecoregions, we ran a non-parametric Wilcoxon test to compare between groups (e.g., national and subnational PAs versus national PAs). We ran this test because both groups, among all the studied distance ranges (1 to 70 km), did not fit the assumption of normal distribution (p > 0.05, Shapiro–Wilk test). Considering that subnational conservation areas are mainly envisioned by local stakeholders as a response to local needs and challenges [30,33,56], we delved further into the possible relationship between subnational PAs and the degree of ecoregion transformation. We then repeated this procedure (including and excluding subnational PAs) for subsets of ecoregions that have different degrees of transformation (the proxy of transformation obtained from Dinerstein et al. [17], i.e., >80%, >50%, and <50%). We also used the linear hypothesis test (lth) from the R car package [55] to assess if both models (including and excluding subnational PAs) follow the same slope for the relation between Prot and the GHF [48] as the proxy of transformation (assigning to each ecoregion a GHF index through the zonal statistics function of ArcMap 10.7).

3. Results

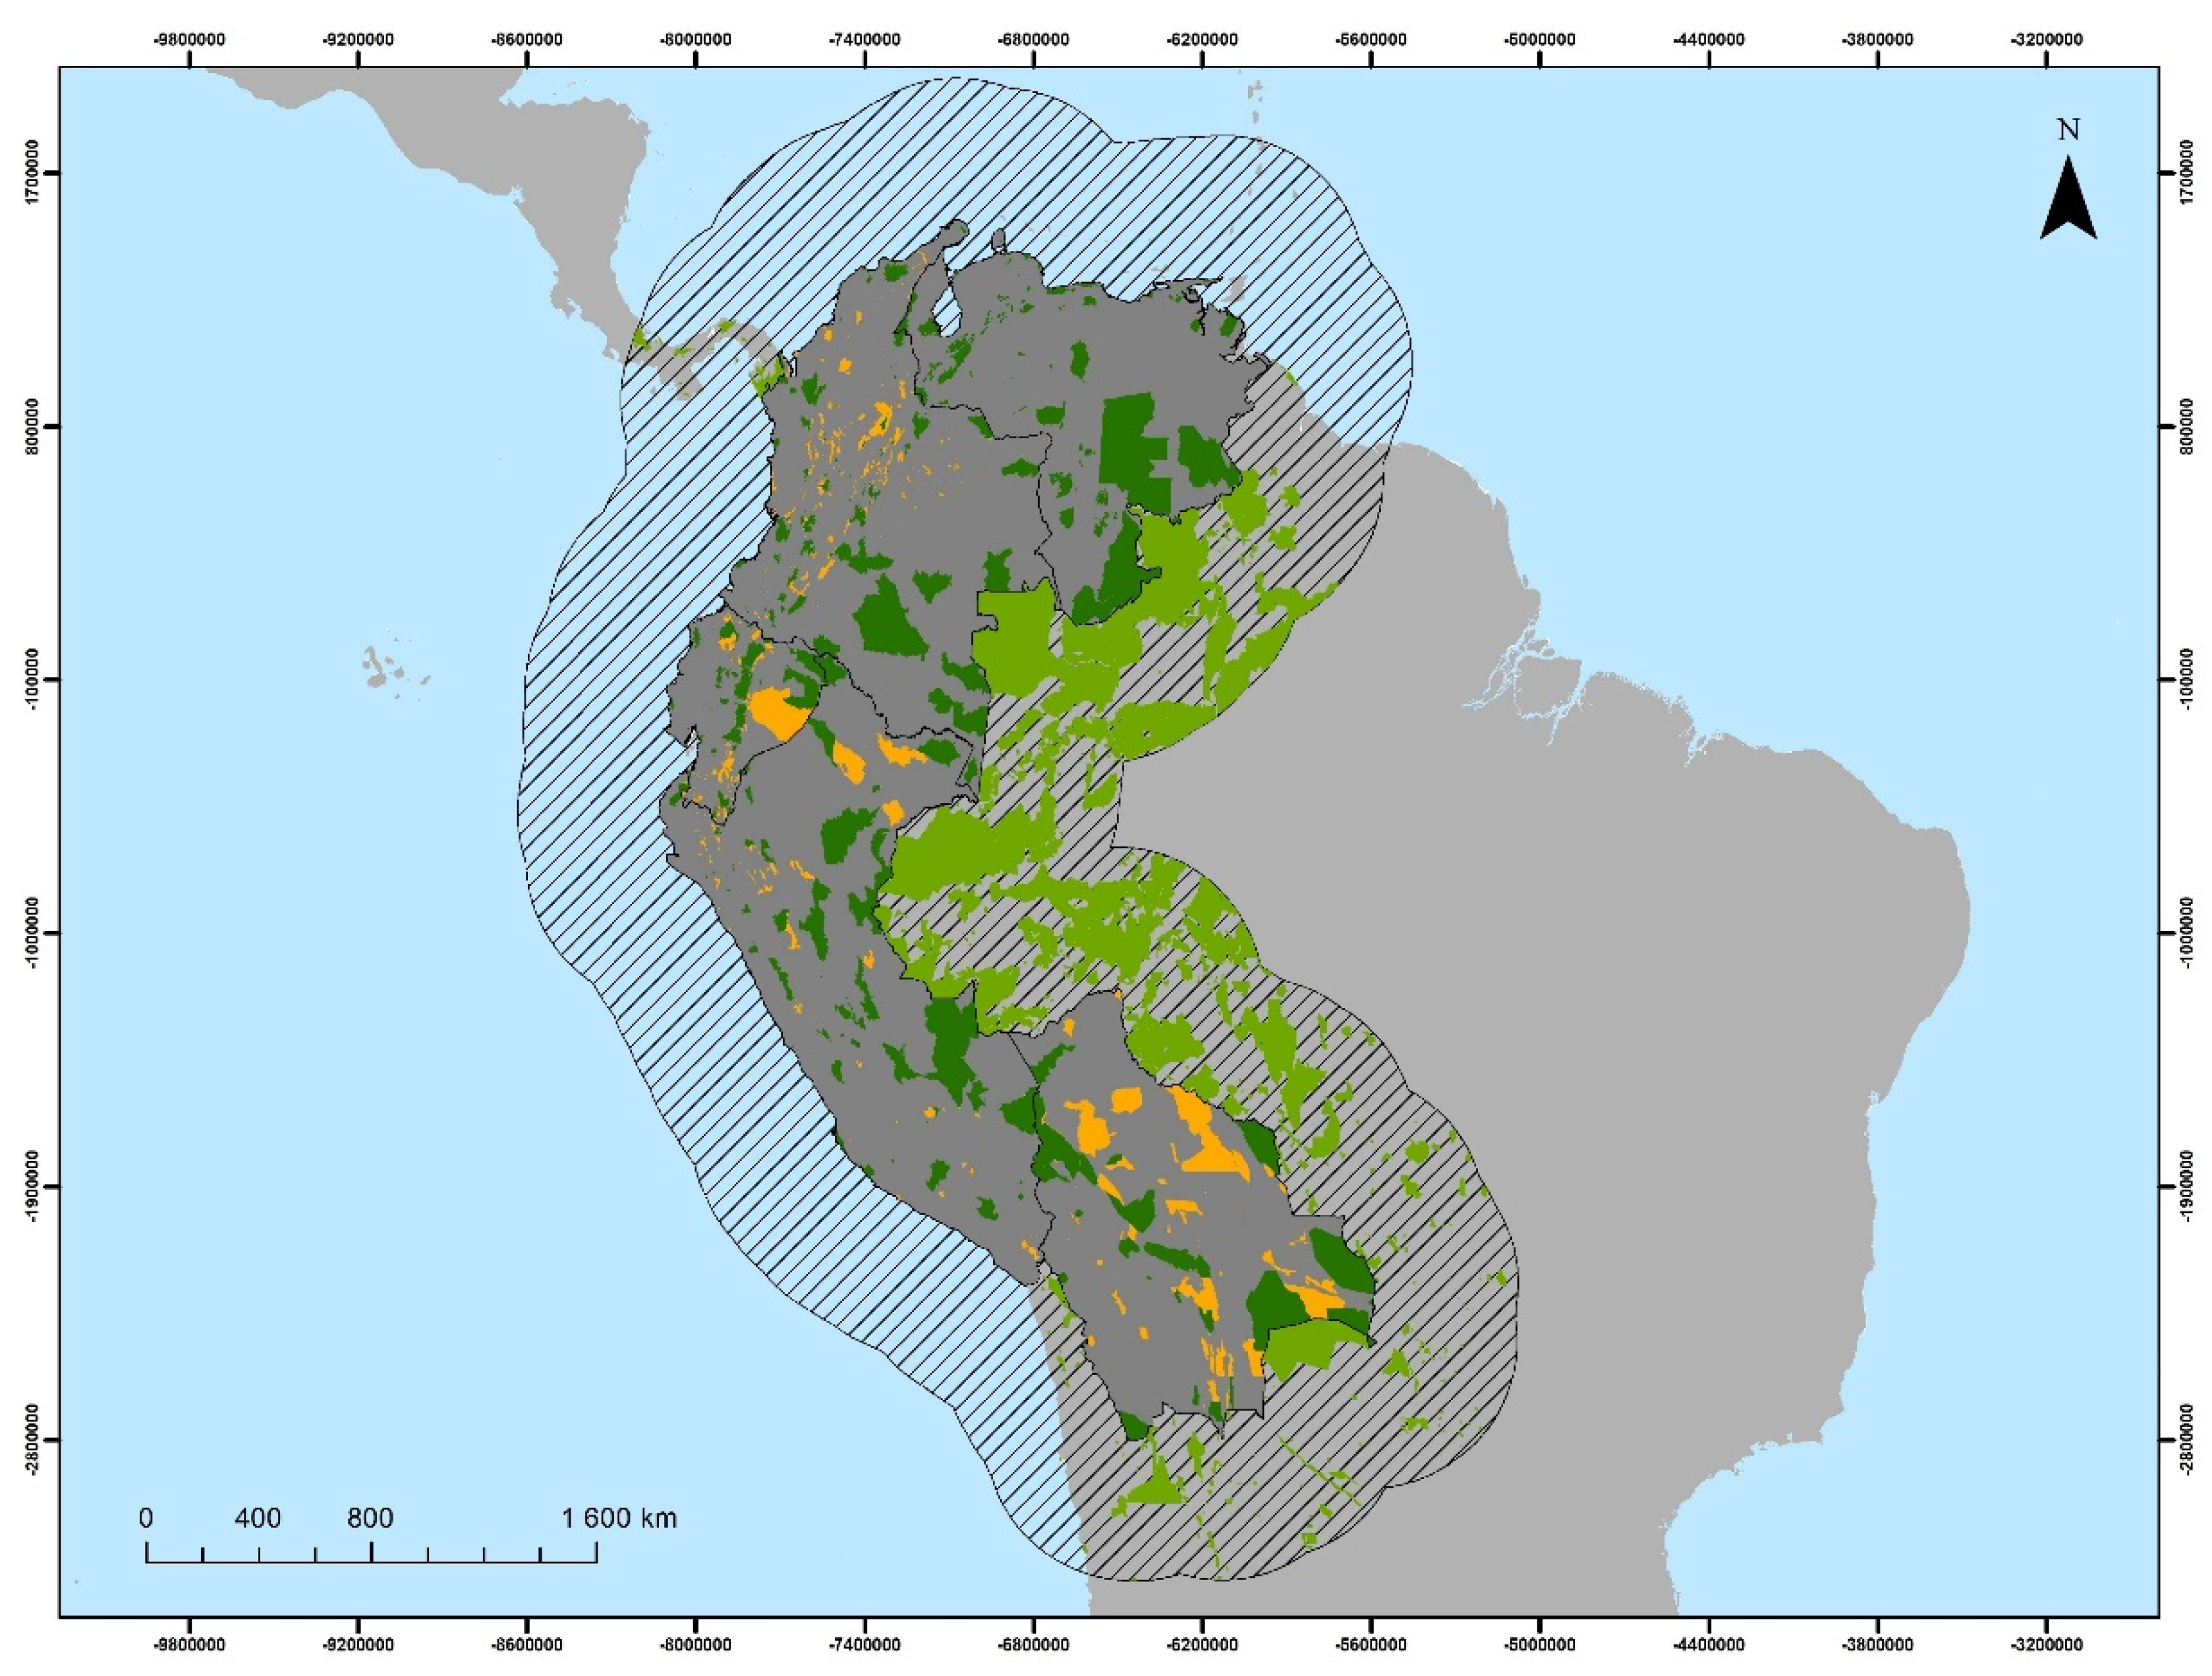
3.1. Database of Protected Areas

We compiled a terrestrial TAC database of 1775 protected areas (updated to November 2019), that covers 21% of the TAC continental region. Eighty percent of them are subnational protected areas, which contribute to 23% of PAs extension (Appendix A Figure A1). All TAC countries, except for Colombia, exceed the 17% target for coverage of protected lands (Prot). Only Ecuador has more than 30% of its land protected. Comparisons with other sources of information (based on official data) show several differences with our Prot estimations (Table 1).
The largest subnational PAs can be found in the Amazonian region of Ecuador and northern Perú, and the lowlands of eastern Bolivia. However, the most numerous subnational PAs are found in the Andes, especially in Colombia, Ecuador, and northern Perú (Appendix A Figure A1). There are no subnational PAs in 25 ecoregions, and none were reported for Venezuela, as their regulation does not recognize them (Supplementary Table S2).

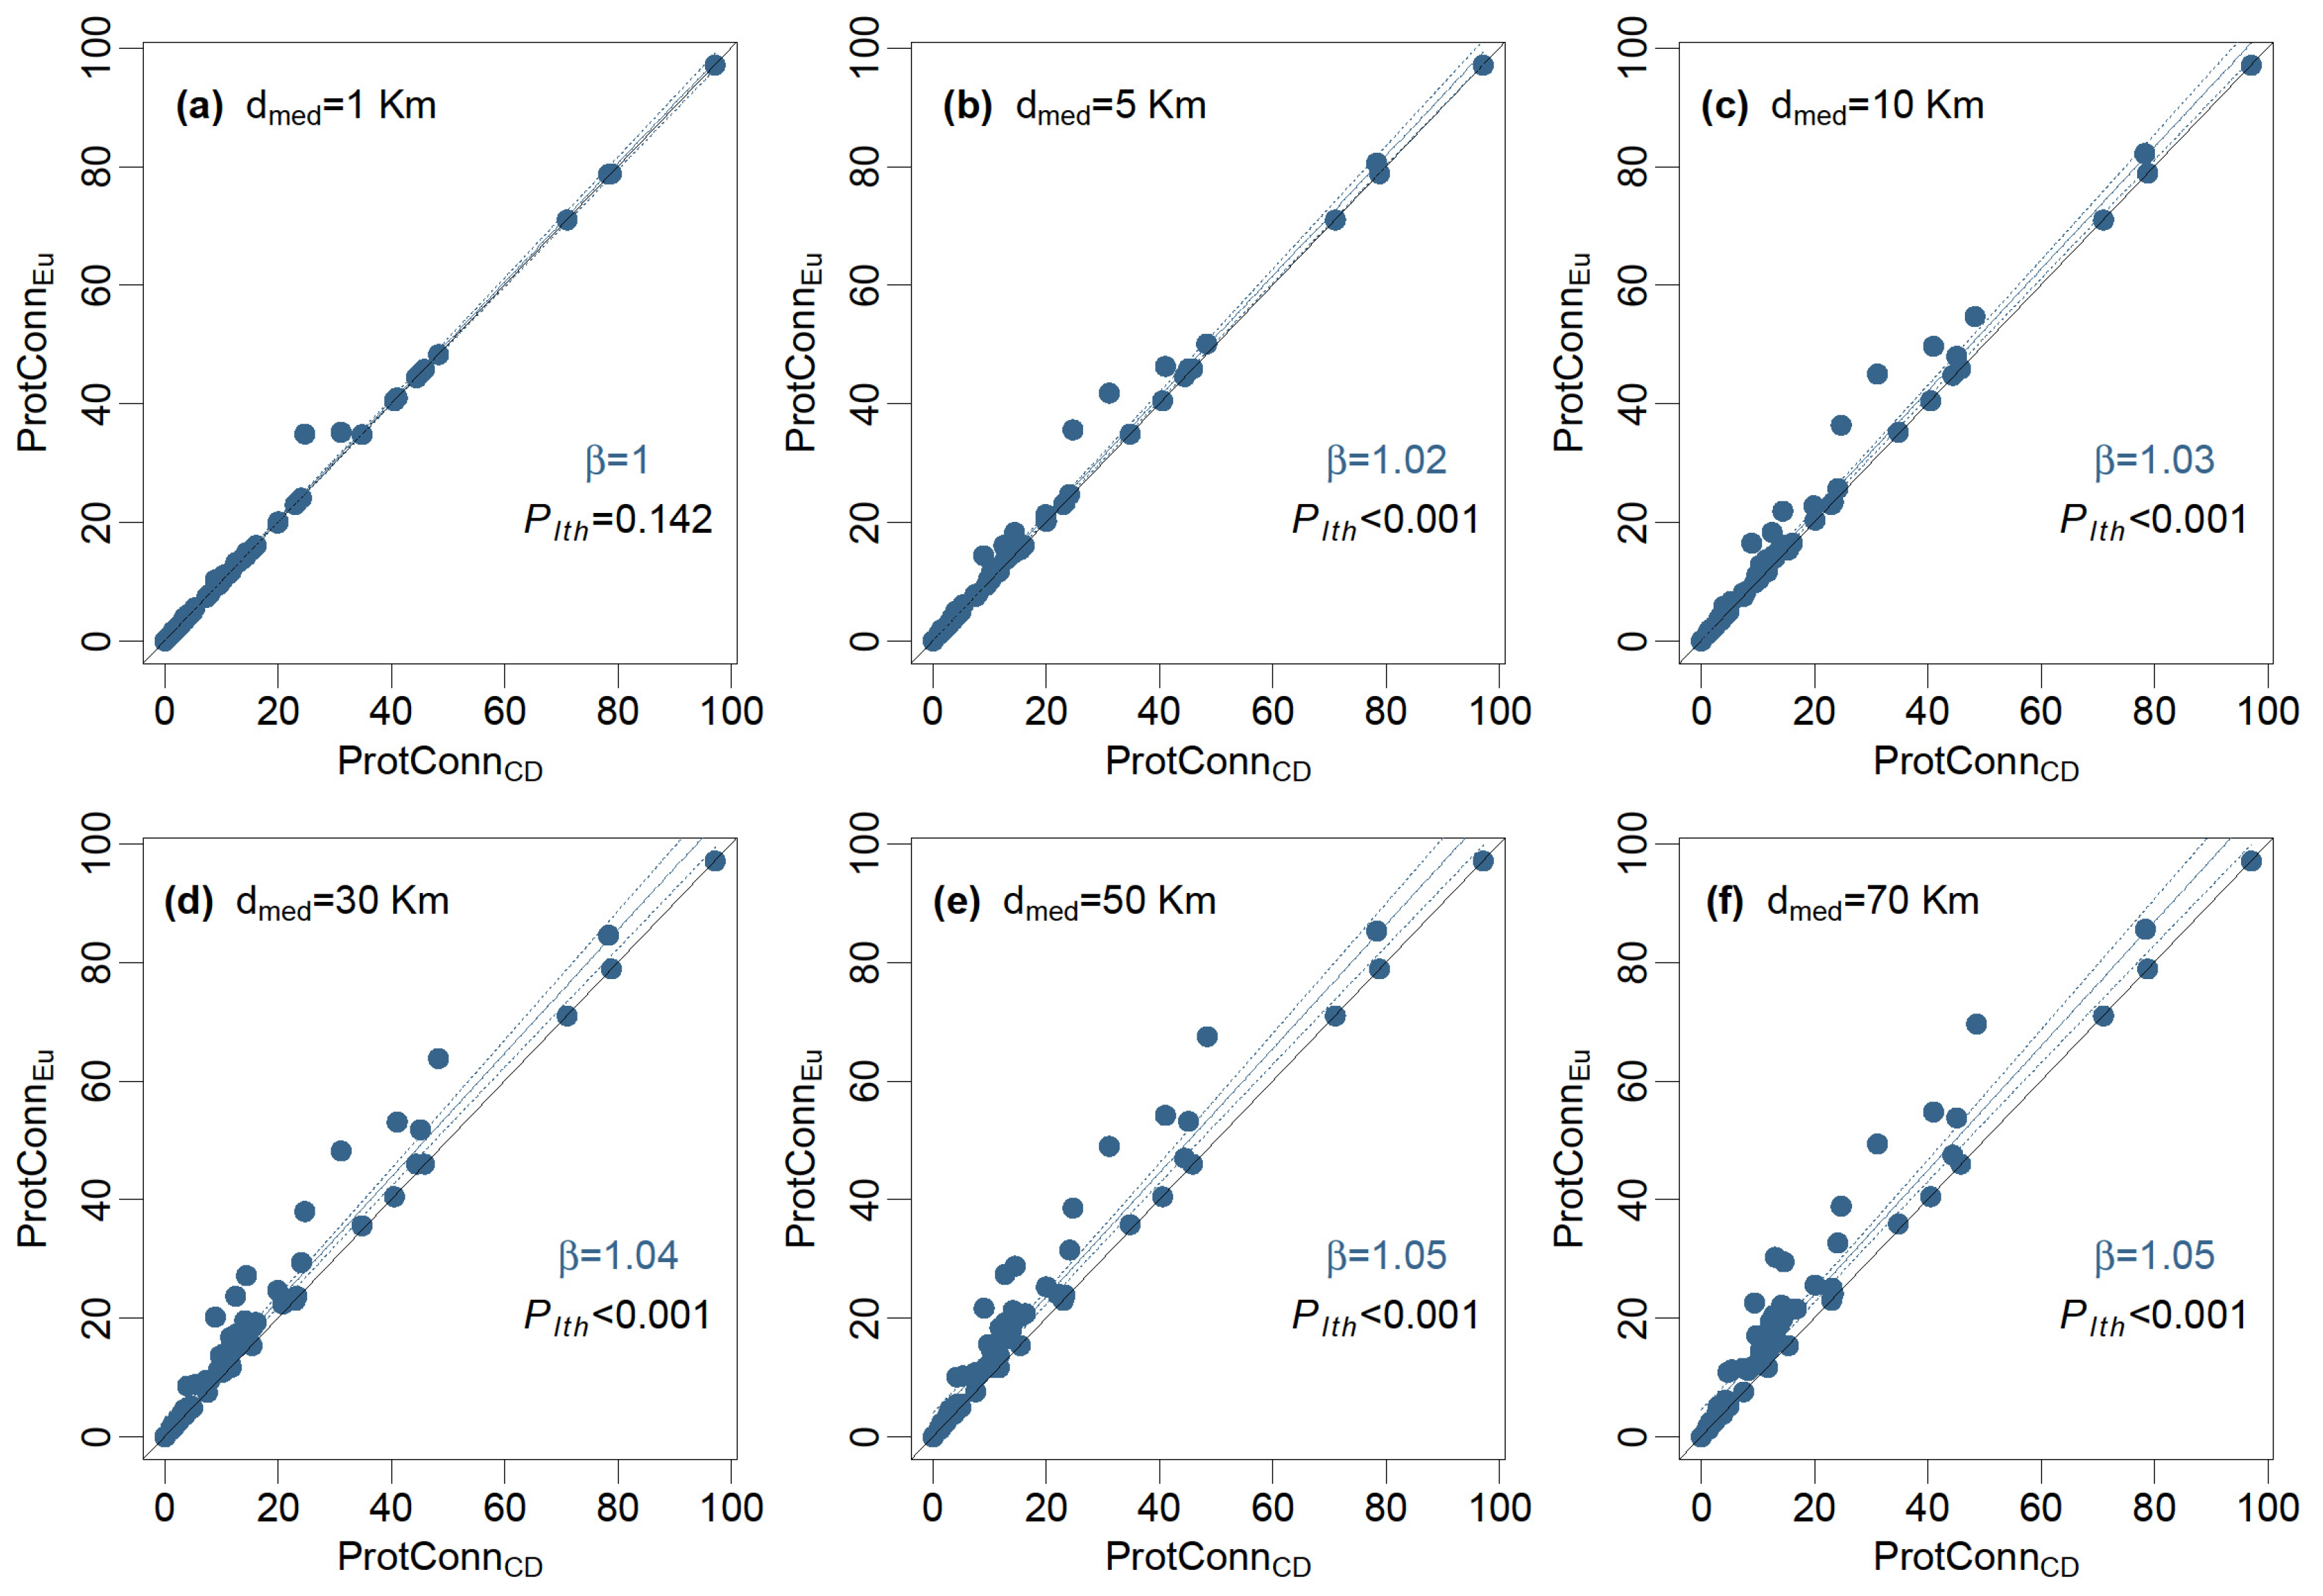
3.2. Landscape Heterogeneity and PA Connectivity

Significant differences from the 1:1 expected slope were found between ProtConnEu and ProtConnCD across all dispersal distances (PIth < 0.001; Figure 1b–f), except for the shortest median dispersal distance (dmed = 1 km; p = 0.142; Figure 1a). As the dispersal capabilities of organisms increase, differences between connectivity methods are more evident (Figure 1). As expected, Euclidean values of connectivity are always equal to or higher than cost–distance analysis within the same ecoregion.
Focusing on dmed = 10 km, which according to Saura et al. [24] is the central value of the log-transformed range of all dmed considered in their study. The ecoregions that lost most of their protected and connected lands (ProtConnCD) due to land transformation are: the Eastern Cordillera Real Montane Forests (−46%), Southern Andean Yungas (−34%), Cauca Valley Montane Forests (−32%), Madeira-Tapajós Moist Forests (−32%), Bolivian Yungas (−31%), and Northern Andean Páramo (−31%). See Supplementary Table S2 for further details on other ecoregions.
No significant differences in connectivity (ProtConnCD) were found when we included or excluded subnational PAs for all dmed taken into account (Supplementary Figure S1; p > 0.05). Although there is a tendency that national PAs are more closely associated with non-transformed ecoregions than subnational PAs, we found no significant differences (Supplementary Figures S2 and S3; p > 0.05).

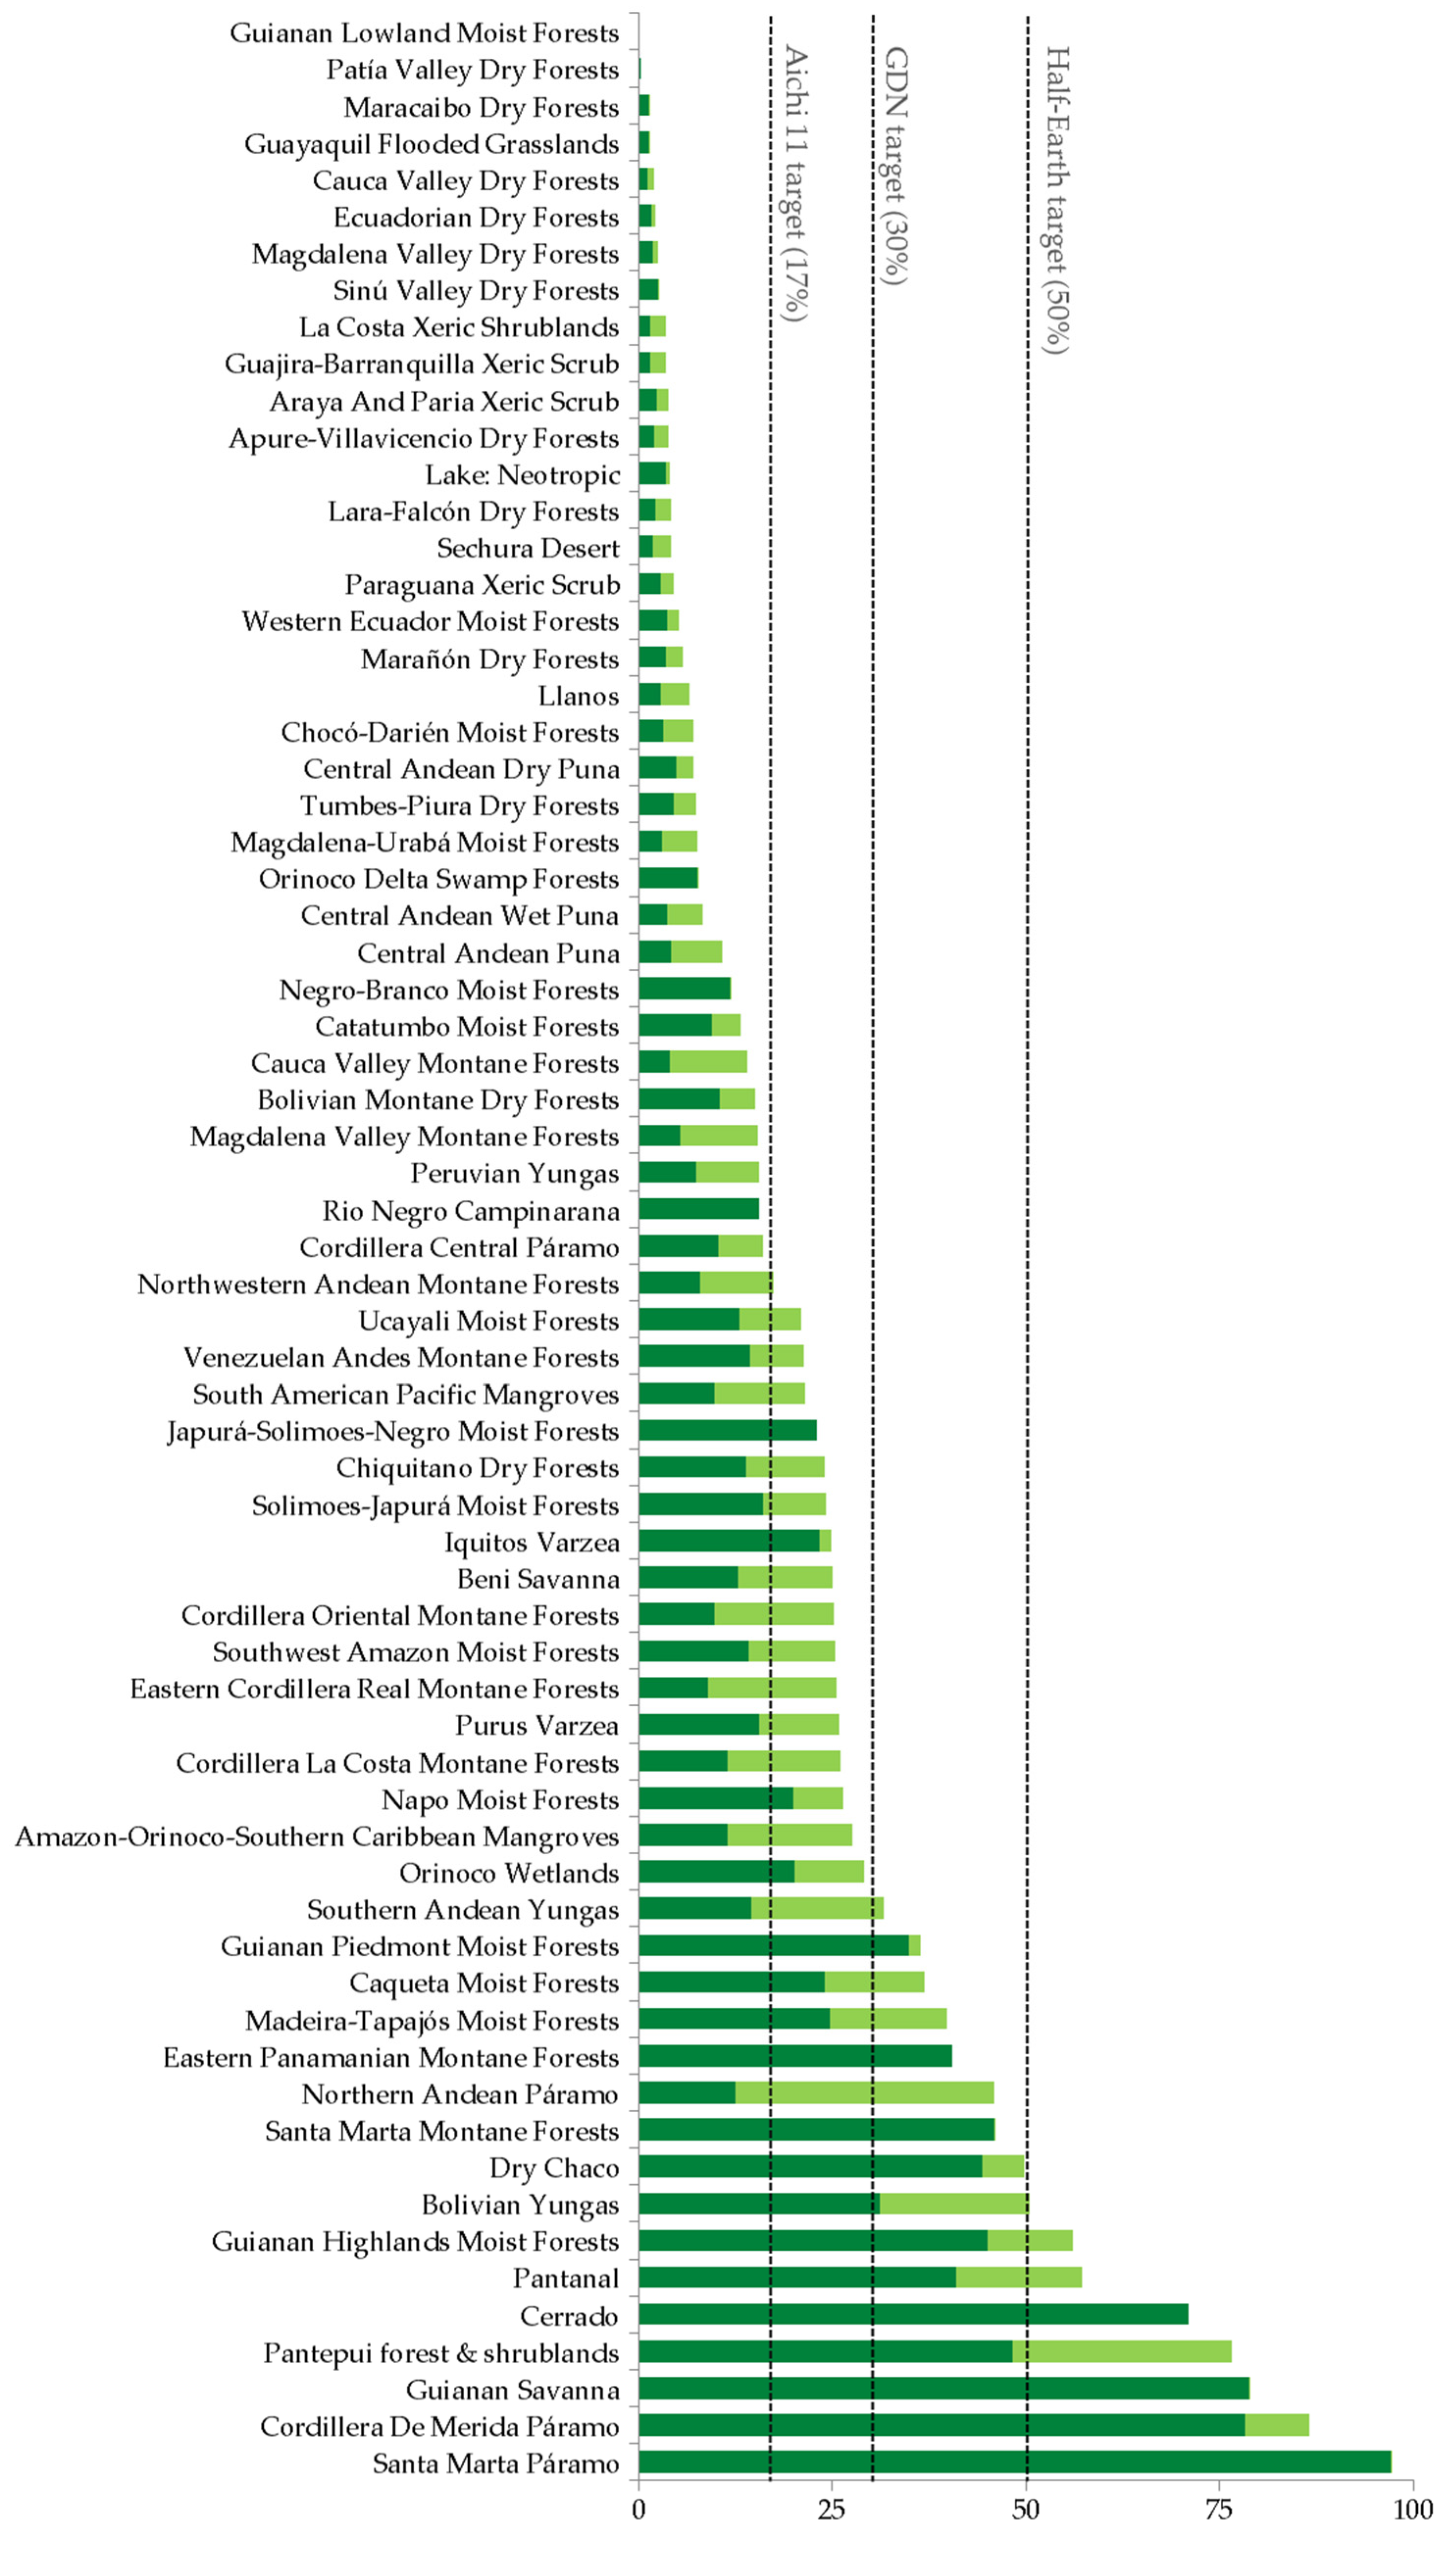
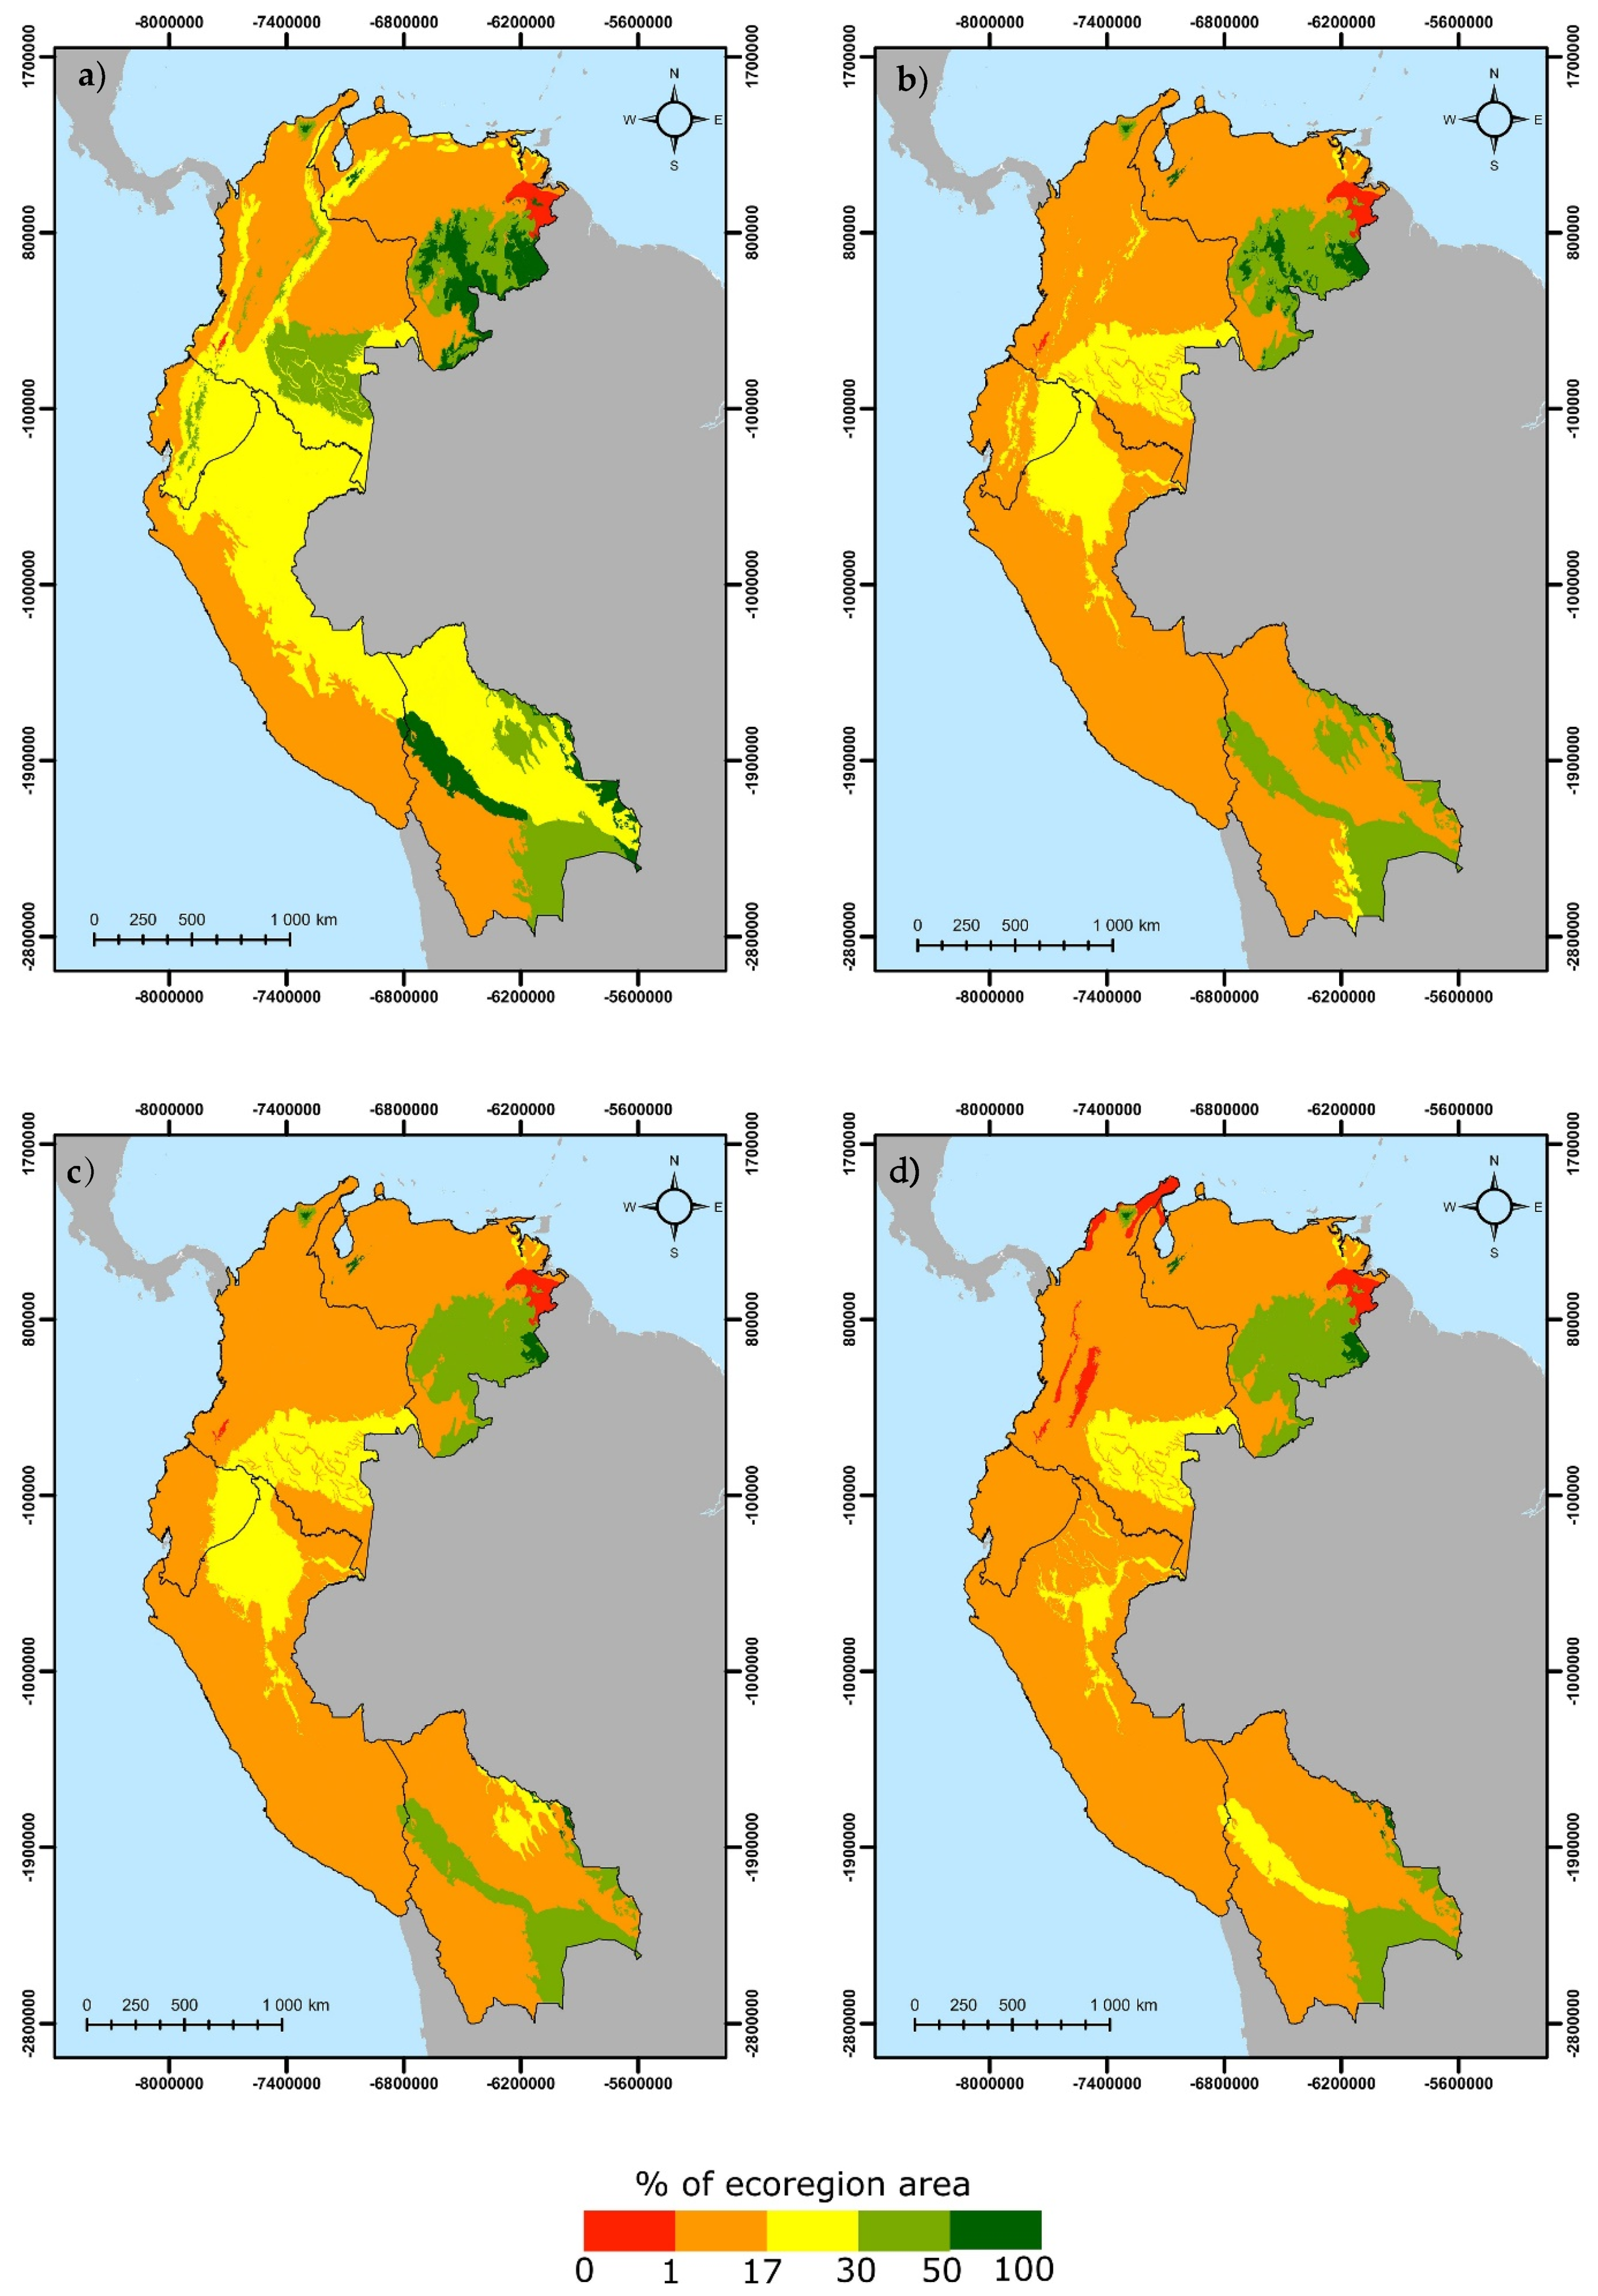
3.3. Protected and Connected Ecoregions and Global Targets

Only 33 out of the 67 TAC ecoregions have more than 17% of their extensions covered by protected areas (Prot), and just 20 (ca., 30%) or 18 (ca., 27%) surpass the 17% target with protected connected lands (ProtConnEu or ProtConnCD, respectively; dmed = 10 km) (Figure 2 and Table 2). On average, 22% of the protected land in each ecoregion is not connected (ProtUnconnCD). In fact, 20 ecoregions have more than 50% of their protected areas unconnected, and the Northern Andean Páramo (73%) and the Cauca Valley Montane Forest (72%) are the most extreme cases. Only 6 ecoregions surpass the Aichi target 11 with protected lands almost entirely connected (i.e., ProtProtConn): the Santa Marta Páramo, the Guianan Savanna, the Cerrado, the Santa Marta Montane Forests, the Eastern Panamanian Montane Forests, and the Japurá-Solimoes-Negro Moist Forests (Supplementary Table S2).
Almost all dry ecoregions (i.e., dry forests, dry punas, xeric shrublands, xeric scrubs, and deserts) do not meet the Aichi target 11 (ProtConnCD), not even in coverage (Prot) (Figure 2 and Supplementary Table S2). The Guianan Lowland Moist Forest in Venezuela and the Patía Valley Dry Forest in Colombia have no protection at all (<1%). If we remove subnational protected areas, three additional ecoregions (all in Colombia) lost all protection: the Cauca Valley Dry Forest, the Magdalena Valley Dry Forest, and the Guajira-Barranquilla Xeric Shrub (Figure 3d and Supplementary Table S2).
Analysis by ecoregions demonstrates that, while almost half of the TAC surface surpasses the Aichi target 11 through protected lands (Prot), only a quarter meets the same target through protected and connected lands (either ProtConnEu or ProtConnCD) (Table 2 and Figure 3). These changes are more conspicuous in the eastern and western Andes in Colombia, the Andean region in Ecuador and Venezuela, the Amazonian region and foothills in Perú and Bolivia, and the Chiquitano Forest and Beni Savanna in Bolivia (Figure 3). Spatial differences can also be observed between Euclidean and cost–distance calculations, especially in the Ecuadorian and Colombian Andes, and the Southern Andean Yungas ecoregion in Bolivia. Similar trends are found when we evaluate the 30% and 50% targets. For instance, while 5.9% of TAC extension meets the 50% target through protected lands (Prot), less than a quarter of it fails to meet this target through ProtConnEu and less than a tenth for ProtConnCD (Table 2).
If we remove subnational PAs, another 7% of TAC extension fails to meet the 17% target: the Napo Moist Forest in Ecuador and Perú, the Madeira-Tapajós Moist Forest in Bolivia, and the Colombian Andes and Caribbean-related ecoregions are the most affected. However, while subnational PAs explain on average 22% of the ecoregions Prot, they only explain 17% of the ProtConnCD. For further details about changes in Prot, ProtConnEu, and ProtConnCD values for each ecoregion, as well as for specific contributions of subnational PAs, see Supplementary Table S2.

4. Discussion

4.1. Protected Land and Governmental Reports

Although minor differences were expected (due to dissimilarities in geographical projections, base maps, and dataset update dates), our protected land (Prot) values differ greatly from those calculated in the WDPA [57] or in the Redparques regional report [58], based on official data (Table 1). Official information in Perú, Bolivia, and especially Venezuela, overestimates their protected land because they include some areas that do not meet the IUCN or CBD definition of protected area (a commission error; see Baldwin and Fouch [33]). For instance, Venezuelan official information includes areas that regulate agricultural and forestry activities for economic and production purposes, but not for the long-term conservation of nature (e.g., the zone of agricultural development). In Bolivia and Venezuela, official databases consider some areas that do not have a well-defined geographical space but only point data (sometimes with a reported area). In addition, Perú reports areas to the WDPA under the designation of “restricted zone” whose main purpose is to temporally protect forest resources while studies are completed to assign a PA definitive category. During the categorization process, the level of use and the size of the area that will finally be protected can change (or even disappear), thus varying its contribution to the estimates and official reports. Even though there is some validation of information sent by governments to the WDPA, UNEP-WCMC acknowledges that the regulatory particularities of each country—and even national PA definitions—make it difficult to remove all commission errors in the provided datasets [59]. Because PA authorities, especially governments, are the primary entities reporting on PAs, they are responsible for data stewardship and accurate reporting.
We also found that many subnational PAs have not been well-updated in Bolivia or well-inventoried in Ecuador by official agencies, an omission error that has also been reported in many other countries around the world [30,32,33,60]. This explains why Ecuador performs much better under our fully inventoried and validated database, than under the official information provided (Prot = 31.1% vs. 20.2% to 21.8%, respectively). Thus, as Stolton et al. [30] (p. 43) acknowledged, WDPA data do not fully represent the global network of PAs, especially subnational PAs. Again, it is the responsibility of governments and officials to carry out a precise account and report of PAs that meet the PA definition.
Colombia and Perú have the best structured and updated databases of PAs in the TAC, something that should be replicated across the region. Our findings suggest that, just as in other countries of the world [29], the other TAC governments have an inadequate system of validation and reporting of PAs. Incorrect reporting may arise, either (1) as a strategy of overreporting information for the achievement of international targets, (2) as a result of poor political commitment to the use of precise information for conservation planning, (3) as a consequence of officials misunderstanding concepts and local legislation about PAs [30], or (4) as an effect of miscommunication or lack of coordination between central governments and decentralized administrations. All these have negative implications for conservation planning, decision-making, and proper evaluation of international targets.

4.2. Landscape Heterogeneity and PA Connectivity

PA systems are performing worse in connectivity than in previous estimates. As Santini et al. [22] and Saura et al. [24] acknowledged, and Naidoo and Brennan [28] recommend, connectivity evaluations of PA networks should consider landscape heterogeneity for more accurate results.
The continuous transformation of natural landscapes (in TAC or other regions of the world) is not only affecting present values of PA connectivity but compromising the future of the global PA system as a network [61]. Even if new and bigger protected areas are created, further landscape degradation can contribute to a declining ProtConn. As ProtConnEu values tend to increase over time (assuming PAs are newly established or expanded), ProtConnCD could either increase or decrease over time according to the dynamics of PA creation and land transformation. Countries and conservation organizations should focus on avoiding land degradation and improving the matrix permeability between PAs to achieve national and international conservation goals.
While available intact or semi-natural areas for the creation of new PAs become scarcer over time, new approaches for conservation are also needed in areas of intensive land use to improve landscape permeability and connectivity. The promotion of productive systems and infrastructure design that diversify landscapes and reduce stresses for biodiversity mobility [62,63], as well as the establishment of conservation corridors [52] and other effective area-based conservation measures (OECMs) at local scales [56,64], are urgently needed.

4.3. Protected and Connected Ecoregions

Ecoregions are not well represented by PAs in the TAC. Less than a quarter of them surpass the Aichi target 11 (ProtConnCD, or a third for the Prot indicator). These results are comparable to recent findings by Watson et al. [11], Butchart et al. [41], Saura et al. [24], and Sayre et al. [27], who estimated that barely one third of world ecoregions and ecosystems exceed this same global target (Prot). Also, Shanee et al. [40] observed that just 35% of Peruvian ecoregions exceed 17% of protection. Here, the most interesting finding is that our representation (Prot) proportion is similar to the one found by Sierra [39] nearly 18 years ago, for the same TAC region. Using a PA database updated in 2001 (IUCN categories I to III) and Olson’s ecoregions, this study also found that just a third of TAC ecoregions surpass 17% of protection. We stress that although PA extension has doubled since 2001 in the TAC, no improvements to ecoregion representation have been achieved. Hence, countries’ efforts in the creation of new PAs and the pursuit of meeting international commitments have seen limited progress on strengthening the representativeness of PA systems. This might support the already documented claim that many countries locate their protected areas based on opportunistic criteria, rather than a systematic conservation planning process [32,65,66,67].
As expected, the better represented and connected ecoregions usually correspond to the most remote, extensive, and wild lands (e.g., Amazonian-, Guianan-, and Chaco-related ecoregions) (Figure 3c). Those areas have extensive PAs within minimally transformed landscapes. Instead, the Andean, Caribbean, and Pacific ecoregions—some of the most numerous and densely populated—are the poorest represented or the worst connected (Appendix A Figure A1; Supplementary Table S2). This can be explained by a variety of different factors: (1) they correspond to the most transformed ecoregions, with natural areas being even more degraded and isolated, (2) due to conflicts in land-use interests and smaller remnants of natural habitats, they provide fewer opportunities for the placement of new and larger protected areas [66], and (3) as the Northern Andean Páramo or the Pantepui, some ecoregion units are naturally fragmented by geographical and natural conditions, so even if they are well-protected, connectivity values are low.
For those ecoregions that have lost most of their natural extension (e.g., the tropical dry forests [68,69]), restoration processes and alternative conservation practices are also needed to ensure proper representation and connectivity of PA systems [17]. Also, as 57% of ecoregions are shared among TAC countries or with neighboring nations, transnational collaborations are required to tackle common conservation needs. Here, the establishment or reactivation of collaboration schemes for conservation gains special relevance. For instance, the CAN and the Redparques intergovernmental network for protected areas can and should facilitate this transnational planning across the TAC region.

4.4. Subnational Contributions

At our scale of analysis, the contribution of subnational PAs to connectivity is limited. Despite averaging 22% of the ecoregions’ protection, or 23% of the TAC, they only explain 17% of the PA connectivity. Similar results were recently obtained by Bargelt et al. [32] for the United States. They found that private PAs have on average a small contribution to protection (Prot ≈ 1.1%) and connectivity (ProtConn ≈ 0.4%). It seems, from both exercises, that subnational PAs are less effective at connecting protected landscapes than expected from their current extensions.
Size differences in PAs can partially explain why subnational PAs seem to perform worse in connectivity than national PAs. While TAC national PAs have a median size of 25,244 ha (n = 362), subnational PAs have a median size of 102 (n = 1421). As one of the ProtConn fractions (i.e., ProtConn[within], see Saura et al. [24]) is highly dependent on size rather than distance or location (topology), it might be obscuring the potential importance of small conservation areas at detailed scales of analysis. For instance, if a single PA has the same extension as several smaller PAs, the PA system would show better connectivity values in comparison to the smaller ones combined, even if they are better located. Thus, jointly with field testing, more spatial analyses are needed at local scales including the other ProtConn fractions (i.e., ProtConn[Contig] and ProtConn[Trans]) to determine if smaller PAs play a key role as, for example, stepping-stones for biodiversity. Furthermore, as many subnational PAs are created by local agencies or private owners, they do not necessarily follow national guidelines of conservation planning (if they exist), but local or private agendas instead [30,32,33], so their contribution to the overall system might not be the most efficient. Also, since they respond to local-scale conservation needs, they may be more embedded in human-inhabited, transformed landscapes rather than in remote and more intact areas, where better functional and structural connections are expected [32,33].
Likewise, we argue that this limited contribution to connectivity is also explained by the scale of analysis, by differences in recognition and promotion of local conservation initiatives in different countries, and by a loose conservation planning process, rather than by the intrinsic characteristics of subnational PAs. In fact, according to Areiza et al. [70], one hectare of a subnational PA in Colombia contributes twice as much to connectivity than one hectare of a national PA. We also found that in three ecoregions (i.e., the Bolivian Montane Dry Forests, the Napo Moist Forests, and the Solimoes-Japurá Moist Forests), subnational PAs are more efficient in connectivity (ProtConn) than in protection (Prot) (Supplementary Table S2). Since Venezuela and many ecoregions do not have subnational PAs, we assume this could be affecting our transnational evaluation and hiding the potential contribution to connectivity from subnational areas.
It is also important to note that subnational PAs (or OECMs) could become a useful strategy to protect natural remnants in transformed landscapes [32]. A similar pattern occurs with strategic national ecosystems (e.g., mangroves, dry forests, and wetlands in Colombia [70] or the Marañón Dry Forest in Perú [71]). Although no statistical differences were found when comparing the level of governance (national versus national and subnational PAs) with the ecoregion’s transformation (Supplementary Figures S2 and S3), we observed that 9 of the 11 ecoregions where subnational PAs contribute to more than half of their Prot have at least 50% of its original extension transformed, while national PAs contribute only 30 out of the 54. In fact, three of these ecoregions depend only on subnational areas for their protection: the Cauca Valley Dry Forest, the Magdalena Valley Dry Forest, and the Guajira-Barranquilla Xeric Shrub (Supplementary Table S2). Thus, subnational conservation areas may play a critical role for the conservation of TAC endangered ecoregions (or other ecological units), where incompatibilities with national, larger areas (mainly of strict protection) could arise.
Subnational conservation areas (legally protected or not) are globally recognized as representing a significant opportunity to enhance the management, representation, and connectivity of PA systems [30,56]. Although administration costs may be higher, and ecosystem resilience and intactness could be more limited [33,72], small, subnational conservation areas rather than big national PAs could have better local management and even critical roles for protecting endangered ecoregions (as some dry ecosystems), rare, threatened or restricted species (e.g., threatened vertebrates in Perú [40]), and valuable ecosystems services by benefiting many users (e.g., urban PAs [73]). Moreover, as they respond to other scales of management and have better local support (e.g., private reserves or indigenous lands), subnational PAs and OECMs could make PA systems more complete [30,32,33,41,56,70].

4.5. Limitations and Further Research

An evaluation of the PA effectiveness on biodiversity and ecosystem services and equity in the management of PAs was beyond the scope of our analysis. As the Protected Planet Report 2018 states [9], only 9% of the PAs reported to the WDPA have management evaluations. This lack of systematic reporting, which also characterizes our study region, does not allow us to assess management or conservation effectiveness and equity. Therefore, by default, our evaluation overestimates PA systems’ performance. Also, we did not analyze multi-temporal changes in Prot or ProtConn or include connectivity variables such as future land-degradation or climate change. An understanding of past and future tendencies on protection, connection, representation, and effectiveness of PA networks is required for better conservation planning, especially under challenging scenarios of land and climate change. Further efforts should focus on reporting equity, management, and conservation effectiveness to the WDPA (PA attributes that can potentially be integrated into the ProtConn indicator), as well as evaluating multi-temporal tendencies of conservation networks.
The Aichi target 11 states that conservation systems should also consider OECMs in their accounts. This, indeed, is an opportunity for countries to complement their PA systems and reach international goals [56]. However, in varying degrees, there is a lack of OECM recognition by TAC governments, so there are no national databases for other conservation areas that could be included in our analyses. Regardless, UNEP-WCMC recently launched a manual [59] for reporting OECMs to the WDPA, which paves the way for furthering these areas and reporting them. We encourage governments and conservation agencies to evaluate and reinforce conservation initiatives that can meet the OECM criteria and include them in their reports.
We used Ecoregions 2017© Resolve and the GHF as substitutes for ecological variability and land heterogeneity, respectively. Although they work well for global or subcontinental scales of analyses, data interpretation might be limited at more detailed scales. For instance, different results about the importance of subnational PAs were observed for the Marañón Dry Forest in Perú when considering a different, more detailed geographical source of information for this ecoregion’s unit (i.e., SERNANP Ecoregions [71]). Using this national layer, the Marañón Dry Forest largely depends on subnational PAs for its protection. Similar limitations can arise from the GHF approach. This layer represents the degree or potential of human pressure on the landscape, it does not account for other sources of land heterogeneity, like topography, soil units, vegetation structure, and natural disturbances, among others [53]. It might be possible that, under a different approximation of land heterogeneity, ecoregions like the Pantepui (Venezuela), the Northern Andean Páramo (Ecuador and Colombia), or the Southern Andean Yungas (Bolivia), which are well-protected but comprise several isolated geographical units, could have better ProtConn values.
Understanding our research limitations and the different information needs for decision-making, including marine or IUCN category evaluations, here, we presented the R Makurhini package [54], developed by two of our coauthors for this type of analysis. This open-source R tool is available for researchers, conservation agencies, and decision-makers for further research and conservation planning.

5. Conclusions

Despite progress toward achieving the Aichi target 11 in terms of PA extent (i.e., 21% versus the 17% target), we found that just one out of four ecoregions in the TAC region has more than 17% of land both protected and connected and that, on average, 22% of all ecoregions’ protected land is not well connected. Just increasing the PA surface alone is not enough to achieve a well-designed PA system: comparing our data with previous exercises in the TAC region, we found that despite PA extension doubling since 2001, there has been no improvement to ecoregional representation. Thus, we conclude that TAC countries will not meet the Aichi target 11 in terms of connectivity and representation, and neither are on track for meeting the GDN target until governments and officials make substantial changes in the optimization of PA systems’ growth. This includes not only the implementation of detailed conservation planning processes for the strategic shape and location of protected lands but also the improvement of the landscape matrix around and among PAs.
Commission and omission inconsistencies were found in official datasets of PAs. While some countries have inventory shortcomings of their subnational PAs, others include areas that do not meet the IUCN or CBD PA definition. The later error, as we observed, results in the overestimation of TAC’s performance toward international PA commitments. Also, countries are mainly reporting coverage of PAs (Prot), neglecting the importance of quantifying ecological representation, connectivity, and proper management (effectively and equitably managed), criteria that define a well-designed network of PAs. While recent global PA connectivity studies [22,24,25,26] have attempted to address this lack of information, we found that they are also overestimating the connection of PA networks, as the human-driven transformation of landscapes has not been considered in their models. We also overestimated the region’s performance, since we did not evaluate effectiveness and equity in the management; despite this, we consider our PA network evaluation as the most precise exercise completed so far for the TAC region. According to Barnes et al. [18] and Visconti et al. [19], this overestimation pattern might be happening all around the world, misinforming future global commitments.
We found that subnational PAs are pivotal for the protection of some strategic or endangered ecoregions. Similarly, other authors argue that local areas for conservation could play better roles protecting specific values of diversity (e.g., threatened or restricted species and essential ecosystem services) and yield better management results than national areas, making PA systems more complete [30,32,33,41,56,70]. However, our results do not support the hypothesis that subnational PAs in the TAC are essential for connectivity, contradicting other local studies (e.g., Colombia [70]). We think that this result is not an intrinsic characteristic of subnational PAs but rather a result of our scale of analyses (i.e., limited method sensitivity), poor PA location, or a lack of record-keeping and support of subnational conservation areas by national governments.
Our findings underscore the importance of improving governments’ capacity to support protected area data and regular evaluations. The contribution of other conservation areas (e.g., OECMs) can also support progress toward conservation goals, especially those established or furthered by subnational stakeholders (e.g., indigenous lands or private reserves), which can complement national PA systems. Connectivity, ecological representation, and effective and equitable management aspects should also be considered, evaluated, and reported to avoid misinformation. A business-as-usual approach to PAs will be insufficient to face the challenges of the 21st century, including biodiversity loss, wildlife-related human epidemics, and climate change. Long-term funding, knowledge-transfer, and political will are needed to support better risk assessment, conservation planning and management, community engagement, monitoring, and evaluation. The CBD post-2020 framework—including through the upcoming target for protected and conserved areas—provides the opportunity to meet these challenges. The future of our planet and society depends on it.

Supplementary Materials

The following are available online at https://www.mdpi.com/2073-445X/9/8/239/s1: Table S1: Criteria and steps implemented in each TAC country for the compilation, validation, and complementation of PA official datasets, Table S2: Ecoregions Prot, ProtConnEu, and ProtConnCD, for all dmed considered, Figure S1: Wilcoxon test for the comparison of ProtConnCD between TAC national PAs and TAC national and subnational PAs, Figure S2: Wilcoxon test for the comparison of Prot between TAC national PAs and TAC national and subnational PAs for each Nature Need Half (NNH) category, Figure S3: Linear hypothesis test (lth) for the relationship between Prot and the Global Human Footprint (GHF) index. Geospatial data are available for download from https://doi.org/10.6084/m9.figshare.12568502.

Author Contributions

Conceptualization, L.S.C., C.A.C.A., and F.S.; methodology, L.S.C., C.A.C.A., G.C., R.G.-M., and O.G.-G.; data curation, L.S.C., C.L.M.T., A.A., F.S., L.C.B., F.S.P., A.M., O.F., H.B., V.L.A.O., C.R.C., V.M.-Z., E.Y., J.P., J.J.C., and R.E.G.K.; software, C.A.C.A. and O.G.-G.; formal analysis, L.S.C., C.A.C.A., G.C., R.G.-M., and O.G.-G.; investigation, all authors; writing—original draft preparation, L.S.C. and C.A.C.A.; writing—review and editing, L.S.C., C.A.C.A., and R.E.G.K.; visualization, L.S.C., C.A.C.A., and R.G.-M.; supervision, L.S.C.; project administration, L.S.C. All authors have read and agreed to the published version of the manuscript.

Funding

This research received no external funding.

Acknowledgments

We are grateful to the Ecuadorian subnational governments, Foragua, the Ministry of Environment and Water, and Nature and Culture International for providing the polygons of most subnational PAs in Ecuador. We also want to thank Conservation International for sharing its Venezuelan PA database, which was also reviewed by Professor Jorge Naveda, and to the Colombian Ministry of Environment (Resolution 0041 of 2020) for funding the publishing fee of this paper. We also recognize the valuable contributions of reviewers who helped improve the manuscript. Finally, we want to thank Miguel Rendón for his support on previous ProtConn calculations in the earlier version of Makurhini and Julia Premauer for the English and style review of the manuscript.

Conflicts of Interest

The authors declare no conflicts of interest.

Appendix A

Figure A1. TAC study area in South America and national (dark green), subnational (yellow), and non-TAC transnational (light green) terrestrial protected areas considered in the analysis.
Land 09 00239 g0a1

References

  1. Locke, H.; Ellis, E.C.; Venter, O.; Schuster, R.; Ma, K.; Shen, X.; Woodley, S.; Kingston, N.; Bhola, N.; Strassburg, B.B.N.; et al. Three global conditions for biodiversity conservation and sustainable use: An implementation framework. Natl. Sci. Rev. 2019, 6, 1080–1082. [Google Scholar] [CrossRef] [Green Version]
  2. Haddad, N.M.; Brudvig, L.A.; Clobert, J.; Davies, K.F.; Gonzalez, A.; Holt, R.D.; Lovejoy, T.E.; Sexton, J.O.; Austin, M.P.; Collins, C.D.; et al. Habitat fragmentation and its lasting impact on Earth’s ecosystems. Sci. Adv. 2015, 1, 1–9. [Google Scholar] [CrossRef] [PubMed] [Green Version]
  3. Zemanova, M.A.; Perotto-Baldivieso, H.L.; Dickins, E.L.; Gill, A.B.; Leonard, J.P.; Wester, D.B. Impact of deforestation on habitat connectivity thresholds for large carnivores in tropical forests. Ecol. Process. 2017, 6, 1–11. [Google Scholar] [CrossRef] [Green Version]
  4. Fahrig, L. Habitat fragmentation: A long and tangled tale. Glob. Ecol. Biogeogr. 2019, 28, 33–41. [Google Scholar] [CrossRef]
  5. Fletcher, R.J.; Didham, R.K.; Banks-Leite, C.; Barlow, J.; Ewers, R.M.; Rosindell, J.; Holt, R.D.; Gonzalez, A.; Pardini, R.; Damschen, E.I.; et al. Is habitat fragmentation good for biodiversity? Biol. Conserv. 2018, 226, 9–15. [Google Scholar] [CrossRef] [Green Version]
  6. Crooks, K.R.; Burdett, C.L.; Theobald, D.M.; Rondinini, C.; Boitani, L. Global patterns of fragmentation and connectivity of mammalian carnivore habitat. Philos. Trans. R. Soc. B Biol. Sci. 2011, 366, 2642–2651. [Google Scholar] [CrossRef]
  7. DeFries, R.; Hansen, A.; Newton, A.C.; Hansen, M.C. Increasing isolation of protected areas in tropical forests over the past twenty years. Ecol. Appl. 2005, 15, 19–26. [Google Scholar] [CrossRef] [Green Version]
  8. Laurance, W.F.; Carolina Useche, D.; Rendeiro, J.; Kalka, M.; Bradshaw, C.J.A.; Sloan, S.P.; Laurance, S.G.; Campbell, M.; Abernethy, K.; Alvarez, P.; et al. Averting biodiversity collapse in tropical forest protected areas. Nature 2012, 489, 290–293. [Google Scholar] [CrossRef] [Green Version]
  9. UNEP-WCMC; IUCN; NGS. Protected Planet Report 2018; Gland: Cambridge, UK; Washington, DC, USA, 2018. [Google Scholar]
  10. CBD. Strategic Plan for Biodiversity 2011–2020; CBD: Montreal, QC, Canada, 2011. [Google Scholar]
  11. Watson, J.E.M.; Dudley, N.; Segan, D.B.; Hockings, M. The performance and potential of protected areas. Nature 2014, 515, 67–73. [Google Scholar] [CrossRef]
  12. Coetzee, B.W.T.; Gaston, K.J.; Chown, S.L. Local scale comparisons of biodiversity as a test for global protected area ecological performance: A meta-analysis. PLoS ONE 2014, 9, e0105824. [Google Scholar] [CrossRef] [PubMed]
  13. Gray, C.L.; Hill, S.L.L.; Newbold, T.; Hudson, L.N.; Börger, L.; Contu, S.; Hoskins, A.J.; Ferrier, S.; Purvis, A.; Scharlemann, J.P.W. Local biodiversity is higher inside than outside terrestrial protected areas worldwide. Nat. Commun. 2016, 7. [Google Scholar] [CrossRef] [Green Version]
  14. Dinerstein, E.; Vynne, C.; Sala, E.; Joshi, A.R.; Fernando, S.; Lovejoy, T.E.; Mayorga, J.; Olson, D.; Asner, G.P.; Baillie, J.E.M.; et al. A Global Deal for Nature: Guiding principles, milestones, and targets. Sci. Adv. 2019, 5, 1–18. [Google Scholar] [CrossRef] [Green Version]
  15. Wilson, E.O. Half-Earth: Our Planet’s Fight for Life; Liveright: New York, NY, USA, 2016; ISBN 9781631490828. [Google Scholar]
  16. Locke, H. Nature Needs (at least) Half: A Necessary New Agenda for Protected Areas. In Protecting the Wild; Wuerthner, G., Crist, E.B.T., Eds.; Island Press: Washington, DC, USA, 2015; pp. 3–15. ISBN 978-1-59726-111-1. [Google Scholar]
  17. Dinerstein, E.; Olson, D.; Joshi, A.; Vynne, C.; Burgess, N.D.; Wikramanayake, E.; Hahn, N.; Palminteri, S.; Hedao, P.; Noss, R.; et al. An Ecoregion-Based Approach to Protecting Half the Terrestrial Realm. Bioscience 2017, 67, 534–545. [Google Scholar] [CrossRef] [PubMed]
  18. Barnes, M.D.; Glew, L.; Wyborn, C.; Craigie, I.D. Prevent perverse outcomes from global protected area policy. Nat. Ecol. Evol. 2018, 2, 759–762. [Google Scholar] [CrossRef] [PubMed]
  19. Visconti, P.; Butchart, S.H.M.; Brooks, T.M.; Langhammer, P.F.; Marnewick, D.; Vergara, S.; Yanosky, A.; Watson, J.E.M. Protected area targets post-2020. Science 2019, 364, 239–241. [Google Scholar] [CrossRef] [PubMed] [Green Version]
  20. Geldmann, J.; Barnes, M.; Coad, L.; Craigie, I.D.; Hockings, M.; Burgess, N.D. Effectiveness of terrestrial protected areas in reducing habitat loss and population declines. Biol. Conserv. 2013, 161, 230–238. [Google Scholar] [CrossRef]
  21. Geldmann, J.; Coad, L.; Barnes, M.D.; Craigie, I.D.; Woodley, S.; Balmford, A.; Brooks, T.M.; Hockings, M.; Knights, K.; Mascia, M.B.; et al. A global analysis of management capacity and ecological outcomes in terrestrial protected areas. Conserv. Lett. 2018, 11, 1–10. [Google Scholar] [CrossRef]
  22. Santini, L.; Saura, S.; Rondinini, C. Connectivity of the global network of protected areas. Divers. Distrib. 2015, 199–211. [Google Scholar] [CrossRef] [Green Version]
  23. Saura, S.; Estreguil, C.; Mouton, C.; Rodríguez-Freire, M. Network analysis to assess landscape connectivity trends: Application to European forests (1990–2000). Ecol. Indic. 2011, 11, 407–416. [Google Scholar] [CrossRef]
  24. Saura, S.; Bastin, L.; Battistella, L.; Mandrici, A.; Dubois, G. Protected areas in the world’s ecoregions: How well connected are they? Ecol. Indic. 2017, 76, 144–158. [Google Scholar] [CrossRef]
  25. Saura, S.; Bertzky, B.; Bastin, L.; Battistella, L.; Mandrici, A.; Dubois, G. Protected area connectivity: Shortfalls in global targets and country-level priorities. Biol. Conserv. 2018, 219, 53–67. [Google Scholar] [CrossRef] [PubMed]
  26. Saura, S.; Bertzky, B.; Bastin, L.; Battistella, L.; Mandrici, A.; Dubois, G. Global trends in protected area connectivity from 2010 to 2018. Biol. Conserv. 2019, 238, 108183. [Google Scholar] [CrossRef] [PubMed]
  27. Sayre, R.; Karagulle, D.; Frye, C.; Boucher, T.; Wolff, N.H.; Breyer, S.; Wright, D.; Martin, M.; Butler, K.; Van Graafeiland, K.; et al. An assessment of the representation of ecosystems in global protected areas using new maps of World Climate Regions and World Ecosystems. Glob. Ecol. Conserv. 2020, 21, e00860. [Google Scholar] [CrossRef]
  28. Naidoo, R.; Brennan, A. Connectivity of protected areas must consider landscape heterogeneity: A response to Saura et al. Biol. Conserv. 2019, 239, 108316. [Google Scholar] [CrossRef]
  29. Visconti, P.; Di Marco, M.; Álvarez-Romero, J.G.; Januchowski-Hartley, S.R.; Pressey, R.L.; Weeks, R.; Rondinini, C. Effects of errors and gaps in spatial data sets on assessment of conservation progress. Conserv. Biol. 2013, 27, 1000–1010. [Google Scholar] [CrossRef]
  30. Stolton, S.; Redford, K.H.; Dudley, N. The Futures of Privately Protected Areas; UICN: Gland, Switzerland, 2014; ISBN 978-2-8317-1675. [Google Scholar]
  31. You, Z.; Hu, J.; Wei, Q.; Li, C.; Deng, X.; Jiang, Z. Pitfall of big databases. Proc. Natl. Acad. Sci. USA 2018, 115, E9026–E9028. [Google Scholar] [CrossRef] [Green Version]
  32. Bargelt, L.; Fortin, M.J.; Murray, D.L. Assessing connectivity and the contribution of private lands to protected area networks in the United States. PLoS ONE 2020, 15, e0228946. [Google Scholar] [CrossRef] [Green Version]
  33. Baldwin, R.F.; Fouch, N.T. Understanding the biodiversity contributions of small protected areas presents many challenges. Land 2018, 7, 123. [Google Scholar] [CrossRef] [Green Version]
  34. FAO. GeoNetwork: Global Administrative Unit Layers. Available online: http://www.fao.org/geonetwork/srv/en/metadata.show?id=12691 (accessed on 20 November 2019).
  35. Butler, R.A. The Top 10 Most Biodiverse Countries—What Are the World’s Most Biodiverse Countries? Available online: https://news.mongabay.com/2016/05/top-10-biodiverse-countries/ (accessed on 29 April 2020).
  36. Myers, N.; Mittermeier, R.A.; Mittermeier, C.G.; Fonseca, G.A.B.; da Kent, J. Biodiversity hotspots for conservation priorities. Nature 2000, 403, 853–858. [Google Scholar] [CrossRef]
  37. Dudley, N. Directrices Para la Aplicación de las Categorías de Gestión de Áreas Protegidas; UICN: Gland, Switzerland, 2008; ISBN 978-2-8317-1088-4. [Google Scholar]
  38. Olson, D.M.; Dinerstein, E.; Wikramanayake, E.D.; Burgess, N.D.; Powell, G.V.N.; Underwood, E.C.; D’amico, J.A.; Itoua, I.; Strand, H.E.; Morrison, J.C.; et al. Terrestrial Ecoregions of the World: A New Map of Life on Earth. Bioscience 2001, 51, 933. [Google Scholar] [CrossRef]
  39. Sierra, R. A transnational perspective on national protected areas and ecoregions in the Tropical Andean Countries. In Globalization and New Geographies of Conservation; Zimmerer, K.S., Ed.; The University of Chicago Press: Chicago, IL, USA; London, UK, 2006. [Google Scholar]
  40. Shanee, S.; Shanee, N.; Monteferri, B.; Allgas, N.; Alarcon Pardo, A.; Horwich, R.H. Protected area coverage of threatened vertebrates and ecoregions in Peru: Comparison of communal, private and state reserves. J. Environ. Manag. 2017, 202, 12–20. [Google Scholar] [CrossRef] [Green Version]
  41. Butchart, S.H.M.; Clarke, M.; Smith, R.J.; Sykes, R.E.; Scharlemann, J.P.W.; Harfoot, M.; Buchanan, G.M.; Angulo, A.; Balmford, A.; Bertzky, B.; et al. Shortfalls and Solutions for Meeting National and Global Conservation Area Targets. Conserv. Lett. 2015, 8, 329–337. [Google Scholar] [CrossRef]
  42. Saura, S.; Pascual-Hortal, L. A new habitat availability index to integrate connectivity in landscape conservation planning: Comparison with existing indices and application to a case study. Landsc. Urban Plan. 2007, 83, 91–103. [Google Scholar] [CrossRef]
  43. Golden Kroner, R.E.; Qin, S.; Cook, C.N.; Krithivasan, R.; Pack, S.M.; Bonilla, O.D.; Cort-kansinally, K.A.; Coutinho, B.; Feng, M.; Garcia Martínez, M.I.; et al. The uncertain future of protected lands and waters. Science 2019, 364, 881–886. [Google Scholar] [CrossRef] [PubMed]
  44. Hilty, J.A.; Keeley, A.T.H.; Lidicker, W.Z., Jr.; Merenlender, A.M. Corridor Ecology: Linking Landscapes for Biodiversity Conservation and Climate Adaptation; Island Press: Washington, DC, USA, 2019. [Google Scholar]
  45. Sutherland, G.D.; Harestad, A.S.; Price, K.; Lertzman, K.P. Scaling of natal dispersal distances in terrestrial birds and mammals. Ecol. Soc. 2000, 4. [Google Scholar] [CrossRef]
  46. Gonzalez-Borrajo, N.; López-Bao, J.V.; Palomares, F. Spatial ecology of jaguars, pumas, and ocelots: A review of the state of knowledge. Mamm. Rev. 2017, 47, 62–75. [Google Scholar] [CrossRef] [Green Version]
  47. Maehr, D.S.; Land, E.D.; Shindle, D.B.; Bass, O.L.; Hoctor, T.S. Florida panther dispersal and conservation. Biol. Conserv. 2002, 106, 187–197. [Google Scholar] [CrossRef]
  48. Venter, O.; Sanderson, E.W.; Magrach, A.; Allan, J.R.; Beher, J.; Jones, K.R.; Possingham, H.P.; Laurance, W.F.; Wood, P.; Fekete, B.M.; et al. Sixteen years of change in the global terrestrial human footprint and implications for biodiversity conservation. Nat. Commun. 2016, 7, 1–11. [Google Scholar] [CrossRef] [Green Version]
  49. Baldwin, R.F.; Perkl, R.M.; Trombulak, S.C.; Burwell, W.B. Modeling Ecoregional Connectivity. In Landscape-Scale Conservation Planning; Trombulak, S.C., Baldwin, R.F., Eds.; Springer: Berlin, Germany, 2010; pp. 349–367. ISBN 9789048195749. [Google Scholar]
  50. Alagador, D.; Triviño, M.; Cerdeira, J.O.; Brás, R.; Cabeza, M.; Araújo, M.B. Linking like with like: Optimising connectivity between environmentally-similar habitats. Landsc. Ecol. 2012, 27, 291–301. [Google Scholar] [CrossRef] [Green Version]
  51. Correa-Ayram, C.A.; Mendoza, M.E.; Etter, A.; Pérez Salicrup, D.R. Anthropogenic impact on habitat connectivity: A multidimensional human footprint index evaluated in a highly biodiverse landscape of Mexico. Ecol. Indic. 2017, 72, 895–909. [Google Scholar] [CrossRef]
  52. Belote, R.T.; Dietz, M.S.; McRae, B.H.; Theobald, D.M.; McClure, M.L.; Irwin, G.H.; McKinley, P.S.; Gage, J.A.; Aplet, G.H. Identifying corridors among large protected areas in the United States. PLoS ONE 2016, 11, e0154223. [Google Scholar] [CrossRef] [Green Version]
  53. Chapin III, F.S.; Matson, P.A.; Vitousek, P.M. Landscape Heterogeneity and Ecosystem Dynamics. In Principles of Terrestrial Ecosystem Ecology; Springer: New York, NY, USA, 2011; pp. 369–397. ISBN 978-1-4419-9504-9. [Google Scholar]
  54. Godínez-Gómez, O.; Correa-Ayram, C. Makurhini: Analyzing landscape connectivity. Zenodo 2020. [Google Scholar] [CrossRef]
  55. Fox, J.; Weisberg, S. An R Companion to Applied Regression, 3rd ed.; Sage: Thousand Oaks, CA, USA, 2019. [Google Scholar]
  56. Dudley, N.; Jonas, H.; Nelson, F.; Parrish, J.; Pyhälä, A.; Stolton, S.; Watson, J.E.M. The essential role of other effective area-based conservation measures in achieving big bold conservation targets. Glob. Ecol. Conserv. 2018, 15, 1–7. [Google Scholar] [CrossRef]
  57. UNEP-WCMC. IUCN Protected Planet: Argentina, Bolivia, Brasil, Chile, Colombia, Ecuador, Guyana, Panamá, Paraguay, Perú, Venezuela; The World Database on Protected Areas (WDPA) [on-line], [Nov/2019]. Cambridge, UK. Available online: https://www.protectedplanet.net/ (accessed on 26 June 2020).
  58. Redparques Pronatura México. Progreso del cumplimiento de la Meta 11 de Aichi en los Países de la Redparques: Resultados y Perspectivas al 2020; Convention on Biological Diversity (CBD): Bogotá, Colombia, 2018. [Google Scholar]
  59. UNEP-WCMC. Manual de Usuario para la Base de Datos Mundial Sobre Áreas Protegidas y Base de Datos Mundial Sobre Otras Medidas Eficaces de Conservación Basadas en Áreas: 1.6; UNEP-WCMC: Cambridge, UK, 2020. [Google Scholar]
  60. Clements, H.S.; Selinske, M.J.; Archibald, C.L.; Cooke, B.; Fitzsimons, J.A.; Groce, J.E.; Torabi, N.; Hardy, M.J. Fairness and transparency are required for the inclusion of privately protected areas in publicly accessible conservation databases. Land 2018, 7, 96. [Google Scholar] [CrossRef] [Green Version]
  61. Pressey, R.L.; Cabeza, M.; Watts, M.E.; Cowling, R.M.; Wilson, K.A. Conservation planning in a changing world. Trends Ecol. Evol. 2007, 22, 583–592. [Google Scholar] [CrossRef] [PubMed]
  62. Franklin, J.F. Preserving Biodiversity: Species, Ecosystems, or Landscapes? Ecol. Appl. 1993, 3, 202–205. [Google Scholar] [CrossRef] [PubMed] [Green Version]
  63. Fischer, J.; Fazey, I.; Briese, R.; Lindenmayer, D.B. Making the matrix matter: Challenges in Australian grazing landscapes. Biodivers. Conserv. 2005, 14, 561–578. [Google Scholar] [CrossRef]
  64. Matallana Tobón, C.L.; Santamaría, M.; Areiza, A.; Solano, C.; Galán, S. Rethinking nature conservation in Colombia: A case study of other effective area—Based conservation measures. Parks 2018, 24, 89–98. [Google Scholar] [CrossRef]
  65. Margules, C.R.; Pressey, R.L. Systematic conservation planning. Nature 2000, 405, 243–253. [Google Scholar] [CrossRef]
  66. Venter, O.; Magrach, A.; Outram, N.; Klein, C.J.; Possingham, H.P.; Di Marco, M.; Watson, J.E.M. Bias in protected-area location and its effects on long-term aspirations of biodiversity conventions. Conserv. Biol. 2018, 32, 127–134. [Google Scholar] [CrossRef]
  67. Jenkins, C.N.; Van Houtan, K.S.; Pimm, S.L.; Sexton, J.O. US protected lands mismatch biodiversity priorities. Proc. Natl. Acad. Sci. USA 2015, 112, 5081–5086. [Google Scholar] [CrossRef] [PubMed] [Green Version]
  68. Miles, L.; Newton, A.C.; DeFries, R.S.; Ravilious, C.; May, I.; Blyth, S.; Kapos, V.; Gordon, J.E. A global overview of the conservation status of tropical dry forests. J. Biogeogr. 2006, 33, 491–505. [Google Scholar] [CrossRef]
  69. Portillo-Quintero, C.A.; Sánchez-Azofeifa, G.A. Extent and conservation of tropical dry forests in the Americas. Biol. Conserv. 2010, 143, 144–155. [Google Scholar] [CrossRef]
  70. Areiza, A.; Corzo, G.; Castillo, L.S.; Matallana, C.; Correa-Ayram, C.A. Áreas protegidas regionales y reservas privadas: Las protagonistas de las últimas décadas. In Biodiversidad 2018. Estado y Tendencias de la Biodiversidad Continental de Colombia; Moreno, L.A., Andrade, G.I., Goméz, M.F., Eds.; Instituto de Investigación de Recursos Biológicos Alexander von Humboldt: Bogotá, Colombia, 2019; ISBN 978-958-5418-63-9. [Google Scholar]
  71. SERNANP GEO ANP—Visor De Las Áreas Naturales Protegidas del Perú. Available online: http://geo.sernanp.gob.pe/visorsernanp/# (accessed on 30 May 2020).
  72. Armsworth, P.R.; Cantú-Salazar, L.; Parnell, M.; Davies, Z.G.; Stoneman, R. Management costs for small protected areas and economies of scale in habitat conservation. Biol. Conserv. 2011, 144, 423–429. [Google Scholar] [CrossRef] [Green Version]
  73. Larson, L.R.; Jennings, V.; Cloutier, S.A. Public parks and wellbeing in urban areas of the United States. PLoS ONE 2016, 11, e0153211. [Google Scholar] [CrossRef]
Figure 1. Linear test hypothesis (lth) for the 1:1 relationship between ProtConnEu and ProtConnCD. Dispersal distances refer to: (a) dmed = 1 km, (b) dmed = 5 km, (c) dmed = 10 km (d) dmed = 30 km, (e) dmed = 50 km, and (f) dmed = 70 km. The black continuous line denotes the 1:1 expected slope at each dmed0,1) and the blue continuous line the regressed slope between ProtConnEu and ProtConnCD values. Confidence intervals of the regressions are shown in blue hatched lines.
Land 09 00239 g001
Figure 2. TAC Ecoregion’s coverage (%) of protected areas (dark green: protected and connected land—ProtConnCD, and light green: protected but not connected land—ProtUnconnCD). dmed = 10 km. Prot = ProtConnCD + ProtUnconnCD. Global targets (17%, 30%, and 50%) are marked in dotted lines.
Land 09 00239 g002
Figure 3. Ecoregion’s PA representation and connectivity (dmed = 10 km) in Tropical Andean Countries: (a) protected land (Prot), (b) protected and connected land (ProtConnEu), (c) ProtConnCD, (d) ProtConnCD without subnational protected areas. The gray background represents continental America. Black lines are the TAC countries’ terrestrial borders. Geospatial data are available for download from https://doi.org/10.6084/m9.figshare.12568502.
Land 09 00239 g003
Table 1. Tropical Andean Countries (TAC) national and subnational protected areas (PAs): count, extension, and terrestrial coverage.
TAC CountryNational Extent 1 (Mha)No. PA 2No. Subnal. PA 2PA Extent 1 (Mha)Subnal. PA Extent 1 (Mha)Subnal. Contrib. to PA Extent (%)Protected Land (Prot) (%)
Our Study 1WDPA 3Redpar-Ques 4
Bolivia108.913211029.512.441.927.130.930.9
Colombia114.41154103718.43.116.716.114.815.9
Ecuador24.71701227.73.647.031.121.820.2
Perú129.823115122.03.516.017.021.516.9
Venezuela90.488020.90.00.023.154.154.1
TAC468.31775142098.522.622.9 21.0
1 Calculated by Mollweide geographical projections; only terrestrial extensions. 2 Database updated in November 2019. 3 Calculations by the World Database of Protected Areas (WDPA) based on official data reported until November 2019 [57]. WDPA acknowledges that differences can exist between national and WDPA cover calculations due to the use of different measurement methods, base map layers, data quality, and PA definitions. 4 Information compiled by Redparques in June 2018 from different official reports (e.g., WDPA, Convention on Biological Diversity (CBD), among others) [58]. Subnal.: Subnational; contrib.: contribution.
Table 2. Number of ecoregions and TAC extension that meet the 17%, 30%, or 50% global targets: connectivity evaluations (dmed = 10 km) and subnational contributions.
Category (% of Ecoregion Area)ProtProtConnEuProtConnCDProtConnCD without Subnal.
No. Ecoreg.Ext. (%)No. Ecoreg.Ext. (%)No. Ecoreg.Ext. (%)No. Ecoreg.Ext. (%)
Omission (<1)20.720.720.752.0
Insufficient for all targets (1–6.9)3245.14573.24774.54679.9
Sufficient for Aichi 11 (17–29.9)1736.2712.9613.058.3
Sufficient for GDN (30–49.9)812.0811.7811.379.4
Sufficient for all targets (≥50)85.951.440.540.5
No.: Number; Ext.: TAC extension; Subnal.: Subnational.

