Green Stormwater Infrastructure Planning in Urban Landscapes: Understanding Context, Appearance, Meaning, and Perception


1
Department of Geography, Planning, and Sustainability, School of Earth and Environment, Rowan University, Glassboro, NJ 08028, USA
2
Department of Management and Entrepreneurship, Rohrer College of Business, Rowan University, Glassboro, NJ 08028, USA
3
Community Planning + Visualization Lab, School of Earth and Environment, Rowan University, Glassboro, NJ 08028, USA
*
Author to whom correspondence should be addressed.
Land 2020, 9(12), 534; https://doi.org/10.3390/land9120534
Submission received: 12 November 2020
/
Revised: 11 December 2020
/
Accepted: 17 December 2020
/
Published: 21 December 2020
(This article belongs to the Section Land Planning and Landscape Architecture)
Abstract
:Prior research has documented environmental and economic benefits of green stormwater infrastructure (GSI); literature on GSI social benefits is also becoming more prevalent among scholars around the world. This paper aims to understand whether GSI projects are considered as assets to urban neighborhoods or as projects that might introduce a new set of social concerns. Based on field observations of 238 GSI projects and 50 intercept interviews, we investigate selected social aspects of GSI, such as project context, visual appearance, recreational appeal, meaning, and public perception, in two neighboring US cities—Philadelphia and Camden. Analysis of field data and observation notes revealed that GSI project setting impacted recreational appeal; their appearance was related to maintenance and signage; and their interaction with the public depended on location, land use, and visual/recreational appeal. Most GSI sites with the presence of trash, but the absence of signage were found in potentially disadvantaged areas. According to intercept interviews, many people were not aware of GSI presence in the neighborhood, were not familiar with GSI or its functionality, did not find a way to get access to GSI or interact with them, and were generally concerned about poor design, defective construction, or lack of maintenance. We argue that lack of information and community care/support for GSI can result in social disinvestments in these projects, which can facilitate improper use and maintenance issues, affecting their intended basic environmental functions. Consistent with prior research, we speak to the importance of participatory planning processes in improving community acceptance and interests around GSI planning and installation in urban landscapes.
1. Introduction
Green stormwater infrastructure (GSI) has the potential to mitigate a considerable amount of runoff from storms and flooding, whilst simultaneously improving the aesthetic and ecological performance of an urban built environment [1]. A growing number of cities in the USA, as well as around the world, are leveraging “vegetation as a cost-effective means of mitigating the volume of stormwater and are increasingly allocating stormwater management funding to ‘green’ as opposed to ‘grey’ infrastructure projects” [2] (p. 1). GSI projects may provide environmental benefits of improved air quality and reduced heat island effects; economic benefits of increased property values and lower expansion costs than comparable gray infrastructure; and social benefits to promote a sense of community, public health, and mental health [3]. Unsurprisingly, these projects are becoming increasingly common in post-industrial urban neighborhoods characterized by vacant lands and marginalized communities, older cities with combined sewer systems (CSS), shrinking cities, high-density cities, or cities experiencing extreme and frequent storm events in recent years [4,5,6].
Prior research has documented environmental and economic benefits of GSI projects including, but not limited to, reduced stormwater runoff and flooding, increased water quality, and reduced energy consumption [7,8,9,10,11,12,13,14,15]. Literature on the social benefits and equitable placement of GSI is emerging and becoming more prevalent among scholars all over the world [16,17,18,19,20]. While GSI projects such as rain gardens, bioswales, stormwater bumpouts, and tree trenches are considered an environment friendly approach to managing stormwater, it is not without its challenges [21,22,23]. In particular, there is a lack of understanding on whether or not urban residents view GSI as an asset to their neighborhood and realize the benefits they offer to residents. Understanding the connection between GSI and surrounding built and social environments, as well as GSI public perception, can influence the perceived success and future public support for GSI projects [2].
This article explores some of the social aspects associated with GSI and public perceptions of GSI context, appearance, and meaning. GSI occupies an ambiguous position in the urban landscape—it is not ‘purely’ infrastructure, like storm drains and sewer lines might be, nor is it entirely ‘aesthetic’ as a designed green space might be. GSI serves both roles, simultaneously, and by design. While this dual nature of GSI is part of what makes it attractive to policymakers, planners, environmental engineers, landscape architects, and urban designers, appreciating GSI in this way requires some knowledge of both the problems and responses associated with urban stormwater management. It is not always the case that urban residents living near a particular GSI installation will have this knowledge or appreciation. It is, therefore, important to understand whether GSI is considered an asset for a neighborhood or as something that attracts a new set of social and environmental concerns.
In this study, we examined GSI projects in two adjacent cities in northeast USA, Philadelphia and Camden, separated by Delaware River. In order to understand GSI appearance, performance, and obstacles, we conducted extensive field observations of GSI projects in Philadelphia (n = 183) and Camden (n = 55), and collected data on social aspects such as project setting, surrounding environment, social use and interaction, appearance, and recreational appeal. We also conducted 50 intercept interviews of people living or working in these neighborhoods to understand public perceptions of GSI social aspects. Based on a qualitative content analysis of field data, observation notes, and interview transcripts, we identified what community-based aspects of these projects could impact their ability to reach their full potential and formulated recommendations to ensure their longevity and productivity.
We start this article with a literature review on various social aspects of GSI such as community benefits, community perception, and community health and well-being. Next, we provide contextual background of the study and discuss the methodology, explaining data collection and processing through field observations. This is followed by results and discussion presenting findings and their potential implications in GSI planning along with a reflection on study limitations. We conclude by discussing potential future research directions.
2. Literature Review
There is a robust literature examining GSI in the USA and around the world. Our literature review focuses on the research examining stakeholder perceptions of GSI, as opposed to some of the more technically-oriented research examining impacts on stormwater flow, infiltration, remediation, and so forth. We have also largely avoided the literature considering institutional impediments of GSI [24,25] or site selection, placement, and equitable distribution of GSI features within the urban environment [2,18]. The connection between GSI and equitable distribution or environmental justice is part of GSI social aspects, but such topics are not the main focus of this paper.
Prior studies have pointed to the potential for GSI to improve health and safety outcomes for residents of the communities in which they are involved, through the provision of benefits commonly associated with other forms of “green space” such as parks and trails [20,26]. Kondo et al. have found that in certain contexts, GSI projects have reduced instances of illegal drug dealing and physical violence in the neighborhoods in which they were installed [26]. Yet, a number of studies have also highlighted the challenges in convincing stakeholders about the benefits of GSI projects. Flynn and Davidson, for instance, argued that the benefits of GSI are so many, and the potential configurations of any particular installation so numerous, that even among engineering and policy stakeholders it can be challenging to reach a decision [27]. They have observed the growing popularity of GSI systems across municipalities but emphasized the continued need for a more sophisticated understanding of how GSI technologies bring about popular outcomes [27]. Care must be taken to specifically map the design and attributes of a particular GSI project to a particular desired outcome.
An important study in this arena is that conducted by Everett et al., focusing specifically on bioswales. They centered their study specifically on residents’ perceptions of GSI in Portland, Oregon, USA. The authors observed that:
“Understanding community perceptions [of GSI] is especially important because, in contrast to much hidden grey infrastructure, [GSI] often changes the visible urban environment, involving shifts in what flood risk management and water treatment involves and looks like…Furthermore, agendas and funds for their installation and maintenance are often subject to residential scrutiny. For example, in Portland, Oregon, the residents’ sewer and water fees are used to install and maintain bioswales, opening up debate regarding the effectiveness of [GSI] to ratepayers.”[28] (p. S974)
The authors found that key factors in residents’ acceptance of bioswales, particularly those along road margins, were premised on their aesthetic appearance and in particular their maintenance and upkeep and the removal of litter that had accrued over time. Residents were also aware of the types of plants used in the bioswales, and whether they found them attractive or not. The authors found very few residents appreciated bioswales for their stormwater management capabilities or were even aware of this specific role for the installations—though, once the research team informed study participants about this role and how it could mitigate flooding and water pollution, many participants immediately accepted these as positive attributes of GSI installations.
Turner et al. examined resident perspectives of GSI projects in a Cleveland, Ohio, USA suburb that was looking to implement projects on residents’ properties, including rain gardens, rain barrels, and bioretention gardens [22]. The authors found that attitudes toward GSI projects were related, in part, to other landscaping choices on their property and in their neighborhood. Residents were more accepting of GSI projects if they were perceived to “fit in” with their existing regime for property management and would not require additional resident labor. Furthermore, the authors found that residents were generally speaking moderately opposed to GSI installations unless they were perceived to contribute positively to property values. Similar findings were reported by Barnhill and Smardon, who in their study of GSI stakeholders in Syracuse, New York, USA, found that people were most concerned with potential costs, unanticipated impacts, and the potential scale of GSI installations [16]. Relatedly, many scholars have studied strategies for GSI planning to identify the highest-impact installation sites, wherein benefits of a project might be most easily explained to residents [29,30].
It is perhaps not surprising that most residents living near GSI installations considered these projects primarily in practical terms—how does this impact day-to-day life?—as opposed to intellectual undertakings intending to re-introduce flora and fauna into urban environments. Nevertheless, it is clear that GSI projects are in many instances re-introducing pieces of the natural world into the built environment. One approach to overcoming this challenge has been pitching GSI as “small-scale nature” or “environmental learning tools.” Church [31](p. 229), in another study of residents in Portland, Oregon, USA, observed that while “sustainable stormwater management facilities have potential toward aiding in stormwater awareness, particularly if combined with additional ways of learning (e.g., informational signs) … participant perceptions of Green Streets as small-scale nature are less straight forward.” Residents could in many instances become educated about the benefits of GSI, but only insofar as they came to understand these installations as components of urban stormwater infrastructure. Church noted that it was more challenging to find strategies for helping residents understand GSI as nature, and thus tools for learning about human-environment interactions, though the author noted that this was a promising area for future explorations of environmental education strategies. This is interesting, because the studies outlined above all observed that the outreach efforts undertaken by municipal authorities have tended to emphasize the stormwater management aspects of GSI over the “nature” dimensions of these installations—even when residents might prioritize the aesthetic and “natural” attributes of a given GSI installation in forming their opinions of that particular project. Similar studies have been undertaken for other parts of the USA, with similar findings [32].
In some instances, it appears that GSI can introduce “too much” nature back into the urban environment. For instance, Hunold offered another take on perceptions of GSI by examining relationships between urban wildlife and “greened” areas in the city of Philadelphia, USA [23]. Hunold showed that while “greening” and GSI projects were typically celebrated for their ecological impacts, planning practitioners and city officials did not always appreciate the negative impacts of improving urban biodiversity. In reintroducing small-scale nature back into the city, GSI also has the potential to reintroduce wildlife, including many creatures that can cause damage to homes and buildings and potentially adversely impact public health. Hunold highlighted how GSI installations in parts of Philadelphia had been associated with colonies of raccoon and other rodent species, complicating the supposed benefits of bringing nature back into the city and in some instances contributing to negative resident perceptions of GSI projects.
In summary, researchers have started exploring many interesting questions on social and perspectival aspects surrounding GSI: Do these projects provide much-needed “green spaces” in dense urban neighborhoods or do they bring “too much green” along the way? Are the stakeholders (community residents) convinced about GSI cost and benefits? Do these projects add aesthetic values to neighborhoods? What are the common resident perceptions of urban GSI? What do residents feel about GSI maintenance and relevant issues? How do these projects affect day-to-day life of residents? As most researchers argued, there is a need to further explore these questions, ask new questions, and expand this emerging line of inquiry. Some of our research questions, as stated below, were inspired by these questions, but some were new.
- Does project setting matter to increase the recreational appeal of GSI projects?
- Does the appearance of GSI projects depend on maintenance, signage, or visibility?
- Does public perception and interaction depend on GSI project location, surrounding land use, maintenance, signage, recreational features, and visual appeal?
- What factors should GSI planners and designers consider to increase GSI social benefit and acceptance?
We asked these questions because, according to our literature review, understanding recreational and visual appeals of GSI, issues related to maintenance, signage, visibility, and public perception of and interaction with GSI were logical steps toward understanding GSI social factors or benefits. It was important to explore these questions to better understand GSI and its connection with urban physical and social landscapes. These questions, according to our review, were not as well-studied as GSI—equitable placement or GSI—environmental justice topics. We hypothesized that public perception of and interaction with GSI would be relevant to project setting, visual appearance, recreational appeal, visible educational signage, or presence of trash or debris. With this work, we expected to contribute to GSI social benefit literature, as well as GSI planning process.
3. Materials and Methods
3.1. Context
We studied GSI projects in Philadelphia (Pennsylvania) and Camden (New Jersey), located directly across the Delaware River from one another. Many neighborhoods in both cities share a strong history of industrial heritage as well as environmental injustice and are currently characterized by vacant lots, abandoned buildings, poverty, crime, and low educational attainment. Both cities have diverse population groups, although African Americans make up a majority of the population in both cities, with 42.3% in Philadelphia and 42.4% in Camden [33]. There are considerable differences between these two cities as well. Many Philadelphia neighborhoods, for example, are segregated in terms of race, ethnicity, and income inequality [34,35,36]. According to a regional equity analysis performed by the metropolitan planning organization that includes both cities, almost all parts of Camden are potentially disadvantaged but Philadelphia has a combination of wealthy and disadvantaged neighborhoods [37]. Over the last decade, Philadelphia has experienced about 4% population growth, as well as new housing and commercial developments in many parts of the city. Camden’s population has declined by 4%, but some neighborhoods in the city have seen new developments and recreational assets, such as parks and open spaces. Two-thirds of Philadelphia is within a CSS, and Camden in its entirety is a CSS. Both cities face frequent flooding and stormwater runoff issues, often leading to combined sewer overflows (CSO) that pollute local rivers and waterways, as well as city streets. Philadelphia, a leading city in GSI planning and implementation, has recently committed to prioritizing GSI throughout its stormwater management system as a strategy to meet federal requirements and improve urban infrastructure. These cities have collectively installed a few hundred GSI projects with the intention to mitigate stormwater runoff and minimize CSO.
3.2. Methodology and Data
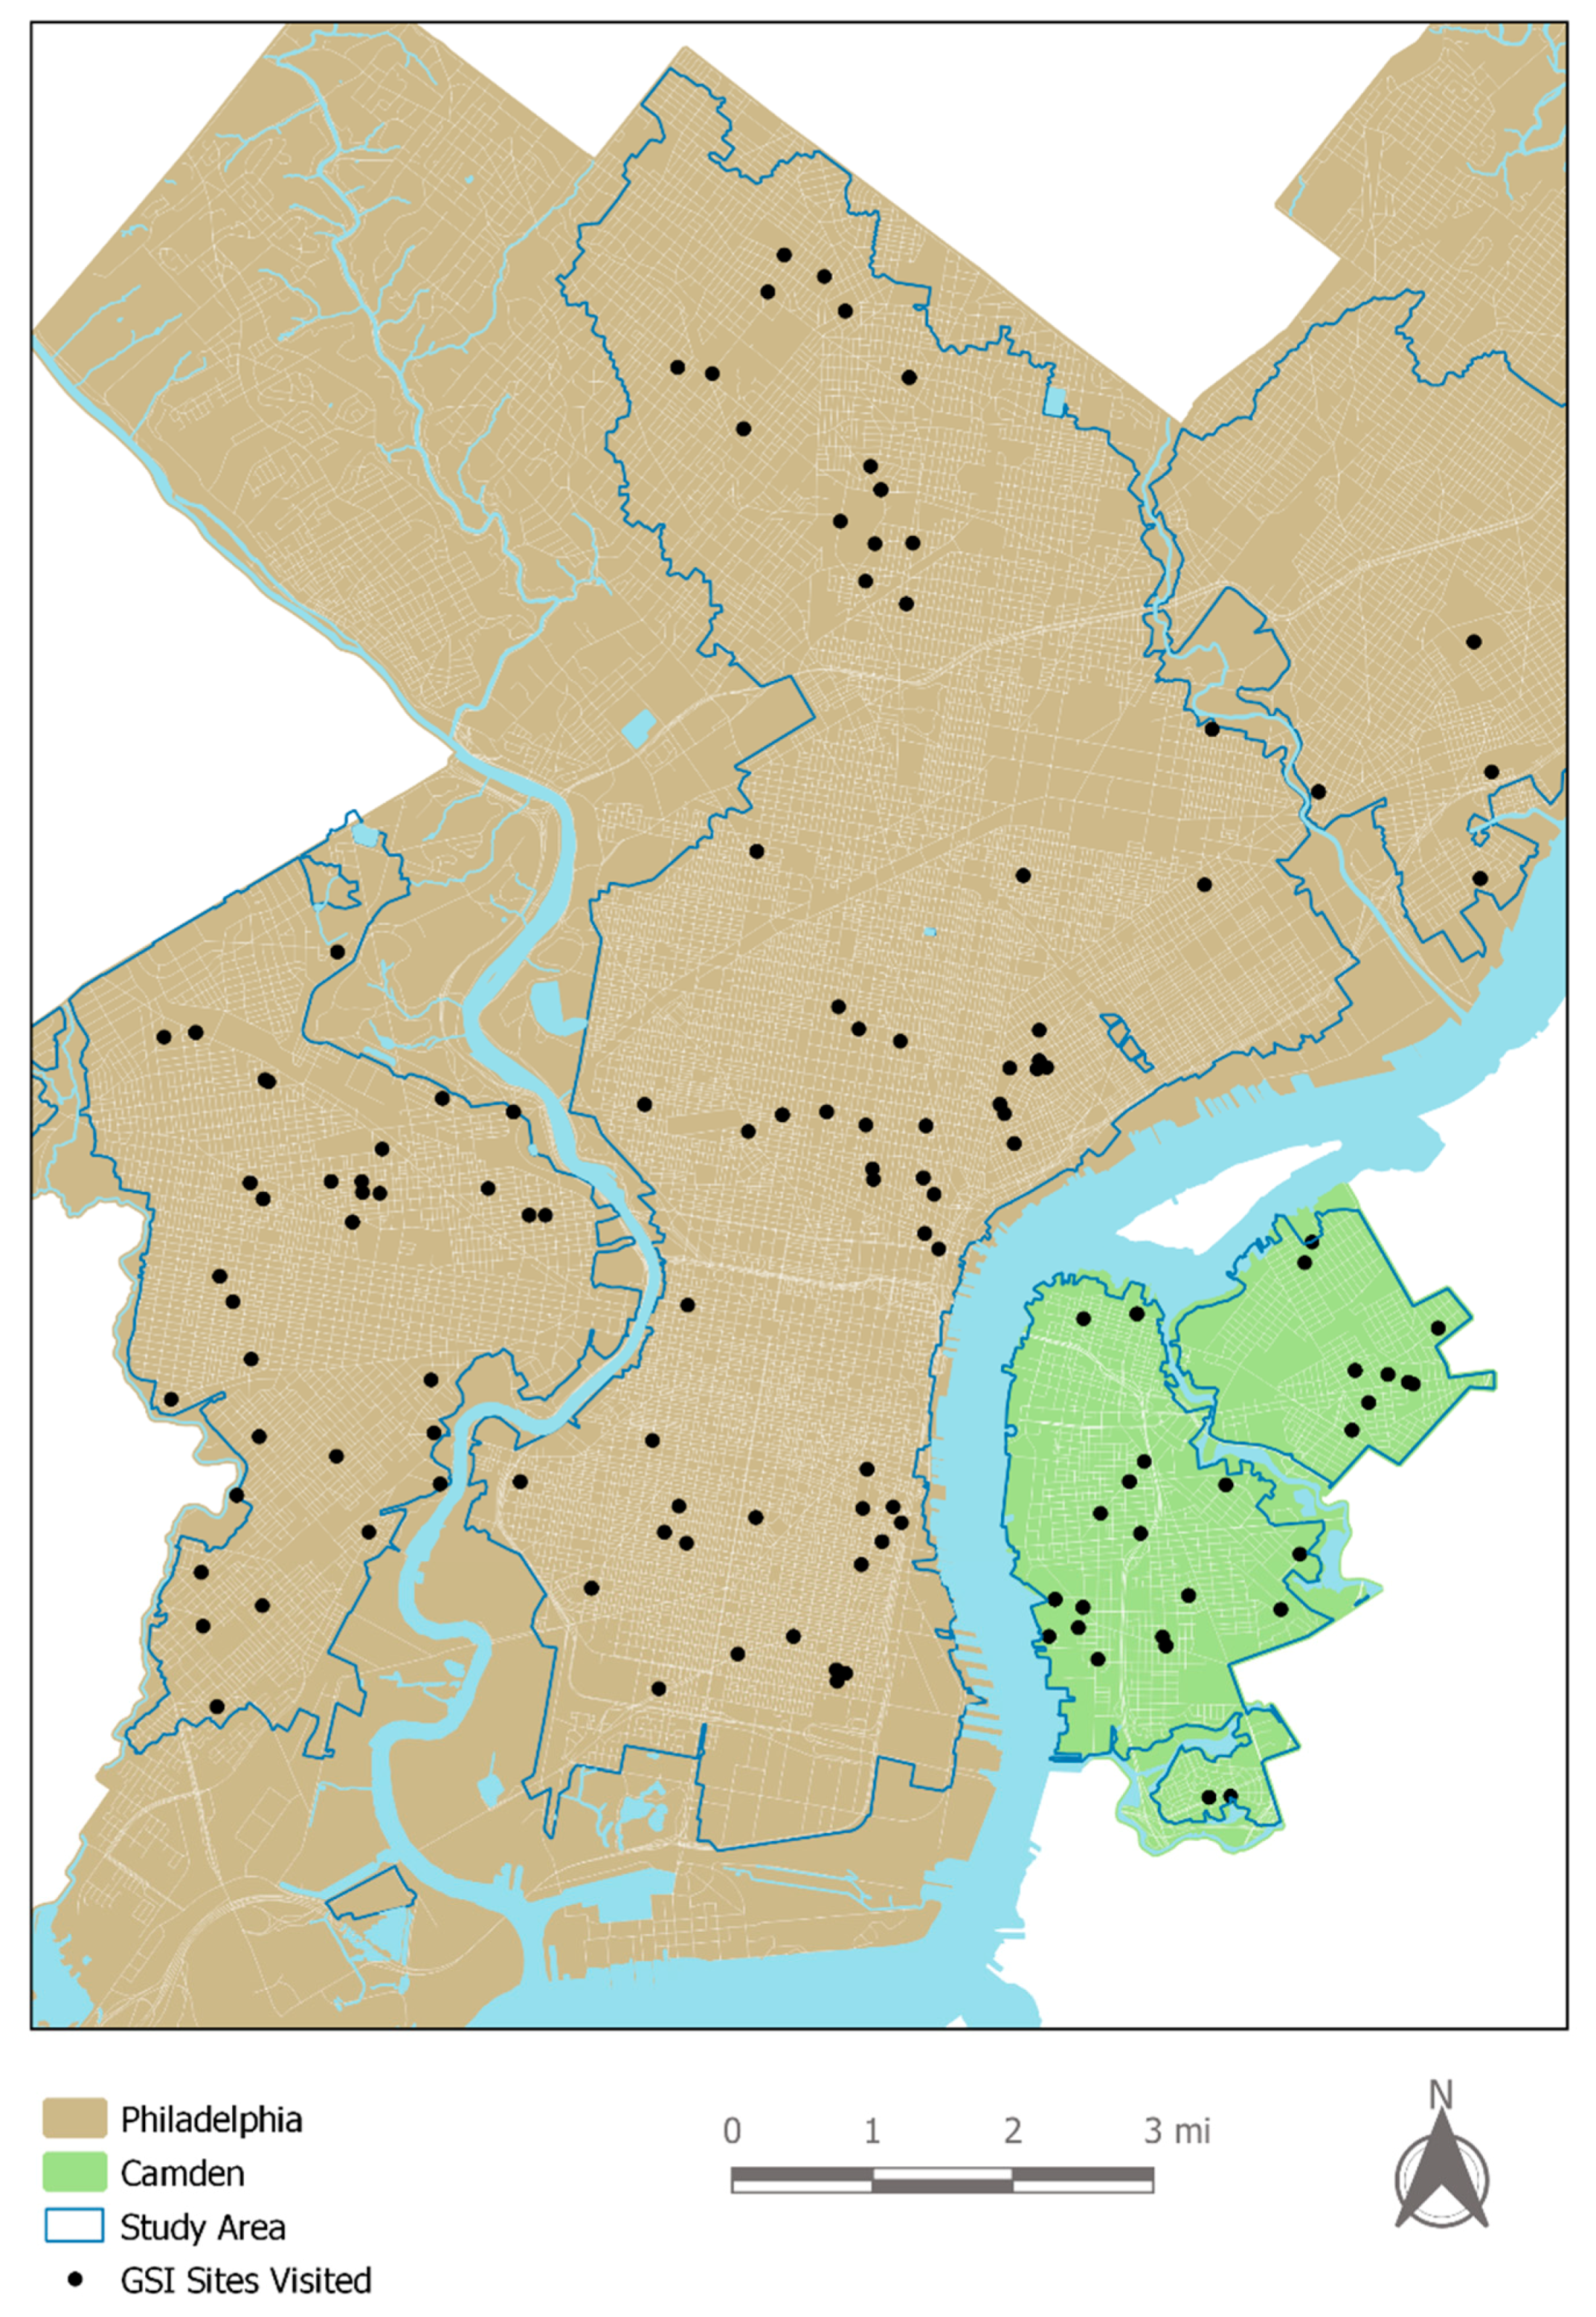
Philadelphia GSI projects were identified and located utilizing the Philadelphia Water Department (PWD) Stormwater Map Viewer (currently archived), which displayed the location of all GSI projects in the city [38]. Using this interactive map, we located 183 public and “completed or closed” GSI projects within the CSS portion of the city. We conducted field observations in early September 2018, over the course of eight separate days. There were 105 different locations visited, many of which included multiple GSI projects, totaling to 183. To identify GSI projects in Camden, we reviewed the city’s Green Infrastructure Project interactive map [39] and selected 55 projects from 29 different locations that were completed at that time. Field observations were conducted on three separate days in mid-September 2018. Figure 1 displays all GSI sites observed in Philadelphia and Camden.
In both cases, when a project site was located and visited in person, we completed a site analysis form. These forms were used to make a Location Analysis spreadsheet, detailing certain aspects of each project for future data analysis. Table 1 presents and describes the data fields included in the Location Analysis spreadsheet. Photographs of each GSI project were captured for future analysis. Each photo was assigned an ID and a name that aligned with the name of the project. Figure 2 includes sample photos of highly visible and well-maintained GSI projects in Philadelphia with visual or recreational appeal. Finally, all GSI projects visited were mapped using geographic information system (GIS). The overall process, from formulating site visit routes, to filling out site analysis forms, to transferring field notes to Microsoft Excel, to taking and labelling photos for each project and adding visited locations to GIS maps, was followed for each site visit day in both cities.
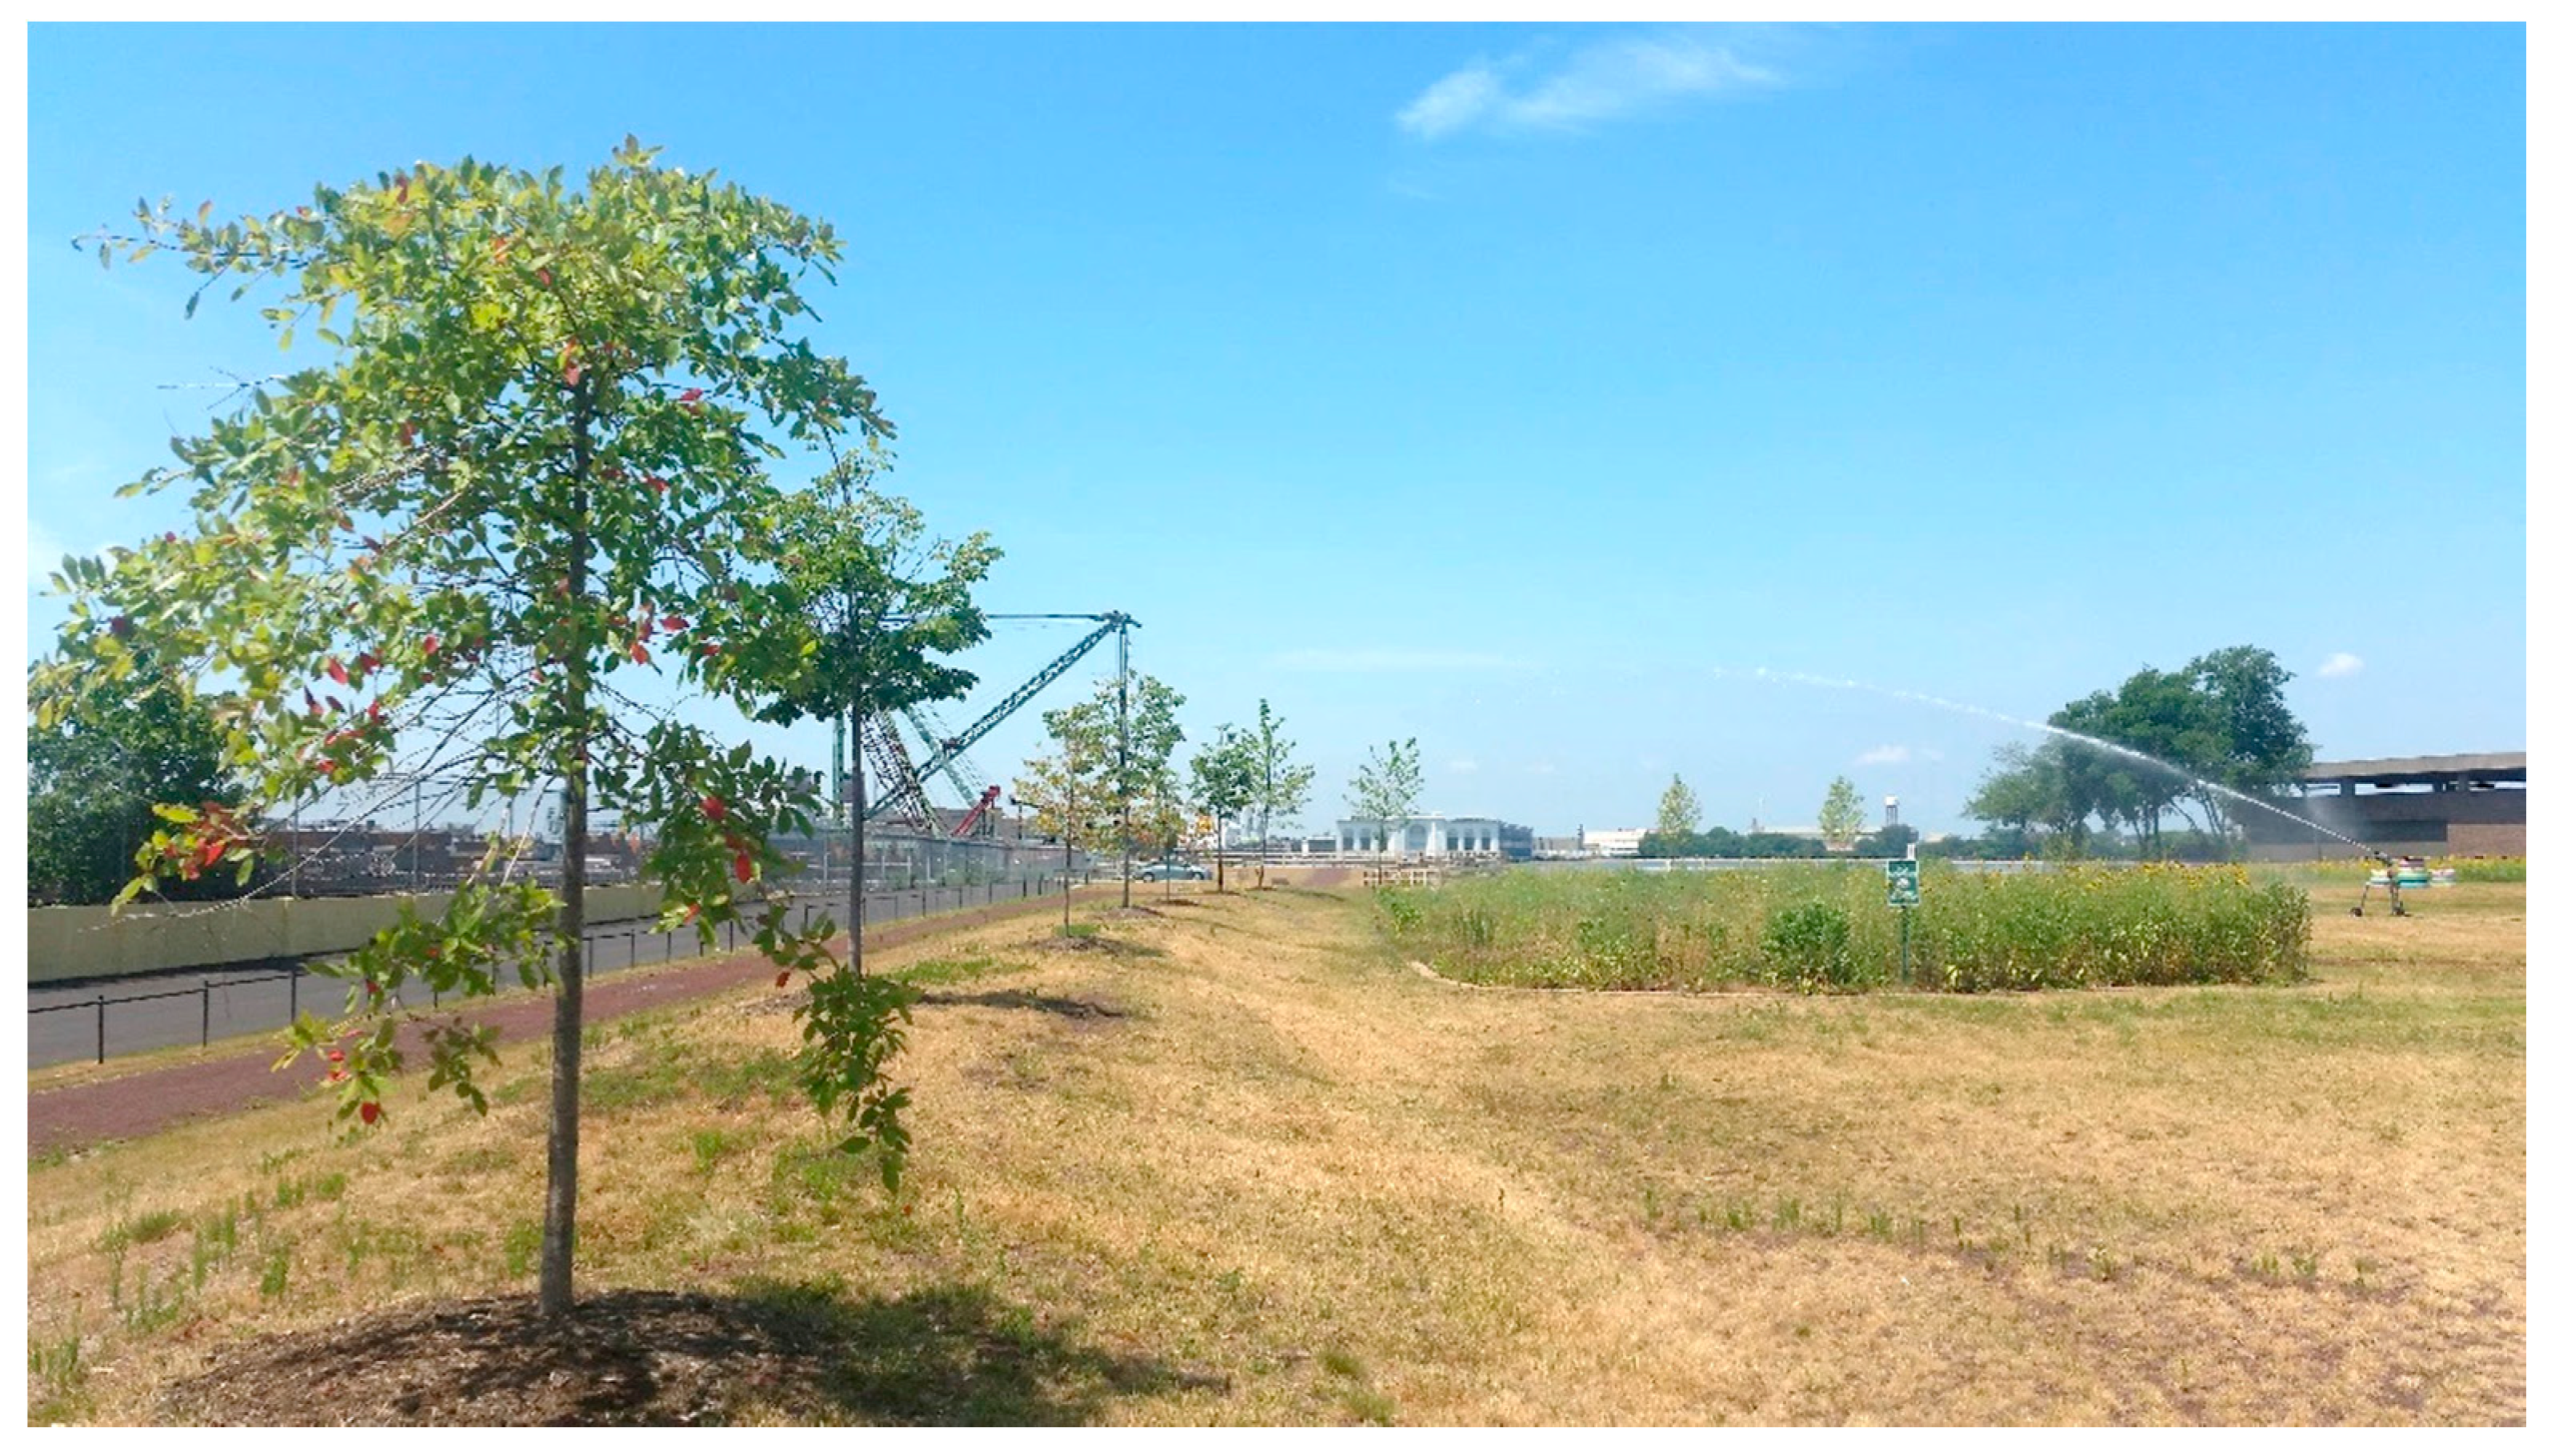
Based on the field observations, two project team members assigned ranks of GSI recreational appeal separately. Next, these ranks were compared and discussed for each GSI, and final ranks were determined. In 11 instances, revisit to project sites was necessary to clear confusion generated from field notes. Some GSI projects were designed to offer active or passive recreational opportunity (for example, an underground infiltration trench with a basketball court on top), but many were not meant to be designed that way. Some projects offered recreational opportunity by being next to recreational spaces such as a playground. We assigned high, medium, or low level of recreational appeal based on the presence, number, type, and design of recreational features available on the site, if any. The porous paving project shown in Figure 3a, as an example, had several seating arrangements (passive recreation) and space for walking or jogging (active recreation), and therefore was ranked with high recreational appeal. Another high-ranked project was a 5.3-acre park (shown in Figure 2) designed as a stormwater management project with recreational amenities such as trails, benches, and play areas. The bioswale shown in Figure 3c did not have any recreational feature inside the project area but it was designed on the periphery of a play space and was observed as an extension of the play space by some users during our field work. This project ranked with medium recreational appeal. Finally, the rain garden shown in Figure 3d did not provide any active or passive recreational opportunity and was ranked with a low score.
In addition to field observation, we conducted 50 intercept interviews, 40 in Philadelphia and 10 in Camden, to understand various social aspects and public perceptions of GSI. We interviewed only the people who were above age 18 and either lived or worked in those neighborhoods. Each interview was 5–10 min long and included questions on discoverability (if people were aware of the existence of GSI in their surrounding environment), familiarity (if people were familiar with GSI and its functionality), and accessibility/ interactivity (if people could get access to public GSI project areas or could interact with them). We also asked questions on perceived concerns or benefits of these projects. No identifiable information was collected. We digitized those interview notes and conducted a qualitative content analysis.
4. Results and Discussion
4.1. GSI Project Setting Impacts Recreational Appeal
According to Table 2, GSI projects in Philadelphia that offered the highest recreational appeal were basins and porous paving. Bumpouts and tree trenches offered low appeal. Porous paving as a GSI project, for example, may not offer recreational value by itself, but these projects were usually located within sites meant to have recreational amenities, such as hard-surface play spaces. Similarly, an infiltration storage trench may not have recreational appeal but because of their placement in certain recreational areas—active or passive, they received medium scores in recreational values. For Camden, according to Table 3, high recreational appeal was associated with porous paving and cisterns, and low appeal with planters and downspouts.
Table 2 and Table 3 also explore the connection between GSI recreational appeal and their project setting for different types of projects observed in Philadelphia and Camden respectively. Most projects had multiple project settings, which explains why most percentages did not add up to 100%. For Philadelphia (Table 2), almost three-quarters of tree trench projects were located along streets and sidewalks (Infrastructure category), and the large majority of rain gardens and infiltration storage trench projects were found in parks and playgrounds (Designed Open Space category). Table 3 shows that Camden rain gardens and tree trenches were largely implemented along roads and sidewalks (Infrastructure), and pervious paving projects were found equally within Designed Open Space and Community Spaces.
When average recreational appeal values and project setting percentages were cross-referenced, we found a pattern between the two. GSI projects installed in Designed Open Spaces such as parks and playgrounds tended to have a higher recreational value. For example, the four basins in Philadelphia were all located in Designed Open Spaces, represented by parks and playgrounds. The same was true for the nine porous paving projects, where their most frequent project setting was also Designed Open Spaces. As for low recreational appeal, bumpouts were most often situated in an infrastructure-heavy setting, such as by streets and sidewalks, and therefore serving little to no recreational value. This same pattern was noticed in Camden. Cistern projects, for example, were set in parks and community centers, and had no physical connection with infrastructure such as streets and sidewalks. Additionally, the most frequent location of tree trenches with a low-medium recreational value was infrastructure such as streets and sidewalks.
Overall, based on the data collected, we can say that designed open space settings of GSI have a strong influence on GSI recreational value, community settings have little to no influence, and grey infrastructure settings such as streets and sidewalks have a weak influence.
4.2. GSI Project Appearance Is Related to Maintenance, Signage, and Visibility
Our field notes showed that an overwhelming majority of the GSI projects in both cities appeared unattractive due to lack of maintenance. Additionally, in the case of Philadelphia, we found a strong connection between the presence of trash and lack of educational signage. Table 4 presents data on the presence or absence of trash, debris, and signage on GSI project sites in both cities. Each location contained one or more GSI projects, but the data was pertinent to the location in which these projects were installed. In Philadelphia, 70% of sites with one or more GSI projects had trash or debris, in varying amounts, within them. Additionally, 57% of sites had no signage. Almost half of the sites that did not have signage also had trash. For Camden, 76% of sites had trash and 45% did not have any signage. Almost all the sites that did not have signage had trash. Lack of signage might lead to lack of understanding of GSI purpose and functionality and could cause an increased amount of misuse of GSI projects. According to our notes, many sites without signage contained varying degrees of trash, debris, overgrown vegetation, or improper function. Based off of these notes it is our assumption that when residents are unaware of the environmental benefits of these projects, they may feel less inclined to accept/understand them and may misuse the project sites. This maintenance–signage–appearance connection may be more relevant in winter months when projects usually look less attractive than in the spring/summer with a lack of live, colorful flora.
For Philadelphia, visibility of project sites was also related to signage, as the field data showed 25 out of the 105 sites were deemed “not visible”, and all of these had no signage but had trash or debris present. This further promotes the notion that lack of signage, paired with decreased visibility, can further contribute to misuse of GSI projects.
4.3. GSI Projects with Trash and No Signage Are Mostly Located in Disadvantaged Neighborhoods
As a follow-up analysis, we wanted to see if there was a connection between the condition and available signage of the GSI sites and potentially disadvantaged census tracts. Prior research has argued about the importance of equitable access to and distribution of GSI projects in Philadelphia’s disadvantaged neighborhoods [2,18]. According to our literature review, however, the condition of existing GSI projects located in disadvantaged neighborhoods in Philadelphia and Camden was unknown.
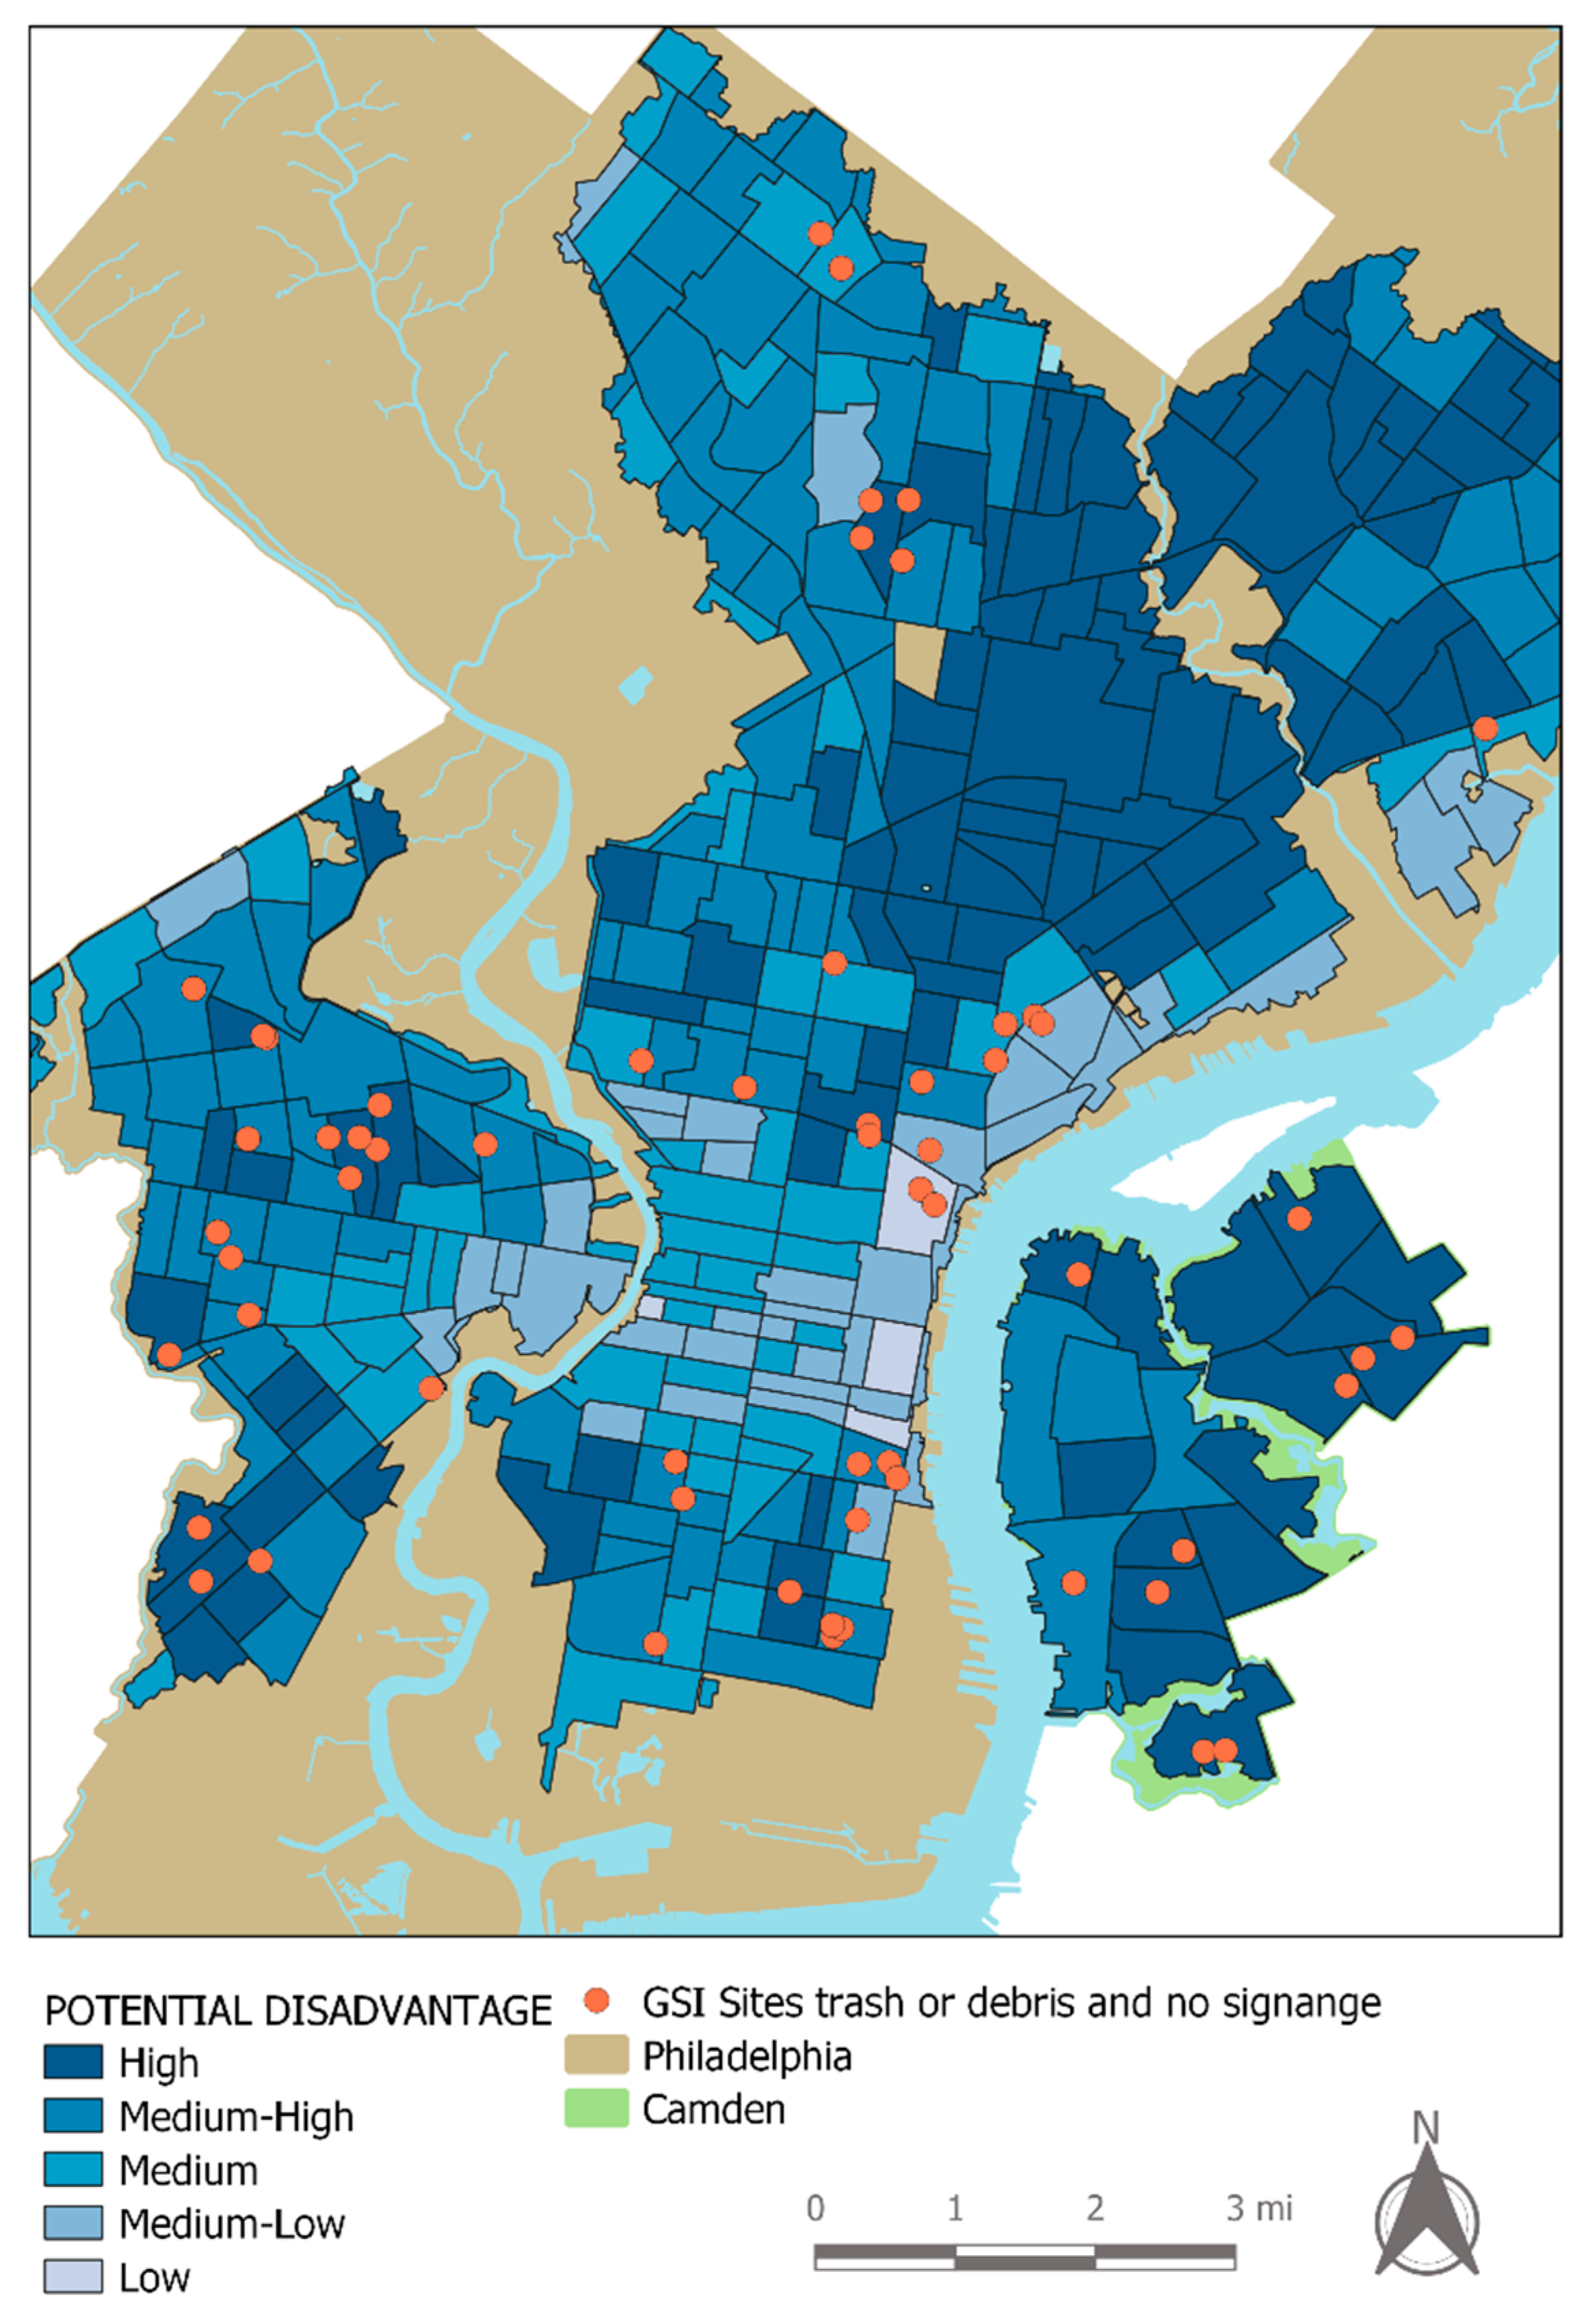
The relative ranks of potentially disadvantaged tracts in the region were calculated by a study conducted by the metropolitan planning organization based on eight variables: Non-Hispanic Minority, Carless Households, Households in Poverty, Female Head of Household with Child, Elderly, Hispanic, Limited English Proficiency, and Persons with a Physical Disability [37]. We overlaid this data with point location of GSI sites with presence or absence of signage and/or trash. According to Table 5, 69% of the GSI sites with trash or debris in Philadelphia were found in census tracts with high or medium-high level of potential disadvantage. The same percentage of GSI sites with no visible signage were located in high or medium-high potentially disadvantaged tracts of Philadelphia. Finally, for GSI sites with both the presence of trash or debris and no signage in Philadelphia, 72% were found in potentially disadvantaged tracts. These findings indicate that GSI sites available to disadvantaged populations may be more susceptible to misuse due to lack of maintenance, leading to an influx of trash or debris, and the lack of signage can lead to a lack of understanding and increased amounts of misuse in these tracts.
Figure 4, as an example, displays GSI sites that had no signage but had a presence of trash with a background of potentially disadvantaged census tracts in Philadelphia and Camden. As seen in this figure, all of Camden’s census tracts were categorized as high or medium-high potentially disadvantaged.
4.4. Public Interaction with GSI Depends on Location, Land use, and Visual/Recreational Appeal
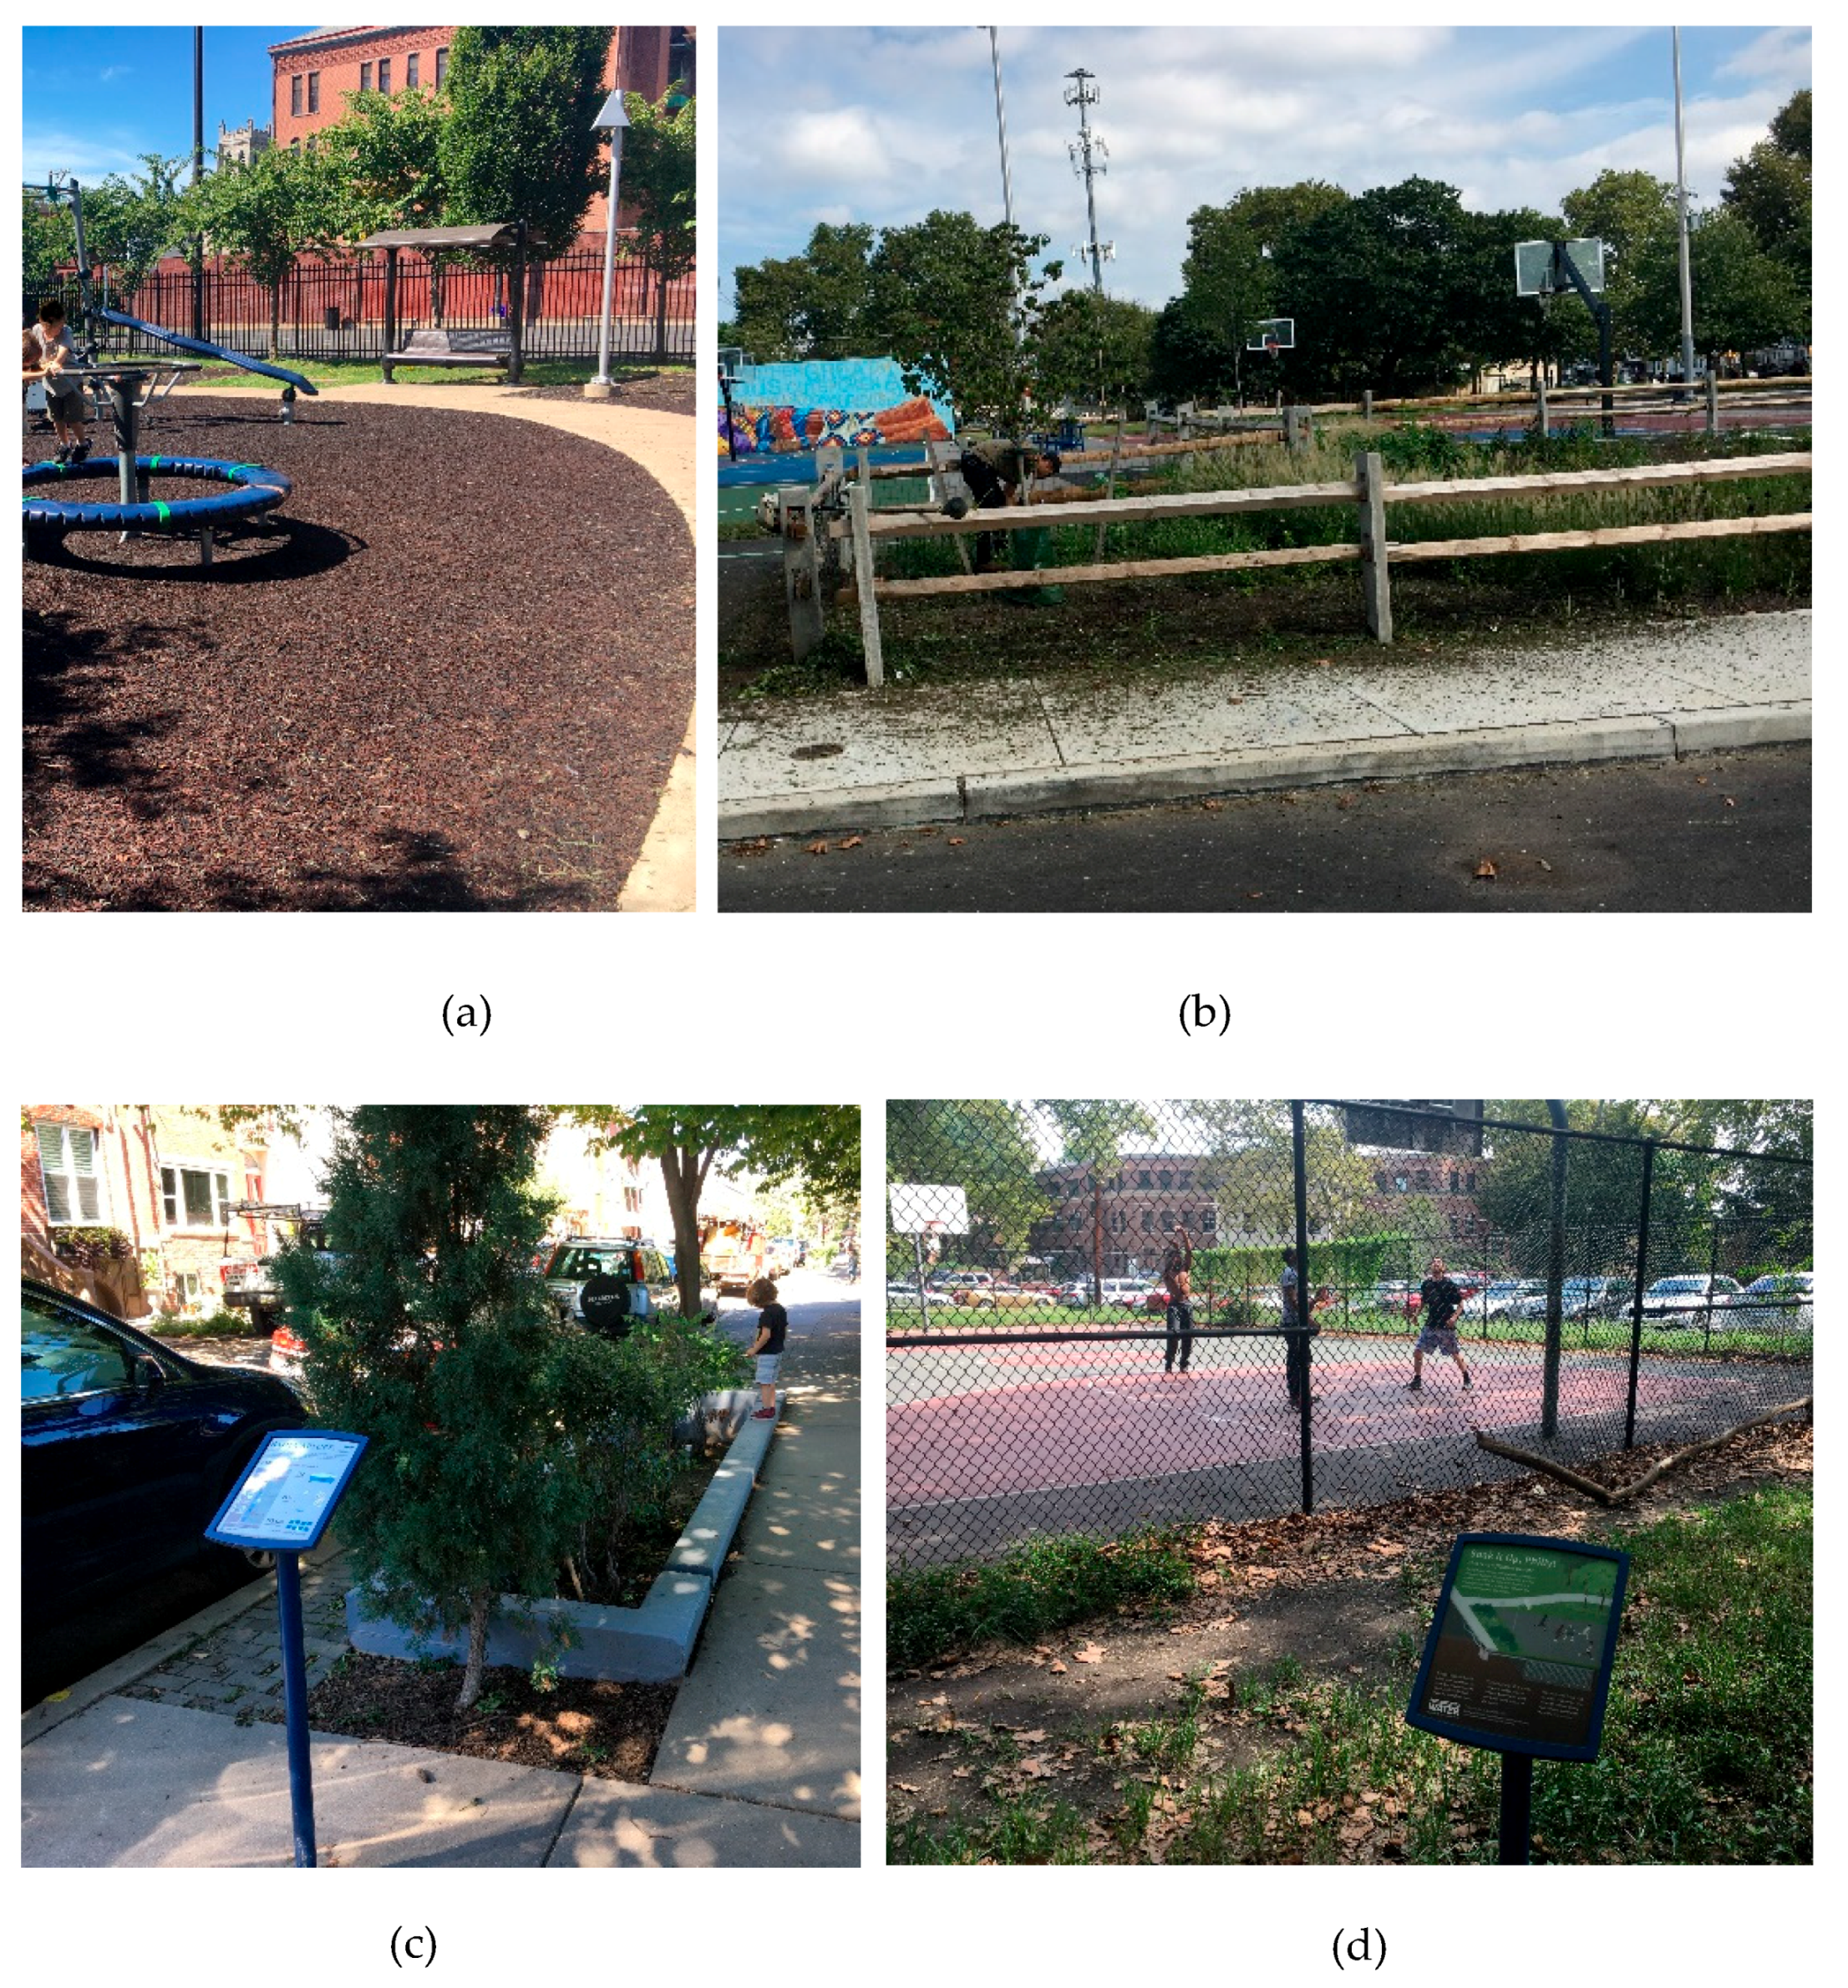
Based on our field data, many of the interactions with the GSI projects observed were just people passing by the projects. Direct interaction was less common and observed in the form of a person standing on the site talking with someone, sitting on a bench, cleaning trash, maintaining plants (e.g., weeding and pruning, see Figure 5b), or children playing (see Figure 5a,c). Another form of interaction observed was one or more people playing in a designated playground that was designed as GSI (see Figure 5d). As shown in Table 4, an average of nine minutes were observed at each site in Philadelphia, where an average of seven people were seen directly or indirectly interacting with each. In Camden, an average of three people were observed interacting with GSI directly or indirectly.
Prior research suggests that GSI project setting, surrounding land use, and project design may have significant influence in whether or not people would interact with them [41]. Many of the projects we observed were located on streets (stormwater bumpouts) or sidewalks (tree trenches) but pedestrians paid them little attention. Limited number of signage and no design components such as benches or other form of seating arrangements were visible to increase public interaction. Accompanied by lack of knowledge, which can be attributed to lack of signage, this means that many GSI projects may be potentially overlooked by the community. Without visible signage, it is difficult to distinguish a typical street tree from a tree trench, which can accumulate similar amount of trash, blocking the performance of a GSI. By implementing more projects in locations that are suitable for multiple uses, such as recreation and community resources, people might begin to notice these projects more, especially if there is more informative signage, and be more inclined to interact with them. Per the data, the highest number of interactions took place in community project settings such as parks and community organizations (e.g., churches and community centers). In these places, staff members or volunteers were seen taking care of the projects by weeding, pruning, or cleaning trash. In some places, people were observed sitting on benches located in a porous pavement area or a large rain garden area while talking on or browsing their cell phones, or having snack.
Surrounding land use was found to play a role in facilitating interactions with GSI projects. We observed more people around GSI projects located in neighborhoods with diverse land uses such as residential homes, apartments, small food and retail businesses, and transportation stations/stops.
According to our observations, visual appeal may have played a role in increased interaction with GSI. We found that the project types possessing the potential to contributing to an increase in the attractiveness of a particular urban neighborhood include large, well-designed parks with multiple GSI installations and rain gardens with an abundance of flowers and foliage. Projects least likely to increase the visual appeal of a neighborhood, according to our field observation, include porous paving and projects such as cisterns and rain barrels, which generally do not coincide with greenery and foliage.
4.5. Public Perception of GSI: Findings from Intercept Interviews
Findings from field observations and intercept interviews were consistent and complimentary. Here, we present some major themes emerged from a qualitative content analysis of intercept interviews, along with a summary table (see Table 6).
4.5.1. Many GSI Projects Were Not Discoverable
In terms of discoverability, many people we spoke with were not aware of the existence of GSI projects in their neighborhoods because of three primary reasons: (1) they did not have a clear idea about the meaning and physical appearance of GSI projects; (2) they thought the projects were not visible from the community areas (e.g., streets, parks, plazas); and (3) they did not notice any educational signage. Discoverability issues were associated with all GSI types, but more commonly with tree trenches and infiltration galleries. Three quotes on the discoverability theme are presented below:
“I didn’t even know these trees serve another function.”
“I am sorry I don’t know the difference between these two flower gardens. I thought one looked good and the other ugly. Because the ugly one didn’t have many flower plants. Mostly grass. If I knew this was a rain garden and the plants were water tolerant, I wouldn’t consider the garden ugly…. Is there a signage? I never noticed.”
“I often play basketball here. Didn’t know there was a water storage underneath [infiltration trench]. Never noticed that signboard until you pointed out. Funny!”
4.5.2. People Were Not Familiar with All GSI Types
We wanted to know how familiar people were about different GSI types and their functionality. Many people we spoke with had basic ideas about GSI and its overall concept or benefits, but they were familiar with only selected GSI types, such as rain barrels, stormwater planter boxes, and green roofs. They, however, did not necessarily know how specific GSI projects functioned, except rain barrels. Both cities offer rain barrel workshop programs extensively, with free distribution of barrels. Philadelphia PWD and Camden Collaborative Initiative (CCI) have been providing public education on GSI for many years, and more outreach/education work may be needed through other public or environmental organizations in both cities. Here are three quotes relevant to this topic:
“I have heard of rain gardens before… and green roof.”
“These [names] are too fancy, too technical to me. I don’t care about names. If they are here for a reason … if they help manage rainwater, I am game. I just didn’t know.”
“I really like that sign. It’s on a parking lot near an intersection. When my car stops at the traffic signal, I look at the sign and read, I look at the picture [diagram].”
4.5.3. Interaction with GSI Projects Depended on Access and Design Features
Most people said they did not find any way to get access to or interact with some of the GSI projects. They referred to projects that were fenced off or located within the property boundary of organizations (e.g., churches, schools, museums). They appreciated the projects that were publicly accessible and included features such as shady trees, seating options (e.g., benches), or other interactive elements such as educational signages, play or sports features, and art installations (e.g., sculptures). In some cases, people were unknowingly interacting with GSI projects. A basketball court, which is an infiltration trench, in Philadelphia and a 5.3-acre community park, which is a GSI project in its totality, in Camden are two examples.
“That [rain] garden looks nice but is caged [fenced-in]. Can’t go near it.”
“I love this plaza [porous pavement]. There are seating options, there is a nice path, lots of plants around. I love taking a break from work and hang-out here.”
“I take my kids to this park all the time. I noticed this [vegetated swale]. Once we planted some spring bulbs in it.”
4.5.4. GSI Recreational and Visual Appeals Depended on Design Features and Maintenance
As field researchers, we observed and ranked GSI projects based on our field observations. We also asked people how they felt about the visual and recreational appeal of different GSI projects in their neighborhoods. As reported above, many people were unaware or unfamiliar with most GSI types. Once they were informed about these projects, they shared their opinions, most of which were consistent with our interpretations. For example, people generally thought that basins, porous paving, and infiltration trenches offered recreational opportunities if the projects included play space/walking path (basins), informal plaza or resting/walking area (porous paving), and designated play area (infiltration trenches). These GSI projects were not considered recreational when they served as parking lots. People also thought bumpouts, planter boxes, downspouts, and bioswales did not offer any recreational opportunity. In terms of visual appeal, however, people ranked planter boxes and bioswales, along with rain gardens, much higher than infiltration trenches or porous paving. People were mostly attracted to rain gardens with colorful seasonal flowers and plants, as long as they were well-maintained and nurtured. Here are three quotes:
“I didn’t know this [rain garden] was designed to manage stormwater. I always find garbage here. Maybe people hate it. No maintenance. The tall grasses [ornamental grasses] become ugly in fall. Looks like a trashy area.”
“This [rain] garden is one of the highlights of our neighborhood. Look at all those wild flowers even in October. Brings color and joy.”
“Glad to hear this whole park is a stormwater management project. I bring my kids all the time. We walk, jog, use those benches to enjoy the river. Kids play with these tire-bugs [kid-friendly playground features made of tires].”
4.5.5. GSI Design, Construction, and Maintenance Were Topics of Social Concern
Some people we interviewed generally expressed a lot of concerns with GSI projects constructed in their neighborhoods. They understood the intended benefits, but were also concerned that projects were not serving as intended, due to poor design, defective construction, undesirable placement, or lack of maintenance. Here are some quotes explaining the way they perceived GSI projects.
“I don’t like this [stormwater bumpouts]. It has taken away a parking space. Do you know how hard it is to find a parking spot here? I don’t know what good it is doing. It’s full of trash anyway.”
“Our house is right here. Until this rain garden was built, we never faced any basement flooding. I am sure the flooding is happening because either this raingarden is not designed properly or maintained properly. Now I have to deal with it. Whose fault is this?”
“I think this rain garden or whatever you want to call it is a nuisance. It is right near this major intersection and it doesn’t offer anything positive. The overgrown plants give you a feeling of a vacant lot, not a garden.”
4.6. Study Challenges and Limitations
We faced a few technical issues and data gaps in the Philadelphia GSI interactive map, which was active at the time of field observations but has been discontinued recently. There were a few instances where a project type presented on the map did not match with the type we found on site. Additionally, several tree trenches were included on the map but could not be located during field visits. The Camden GSI interactive map worked better for us, except for a few instances where we had trouble locating a site from the map in-person. Moreover, construction had not yet started for some sites presented on the map. Overall, we faced issues with time and project management due to such inconsistencies in both maps.
Our field observations were done in a certain time of the year. Field data on appearance, maintenance, and public interaction with GSI projects may vary season to season. Ideally, data should be collected in all four seasons for a more in-depth or thorough analysis.
The study had additional methodological limitations. Our ranking of recreational appeal and interpretation of visual appeal of GSI were based on qualitative assessments of the researchers. While 50 intercept interviews included these questions (see Section 4.5.4), more public responses would have allowed us to capture public perception on these two topics in a comprehensive manner. Similarly, public interaction with GSI projects, which was observed for a limited time at each site due to budgetary or administrative limitations, may not be a true representation of all the people living or working in those neighborhoods.
4.7. Implications of Findings in GSI Planning, Design, and Practice
Despite these limitations, we have identified three potential implications of our findings in GSI planning, design, and practice. First, a maintenance and monitoring plan should be integral to any GSI planning and construction process; otherwise, projects will not function as designed, may offer aesthetic nuisances, and may not be embraced socially. The poor condition of many GSI projects we observed in both cities, especially in potentially disadvantaged census tracts, were indicative of improper or irregular maintenance, and this finding is consistent with prior studies [28]. If the appearance of a GSI project meets functional standards and is properly maintained (e.g., trash cleaning, mowing, pruning, watering, weeding), people may see it as an asset because of the environmental function it serves and visual appeal it brings to the neighborhood. Maintenance should be tied to training so that people carrying out the service can report any functional or performance issues and do not create new issues, such as mowing perennial plants. When these projects begin to deteriorate due to lack of maintenance, the community’s perceptions may shift from these being assets to neighborhood burdens.
Second, increased public interaction with GSI through strategic placement and design of projects may increase GSI social benefits. Most studies have analyzed the GSI placement question from a macro scale investigating a city or a neighborhood [2], although exploring micro level issues is equally important [19]. In order to improve visibility of GSI projects, it is important to consider their installations in locations where the surrounding land use promotes a high degree of foot traffic and pedestrian maneuverability. By implementing projects in locations that compliment some sort of use, whether that be recreational or leisure, public interactions with these projects may increase. Interaction can be also increased through signage, maintenance, and certain design interventions. Building GSI in combination with community recreational spaces such as parks or pocket parks, playgrounds, or community assets such as community centers, churches, or schools will provide dual purpose, offer more recreational appeal, and increase the chance of community-based monitoring or maintenance options. This argument aligns with prior research suggesting that a combination of GSI and placemaking allows GSI to provide social benefits by providing recreational, leisurely, or artistic amenities (e.g., benches, miniature sculpture garden, art installation, murals) to the community [19]. Dual functionalities can be argued for residential-scale small GSI projects such as flow-through planters, which can serve stormwater management and enhance visual appeal of dense urban neighborhoods. According to prior studies, private property owners can become interested in small-scale GSI projects, as long as they can arguably increase property values [22].
Finally, meaningful and strategic use of signage can provide the much-needed environmental education to community residents and, in return, may increase the possibility of a greater appreciation for GSI projects. If residents do not understand the purpose and meaning of GSI projects or do not recognize them as community assets, they may misuse them in the form of littering and vandalism. Most GSI projects we observed that had a high accumulation of trash lacked signage or included signage that was somewhat hidden. Signage explaining the benefits of GSI projects can inform an average resident of the positive environmental effects they can have on the neighborhood and the ways they can become community assets. This, in return, may encourage residents to stop littering or begin caring for these projects by simply picking up some trash, for example. Our suggestion is consistent with prior research that considered signage as “environmental learning tools” to explain human–environment interactions [31]. Additionally, the design, content, language, and visibility are important characteristics of any signage. In order to provide social benefits, the signage should be graphically appealing according to the community’s taste, have the information concisely written in a simple language commonly spoken in a given community, and be placed in a location and at a height that is clearly visible to pedestrians. In addition to environmental education, GSI planners and designers should consider participatory planning processes in improving community acceptance and interest in GSI installations, the importance of which was identified in prior research [16,22].
5. Conclusions
The broader goal of this study was to understand whether GSI projects were considered as assets to urban neighborhoods or as projects that might invite a new set of social concerns. GSI projects in Philadelphia and Camden cities (n = 238) were visited and analyzed on their surrounding environment, social use and interaction, visual appearance, recreational appeal, and their overall ability to provide social benefits. Following these field observations and an analysis of 50 intercept interviews, we were able to identify three key findings. First, the location of a project within a neighborhood has an effect on how recreationally appealing it is to residents. GSI projects located within designed open spaces such as parks and playgrounds tended to have a better recreational value. Second, the appearance and condition of GSI projects is connected to interpretive signage and maintenance, as residents are more likely to misuse an installation if they cannot understand its environmental functions (e.g., hydrological and water quality functions) and social benefits. Finally, public interactions with GSI projects can increase if they offer visual appeal and are installed in suitable locations to attract people to the space (e.g., parks, playgrounds, schools, churches, and community centers). Interaction can also increase if the surrounding land uses accommodate heavy foot traffic, such as residential homes, retails, and transportation stops/stations. GSI planners and designers can apply these findings in retrofitting existing projects or designing new projects, contributing to increased social benefits and outcomes of these projects.
In closing, we argue that while GSI offers various environmental, economic, and social benefits, lack of knowledge and community support for GSI can raise social challenges for these projects, which can facilitate improper use, maintenance, and function, and ultimately fail to mitigate the detrimental effects of a CSS. After investigating social aspects of GSI projects in two major US cities, we have identified what community-oriented aspects of GSI projects can affect their ability to reach their full potential and formulated recommendations to ensure their longevity and productivity. Our findings and recommendations were similar in both cities, arguably because of their similar physical, social, and demographic characteristics, as well as their post-industrial background. Future research on this topic might engage community residents in these conversations in the form of surveys, in-depth interviews, or focus groups. It is important to have an in-depth understanding of community perception on GSI projects and their social impacts in order to ensure they perceived well by the receiving neighborhood. Additionally, potential future studies may explore these questions by conducting field observations in various seasons and with more time spent at each project site. A more comprehensive set of public interaction data could be represented on a map to detect the location of the better or worse perceived GSI projects, so that a general overview of cities might be easily shown at a glance, clearly supporting a multiscale urban approach. It would also be interesting to explore the relationship between the social perception of GSI locations and their connectivity with other green elements or public areas from the overall urban green infrastructure network, as the topic can be specifically connected to urban planning and design decision-making processes.
Author Contributions
Conceptualization, M.M.; methodology, S.W., D.M. and M.M.; software, S.W. and D.M.; validation, D.M. and M.M.; formal analysis, D.M.; literature review, J.P.H.; writing—original draft preparation, D.M., M.M., and J.P.H.; writing—review and editing, D.M., M.M., J.P.H. and S.W.; visualization, S.W.; supervision, M.M.; project administration, M.M.; funding acquisition, M.M. All authors have read and agreed to the published version of the manuscript.
Funding
Parts of this research were supported by two sources: Rowan University School of Earth and Environment and US Environmental Protection Agency’s Science to Achieve Results (STAR) Program. This article has not been formally reviewed by these agencies. The views expressed here are solely those of authors and do not necessarily reflect those of the agencies.
Acknowledgments
We thank the anonymous reviewers for their constructive feedback on earlier drafts of this paper.
Conflicts of Interest
The authors declare no conflict of interest.
References
- US EPA (US Environmental Protection Agency) Office of Research & Development. Different Shades of Green. 2019. Available online: https://www.epa.gov/water-research/green-infrastructure-research-epa-brochure (accessed on 13 April 2020).
- Christman, Z.; Meenar, M.R.; Mandarano, L.; Hearing, K. Prioritizing suitable locations for green stormwater infrastructure based on social factors in Philadelphia. Land 2018, 7, 145. [Google Scholar] [CrossRef] [Green Version]
- Chini, C.M.; Canning, J.F.; Schreiber, K.L.; Peschel, J.M.; Stillwell, A.S. The Green Experiment: Cities, Green Stormwater Infrastructure, and Sustainability. Sustainability 2017, 9, 105. [Google Scholar] [CrossRef] [Green Version]
- Keeley, M.; Koburger, A.; Dolowitz, D.P.; Medearis, D.; Nickel, D.; Shuster, W. Perspectives on the Use of Green Infrastructure for Stormwater Management in Cleveland and Milwaukee. Environ. Manag. 2013, 51, 1093–1108. [Google Scholar] [CrossRef]
- Garcia-Cuerva, L.; Berglund, E.Z.; Rivers, L., III. An integrated approach to place Green Infrastructure strategies in marginalized communities and evaluate stormwater mitigation. J. Hydrol. 2018, 559, 648–660. [Google Scholar] [CrossRef]
- Shafique, M.; Kim, R.; Kyung-Ho, K. Green Roof for Stormwater Management in a Highly Urbanized Area: The Case of Seoul, Korea. Sustainability 2018, 10, 584. [Google Scholar] [CrossRef] [Green Version]
- Ahiablame, M.L.; Engel, B.A.; Chaubey, I. Effectiveness of low impact development practices in two urbanized watersheds: Retrofitting with rain barrel/cistern and porous pavement. J. Environ. Manag. 2013, 119, 151–161. [Google Scholar] [CrossRef]
- Wang, R.; Eckelman, M.J.; Zimmerman, J.B. Consequential Environmental and Economic Life Cycle Assessment of Green and Gray Stormwater Infrastructures for Combined Sewer Systems. Environ. Sci. Technol. 2013, 47, 11189–11198. [Google Scholar] [CrossRef]
- Kandulu, J.M.; Connor, J.D.; MacDonald, D.H. Ecosystem services in urban water investment. J. Environ. Manag. 2014, 145, 43–53. [Google Scholar] [CrossRef] [PubMed]
- Liu, W.; Chen, W.; Peng, C. Influences of setting sizes and combination of green infrastructures on community’s stormwater runoff reduction. Ecol. Model. 2015, 318, 236–244. [Google Scholar] [CrossRef]
- Pennino, M.J.; McDonald, R.I.; Jaffe, P.R. Watershed-scale impacts of stormwater green infrastructure on hydrology, nutrient fluxes, and combined sewer overflows in the mid-Atlantic region. Sci. Total Environ. 2016, 565, 1044–1053. [Google Scholar] [CrossRef] [Green Version]
- Gogate, N.G.; Kalbar, P.P.; Raval, P.M. Assessment of stormwater management options in urban contexts using Multiple Attribute Decision-Making. J. Clean. Prod. 2017, 142, 2046–2059. [Google Scholar] [CrossRef]
- Eaton, T.T. Approach and case-study of green infrastructure screening analysis for urban stormwater control. J. Environ. Manag. 2018, 209, 495–504. [Google Scholar] [CrossRef] [PubMed]
- Meenar, M.; Fromuth, R.; Soro, M. Planning for watershed-wide flood-mitigation and stormwater management using an environmental justice framework. Environ. Pract. 2018, 20, 55–67. [Google Scholar] [CrossRef]
- Muerdter, C.P.; Wong, C.K.; LeFevre, G.H. Emerging investigator series: The role of vegetation in bioretention for stormwater treatment in the built environment: Pollutant removal, hydrologic function, and ancillary benefits. Environ. Sci. Water Res. Technol. 2018, 4, 592–612. [Google Scholar] [CrossRef]
- Barnhill, K.; Smardon, R. Gaining Ground: Green Infrastructure Attitudes and Perceptions from Stakeholders in Syracuse, New York. Environ. Pract. 2012, 14, 6–16. [Google Scholar] [CrossRef]
- Green, O.O.; Shuster, W.D.; Rhea, L.K.; Garmestani, A.S.; Thurston, H.W. Identification and Induction of Human, Social, and Cultural Capitals through an Experimental Approach to Stormwater Management. Sustainability 2012, 4, 1669–1682. [Google Scholar] [CrossRef] [Green Version]
- Mandarano, L.; Meenar, M. Equitable distribution of green stormwater infrastructure: A capacity-based framework for implementation in disadvantaged communities. Local Environ. 2017, 22, 1338–1357. [Google Scholar] [CrossRef]
- Meenar, M.R. Integrating placemaking concepts into Green Stormwater Infrastructure design in the City of Philadelphia. Environ. Pract. 2019, 21, 4–19. [Google Scholar] [CrossRef]
- Venkataramanan, V.; Packman, A.I.; Peters, D.R.; Lopez, D.; McCuskey, D.J.; McDonald, R.I.; Miller, W.M.; Young, S.L. A systematic review of the human health and social well-being outcomes of green infrastructure for stormwater and flood management. J. Environ. Manag. 2019, 246, 868–880. [Google Scholar] [CrossRef]
- Wolch, J.R.; Byrne, J.; Newell, J.P. Urban green space, public health, and environmental justice: The challenge of making cities ‘just green enough’. Landsc. Urban Plan. 2014, 125, 234–244. [Google Scholar] [CrossRef] [Green Version]
- Turner, K.V.; Jarden, K.; Jefferson, A. Resident perspectives on green infrastructure in an experimental suburban stormwater management program. Cities Environ. (CATE) 2016, 9, Article 4. [Google Scholar]
- Hunold, C. Urban Greening and Human-Wildlife Relations in Philadelphia: From Animal Control to Multispecies Coexistence? Environ. Values 2020, 29, 67–87. [Google Scholar] [CrossRef]
- Brown, R.R. Impediments to integrated urban stormwater management: The need for institutional reform. Environ. Manag. 2005, 36, 455–468. [Google Scholar] [CrossRef]
- Dernoga, M.A.; Wilson, S.; Jiang, C.; Tutman, F. Environmental justice disparities in Maryland’s watershed restoration programs. Environ. Sci. Pol. 2015, 45, 67–78. [Google Scholar] [CrossRef]
- Kondo, M.C.; Low, S.C.; Henning, J.; Branas, C.C. The Impact of Green Stormwater Infrastructure Installation on Surrounding Health and Safety. Am. J. Public Health 2015, 105, e114–e121. [Google Scholar] [CrossRef]
- Flynn, C.D.; Davidson, C.I. Adapting the social-ecological system framework for urban stormwater management: The case of green infrastructure adoption. Ecol. Soc. 2016, 21, 19. [Google Scholar] [CrossRef] [Green Version]
- Everett, G.; Lamond, J.E.; Morzillo, A.T.; Matsler, A.M.; Chan, F.K.S. Delivering Green Streets: An exploration of changing perceptions and behaviours over time around bioswales in Portland, Oregon. J. Flood Risk Manag. 2015, 11, S973–S985. [Google Scholar] [CrossRef] [Green Version]
- Dagenais, D.; Thomas, I.; Paquette, S. Siting green stormwater infrastructure in a neighbourhood to maximise secondary benefits: Lessons learned from a pilot project. Landsc. Res. 2017, 42, 195–210. [Google Scholar] [CrossRef]
- Ibrahim, A.; Bartsch, K.; Sharifi, E. Green infrastructure needs green governance: Lessons from Australia’s largest integrated stormwater management project, the River Torrens Linear Park. J. Clean. Prod. 2020. [Google Scholar] [CrossRef]
- Church, S.P. Exploring Green Streets and rain gardens as instances of small scale nature and environmental learning tools. Landsc. Urban Plan. 2015, 134, 229–240. [Google Scholar] [CrossRef]
- Obropta, C.C. Community-Based Green Infrastructure, A Rutgers Cooperative Extension Urban Extension Initiative. J. Human Sci. Ext. 2017, 5, 91–102. [Google Scholar]
- US Census Bureau. Quick Facts: Philadelphia City, Pennsylvania; Camden City, New Jersey. 2019. Available online: https://www.census.gov/quickfacts/fact/table/philadelphiacitypennsylvania,camdencitynewjersey# (accessed on 20 February 2020).
- Meenar, M.R. Nonprofit-driven community capacity building efforts in community food systems. J. Agric. Food Syst. Comm. Dev. 2015, 6, 77–94. [Google Scholar] [CrossRef]
- Meenar, M.R. Assessing the spatial connection between urban agriculture and equity. Built Environ. 2017, 43, 364–375. [Google Scholar] [CrossRef]
- Meenar, M.R. Using participatory and mixed-methods approaches in GIS to develop a Place-Based Food Insecurity and Vulnerability Index. Environ. Plan. A 2017, 49, 1181–1205. [Google Scholar] [CrossRef]
- Delaware Valley Regional Planning Commission (DVRPC). Purpose of the Indicators of Potential Disadvantage (IPD). Available online: https://www.dvrpc.org/webmaps/IPD/ (accessed on 10 March 2020).
- Philadelphia Office of Watershed. “Green Infrastructure Project Map.” (Currently Archived and Not Maintained). Available online: http://phlwater.maps.arcgis.com/apps/webappviewer/index.html?id=c5d43ba5291441dabbee5573a3f981d2 (accessed on 3 September 2018).
- Rutgers Camden. Camden Green Infrastructure Project Interactive Map. Available online: http://www.water.rutgers.edu/Camden/index.html (accessed on 15 September 2018).
- New Jersey Section of American Water Resources Association (NJ-AWRA). NPhoenix Park, Camden, New Jersey. 2015. Available online: https://njawra.org/phoenixpark#:~:text=The%20Phoenix%20Park%20Project%20transformed,from%20a%20crumbled%20industrial%20facility (accessed on 9 December 2020).
- Meenar, M.; Afzalan, N.; Hajrasouliha, A. Analyzing Lynch’s city imageability in the digital age. J. Plan. Educ. Res. 2019. [Google Scholar] [CrossRef]
Figure 1.
GSI sites visited in Philadelphia and Camden. Data sources: US Census Bureau, Open Data Philly, New Jersey Department of Environmental protection, New Jersey Geographic Information Network, and Delaware Valley Regional Planning Commission. Map by Shane Walsh.
Figure 1.
GSI sites visited in Philadelphia and Camden. Data sources: US Census Bureau, Open Data Philly, New Jersey Department of Environmental protection, New Jersey Geographic Information Network, and Delaware Valley Regional Planning Commission. Map by Shane Walsh.

Figure 2.
An example of a well-maintained GSI project in Camden. This 5.3-acre former Brownfield site was converted to a park to manage over 5 million gallons of stormwater annually [40]. The project, however, has visibility and access issues, as reported by local residents. Photo by Mahbubur Meenar.

Figure 3.
Four examples of highly visible and well-maintained GSI projects in Philadelphia. (a) a porous paving project designed as passive recreational area with seating arrangement and designed landscape; (b) a series of tree trench projects with a visible signage and wide sidewalk; (c) a bioswale designed as part of a play space with a visible trash can; (d) a rain garden next to a busy road with vibrant plants and flower beds. Photos by Shane Walsh.
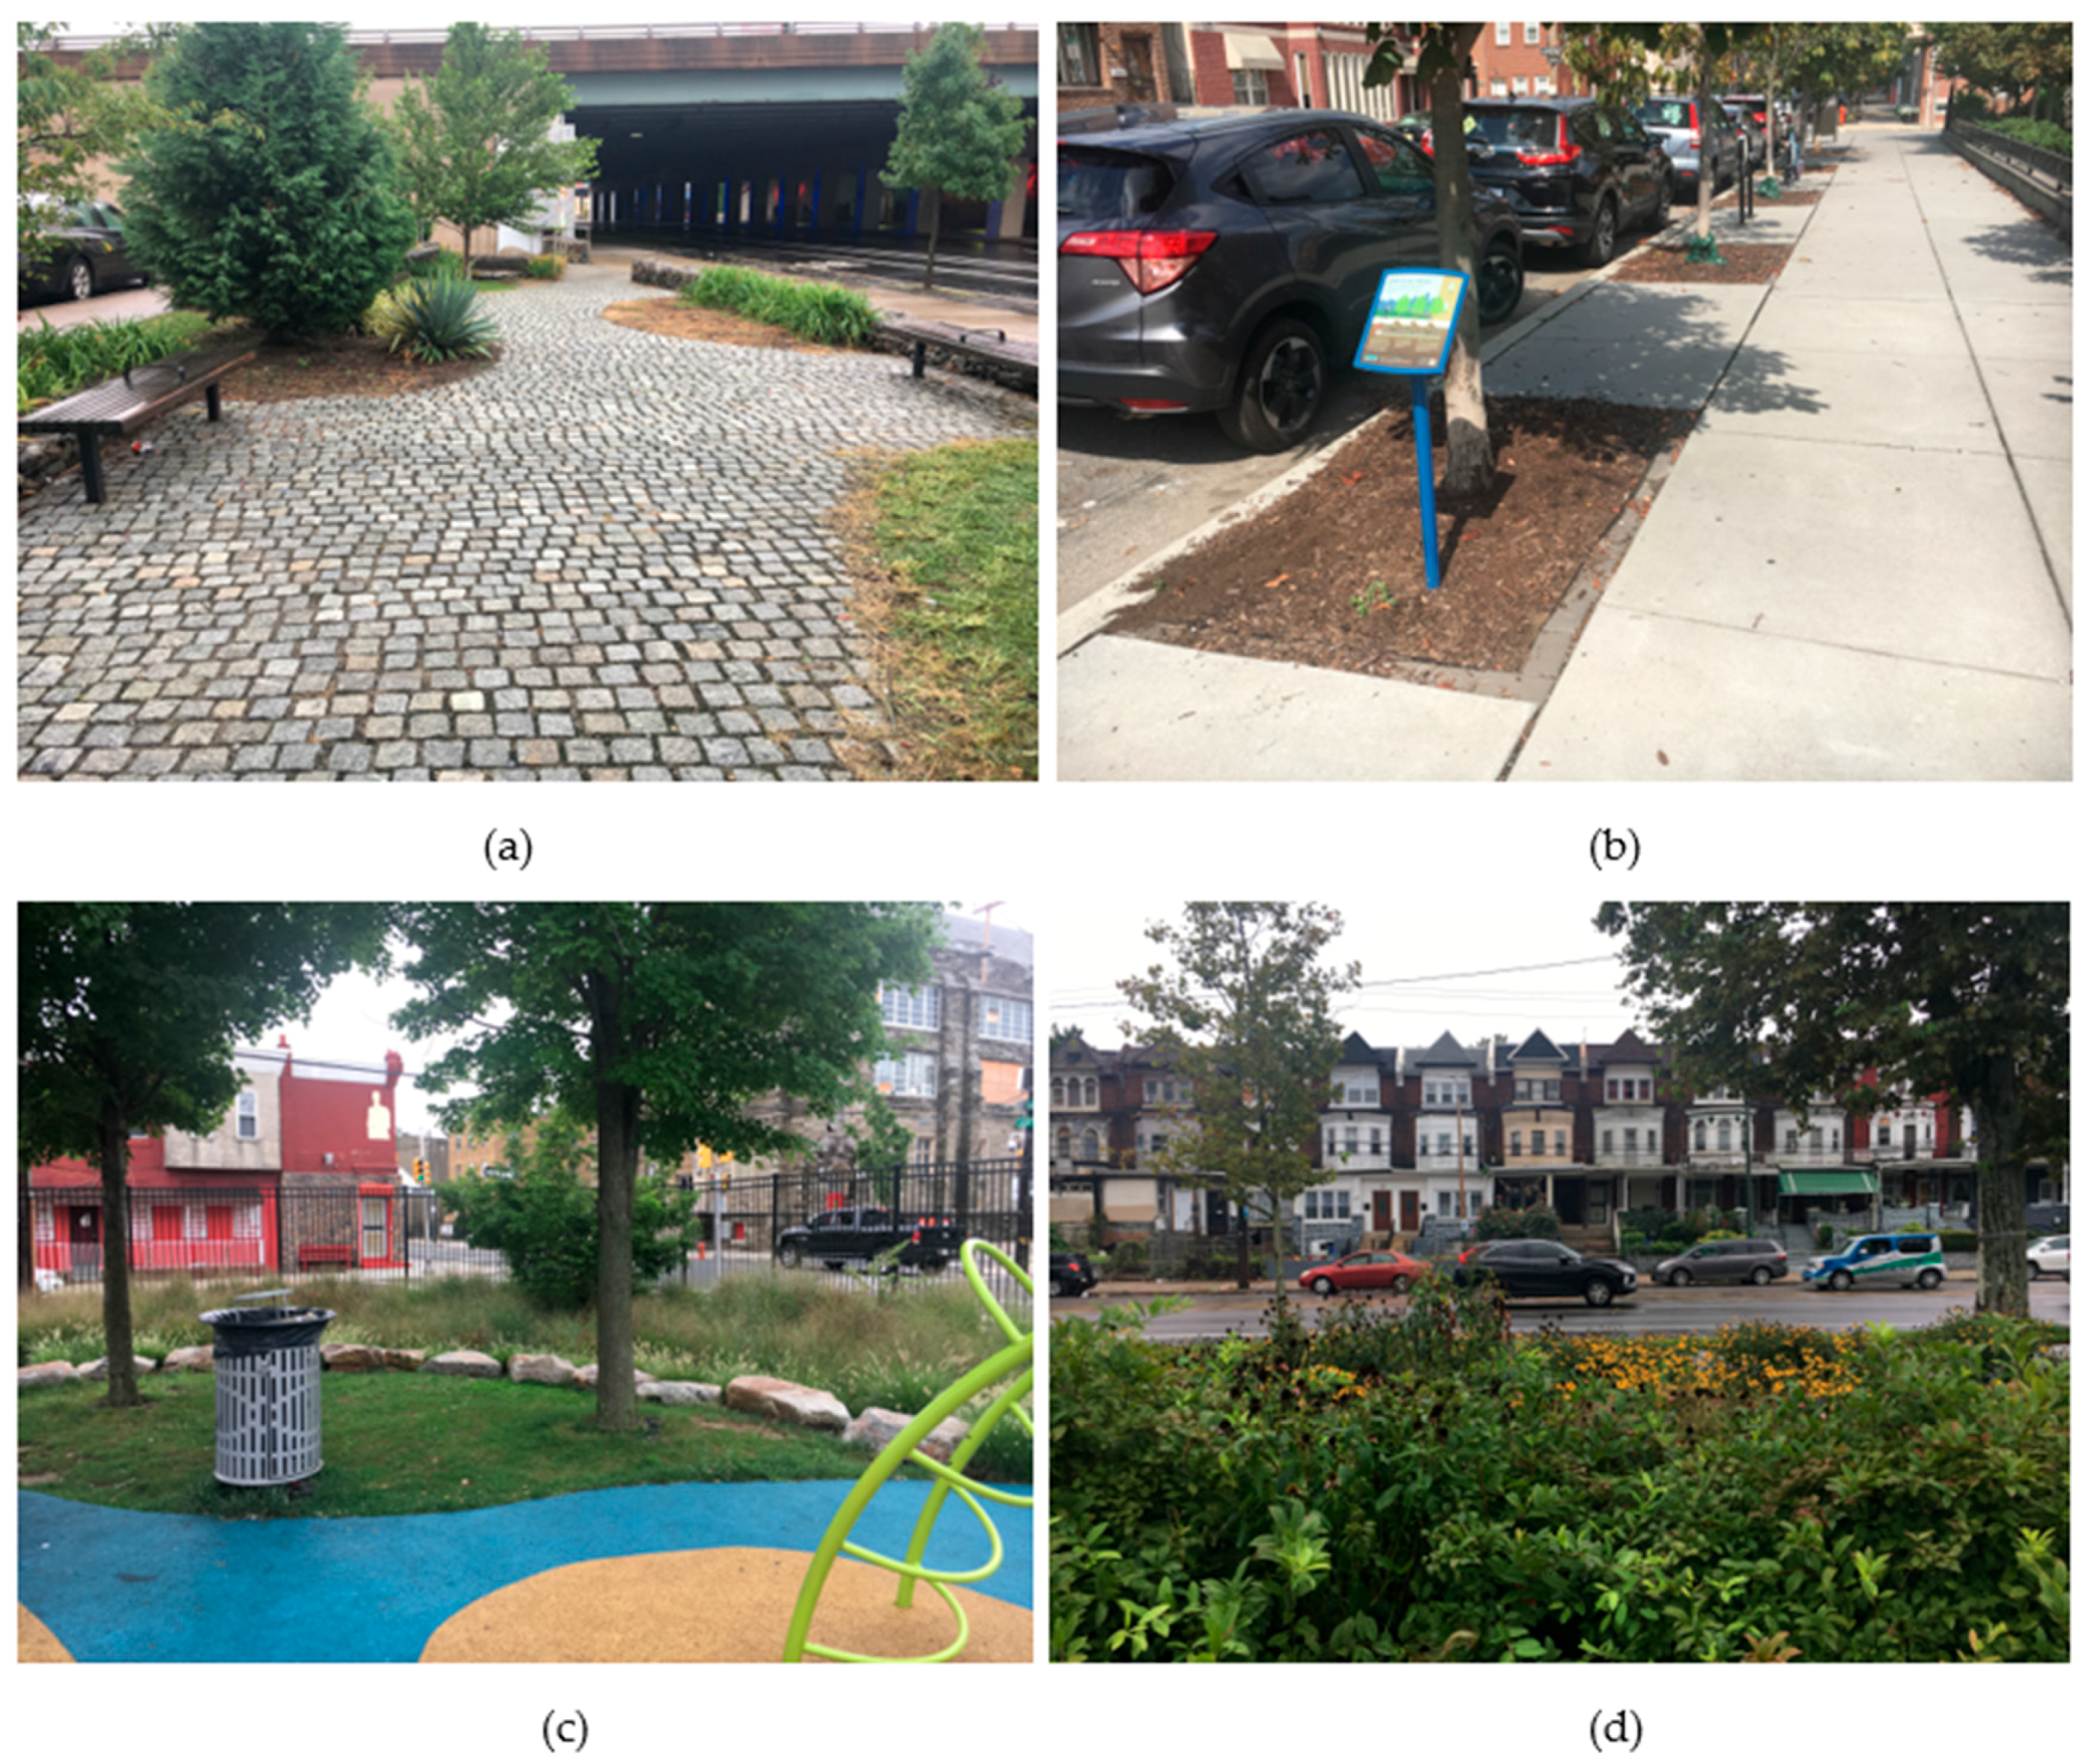
Figure 4.
GSI sites that had no visible signage but had a presence of trash, displayed against potentially disadvantaged census tracts in Philadelphia and Camden. Map by Shane Walsh.
Figure 4.
GSI sites that had no visible signage but had a presence of trash, displayed against potentially disadvantaged census tracts in Philadelphia and Camden. Map by Shane Walsh.

Figure 5.
Four examples of public interaction with GSI projects. (a) a children’s playground with pervious surface; (b) a person maintaining a rain garden; (c) a child exploring a rain garden; (d) young adults paying in a basketball court, which is an infiltration trench. Photos by Shane Walsh.
Figure 5.
Four examples of public interaction with GSI projects. (a) a children’s playground with pervious surface; (b) a person maintaining a rain garden; (c) a child exploring a rain garden; (d) young adults paying in a basketball court, which is an infiltration trench. Photos by Shane Walsh.


Table 1.
Data Fields from Location Analysis Spreadsheet.
| Field Name | Description |
|---|---|
| Site Number | Unique ID provided by the study team |
| GSI Number | Unique ID provided by the study team |
| Latitude/Longitude | Coordinates for each site |
| Type of Project | GSI project type (e.g., rain garden, tree trench, infiltration storage) |
| Project Setting | Location setting of each project, classified intro three categories: Designed Open Spaces (e.g., parks, playgrounds, urban farms, and conservation areas), Infrastructure (e.g., sidewalks, streets, and parking lots), and Community Spaces (e.g., schools, recreational centers, churches, libraries, and amphitheater). |
| Surrounding Environment | Surrounding land use of each project (e.g., residences, businesses, schools, churches, vacant buildings, or eateries) |
| Date/Time of Visit | The date and time a project was visited |
| Duration of Visit | Total time spent at each project site |
| Is the Site Being Used | If the site was being used by people — Yes or No |
| Number of Interactions with Projects (Direct/Indirect) | The number of people witnessed within/around the project site at time of visit (e.g., passing by/through, standing on the site talking with another person, sitting on a bench, jogging, playing, cleaning trash, and weeding) |
| Noted Uses | The types of interactions that were occurring within/around the project site at the time of visit, if any |
| Condition | Observation notes whether there were small or high amount of trash, or missing/overgrown vegetation |
| Visual Appeal | Attractiveness of each project site (determined by the presence of flowers and foliage, absence of trash, pruned plants, combination of plant varieties in terms of color, height, and season, presence of landscape materials such as rocks, etc.) |
| Recreational Appeal | High, medium, or low level of recreational opportunity offered by each project site (determined by the number, type, and design of recreational features available on the site, if any) |
| Visibility | How visible the site was to the neighborhood, ranging from “Not”, to “Somewhat”, to “Visible”, to “Highly Visible”. |
| Additional Notes | Any notable thoughts and observations about a site |
Table 2.
Philadelphia GSI Recreational Appeal and Project Setting.
| Project Type | Total Projects (n = 183) * | Average Recreational Appeal | % of Total Projects by Setting Types | ||
|---|---|---|---|---|---|
| Designed Open Spaces | Infrastructure | Community Spaces | |||
| Tree Trench | 53 | Low | 45.30% | 73.60% | 47.20% |
| Infiltration Storage Trench | 45 | Medium | 82.20% | 46.70% | 28.90% |
| Rain Garden | 44 | Medium | 93.20% | 43.20% | 27.30% |
| Planter | 10 | Low | 30% | 80% | 60% |
| Porous Paving | 9 | High | 100% | 22.20% | 22.20% |
| Bumpout | 8 | Low | 62.50% | 87.50% | 37.50% |
| Bioswale | 8 | Low | 62.50% | 50% | 25% |
| Basin | 4 | High | 100% | 0 | 0 |
* Total includes 2 “other” categories.
Table 3.
Camden GSI Recreational Appeal and Project Setting.
| Project Type | Total Projects (n = 55) * | Average Recreational Appeal | % of Total Projects by Setting Types | ||
|---|---|---|---|---|---|
| Designed Open Spaces | Infrastructure | Community Spaces | |||
| Rain Garden | 18 | Medium | 16.60% | 66.70% | 44.40% |
| Tree Trench | 9 | Medium | 33.30% | 44.40% | 33.30% |
| Porous Paving | 7 | High | 57.10% | 0 | 57.10% |
| Planters | 3 | Low | 0 | 0 | 100% |
| Downspout | 6 | Low | 0 | 0 | 100% |
| Cistern | 3 | High | 33.30% | 0 | 66.70% |
| Water Conservation Program | 2 | Medium | 0 | 50% | 50% |
| Tree Canopy | 2 | Medium | 0 | 0 | 100% |
| Bioswale | 2 | Medium | 50% | 50% | 0 |
* Total includes 3 “other” categories.
Table 4.
Trash, Signage, and People in or Around GSI Sites.
| City | Philadelphia | Camden |
|---|---|---|
| # of Sites Observed | 105 | 29 |
| # of Sites with Trash or Debris | 74 (70%) | 22 (76%) |
| # of Sites with No Signage | 60 (57%) | 13 (45%) |
| # of Sites with Trash or Debris and No Signage | 49 (47%) | 11 (38%) |
| # of Sites “Not Visible”, with Trash or Debris, and No Signage | 25 (24%) | 1 (3%) |
| Avg. Direct/Indirect Interaction (# of People) | 7 people/site (692) | 3 people/site (80) |
Table 5.
Number of GSI Sites with Trash/Debris and No Signage within Potentially Disadvantaged Tracts.
Table 5.
Number of GSI Sites with Trash/Debris and No Signage within Potentially Disadvantaged Tracts.
| Potentially Disadvantaged Census Tracts | ||||||
|---|---|---|---|---|---|---|
| High | Medium-High | Medium | Medium-Low | Low | Total | |
| # of Sites with Trash or Debris in Philadelphia | 23 | 28 | 13 | 8 | 2 | 74 |
| Percentage | 31% | 38% | 17% | 11% | 3% | |
| # of Sites with Trash or Debris in Camden | 16 | 6 | 0 | 0 | 0 | 22 |
| Percentage | 73% | 27% | 0% | 0% | 0% | |
| # of Sites with No Signage in Philadelphia | 17 | 24 | 11 | 6 | 2 | 60 |
| Percentage | 29% | 40% | 18% | 10% | 3% | |
| # of Sites with No Signage in Camden | 12 | 1 | 0 | 0 | 0 | 13 |
| Percentage | 92% | 8% | 0% | 0% | 0% | |
| # of Sites with Trash or Debris and No Signage in Philadelphia | 14 | 21 | 8 | 4 | 2 | 49 |
| Percentage | 29% | 43% | 16% | 8% | 4% | |
| # of Sites with Trash or Debris and No Signage in Camden | 10 | 1 | 0 | 0 | 0 | 11 |
| Percentage | 91% | 9% | 0% | 0% | 0% | |
Table 6.
Social Perception of GSI Based on Intercept Interviews
| Themes | Topics | Relevant GSI Types |
|---|---|---|
| Discoverability | GSI projects were not easily discoverable | All types, but more commonly with tree trenches and infiltration galleries |
| Familiarity | People were not familiar with only specific GSI types | Rain barrels, stormwater planter boxes, and green roofs |
| Accessibility and Interaction | Interaction with GSI projects depended on access and design features | Infiltration storage projects also serving as parks and play areas |
| Recreational appeal | People enjoyed GSI projects if offered active or passive recreational opportunity | Infiltration storage trench, porous paving, naturalized area |
| Visual appeal | People were attracted to colorful flowers, plants, and well-maintained projects | Rain gardens, bioswales, planter boxes |
| Social concerns | People were concerned about poor design, defective construction, undesirable placement, or lack of maintenance of GSI projects | All types, but more commonly with rain gardens, bioswales, and naturalized areas |
Publisher’s Note: MDPI stays neutral with regard to jurisdictional claims in published maps and institutional affiliations. |
© 2020 by the authors. Licensee MDPI, Basel, Switzerland. This article is an open access article distributed under the terms and conditions of the Creative Commons Attribution (CC BY) license (http://creativecommons.org/licenses/by/4.0/).
Share and Cite
MDPI and ACS Style
Meenar, M.; Howell, J.P.; Moulton, D.; Walsh, S. Green Stormwater Infrastructure Planning in Urban Landscapes: Understanding Context, Appearance, Meaning, and Perception. Land 2020, 9, 534. https://doi.org/10.3390/land9120534
AMA Style
Meenar M, Howell JP, Moulton D, Walsh S. Green Stormwater Infrastructure Planning in Urban Landscapes: Understanding Context, Appearance, Meaning, and Perception. Land. 2020; 9(12):534. https://doi.org/10.3390/land9120534
Chicago/Turabian StyleMeenar, Mahbubur, Jordan P. Howell, Devon Moulton, and Shane Walsh. 2020. "Green Stormwater Infrastructure Planning in Urban Landscapes: Understanding Context, Appearance, Meaning, and Perception" Land 9, no. 12: 534. https://doi.org/10.3390/land9120534
Note that from the first issue of 2016, this journal uses article numbers instead of page numbers. See further details here.