Spatiotemporal Dynamics of Cultivated Land and Its Influences on Grain Production Potential in Hunan Province, China


1
School of Public Administration, China University of Geosciences (CUG), Wuhan 430074, China
2
Key Laboratory of Research on Rule of Law, Ministry of Natural Resources, Wuhan 430074, China
*
Author to whom correspondence should be addressed.
Land 2020, 9(12), 510; https://doi.org/10.3390/land9120510
Submission received: 3 November 2020
/
Revised: 30 November 2020
/
Accepted: 8 December 2020
/
Published: 10 December 2020
Abstract
:Understanding the impact of changes in cultivated land in terms of structure, distribution, and quantity on grain production potential (GPP) is essential for a sustainable land utilization strategy and food security. Cultivated land balance (CLB), as a critical policy aiming at protecting farmland in China, has greatly restricted the loss of cultivated land. However, changes in cultivated land were largely generated due to the land-use activities led by the CLB policy. To clarify how the spatiotemporal dynamics of cultivated land led by the CLB policy affects the GPP, this work discusses the impact mechanism of cultivated land changes on GPP and provides an empirical analysis in Hunan Province, China. This study shows that the activities that merely aim at restricting the loss of cultivated land under CLB cannot stop the decline in GPP in China, since it requires the government to reclaim a certain amount of cultivated land that is equal to that occupied for non-cultivated land use. Furthermore, the distribution of cultivated land changed after the implementation of CLB and, as a result, contributed to the decrease in the quality of cultivated land and GPP. Quantity, productivity, and other elements that may potentially facilitate cultivated land protection are greatly advocated to be considered to enrich the connotation of the CLB policy in China. It also found that less developed regions located in central and western Hunan Province, among other areas, observed a higher sensitivity of GPP to cultivated land change. More attention should be paid to protecting cultivated land in these regions and addressing issues such as the abandonment of high-quality cultivated land.
1. Introduction
Cultivated land degradation is threatening food security and, as a result, affecting global and regional sustainability [1,2,3,4,5,6]. Especially in recent years, with rapid economic growth, urbanization, and industrialization, a large amount of high-quality cultivated land has been occupied by construction in developing regions, including China, raising food security concerns. Strategies for sustainable cultivated land use have been increasingly discussed [7,8,9,10,11,12]. Accordingly, the Chinese government has been endeavoring to improve grain production [4]. However, challenges remain due to cultivated land loss [13,14,15], shortage of the labor force and water resources [16,17,18,19,20], and climate change [21,22]. To address these issues, China has implemented a series of policies and measures to protect cultivated land from the prospects of both quantity and quality, including the requisition–compensation balance of cultivated land (CLB), land-use regulation, basic farmland zoning, land consolidation, and rural land circulation [23,24,25,26], which have played positive roles in ensuring China’s food security.
Requisition–compensation balance of cultivated land was implemented in 1998 [27,28]. The policy requires that, if a government-approved construction project occupies cultivated land, the same amount of cultivated land must be supplemented elsewhere within the province to keep the balance of the total cultivated land. It was considered as a policy tool to balance the conflicts between the expansion of construction land and the protection of cultivated land. The local government can achieve the goal of land urbanization by developing cultivated land in underdeveloped areas. Since then, as one of the most primary approaches aimed to protect cultivated land, the policy has been widely implemented. From 2011 to 2015, 1,140,000 hectares of cultivated land were occupied by construction, and 1,707,333 hectares were supplemented in China. However, in recent years, many new problems have arisen in the practice. For example, the lack of reserve cultivated land resources, occupying the high-quality land but supplementing the poor by developing cultivated land in mountains, and the high costs [27,28].
Therefore, some scholars have begun to consider how to improve this policy [27,28], despite the fact that the Chinese government has implemented a massive investment for protecting cultivated land and, to some extent, does achieve the goal of balancing the cultivated land occupied by construction [29]. More importantly, projects under requisition–compensation balance of cultivated land have resulted in the spatial transference of cultivated land, which caused the quality of cultivated land to change accordingly and triggered arguments about the effect of these projects on grain productivity. Scholars documented that the programs under requisition–compensation balance of cultivated land could hardly achieve the ambitious goals for protecting cultivated land in terms of both quantity and quality, and even result in a decline in bio-productivity [30,31,32]. Thus, some recent studies have focused on how cultivated land change affects food security, notably grain productivity. To deeply understand the relationship, frameworks based on statistical data have been provided to characterize cultivated land change and its effect on grain yields over time [33]. Multi-scale measurements of spatiotemporal grain production changes and cultivated land resources have been also applied [34]. Some scholars used the barycenter and sensitivity methods to analyze the spatial shifts in grain production increases in China [35]. They found that the center of grain production had moved towards the north and west of China and reminded readers that the spatial mismatch of grain production and cultivated land could be adverse to the sustainability of agriculture.
It is noteworthy that agricultural production is shaped by natural and socioeconomic factors [33]. Some studies demonstrated that local elements, including household size, cropping systems, land-use intensity, land tenure, climate change, and environmental costs, can influence grain productivity significantly [36,37,38,39,40,41,42,43,44,45,46,47,48]. The actual grain yields, to some extent, are determined by the quantity and quality of cultivated land, climate, agricultural technology, and cropping patterns. It is hard to accurately assess and simulate the yields. Thus, the current literature has focused on the effects of cultivated land dynamics and climate change on grain production potential (GPP) [32,49,50,51]. To address these gaps, methods such as the Global Agro-Ecological Zones (FAO-GAEZ) [52,53,54], the Deng Genyun model [55], and the Estimation System of Agricultural Productivity (ESAP) [51,56] were developed to calculate the GPP. Some scholars use meteorological prediction data to simulate future trends in cultivated land and GPP under different scenarios [57,58,59,60].
As noted above, current studies have contributed to optimizing cultivated land use and safeguarding food security. However, the requisition–compensation of cultivated land policy requires that the area be balanced within the provincial area, while most of the previous studies, which were carried out at the national and regional levels, can hardly guide local practices, especially at the provincial scale. In fact, with the implementation of this policy, the exposed issues, notably the lack of regulation for newly reclaimed cultivated land, insufficient backup resources for cultivated land, and potential ecological risks [28], should be solved at the provincial level. Further studies are advocated on cultivated land dynamics to revamp the policies.
As a vital grain production site in China, Hunan Province shows favorable agricultural production conditions in sunlight, temperature, heat, and rainfall. Impacted by the topography, grain production is mainly concentrated in northern, eastern, and southern Hunan. In these regions, the economic and climatic conditions are also relatively favorable. However, in recent years, urban and rural construction has occupied a large amount of high-quality cultivated land, and it remains unclear what the feedback of cultivated land change on grain productivity is. Considering the abovementioned facts, this study attempts to clarify how cultivated land has changed before and after the implementation of CLB, explore how and how much the change affects GPP, and answer the question of whether the current CLB policy is adequate to ensure grain production. In this paper, we discuss an influence mechanism of cultivated land change on grain production and provide an empirical analysis in Hunan Province, China. Additionally, we analyze the characteristics of cultivated land change and its influences on GPP from 1990 to 2014 using multi-sources data with a 30-m spatial resolution, and the methods of spatial statistics, land-use change indexes, the gravity center shift model, and the sensitivity model are applied in this paper. Based on the analysis, we propose response strategies of regional cultivated land protection, which could guide the planning and practice of cultivated land utilization, and provide a scientific basis and recommendations for the sustainable use of cultivated land.
2. Materials and Methods
2.1. Study Area
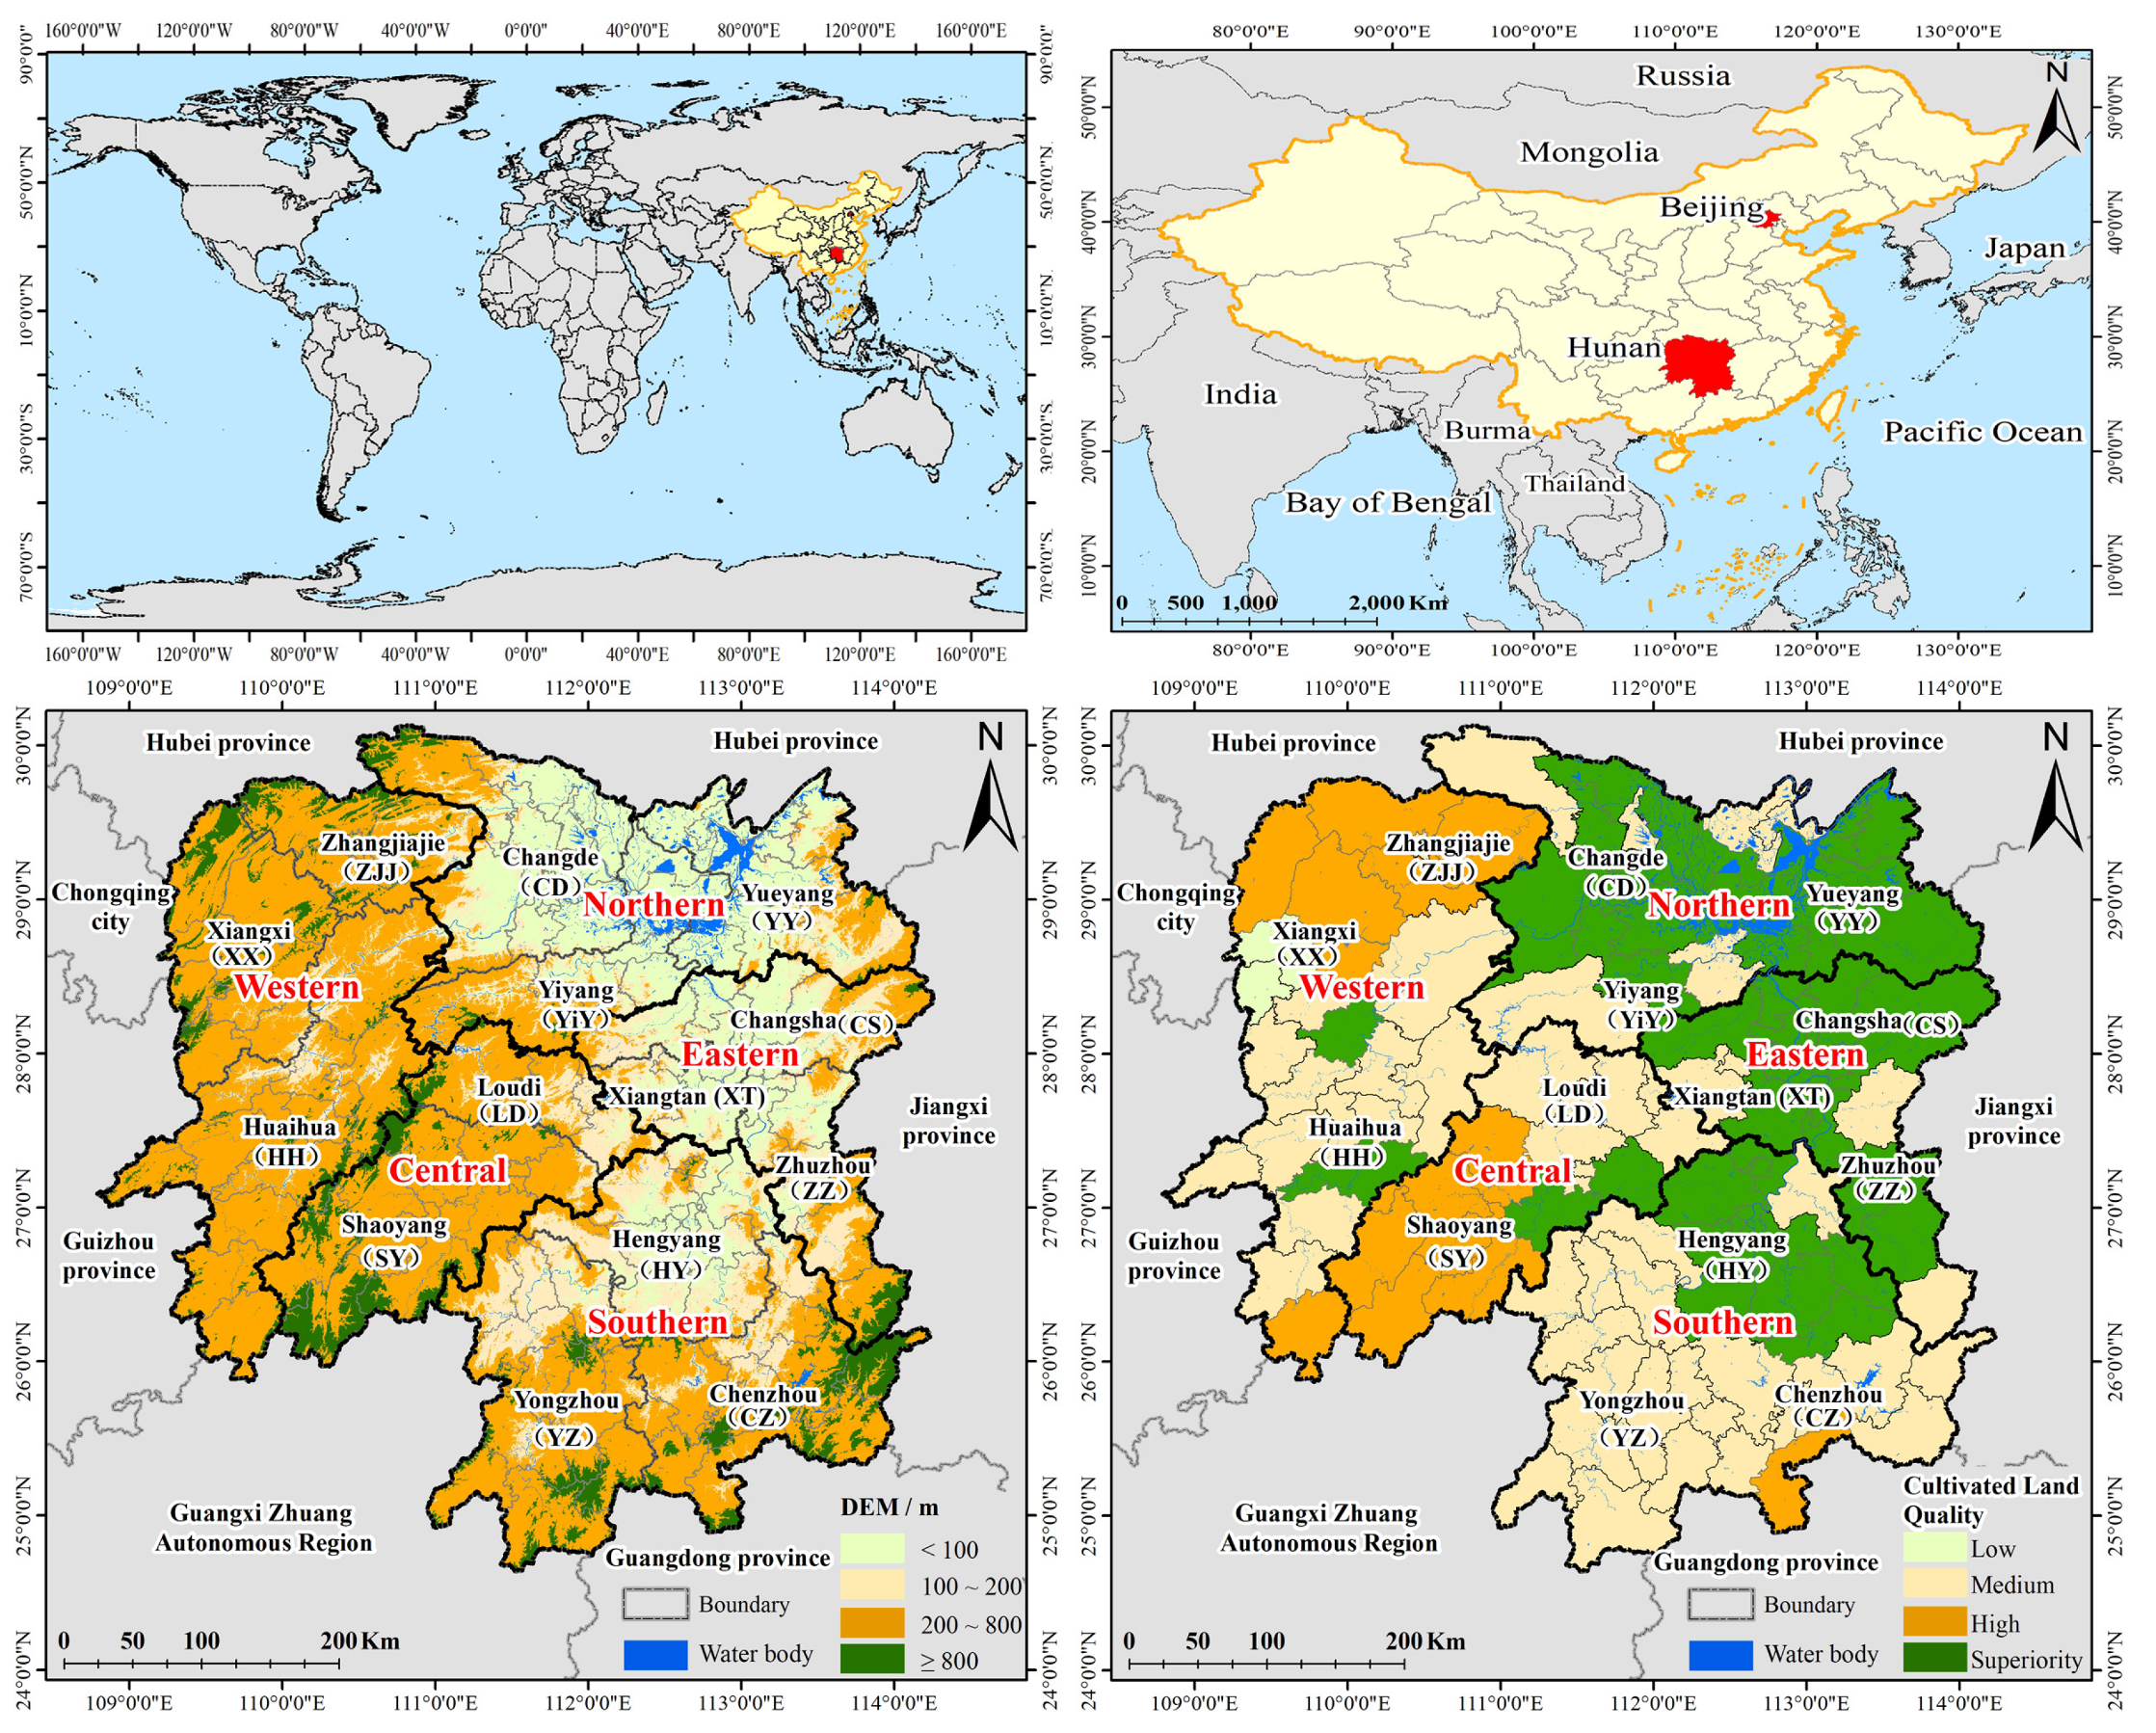
Hunan, as the largest province located in Central China as well as the middle reach of the Yangtze River, comprises a total territory area of 211,800 square kilometers, which accounts for 2.2% of the entire territory area of China. Hunan province has 14 municipalities, which are Changsha (CS), Zhuzhou (ZZ), Xiangtan (XT), Yueyang (YY), Yiyang (YiY), Changde (CD), Loudi (LD), Shaoyang (SY), Hengyang (HY), Yongzhou (YZ), Chenzhou (CZ), Huaihua (HH), Xiangxi (XX), and Zhangjiajie (ZJJ). From 1990 to 2018, the population grew from 60.66 million to 68.97 million, and the urbanization rate increased from 17.55% to 56.02%. Overall, eastern and northern Hunan have relatively robust economic development and high urbanization rates. According to the statistics, 45.05% of the province’s population, 64.75% of the province’s GDP, and an urbanization rate of 63.36% were found in these regions in 2018. Moreover, more drastic changes in land use/land cover in eastern and northern Hunan occurred from 1990 to 2014, the construction land has increased by 126,975.39 hectares, which accounts for 55.71% of the total increase area of construction land in Hunan, and cultivated land has decreased by 98,471.48 hectares, which accounts for 35.63% of the total decrease area of cultivated land in Hunan. Since ancient times, Hunan Province has been an important grain production base and has been known as the land of fish and rice due to the favorable agricultural production conditions, and the total grain production has been over 60 billion kilograms in recent years. Hunan Province has a subtropical monsoon humid climate, with an average annual temperature of approximately 16–18 °C and average annual precipitation of approximately 1200–1800 mm. In addition, Hunan Province has a dense network of rivers and a well-developed water management system. Thus, the cultivated land of Hunan is mainly paddy fields, accounting for over 70%. According to the survey, the terrain of northern, eastern, and southern Hunan is relatively flat and the quality of cultivated land is relatively high, as shown in Figure 1.
2.2. Data Sources
The land-use datasets with a spatial resolution of 30 m for 1990, 2000, and 2014 were derived by interpreting the Landsat remote sensing images (https://www.usgs.gov), and this dataset was provided by Data Center for Resources and Environment Sciences, Chinese Academy of Sciences (RESDC, http://www.resdc.cn). These datasets use a three-level land-use classification theme. It covers 6 first-level land-use types and 25 s-level land-use types (Table 1). The digital elevation model (DEM) data with a spatial resolution of 30 m were obtained from the United States Geological Survey (USGS, https://www.usgs.gov). The data of precipitation and temperature were obtained from China’s Meteorological Data Network (http://data.cma.cn) and the Hunan Provincial Statistical Yearbook. The administrative district data were derived from the national basic geo-databases. In addition, the dataset of reconstructed photosynthetically active radiation in China (1961–2014) [61] and soil classification data (Harmonized World Soil Database, HWSD) were used in our study.
2.3. Influence Mechanism of Cultivated Land Change on Grain Production
There are some reasons for the decline in grain production, such as the decrease in cultivated land area, the decline in the yield per unit of land, and the change in the planting structure. As shown in Figure 2, we systematically discuss the influence mechanism of cultivated land change on grain production in China. The government supplemented the area of cultivated land by projects such as land development, land reclamation, and land consolidation, to balance the amount of cultivated land occupied by urban construction. However, there are other reasons for the decline in cultivated land, for example, ecological degradation, land abandonment, and land pollution. Therefore, the total amount of arable land is continuously decreasing. All these have led to changes in the amount, structure, and spatial location of cultivated land. With the changes in the spatial location of arable land, the conditions of agricultural production have also changed, and thus the quality of cultivated land will inevitably be influenced and then affect grain production potential change. Specifically, the amount and structure of cultivated land directly affect the structure and area of food crops, and the spatial shift of cultivated land is accompanied by changes in natural production conditions such as soil, light, temperature, water, and heat, which in turn affect the productive potential of the land. Therefore, in this paper, after systematically analyzing the mechanism of influence of cultivated land changes on grain production, we comprehensively characterize the number and structure of changes in cultivated land in Hunan Province and deeply explore the changes in cultivated land under different elevation, slope, accumulated temperature, and rainfall conditions. Then, we use spatial statistics and sensitivity models [62] to evaluate the influence of cultivated land changes on grain production potential and its spatial pattern in Hunan Province.
2.4. Methodology
2.4.1. Quantitative Methods for Calculating the Number and Structure Change
The change in the amount and structure of cultivated land is depicted through the land-use change index, land transfer matrix, and other methods. The land-use change rate can reflect the magnitude of land-use change, and the land-use transfer matrix can accurately tap the sources of supplementary cultivated land and the destination of occupied cultivated land.
where LUCR is the cultivated land change rate, and Areai,b and Areai,a are the areas of land-use type i at the end of the study period (b) and the beginning of the period (a), respectively.
2.4.2. The Analysis Method of Spatial Variation Characteristics of Cultivated Land
Drawing on previous studies and other related technical regulations [63], we reclassed Hunan Province into four levels according to DEM < 100 m, 100~200 m, 200~800 m, and ≥800 m, with area ratios of 21.85%, 17.08%, 53.01%, and 9.06%, respectively. The slopes 0~2°, 2~6°, 6~15°, 15~25°, and ≥ 25° were reclassed into five levels, and the area ratios were 5.16%, 20.54%, 34.58%, 23.22%, and 16.50%, respectively. When the daily average temperature rises steadily above 10 degrees Celsius, most crops can grow actively. An accumulated temperature (T) of >10 °C is the total of the daily average temperature during a period greater than or equal to 10 degrees Celsius. We reclassed Hunan Province into five levels according to T < 5500 °C, 5500~5600 °C, 5600~5700 °C, 5700~5800 °C, and ≥5800 °C, and the area ratios were 14.87%, 17.29%, 18.53%, 29.02%, and 20.29%, respectively. According to the annual average precipitations of 0~1500 mm, 1500~1570 mm, 1570~1640 mm, 1600~1810 mm, and ≥1810 mm, we reclassed Hunan Province into five levels, and the area ratios were 26.98%, 30.97%, 23.88%, 11.26%, and 6.92%, respectively. Then, we used the intensity of land-use change and the relative change index of land use to describe the characteristics of cultivated land change under different natural production conditions. LUCI and RLUCI were used to analyze the land-use change intensity variation in different regions.
LUCI is the index of the intensity of land-use change for land type j within spatial unit i, e.g., in the zoning of agricultural characteristics factors. This index allows cross-sectional comparisons of the degree of variation in categories within different levels, and it can be calculated using Formula (2).
where TAj is the total area of spatial unit j, and Areai,b and Areai,a are the areas of land-use type i at the end of the study period (b) and the beginning of the period (a), respectively.
RLUCI is the relative change rate of land-use change, and it can better analyze the degree of local changes in land type i relative to the whole province and compare the differences in change intensity across regions. It can be calculated using Formula (3).
where Areai,b and Areai,a have the same meaning as previously mentioned, and TAi,b and TAi,a are the total area of land-use type i at the end of the study period (b) and the beginning of the period (a), respectively.
2.4.3. Methodology for Estimating Grain Production Potential
The grain production potential of cultivated land for the years 1990, 2000, and 2014 was estimated using the stepwise revision of sunlight, temperature, water, and soil [29,47]. Formulas (4)–(6), and (7) were used to calculate the photosynthetic production potential (YQ), light–temperature production potential (YT), climatic production potential (YW), and soil production potential (YS) for each cultivated land pixel [29,47]. It means that we have to calculate YQ first and then calculate YT, YW, and YS in sequence. Finally, we used Formula (8) to obtain the total GPP in the study area.
where C in Formula (4) is the dry matter calorific value and its value is 4250 kcal/kg [32,55], F is the optical energy utilization rate and its value is 3% [32,55], Q is the total solar radiation, calculated from the photosynthetic effective radiation data [32,55], and the photosynthetic utilization rate, which takes the value of 0.49, and E is the crop economic coefficient (0.42 for rice, 0.40 for corn, and 0.35 for wheat) [32,55]. In this paper, the paddy field’s value is 0.42, and the value of dryland is 0.38. The T in Formula (5) is the average temperature of the crop during the growing period (May–September). The f(w) in Formula (6) is the moisture correction coefficient. Due to sufficient rainfall in Hunan Province, the rainfall is greater than the amount of evapotranspiration. Thus, in this paper, f(w) takes the value of 1. f(s) is the soil correction coefficient from a previous study [64]. The Si in Formula (8) is the area of cultivated land in polygon i, Yi,s is the grain production potential of polygon i, and the unit is kg/hm2.
2.4.4. Assessing the Impact of Cultivated Land Change on Grain Production Potential
To analyze the impact of changes in cultivated land quantity, structure, and location on grain production, the changes in grain production potential in each city were calculated, and the gravity center shift model was used to reveal the movement trajectory of cultivated land area and grain production, thereby judging the future trend. The concept of barycenter stems from physics and it refers to a certain spatial point, in all directions of which the powers are relatively balanced [35]. The barycenter model has often been used to analyze population changes, economic development changes, etc., and it is a common analytical model in geography [65,66]. The calculated method can be seen in reference [35,62]. In addition, the sensitivity model was used to measure the responsiveness of the grain production potential changes to the paddy field and dryland in each county [62].
GPPi,t and GPPi,t+1 in Formula (9) are the GPP values of land type i at the beginning and the end of the period, respectively, and areai,t and areai,t+1 are the areas of land type i at the beginning and end of the period, respectively. In this model, when SEN < 0, it indicates that the grain production potential is not sensitive to the cultivated land area change. When SEN > 0, it suggests that the grain production potential is positively correlated with the cultivated land area change; the larger the SEN value, the more sensitive the grain production potential change. According to previous studies [62], four levels of sensitivity have been classified as follows: (a) it is non-sensitive when SEN ≤ 0, (b) it is slightly sensitive when 0 < SEN ≤ 5, (c) it is moderately sensitive when 5 < SEN ≤ 10, and (d) it is highly sensitive when SEN > 10. After calculating the sensitivity of GPP to the change in cultivated land, paddy fields, and dryland, we related their value to each county in ArcGIS, in order, according to the above reclass rule, to symbolize them for better analysis of their spatial characteristics.
3. Results
3.1. Overall Characteristics of Cultivated Land Change
From 1990–2014, the area of cultivated land generally decreased in Hunan Province. The characteristics of cultivated land change varied among different local regions. Specifically, the net decrease in paddy fields was observed in all the regions, especially in Changde (CD) and Changsha (CS), from 1990–2014 (Figure 3). Changde (CD), Changsha (CS), Yueyang (YY), and Yiyang (YiY) showed a large decrease in paddy fields, while Yueyang (YY), Yiyang (YiY), and Changede (CD) showed increases of paddy fields. Moreover, the net decrease in dryland was observed in all the regions except Zhangjiajie (ZJJ), and it was especially prominent in Chengzhou (CZ), Yongzhou (YZ), Huaihua (HH), and Shaoyang (SY). The net reduction area of cultivated land was 276,481 ha, representing a change rate of −4.43%, and this area was mainly distributed in southern Hunan, eastern Hunan, and northern Hunan, which accounted for 46.23%, 17.87%, and 17.77% of the total decreased area, respectively. The change rate of cultivated land showed the characteristics of southern Hunan (7.43%) > eastern Hunan (5.73%) > central Hunan (3.12%) > northern Hunan (2.86%) > western Hunan (2.07%). From the perspective of the second-level categories, the net decreased area of paddy fields was 120,184 ha, and this area was mainly distributed in eastern and northern Hunan, which accounted for 32.59% and 29.00%, respectively, while the net decreased area of dryland was 156,297 ha and mainly distributed in southern Hunan, which accounted for 68.75%.
3.2. Cultivated Land Change in Different Production Condition Zones
3.2.1. Changes in Cultivated Land at Different Altitudes
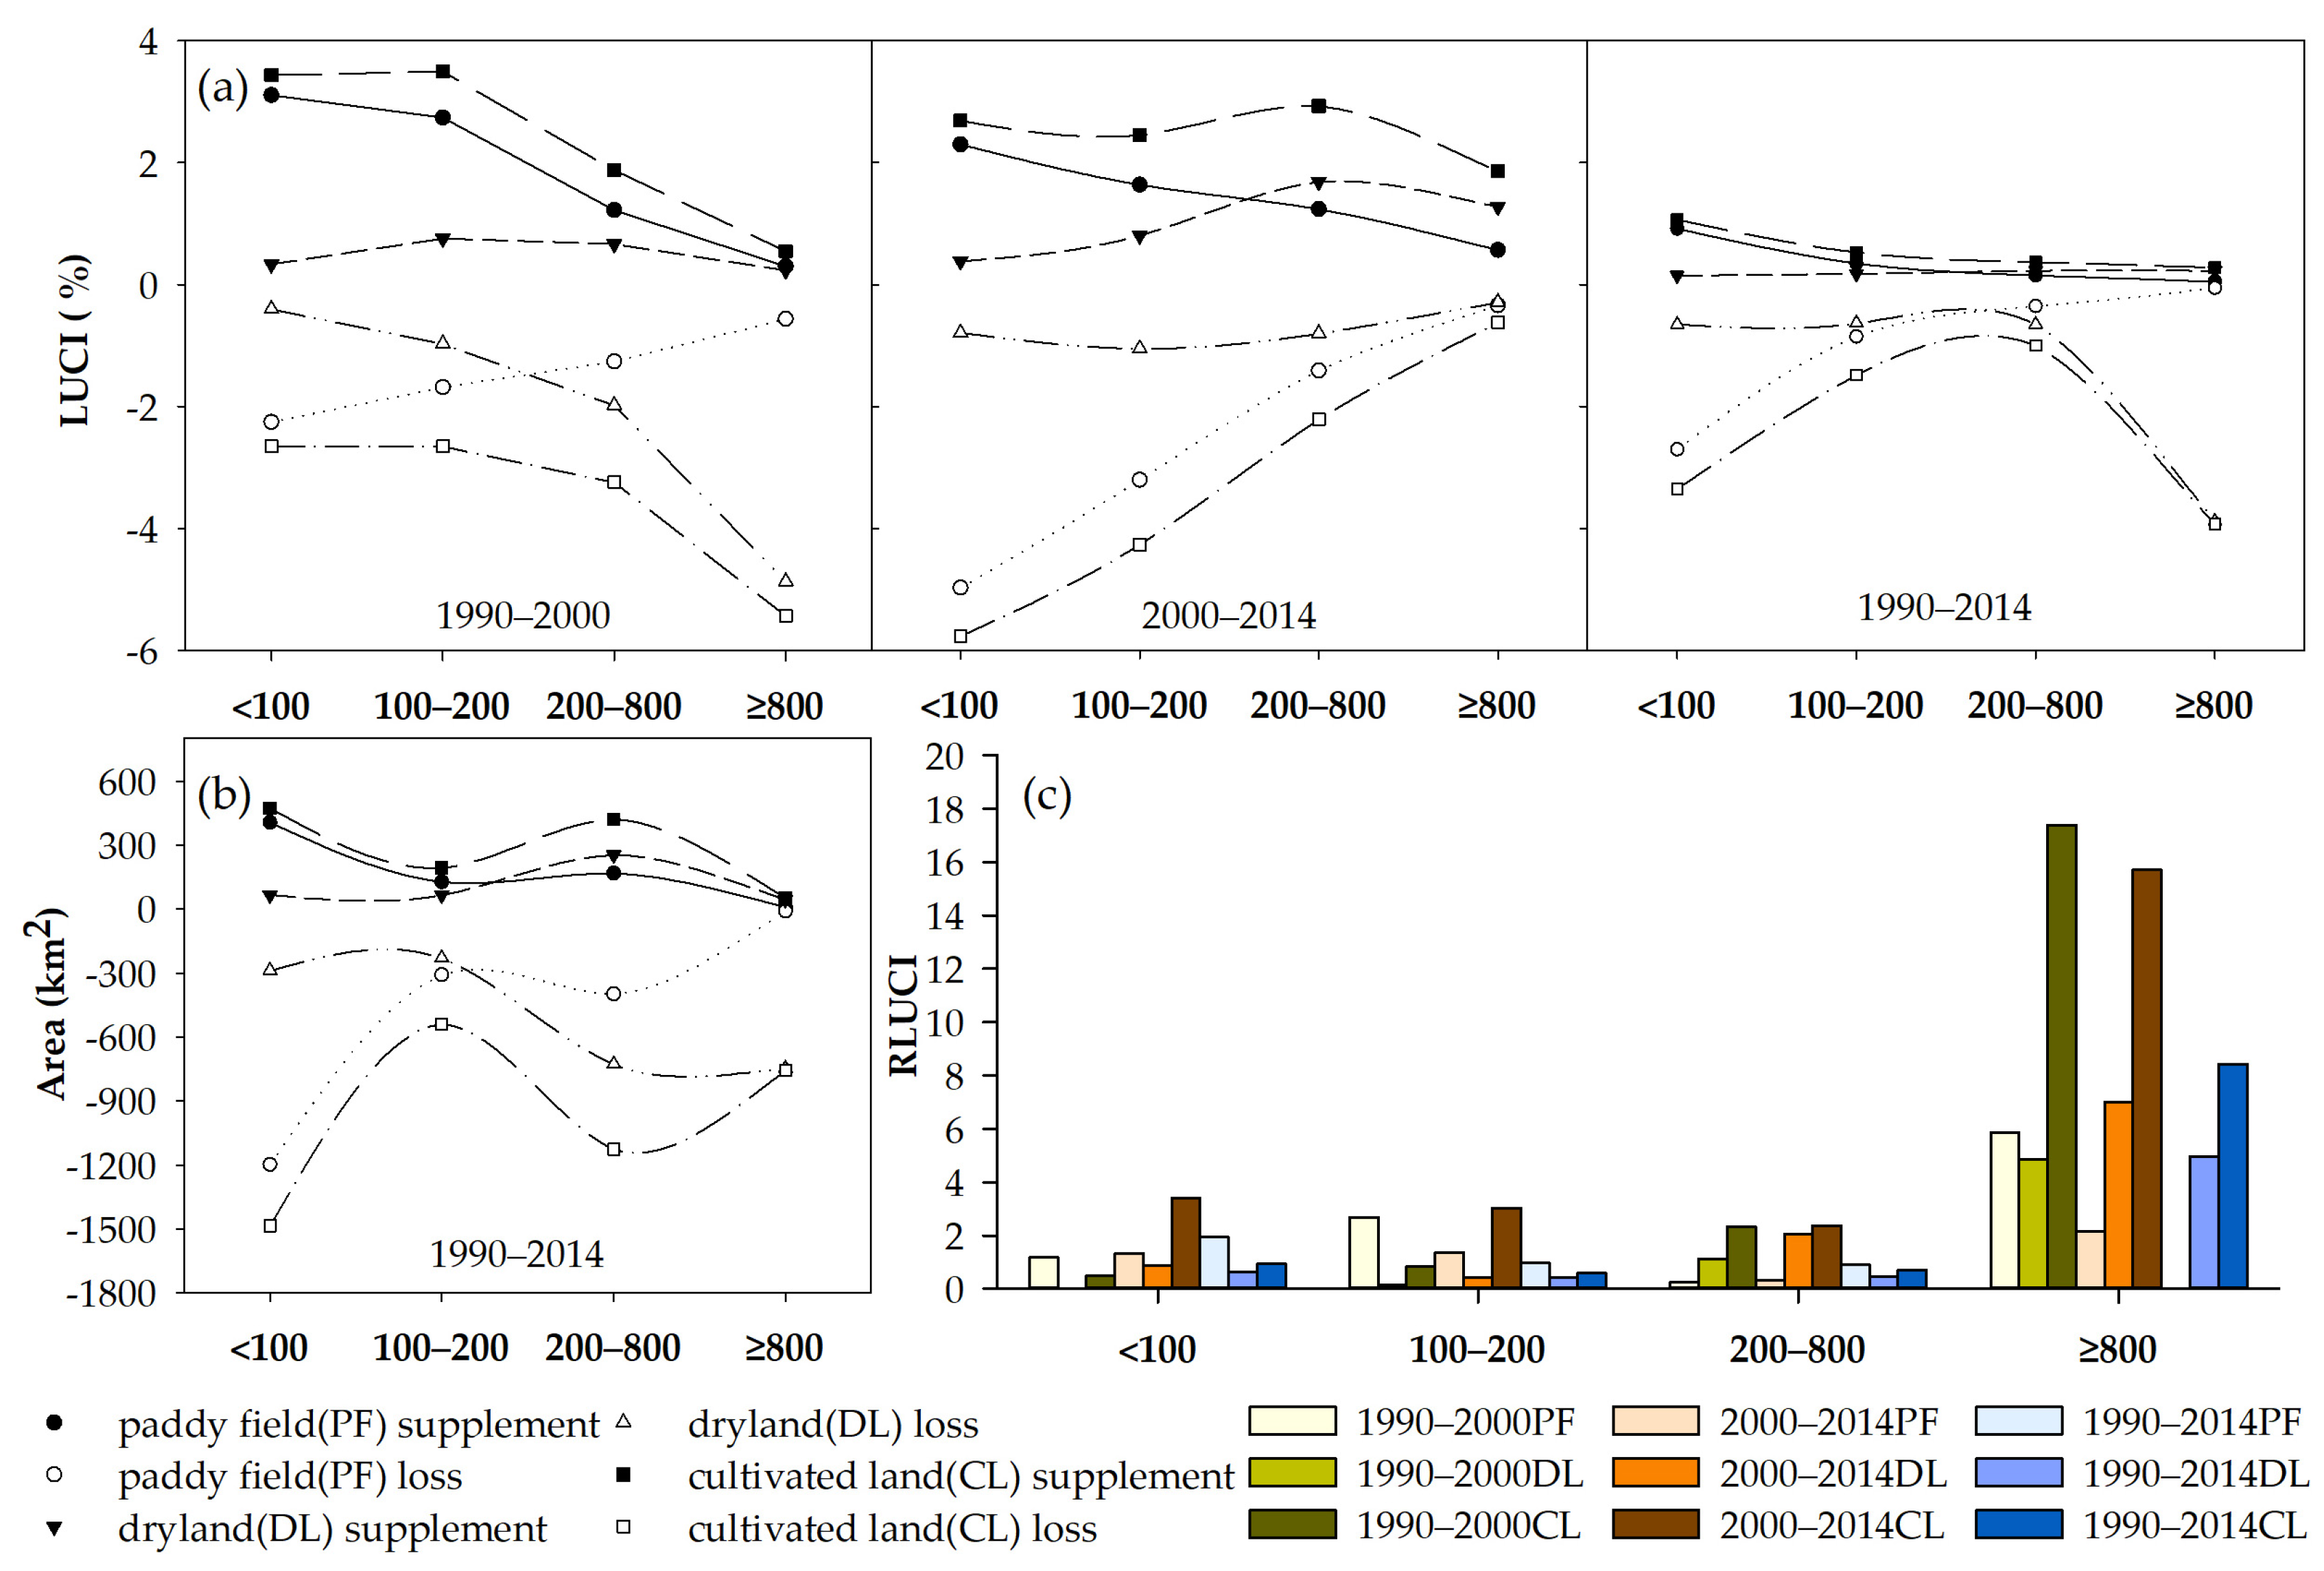
An academic consensus has been reached that agricultural production is closely related to altitude when other conditions are similar, a higher altitude is associated with a lower temperature, and the crop growth cycle is longer. From 1990 to 2014, the cultivated land area decreased at all elevation levels, with an inverse S-shaped relationship with the DEM; among them, paddy fields changed mainly in the region where the DEM was lower than 100 m and drylands changed mainly in the region where the DEM was between 200 and 800 m (Figure 4b). The LUCI of supplementary cultivated land and the DEM showed a weak negative correlation, and the LUCI of occupied cultivated land and the DEM had an inverted U-shaped relationship (Figure 4a). From the perspective of supplementary land, the relationship between the LUCI and DEM showed strong stage characteristics, and the LUCI of cultivated land and paddy fields had a negative correlation with the DEM in the periods of 1990–2000 and 2000–2014. The LUCI of dryland was not significantly associated with the DEM in the first period and was weakly positively associated with altitude when it was over 100 m in the second period. From the perspective of occupied land, the LUCI of cultivated land and dryland was first positively correlated with the DEM and then became negatively correlated, and the LUCI of paddy fields was always negatively correlated with the DEM (Figure 4a). When the DEM was higher than 800 m, the RLUCI values of paddy fields and dryland were the largest, and over time, the RLUCI values decreased in paddy fields and increased in drylands (Figure 4c), reflecting that the change in cultivated land in high-altitude areas was more dramatic, therefore, protecting cultivated land in these regions is difficult.
3.2.2. Changes in Cultivated Land at Different Slope Levels
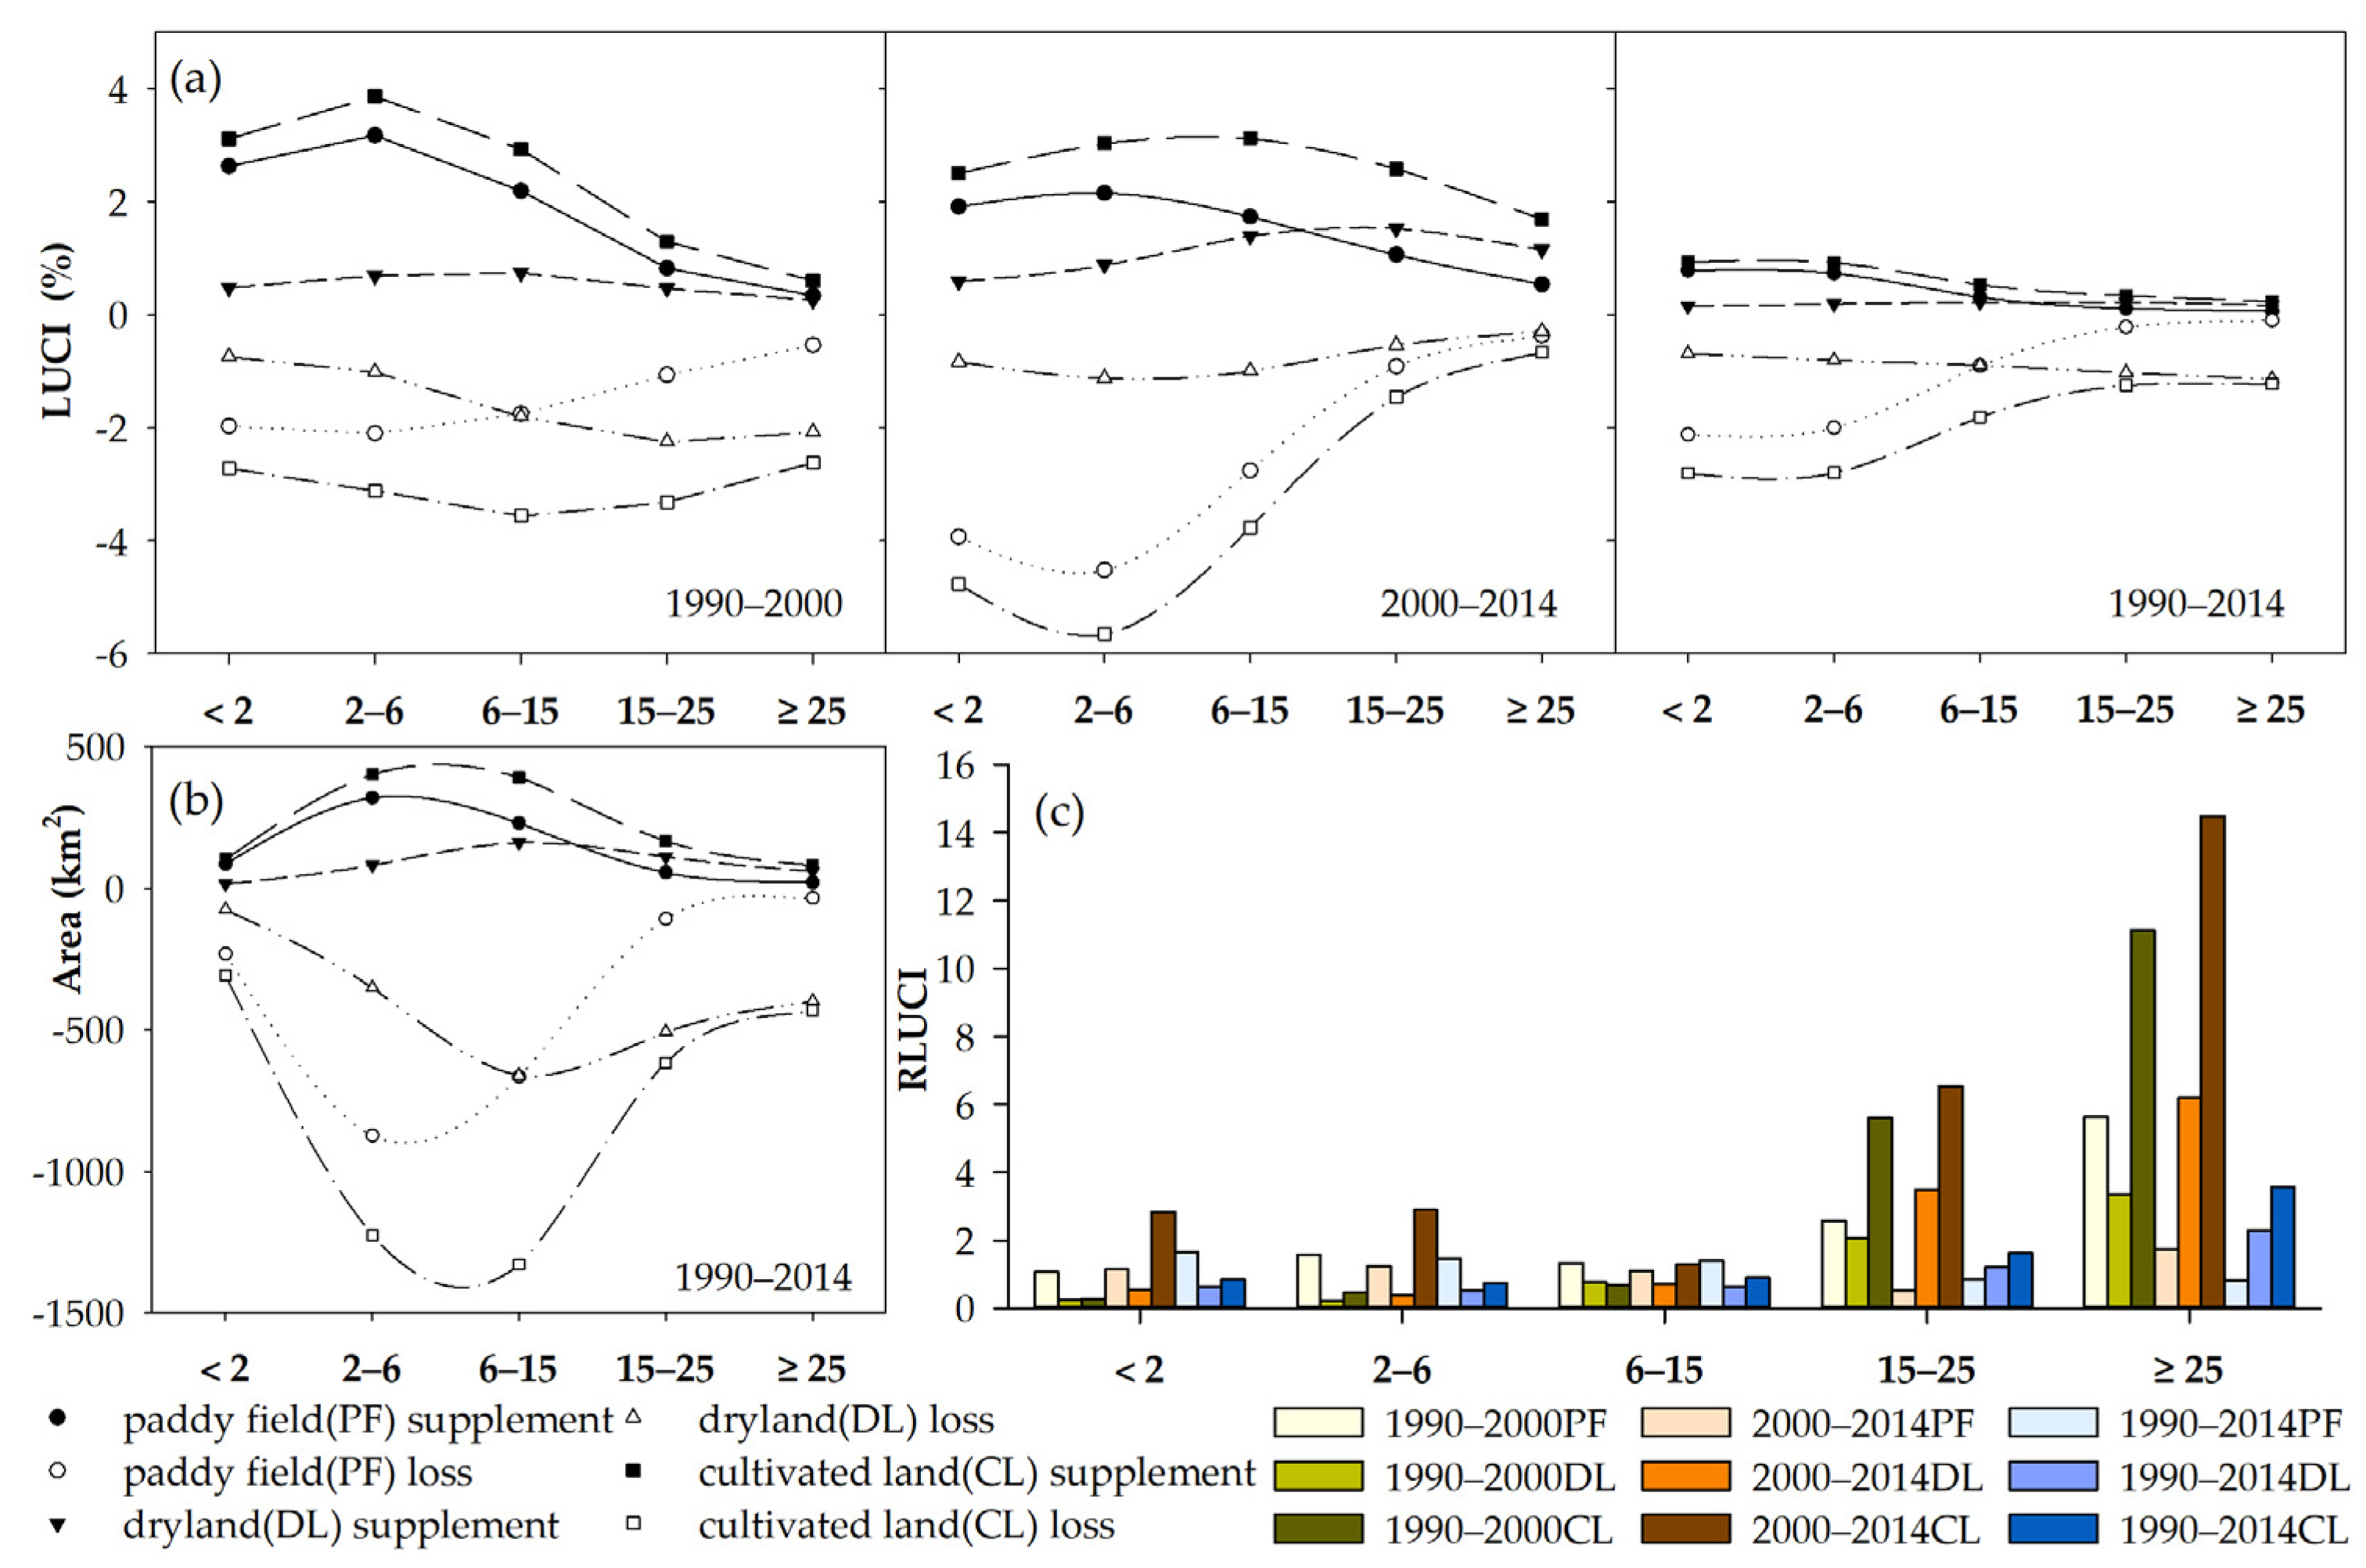
From the perspective of area changes (Figure 5b), paddy field increases and decreases primarily occurred in regions with slopes ranging from 2° to 6°, and dryland increases had no obvious relationship with the slope, but the decrease had a positive relationship with the slope. From the perspective of change intensity, the LUCI of the supplementary paddy fields showed a negative correlation with slope, and the LUCI of supplementary dryland had no significant relationship with slope from 1990 to 2000 but then showed a weak positive correlation from 2000 to 2014. The LUCI values of occupied paddy fields and slopes were strongly negatively correlated in each period, and the LUCI value increased greatly in the region where the slope was between 2° and 6° from 2000 to 2014, suggesting that paddy fields were heavily occupied during this period. The LUCI of occupied dryland was positively correlated with the slope in the first period and not significantly correlated in the second period (Figure 5a). It is worth noting that the dryland decreased sharply in areas with slopes greater than 15° from 1990–2000, although dryland increases were observed from 2000–2014. According to the analysis of the RLUCI and slope, we found that the change in cultivated land in the area where the slope was larger than 15° was more dramatic (Figure 5c). In general, the RLUCI of paddy fields and drylands in low-slope areas was generally larger than that of cultivated land, while the RLUCI of paddy fields and drylands in high-slope areas was smaller than that of cultivated land, indicating that the change direction of paddy fields and dryland was opposite in the low-slope region and the same in the high-slope region.
3.2.3. Changes in Cultivated Land at Different Temperature Conditions
From 1990 to 2014, the changes in cultivated land area in Hunan Province were mainly distributed in the region where the accumulated temperature was between 5700 and 5800 °C, e.g., eastern Hunan, northern Hunan, and portions of southern Hunan. The change in cultivated land was mainly in paddy fields, and the area of reduction was much larger than the area of increase (Figure 6b). From the perspective of change intensity (Figure 6a), the LUCI of paddy fields was generally higher than that of dryland in the region where the accumulated temperature ranged from 5600 to 5800 °C; however, in the region where the accumulated temperature was higher than 5800 °C or lower than 5600 °C, the situation was the opposite (Figure 6a). This result may be due to the large area of dryland in the low-temperature region (e.g., western Hunan) and high-temperature regions (e.g., southern Hunan), while the medium-temperature region (southern Hunan, eastern Hunan, and central Hunan) has a large area of paddy fields. In general, in each temperature region, the increase in cultivated land was mainly in the form of paddy fields, and the decrease in cultivated land was mainly in the form of dryland (Figure 6a). From the perspective of change intensity, the RLUCI of cultivated land in the low-temperature area was relatively large. The changing intensity of cultivated land in the western Hunan area was greater than that in other regions (Figure 6c).
3.2.4. Changes in Cultivated Land under Different Rainfall Conditions
From 1990 to 2014, the reduction in dryland was mainly distributed in areas with high precipitation, while the reduction in paddy fields was mainly distributed in areas with low rainfall (Figure 7b). Since 1990, the LUCI of paddy fields had a negative correlation with rainfall in both supplementary paddy fields and occupied paddy fields, but the LUCI of occupied paddy fields was significantly greater than that of supplementary paddy fields. The LUCI of supplementary dryland had no obvious relationship with rainfall in the period of 1990–2000 but had an S-shaped relationship in the period of 2000–2014. The LUCI of occupied dryland always had an anti-S relationship with rainfall (Figure 7a). The relationship between the RLUCI and rainfall showed that the RLUCI was larger in areas with high rainfall, which was exactly the opposite of the paddy field area change, possibly because the total area of paddy fields in these areas was small (Figure 7c).
3.3. Impacts of Cultivated Land Change on GPP
3.3.1. Impact of Cultivated Land Quantity and Structure Change on Total GPP
From 1990 to 2014, the total grain production potential of cultivated land in Hunan Province decreased significantly from 102.98 million to 85.26 million tons, signifying a reduction of 17.72 million tons, with a change rate of −17.21%, of which the production potential of paddy fields decreased by 11.67 million tons, with a change rate of −15.33%; furthermore, the production potential of dryland decreased by 6.05 million tons, with a change rate of −22.54%. It can be seen that changes in paddy fields were the main reason for the reduction in the food production potential in Hunan Province. This is because the grain crops in Hunan Province are mainly rice, wheat, and corn and are relatively small. On the other hand, occupied lands include high-quality paddy fields with better production conditions, especially in northern and eastern Hunan, but supplementary lands were low-quality paddy fields with poor production conditions (e.g., climate, DEM, slope, and soil) in other regions. From the perspective of time series changes, the total grain production potential of paddy fields remained relatively stable from 1990 to 2000 and increased significantly in Zhuzhou, Yongzhou, and Shaoyang. However, it decreased rapidly in Changde, Yiyang, Yueyang, and Changsha from 2000 to 2014, while the total GPP of drylands continued to decline from 1990 to 2014, mainly in Changde, Chenzhou, Huaihua, Xiangxi, and Shaoyang (Table 2).
3.3.2. Impact of Cultivated Land Conversion and Spatial Location Change on Total GPP
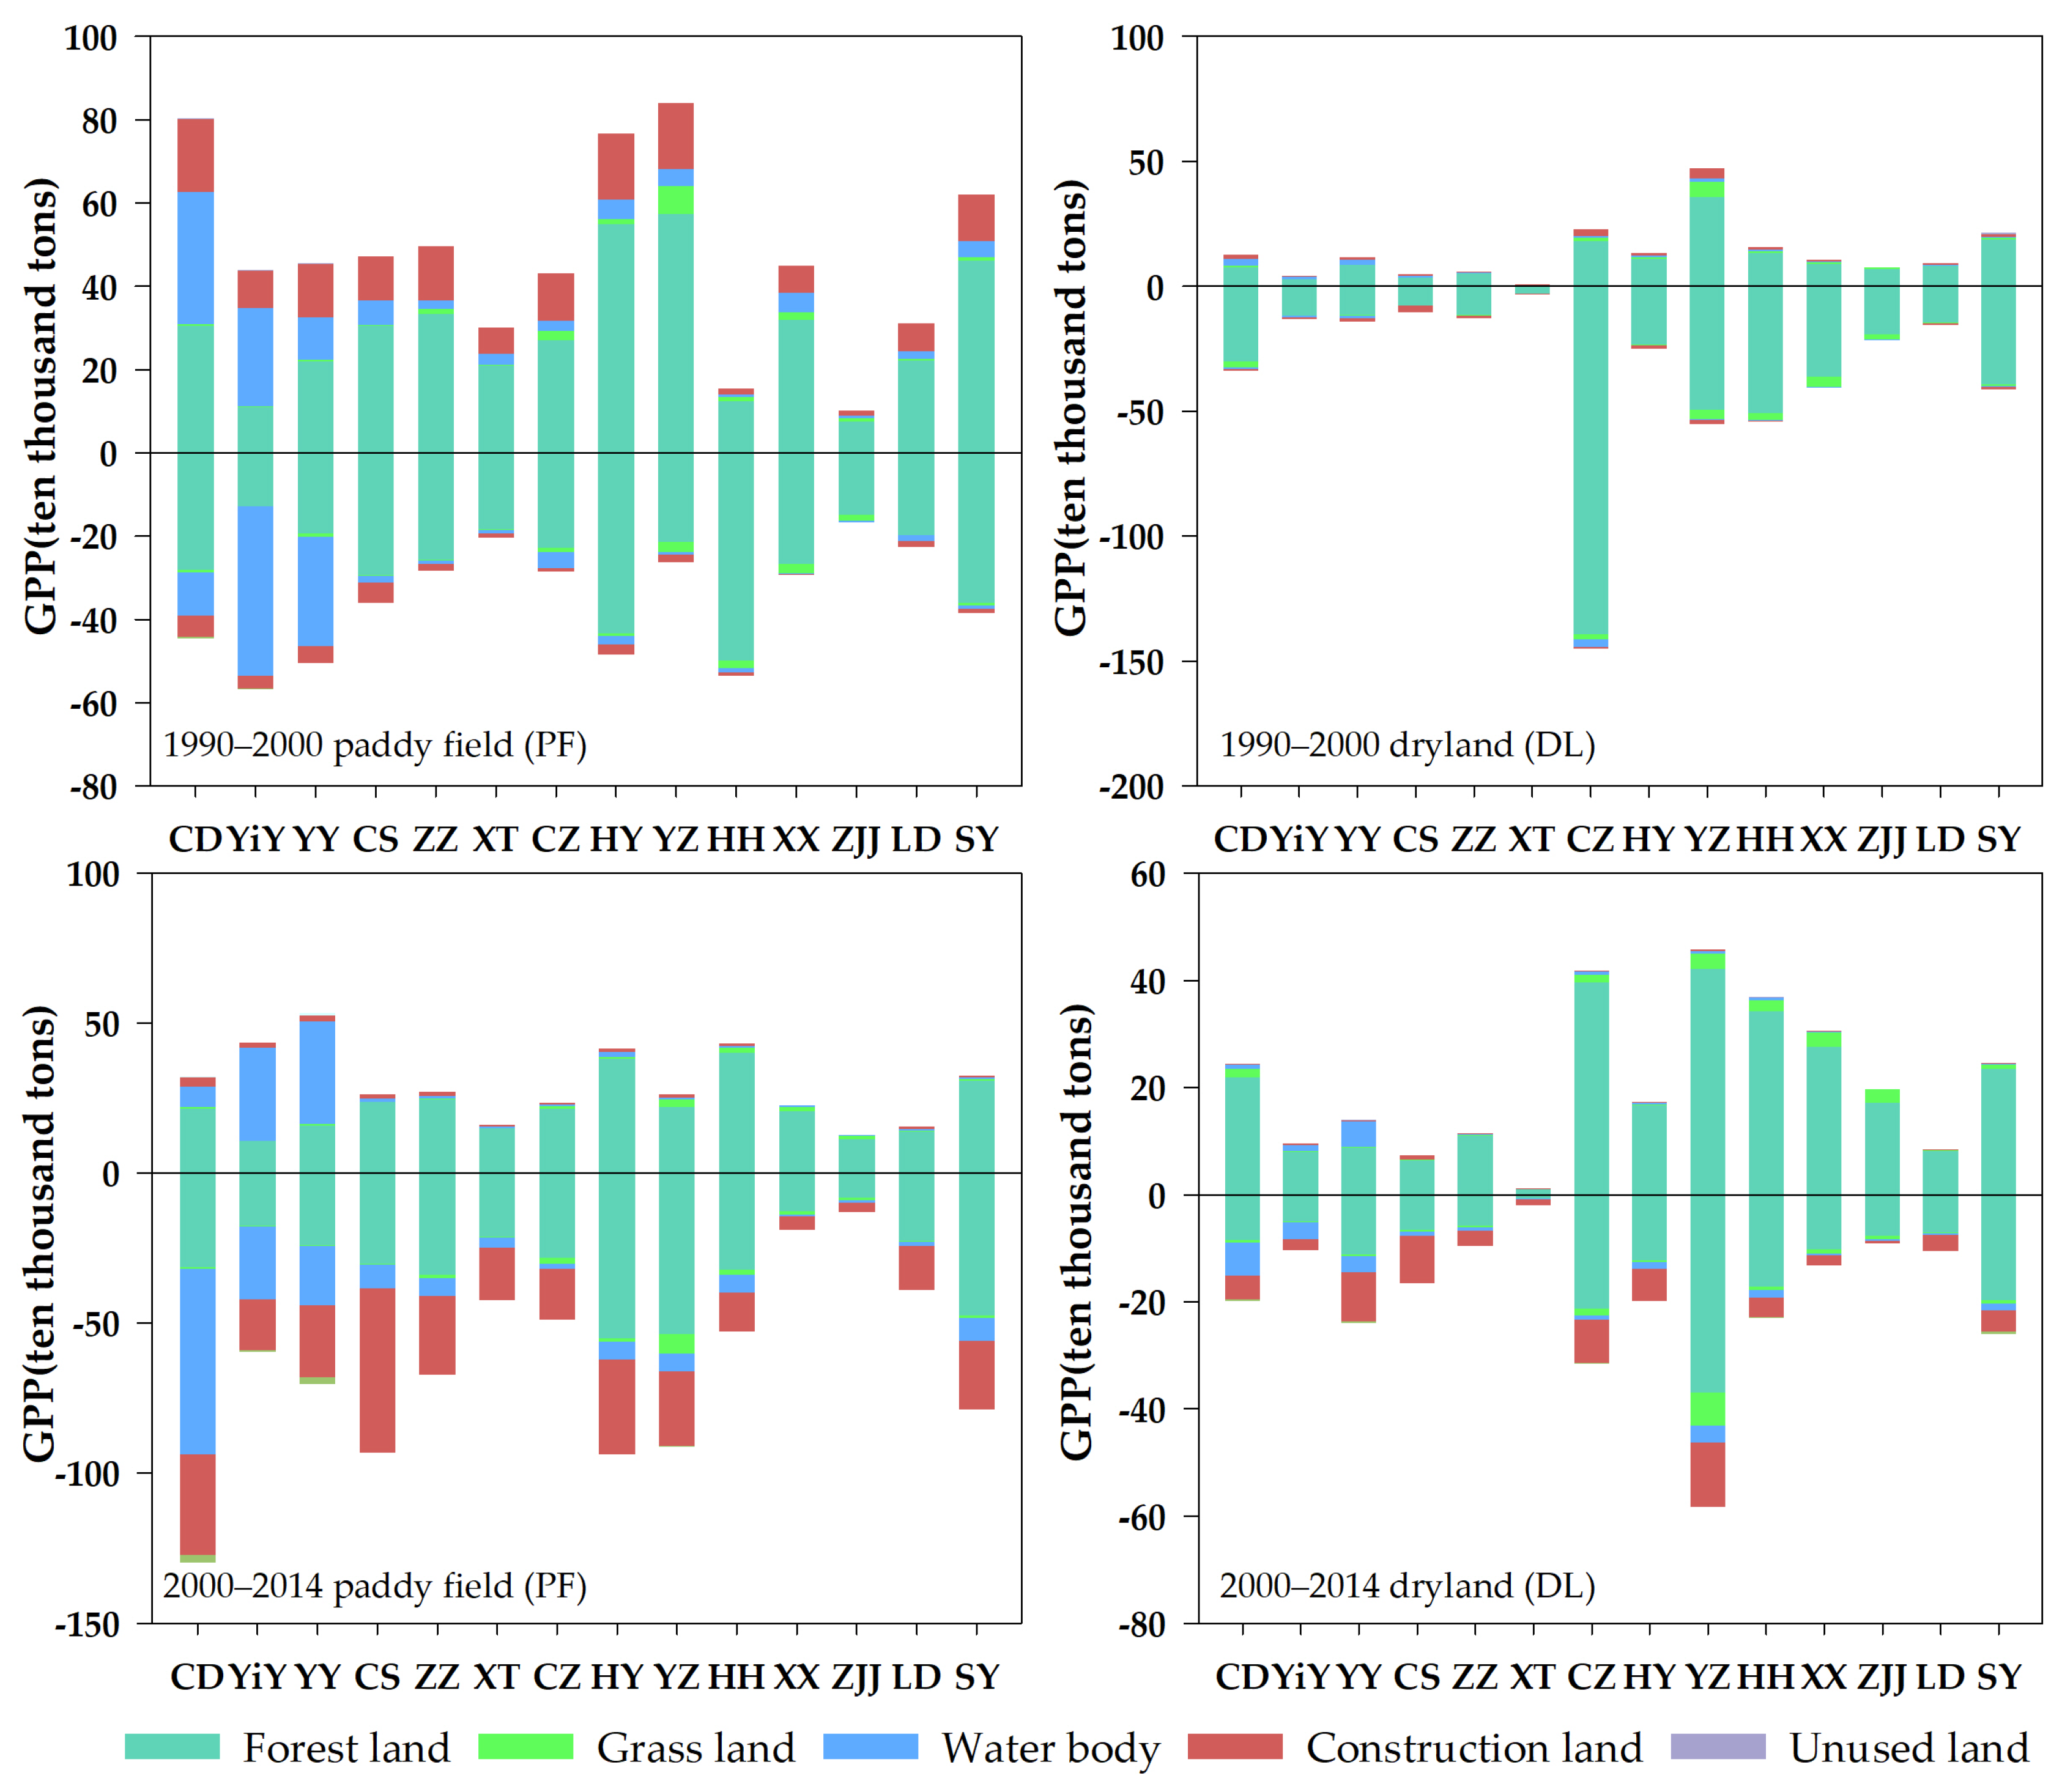
From the overall point of view, the interaction of paddy fields and forest land, construction land, water area, dryland, and forest land had a greater impact on the grain production potential and showed strong spatial differences and periodic characteristics. Specifically, the increase in grain production potential was mainly due to the reclamation of forest land and construction land into paddy fields from 1990 to 2000. The conversion of paddy fields from water bodies in Changde (CD), Yiyang (YiY), and Yueyang (YY) also increased the GPP. The decrease in GPP was mainly due to returning dryland to forest land, which was mainly distributed in southern and western Hunan. From 2000 to 2014, the increase in the GPP of paddy fields was similar to that of the previous period, and the reclamation of forest land into dryland in southern and western Hunan also significantly increased the GPP. During this period, the reasons for the reduction in GPP began to become complicated, e.g., urban construction, returning farmland to lakes, and returning farmland to forest land. Among them, the cultivated land occupied by urban construction was mainly distributed in Changsha (CS), Changde (CD), and Hengyang (HY), and the farmland that was returned to forest land was distributed primarily in Hengyang (HY), Yongzhou (YZ), Shaoyang (SY), and Chenzhou (CZ) (Figure 8).
3.3.3. Impact of Cultivated Land Change on the Spatial Pattern of GPP
From 1990 to 2000, the production potential per unit area of supplementary cultivated land was generally higher than that of reduced cultivated land, indicating that the quality of supplementary cultivated land was usually higher than that of reduced cultivated land during that period, while from 2000 to 2014, the opposite was true. Specifically, the GPP per unit of supplementary cultivated land converted from water bodies and construction land was relatively high from 1990 to 2000, and all supplementary cultivated land declined from 2000 to 2014. For the GPP per unit of occupied cultivated land converted to water bodies, construction land was relatively high, followed by forest land and grassland during 1990–2014 (Figure 9), suggesting that human activities, such as returning farmland to lakes and building towns, led to the loss of high-quality cultivated land, while reserving cultivated land resources with good production conditions led to them being increasingly available.
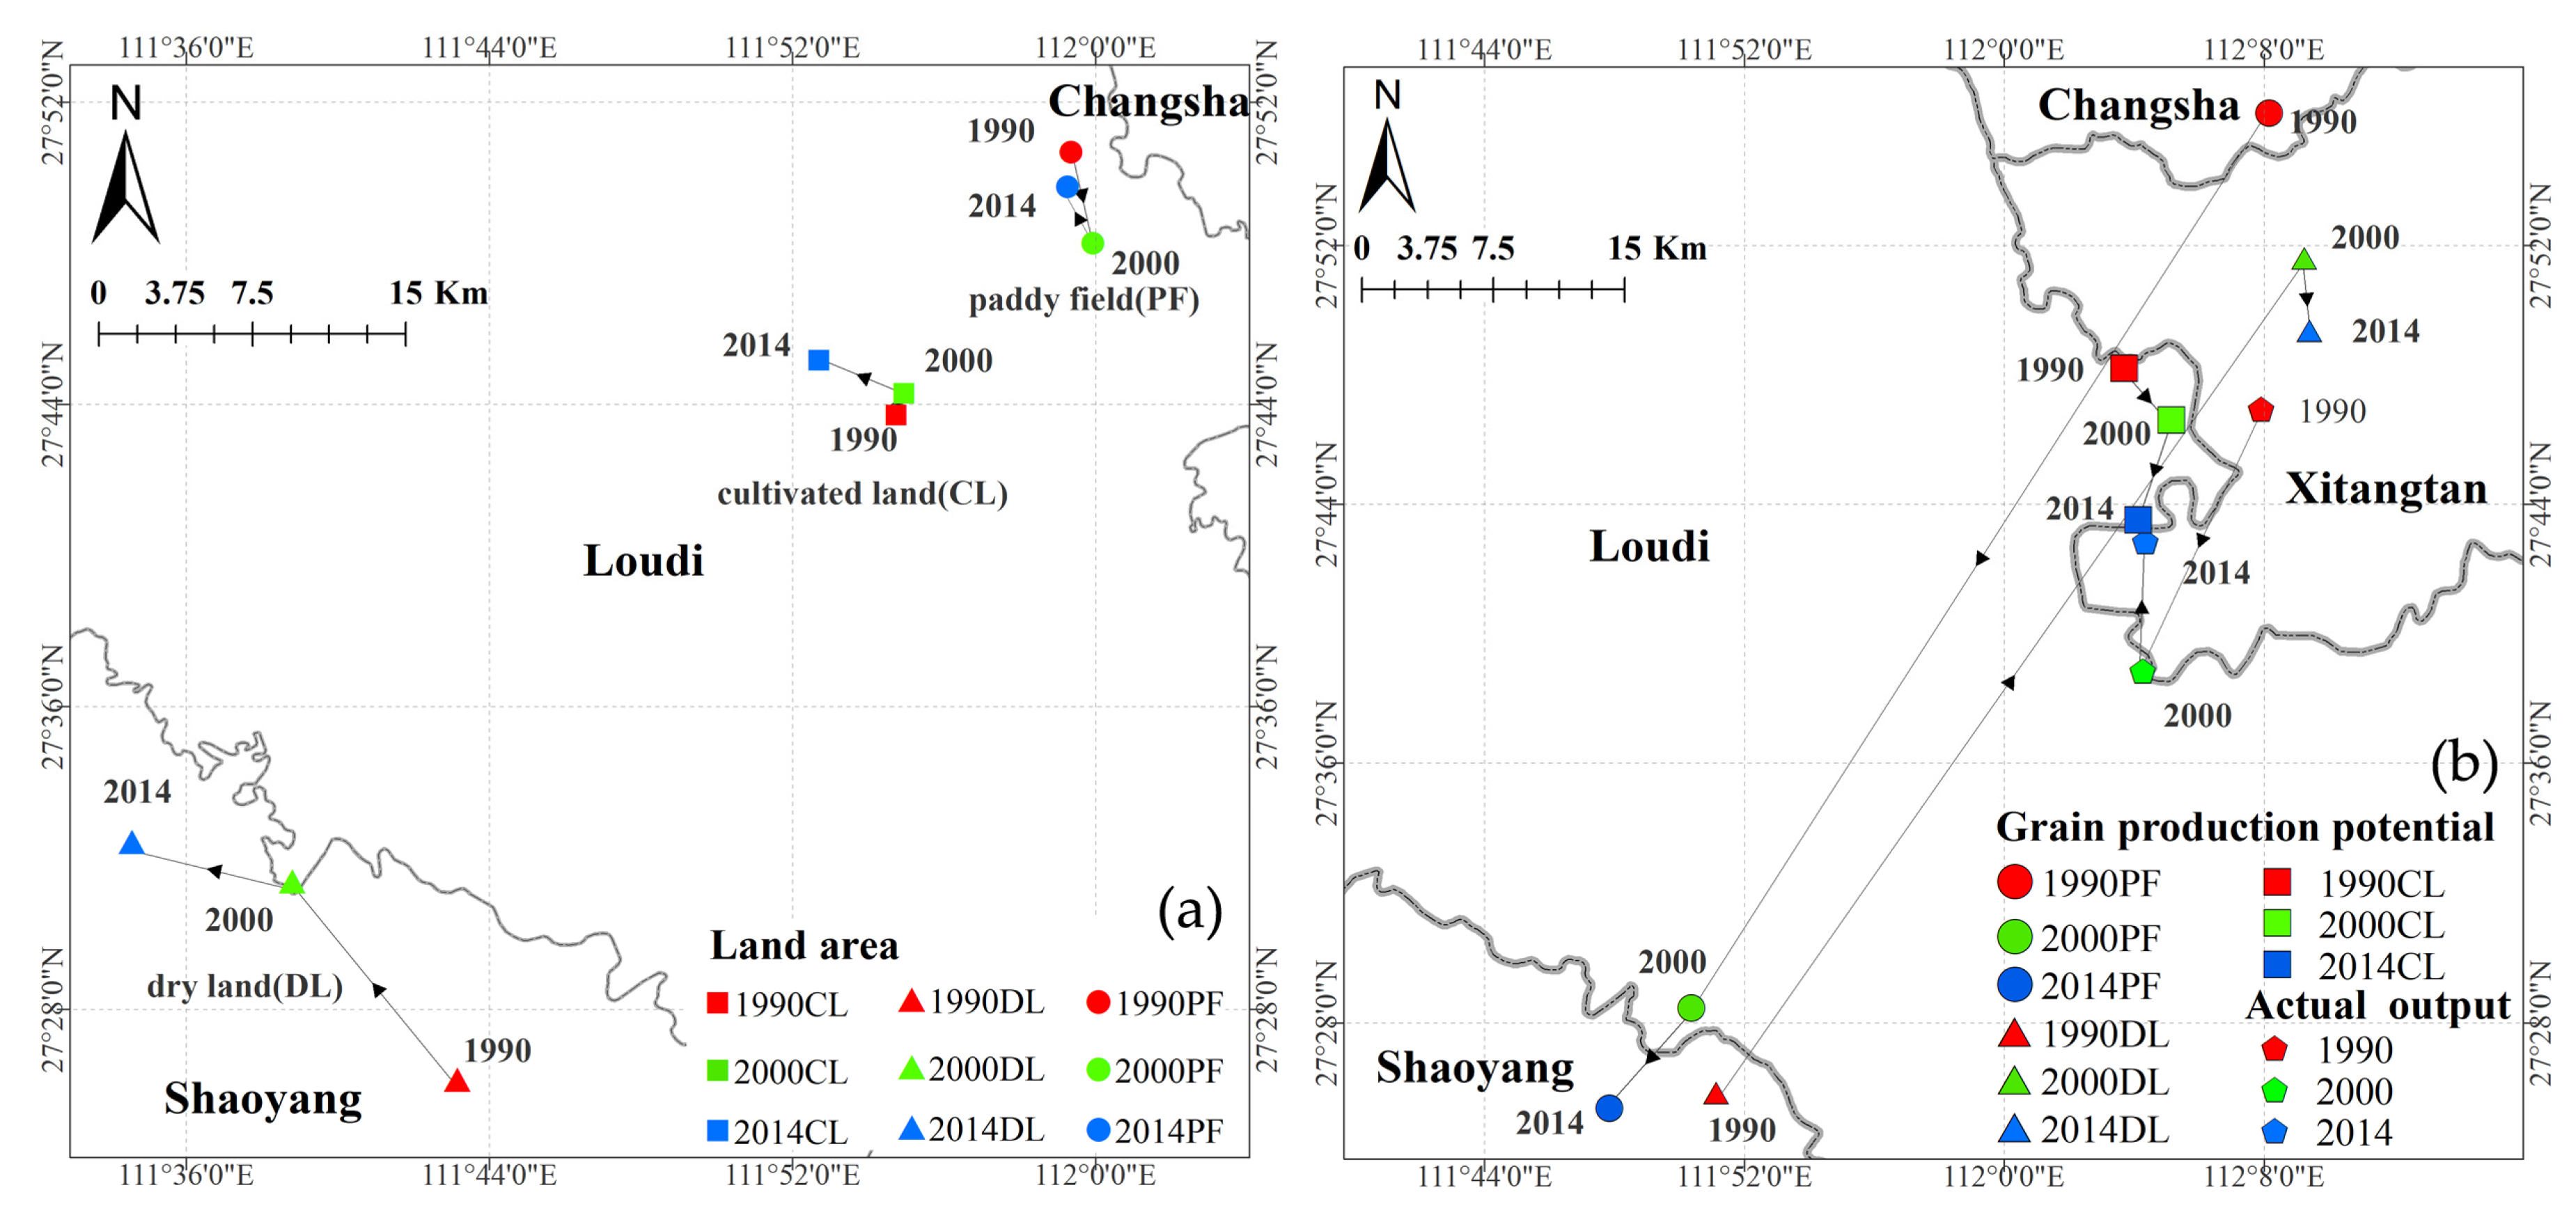
As shown in Figure 10a, the barycenter of the cultivated land area is located in Loudi City, showing the trend of a shift to the northwest from 1990 to 2014. From a second-level categorical point of view, the barycenter of the paddy field area was also located in Loudi City, showing the trend of a shift to the south. The center of the dryland’s area was located in Shaoyang City, showing a moving trend to the northwest. Comparing the movement tracks, it was found that dryland’s barycenter shifted the farthest, while the paddy fields’ shifted slightly, probably because most of the occupied cultivated land was paddy fields, and earlier policies require cultivated land balance in the municipal area. Consequently, the spatial shift in paddy fields was not significant, while the westward shift of dryland was mainly due to the significant reduction in the dryland area due to ecological degradation in Chenzhou (Figure 3). As shown in Figure 10b, the GPP barycenter of paddy fields and dryland shifted a large distance from 1990 to 2014, and paddy fields continued to shift southwest, while the dryland first moved to the northeast and then moved slightly to the south. Overall, there was little change in the GPP barycenter of cultivated land, moving first to the southeast and then to the southwest, and it became increasingly closer to the actual grain production barycenter.
3.3.4. The Spatial Pattern of Sensitivity of GPP to Cultivated Land Change
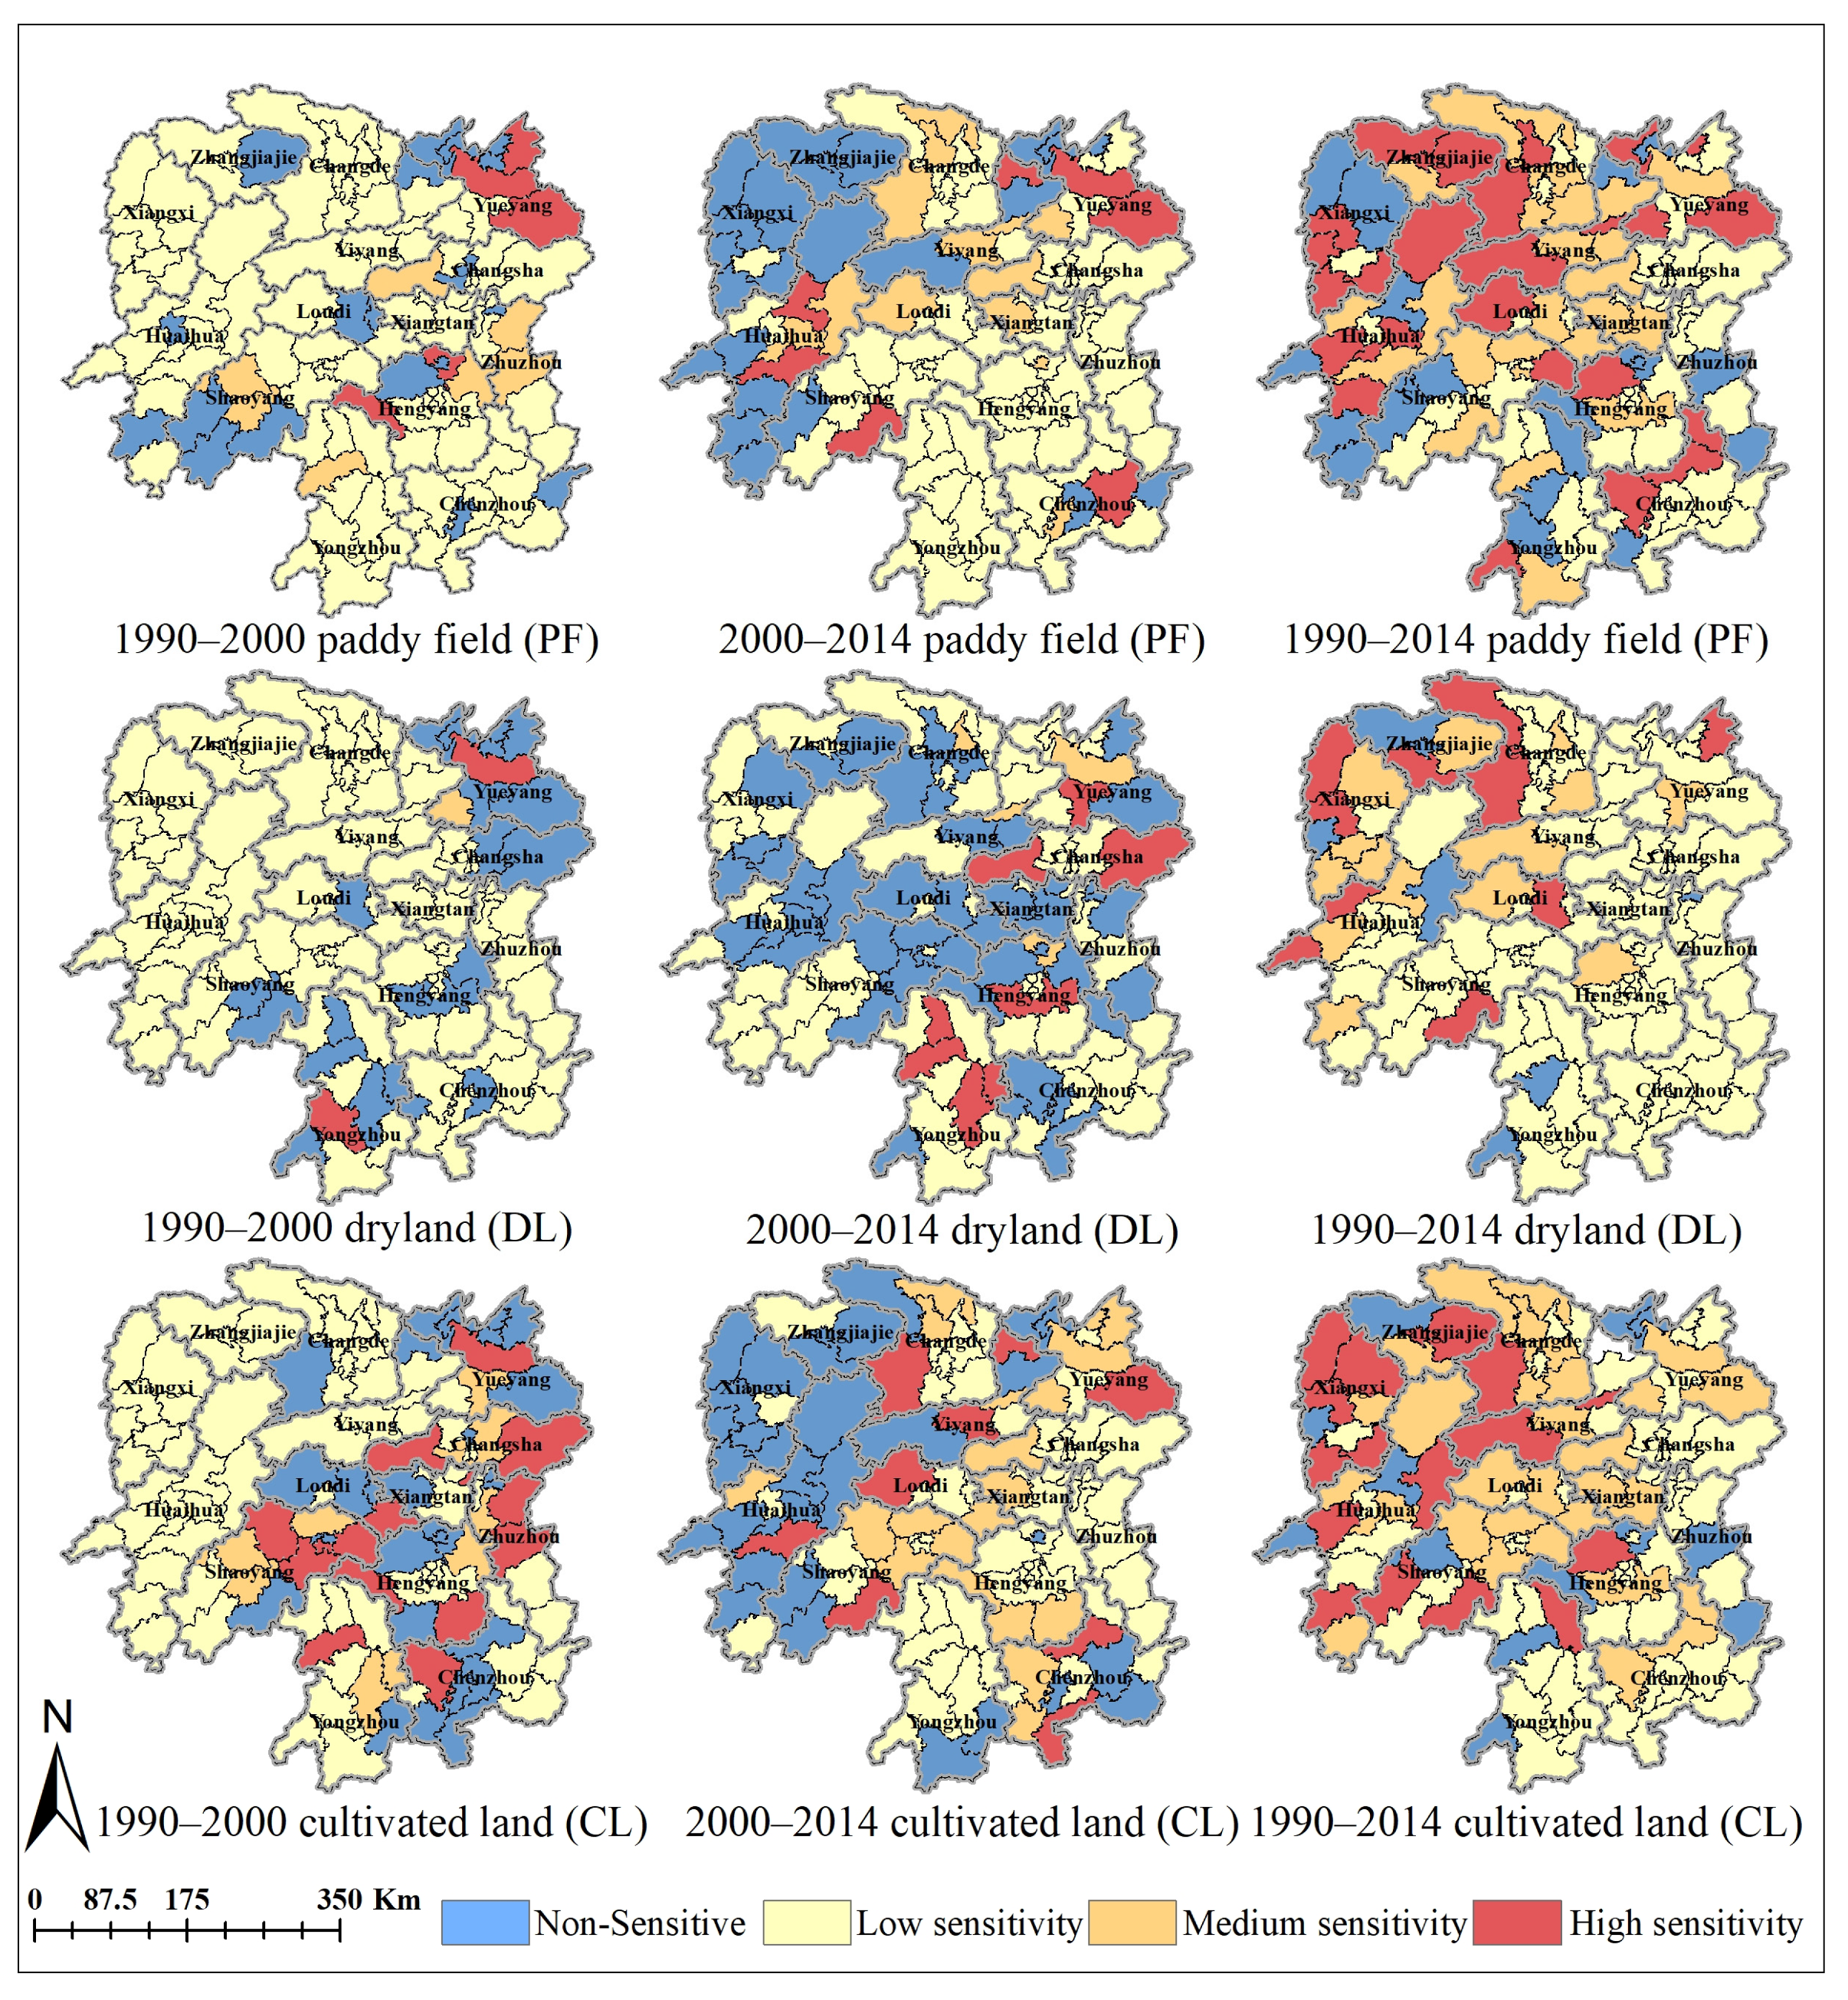
As shown in Figure 11, the number of insensitive counties was relatively stable between 1990 and 2000 and 2000 and 2014, while the number of low-sensitivity and highly sensitive counties decreased slightly and the number of moderately sensitive counties increased in the later period. In terms of land types, the grain production potential was not very sensitive to the area change in paddy fields and dryland in various periods. The number of insensitive and low-sensitivity counties accounted for approximately 90%. In contrast, the number of highly sensitive and moderately sensitive counties showed the following characteristics: cultivated land > paddy field > dryland. It was also found that the number of highly sensitive and moderately sensitive counties in the two periods was lower than that from 1990 to 2014, regardless of the overall cultivated land perspective or paddy fields and dryland perspectives. This result indicates that the longer the period and the more complex the land type structure, the higher the sensitivity of the grain production potential to the land area, while the land-use policies in different periods played a key role in mitigating the changes in GPP caused by land-use conversion.
From a spatial perspective, the spatial patterns of the sensitivity of cultivated land and paddy fields were more similar. As time progressed, the highly sensitive and insensitive levels of paddy fields and drylands tended to move westerly, and the concentration of highly sensitive, moderately sensitive, and insensitive levels increased. In general, the GPP of the contiguous region of Changde–Yiyang–Xiangtan–Loudi–Xiangxi was more sensitive to changes in cultivated land area, especially the change in paddy fields, while the GPP of eastern and southern Hunan was less sensitive to changes in cultivated land area. There were two possible reasons for this phenomenon. First, compared with eastern Hunan and southern Hunan, the natural production conditions in these areas were slightly worse, and the stability of land quantity had a more obvious role in ensuring the balance of the GPP. Second, because the proportion of paddy field area decreased in these regions, the production potential of paddy fields per unit area was larger than that of dryland; thus, changes in paddy field area had a greater impact on the regional GPP.
4. Discussion
The stability of the area, structure, and quality of cultivated land is fundamental to guaranteeing regional grain productivity. However, paddy fields and drylands showed a net decrease in Hunan Province since 1990. Combining the results of the evaluation of the cultivated land quality and the previous analysis, it can be seen that the reduced paddy field areas were mainly distributed in the area with better conditions of altitude, slope, accumulated temperature, and rainfall, and higher land quality area (e.g., in southern, eastern, and northern Hunan). The changes in the amount, structure, and spatial location of cultivated land caused a continuous decline in GPP, which will harm grain production in Hunan Province because we cannot improve the efficiency of agricultural technology inputs in a short period. However, statistics show that the area of grain sown in Hunan Province has stabilized at approximately 4.95 million hectares, agricultural machinery input has gradually increased, and farmers have improved the efficiency of the food production potential. However, grain production has remained at approximately 30 million tons, with no significant growth. If the area of cultivated land is reduced and the overall quality does not improve, this will inevitably lead to a continued decline in the regional GPP, which will make it difficult to meet the growing demand for food, even if agricultural development becomes more efficient. Moreover, there is a trend where the area of cultivated land and grain sowing continues to decrease under the serious situation of low agricultural economic efficiency, land abandonment, nongrain planting, and aging labor [18,23,28]. The current bottleneck in agricultural technology development and the reduction in the grain yield growth rate and how to guarantee regional grain production deserve our most in-depth consideration. We believe that it is particularly important to protect the quantity, structure, and quality of cultivated land to stabilize the regional grain production capacity.
From the perspective of the spatial characteristics of cultivated land change, the cultivated land area was significantly reduced when the elevation was >200 m and the slope was 2°~15°, although it was not excluded that part of this may be caused by ecological restoration. Combined with the existing research and the authors’ observations, it was found that there were indeed increasingly serious cultivated land abandonments in Hunan Province. Some policies strictly prohibit the construction of development zones and towns to occupy abandoned farmland that has been in place since the end of the last century, but allowing the continued existence of abandoned farmland is also a waste of resources, and it has become increasingly difficult to implement cultivated land requisition–compensation balance because of the lack of backup resources for farmland. In addition, some supplementary cultivated land in the area where the slope was bigger than 25° from 2000 to 2014 resulted in the phenomenon of abandonment in low slopes and reclamation in high slopes. Therefore, can we reutilize abandoned arable land as a new backup resource, especially that with better production conditions? On the one hand, it can increase the efficiency of cultivated land use and grain production; on the other hand, it can reduce the risk of ecological damage caused by cropland reclamation and save land reclamation funds [28]. Therefore, the government needs to attach great importance to the phenomenon of cultivated land abandonment and conduct a comprehensive investigation based on the standardized definition of abandoned cultivated land to know the scale and understand the mechanism of cultivated land abandonment [67,68,69], then a utilization plan can be developed, such as fallow rotation, reclamation, and other ways to prioritize the use of abandoned cultivated land where production conditions are good.
In terms of the impact of cultivated land changes on the GPP, we first analyzed the impact of changes in the area and the structure of cultivated lands on the total GPP and found that the impact of changes in paddy fields on the GPP was much greater than that of dryland. Then, we analyzed the impact of cultivated land location change on the GPP from the perspective of the difference in GPP per unit area and found that the GPP per unit area of supplementary cultivated land was generally higher than that of occupied cultivated land, e.g., the land decrease occurred in developed regions such as northern, southern, and eastern Hunan with better production conditions, but supplementary cultivated land occurred in other regions, further proving that the spatial transfer of cultivated land greatly reduced the regional GPP. When analyzing the gravity center of arable land area and the gravity center of grain yields, it was found that the gravity center of grain yield in paddy fields and drylands moved far more than their gravity center (Figure 10), and the GPP gravity center of paddy fields continued to shift to the southwest, indicating that more efforts are needed to protect high-quality paddy fields in eastern and northern Hunan. In addition, the sensitivity of GPP to changes in cultivated land was analyzed, and we found that highly sensitive areas tended to migrate from east to west, which means that investment in the protection of arable land in central and western Hunan should be increased in the future. For example, more funds should be invested to accelerate the implementation of dryland changed into paddy field projects and high-standard farmland construction projects in areas with higher GPP to enhance the productivity of cultivated land.
It is crucial to strengthen the comprehensive monitoring of the quantity, structure, and quality of cultivated land to reduce the risk of managers making incorrect decisions about cultivated land protection due to information bias and to guide the development of cultivated land resources. It is necessary to establish a new mechanism of cultivated land balance based on quantity, structure, and quality, with balanced productivity as the core in the future practice of cultivated land protection, which is more consistent with the request of equal quality between supplementary cultivated land and occupatied cultivated land, as clearly stated in the Land Administration Law of the People’s Republic of China (2019 amended version) [70]. Therefore, the production potential of cultivated land can be used as an important indicator to distinguish ecological or productive land when we perform spatial planning. In general, it is feasible to use remote sensing images, meteorological monitoring, soil surveys, and other data to systematically analyze the impact of cultivated land changes on GPP from the perspectives of light, temperature, water, and soil differences before and after the spatial transfer of cultivated land, which has certain reference significance for exploring the establishment of a dynamic, all-process, all-around monitoring system for cultivated land protection.
Compared with previous studies [32,33,35,49,50,51,56,62], our study is more detailed concerning land types and spatial resolution. Further, our study can guide the practice of cultivated land protection at the provincial scale. Of course, there are many insufficiencies in this paper, e.g., first, limited by the resolution of remote sensing images, the land classification data are bound to have some differences from reality. Second, the ecological and biodiversity protection of cultivated land has not been studied. Third, our research results may not be directly applicable to actual land management because the data we used were not obtained from their database. Fourth, some scholars have raised whether potatoes can add to China’s food self-sufficiency [71], but we did not assess potato productivity in our study. Fifth, compared with the GAEZ model, the GPP evaluation method in this article may only apply to China. Nevertheless, the research idea and methodology are feasible for exploring the establishment of an integrated monitoring system of quantity–structure–quality–GPP–ecology on a provincial or national scale, which is more adaptive to global climate change. At present, China has invested in many cultivated lands in other countries to ensure domestic food supply. The research idea and methodology can also be used to optimizate the region and the scale of China’s overseas farmland investments. In the future, we will further deepen our research from the following aspects: enriching the crop types, evaluating the GPP with internationally used models, and considering the yield gap between the GPP and actual output, in order to ensure our results better serve the Government’s decision.
5. Conclusions
In this study, we used remote sensing classification images, meteorological monitoring data, soil surveys, and other data to analyze the impact of cultivated land changes on the GPP in Hunan Province. We found that the quantity balance can mitigate but cannot stop the decline in GPP caused by the spatial location change in cultivated land because the production conditions are different in different regions, and we found that the GPP per unit area in eastern, northern, and southern Hunan is higher than other regions. In addition, most of the newly added cultivated land was converted from forest land, water areas, and construction land, and its quality was generally lower than that of occupied land. Overall, the area and the GPP of cultivated land both declined in Hunan Province from 1990 to 2014, and the occupation of high-quality cultivated land in northern and eastern Hunan was the main reason for the decline in GPP. The net reduction in cultivated land area in Hunan Province was 276,481 ha, with a decrease of 4.43%. Among them, the paddy field area decreased by 120,184 ha, mainly in eastern and northern Hunan, which have good agricultural production conditions, accounting for 32.59% and 29.00%, respectively. The total GPP declined by 17.72 million tons, with a decrease of 17.21%, of which the paddy field production potential declined by 11.67 million tons, a decrease of 15.33%, mainly in northern and eastern Hunan, accounting for 55.42% and 16.91%, respectively, resulting in the GPP barycenter of paddy fields continuing to move southwest. Meanwhile, we found that all cities showed a declining trend in GPP, and the reduction in GPP exceeded 20% in Changde, Yiyang, Changsha, Chenzhou, Huaihua, Xiangxi, and Zhangjiajie. The sensitivity analysis results also show that the highly sensitive regions moved to the west, which means that the change in cultivated land in central and western Hunan caused the obvious change in GPP in these regions, suggesting the protection of cultivated land in central and western Hunan, where the economy is relatively underdeveloped, also requires more attention.
Based on the analysis, we discussed the future development direction of cultivated land protection and proposed an integrated monitoring system that is more adaptive to global climate change. For stabilizing GPP, conserving resources, and protecting the environment, it is necessary to consider more factors such as quality and productivity to enrich the connotation of cultivated land balance and establish an integrated monitoring system, including the quantity, quality, productivity, and ecology of cultivated land. Meanwhile, the government should pay more attention to the phenomenon of cultivated land abandonment, standardize its definition, and conduct a survey, then they should develop a utilization plan, if possible, in order to prioritize the use of high-quality abandoned land as a backup land resource.
Author Contributions
Conceptualization, S.H. and D.Y.; data curation, D.Y. and C.X.; formal analysis, D.Y., L.T., and C.X.; funding acquisition, S.H.; methodology, D.Y., S.H., L.T., and C.X.; project administration, S.H.; software, D.Y. and C.X.; supervision, S.H. and L.T.; validation, D.Y., S.H., and L.T.; visualization, D.Y. and C.X.; writing—original draft, D.Y.; writing—review and editing, S.H., L.T., and D.Y. All authors have read and agreed to the published version of the manuscript.
Funding
This research was funded by the major projects of National Social Science Fund (18ZDA053), National Natural Science Foundation of China (41671518 and 41901236), the Evaluation Committee Project of Social Science Achievements of Hunan Province (XSP18YBZ027), and the Natural Science Foundation of Hunan Province (2020JJ4942).
Acknowledgments
We are grateful to the handling editor and anonymous reviewers for their constructive comments. We would also thank Wenmin Hu at Central South Forestry University for providing survey statistics.
Conflicts of Interest
The authors declare no conflict of interest.
References
- Rosenzweig, C.; Parry, M. Potential impact of climate change on world food supply. Nat. Cell Biol. 1994, 367, 133–138. [Google Scholar] [CrossRef]
- Armanda, D.T.; Guinée, J.B.; Tukker, A. The second green revolution: Innovative urban agriculture’s contribution to food security and sustainability—A review. Glob. Food Secur. 2019, 22, 13–24. [Google Scholar] [CrossRef]
- West, P.C.; Gerber, J.S.; Engstrom, P.M.; Mueller, N.D.; Brauman, K.A.; Carlson, K.M.; Cassidy, E.S.; Johnston, M.; Macdonald, G.K.; Ray, D.K.; et al. Leverage points for improving global food security and the environment. Science 2014, 345, 325–328. [Google Scholar] [CrossRef] [Green Version]
- Anderson, K.; Strutt, A. Food security policy options for China: Lessons from other countries. Food Policy 2014, 49, 50–58. [Google Scholar] [CrossRef]
- Fujimori, S.; Hasegawa, T.; Krey, V.; Riahi, K.; Bertram, C.; Bodirsky, B.L.; Bosetti, V.; Callen, J.; Després, J.; Doelman, J.; et al. A multi-model assessment of food security implications of climate change mitigation. Nat. Sustain. 2019, 2, 386–396. [Google Scholar] [CrossRef] [Green Version]
- Renard, D.; Tilman, D. National food production stabilized by crop diversity. Nat. Cell Biol. 2019, 571, 257–260. [Google Scholar] [CrossRef] [PubMed]
- Subramaniam, Y.; Masron, T.A.; Azman, N.H.N. Biofuels, environmental sustainability, and food security: A review of 51 countries. Energy Res. Soc. Sci. 2020, 68, 101549. [Google Scholar] [CrossRef]
- Smit, B.; Cai, Y. Climate change and agriculture in China. Glob. Environ. Chang. 1996, 6, 205–214. [Google Scholar] [CrossRef]
- Gandhi, V.P.; Zhou, Z. Food demand and the food security challenge with rapid economic growth in the emerging economies of India and China. Food Res. Int. 2014, 63, 108–124. [Google Scholar] [CrossRef]
- Koizumi, T. Biofuel and food security in China and Japan. Renew. Sustain. Energy Rev. 2013, 21, 102–109. [Google Scholar] [CrossRef]
- FAO. The State of Food and Agriculture; FAO: Rome, Italy, 2016; Available online: http://www.fao.org/3/a-i6030e.pdf (accessed on 25 May 2020).
- Swiss Agency for Development and Cooperation (SDC). Strategy 2017–2020 Global Programme Food Security (GPFS); Swiss Agency for Development and Cooperation (SDC): Berne, Switzerland, 2017. [Google Scholar]
- Long, H.; Ge, D.; Zhang, Y.; Tu, S.; Qu, Y.; Ma, L. Changing man-land interrelations in China’s farming area under urbanization and its implications for food security. J. Environ. Manag. 2018, 209, 440–451. [Google Scholar] [CrossRef] [PubMed]
- Huang, J.; Yang, G. Understanding recent challenges and new food policy in China. Glob. Food Secur. 2017, 12, 119–126. [Google Scholar] [CrossRef]
- Veeck, G.; Veeck, A.; Yu, H. Challenges of agriculture and food systems issues in China and the United States. Geogr. Sustain. 2020, 1, 109–117. [Google Scholar] [CrossRef]
- Deng, X.; Huang, J.; Rozelle, S.; Zhang, J.; Li, Z. Impact of urbanization on cultivated land changes in China. Land Use Policy 2015, 45, 1–7. [Google Scholar] [CrossRef]
- Felipe, J.; Bayudan-Dacuycuy, C.; Lanzafame, M. The declining share of agricultural employment in China: How fast? Struct. Chang. Econ. Dyn. 2016, 37, 127–137. [Google Scholar] [CrossRef]
- Liao, L.; Long, H.; Gao, X.; Ma, E. Effects of land use transitions and rural aging on agricultural production in China’s farming area: A perspective from changing labor employing quantity in the planting industry. Land Use Policy 2019, 88, 104152. [Google Scholar] [CrossRef]
- Khan, S.; Hanjra, M.A.; Mu, J. Water management and crop production for food security in China: A review. Agric. Water Manag. 2009, 96, 349–360. [Google Scholar] [CrossRef]
- Masud, M.B.; Wada, Y.; Goss, G.; Faramarzi, M. Global implications of regional grain production through virtual water trade. Sci. Total. Environ. 2019, 659, 807–820. [Google Scholar] [CrossRef]
- Lu, S.; Bai, X.; Li, W.; Wang, N. Impacts of climate change on water resources and grain production. Technol. Forecast. Soc. Chang. 2019, 143, 76–84. [Google Scholar] [CrossRef]
- Chen, S.; Gong, B. Response and adaptation of agriculture to climate change: Evidence from China. J. Dev. Econ. 2020, 148, 102557. [Google Scholar] [CrossRef]
- Wu, Y.; Shan, L.; Guo, Z.; Peng, Y. Cultivated land protection policies in China facing 2030: Dynamic balance system versus basic farmland zoning. Habitat Int. 2017, 69, 126–138. [Google Scholar] [CrossRef]
- Jiang, G.; Zhang, R.; Ma, W.; Zhou, D.; Wang, X.; He, X. Cultivated land productivity potential improvement in land consolidation schemes in Shenyang, China: Assessment and policy implications. Land Use Policy 2017, 68, 80–88. [Google Scholar] [CrossRef]
- Li, Y.; Wu, W.; Liu, Y. Land consolidation for rural sustainability in China: Practical reflections and policy implications. Land Use Policy 2018, 74, 137–141. [Google Scholar] [CrossRef]
- Tian, G.; Duan, J.; Yang, L. Spatio-temporal pattern and driving mechanisms of cropland circulation in China. Land Use Policy 2020, 100, 105118. [Google Scholar] [CrossRef]
- Song, W.; Pijanowski, B.C. The effects of China’s cultivated land balance program on potential land productivity at a national scale. Appl. Geogr. 2014, 46, 158–170. [Google Scholar] [CrossRef]
- Xin, L.; Li, X. China should not massively reclaim new farmland. Land Use Policy 2018, 72, 12–15. [Google Scholar] [CrossRef]
- Liu, T.; Liu, H.; Qi, Y. Construction land expansion and cultivated land protection in urbanizing China: Insights from national land surveys, 1996–2006. Habitat Int. 2015, 46, 13–22. [Google Scholar] [CrossRef]
- Li, T.; Long, H.; Zhang, Y.; Tu, S.; Ge, D.; Li, Y.; Hu, B. Analysis of the spatial mismatch of grain production and farmland resources in China based on the potential crop rotation system. Land Use Policy 2017, 60, 26–36. [Google Scholar] [CrossRef]
- Neumann, K.; Verburg, P.H.; Stehfest, E.; Müller, C. The yield gap of global grain production: A spatial analysis. Agric. Syst. 2010, 103, 316–326. [Google Scholar] [CrossRef]
- Yang, X.; Cheng, C.; Li, Y. Effect of cropland occupation and supplement on light-temperature potential productivity in China from 2000 to 2008. Chin. Geogr. Sci. 2010, 20, 536–544. [Google Scholar] [CrossRef] [Green Version]
- Chai, J.; Wang, Z.; Yang, J.; Zhang, L. Analysis for spatial-temporal changes of grain production and farmland resource: Evidence from Hubei Province, central China. J. Clean. Prod. 2019, 207, 474–482. [Google Scholar] [CrossRef]
- Liu, Y.; Zhang, Y.; Guo, L. Towards realistic assessment of cultivated land quality in an ecologically fragile environment: A satellite imagery-based approach. Appl. Geogr. 2010, 30, 271–281. [Google Scholar] [CrossRef]
- Wang, J.; Zhang, Z.; Liu, Y. Spatial shifts in grain production increases in China and implications for food security. Land Use Policy 2018, 74, 204–213. [Google Scholar] [CrossRef]
- Pfister, S.; Bayer, P.; Koehler, A.; Hellweg, S. Environmental Impacts of Water Use in Global Crop Production: Hotspots and Trade-Offs with Land Use. Environ. Sci. Technol. 2011, 45, 5761–5768. [Google Scholar] [CrossRef] [PubMed]
- Kell, S.; Qin, H.; Chen, B.; Lloyd, J.; Wei, W.; Kang, D.; Maxted, N. China’s crop wild relatives: Diversity for agriculture and food security. Agric. Ecosyst. Environ. 2015, 209, 138–154. [Google Scholar] [CrossRef]
- Gao, B.; Ju, X.; Meng, Q.; Cui, Z.; Christie, P.; Chen, X.; Zhang, F. The impact of alternative cropping systems on global warming potential, grain yield and groundwater use. Agric. Ecosyst. Environ. 2015, 203, 46–54. [Google Scholar] [CrossRef]
- Norse, D.; Ju, X. Environmental costs of China’s food security. Agric. Ecosyst. Environ. 2015, 209, 5–14. [Google Scholar] [CrossRef]
- Chun, J.; Li, S.; Wang, Q.; Lee, W.-S.; Lee, E.-J.; Horstmann, N.; Park, H.; Veasna, T.; Vanndy, L.; Pros, K.; et al. Assessing rice productivity and adaptation strategies for Southeast Asia under climate change through multi-scale crop modeling. Agric. Syst. 2016, 143, 14–21. [Google Scholar] [CrossRef]
- Wu, W.; Yu, Q.; You, L.; Chen, K.; Tang, H.; Liu, J. Global cropping intensity gaps: Increasing food production without cropland expansion. Land Use Policy 2018, 76, 515–525. [Google Scholar] [CrossRef]
- Sheng, Y.; Chancellor, W. Exploring the relationship between farm size and productivity: Evidence from the Australian grains industry. Food Policy 2019, 84, 196–204. [Google Scholar] [CrossRef]
- Yin, G.; Lin, Z.; Jiang, X.; Yan, H.; Wang, X. Spatiotemporal differentiations of arable land use intensity—A comparative study of two typical grain producing regions in northern and southern China. J. Clean. Prod. 2019, 208, 1159–1170. [Google Scholar] [CrossRef]
- Fei, L.; Meijun, Z.; Jiaqi, S.; Zehui, C.; Xiaoli, W.; Jiuchun, Y. Maize, wheat and rice production potential changes in China under the background of climate change. Agric. Syst. 2020, 182, 102853. [Google Scholar] [CrossRef]
- Singirankabo, U.A.; Ertsen, M.W. Relations between Land Tenure Security and Agricultural Productivity: Exploring the Effect of Land Registration. Land 2020, 9, 138. [Google Scholar] [CrossRef]
- Pan, T.; Du, G.; Dong, J.; Kuang, W.; De Maeyer, P.; Kurban, A. Divergent changes in cropping patterns and their effects on grain production under different agro-ecosystems over high latitudes in China. Sci. Total. Environ. 2019, 659, 314–325. [Google Scholar] [CrossRef] [PubMed]
- Saddique, Q.; Liu, D.L.; Wang, B.; Feng, P.; He, J.; Ajaz, A.; Ji, J.; Xu, J.; Zhang, C.; Cai, H. Modelling future climate change impacts on winter wheat yield and water use: A case study in Guanzhong Plain, northwestern China. Eur. J. Agron. 2020, 119, 126113. [Google Scholar] [CrossRef]
- Smith, P.; Gregory, P.J. Climate change and sustainable food production. Proc. Nutr. Soc. 2012, 72, 21–28. [Google Scholar] [CrossRef] [PubMed] [Green Version]
- Meng, Q.; Hou, P.; Wu, L.; Chen, X.; Cui, Z.; Zhang, F. Understanding production potentials and yield gaps in intensive maize production in China. Field Crop. Res. 2013, 143, 91–97. [Google Scholar] [CrossRef] [Green Version]
- Liu, L.; Chen, X.; Xu, X.; Wang, Y.; Li, S.; Fu, Y. Changes in Production Potential in China in Response to Climate Change from 1960 to 2010. Adv. Meteorol. 2014, 2014, 1–10. [Google Scholar] [CrossRef]
- Jin, G.; Li, Z.; Deng, X.; Yang, J.; Chen, D.; Li, W. An analysis of spatiotemporal patterns in Chinese agricultural productivity between 2004 and 2014. Ecol. Indic. 2019, 105, 591–600. [Google Scholar] [CrossRef]
- Fischer, G.; Nachtergaele, F.; Prieler, S.; Van Velthuizen, H.; Verelst, L.; Wiberg, D. Global Agro-Ecological Zones Assessment for Agriculture (GAEZ 2008); IIASA: Laxenburg, Austria; FAO: Rome, Italy, 2008. [Google Scholar]
- Fischer, G.; van Velthuizen, H.T.; Nachtergaele, F.O. Global Agro-Ecological Zones Assessment: Methodology and Results; IIASA: Laxenburg, Austria, 2000. [Google Scholar]
- Fischer, G.; van Velthuizen, H.T.; Shah, M.M.; Nachtergaele, F.O. Global Agro-Ecological Assessment for Agriculture in the 21st Century: Methodology and Results. Research Report RR-02-02; IIASA: Laxenburg, Austria, 2002. [Google Scholar]
- Deng, G. The seasonal distribution of climatic potential productivity and the optimum seeding time of maize. Acta Meteorol. Sin. 1986, 44, 192–198, (In Chinese with English abstract). [Google Scholar]
- Deng, X.; Gibson, J.; Wang, P. Management of trade-offs between cultivated land conversions and land productivity in Shandong Province. J. Clean. Prod. 2017, 142, 767–774. [Google Scholar] [CrossRef]
- Zabel, F.; Delzeit, R.; Schneider, J.M.; Seppelt, R.; Mauser, W.; Václavík, T. Global impacts of future cropland expansion and intensification on agricultural markets and biodiversity. Nat. Commun. 2019, 10, 1–10. [Google Scholar] [CrossRef] [PubMed] [Green Version]
- Bratley, K.; Ghoneim, E. Modeling Urban Encroachment on the Agricultural Land of the Eastern Nile Delta Using Remote Sensing and a GIS-Based Markov Chain Model. Land 2018, 7, 114. [Google Scholar] [CrossRef] [Green Version]
- Müller, B.; Hoffmann, F.; Heckelei, T.; Müller, C.; Hertel, T.W.; Polhill, J.G.; Van Wijk, M.; Achterbosch, T.; Alexander, P.; Brown, C.; et al. Modelling food security: Bridging the gap between the micro and the macro scale. Glob. Environ. Chang. 2020, 63, 102085. [Google Scholar] [CrossRef]
- Van Dijk, M.; Gramberger, M.; Laborde, D.; Mandryk, M.; Shutes, L.; Stehfest, E.; Valin, H.; Faradsch, K. Stakeholder-designed scenarios for global food security assessments. Glob. Food Secur. 2020, 24, 100352. [Google Scholar] [CrossRef]
- Liu, H.; Tang, L.; Hu, B.; Liu, G.; Wang, Y. A dataset of reconstructed photosynthetically active radiation in China (1961–2014). Sci. Data Bank 2017. [Google Scholar] [CrossRef]
- Liu, Y.; Wang, J.; Guo, L. The spatial-temporal changes of grain production and arable land in China. Sci. Agric. Sin. 2009, 42, 4269–4274, (In Chinese with English abstract). [Google Scholar]
- Li, Y.; Yang, X.; Cheng, C.; Wang, J. Spatial Features of Occupation and Supplement Cropland Basedon Topographic Factors in China from 2008–2010. Resour. Sci. 2012, 34, 1671–1680, (In Chinese with English abstract). [Google Scholar]
- Sun, W.; Guo, C.; Zhu, Y. Average Soil Potential Productivity of Hunan Province, China, 1981–2010. GCdataPR 2020, 69, 90–94. [Google Scholar] [CrossRef]
- Cerni, P. Global Shift: Transforming the World Economy, 3rd Edition. Rev. Radic. Politi Econ. 2003, 35, 388–390. [Google Scholar] [CrossRef]
- Bigot, J.; Klein, T. Consistent estimation of a population barycenter in the Wasserstein space. Hosp. Med. 2012, 63, 238–239. [Google Scholar] [CrossRef]
- Zhang, Y.; Li, X.; Song, W. Determinants of cropland abandonment at the parcel, household and village levels in mountain areas of China: A multi-level analysis. Land Use Policy 2014, 41, 186–192. [Google Scholar] [CrossRef]
- Smaliychuk, A.; Müller, D.; Prishchepov, A.V.; Levers, C.; Kruhlov, I.; Kuemmerle, T. Recultivation of abandoned agricultural lands in Ukraine: Patterns and drivers. Glob. Environ. Chang. 2016, 38, 70–81. [Google Scholar] [CrossRef]
- Suziedelyte-Visockiene, J.; Tumeliene, E.; Maliene, V. Analysis and identification of abandoned agricultural land using remote sensing methodology. Land Use Policy 2019, 82, 709–715. [Google Scholar] [CrossRef]
- The National People’s Congress. Land Administration Law of the People’s Republic of China, 2019. Available online: http://www.npc.gov.cn/npc/c30834/201909/d1e6c1a1eec345eba23796c6e8473347.shtml (accessed on 5 September 2019).
- Wang, N.; Reidsma, P.; Pronk, A.A.; de Wit, A.J.; van Ittersum, M.K. Can potato add to China’s food self-sufficiency? The scope for increasing potato production in China. Eur. J. Agron. 2018, 101, 20–29. [Google Scholar] [CrossRef]
Figure 1.
Sketch of the study area.

Figure 2.
Influence mechanism of cultivated land change on grain production.
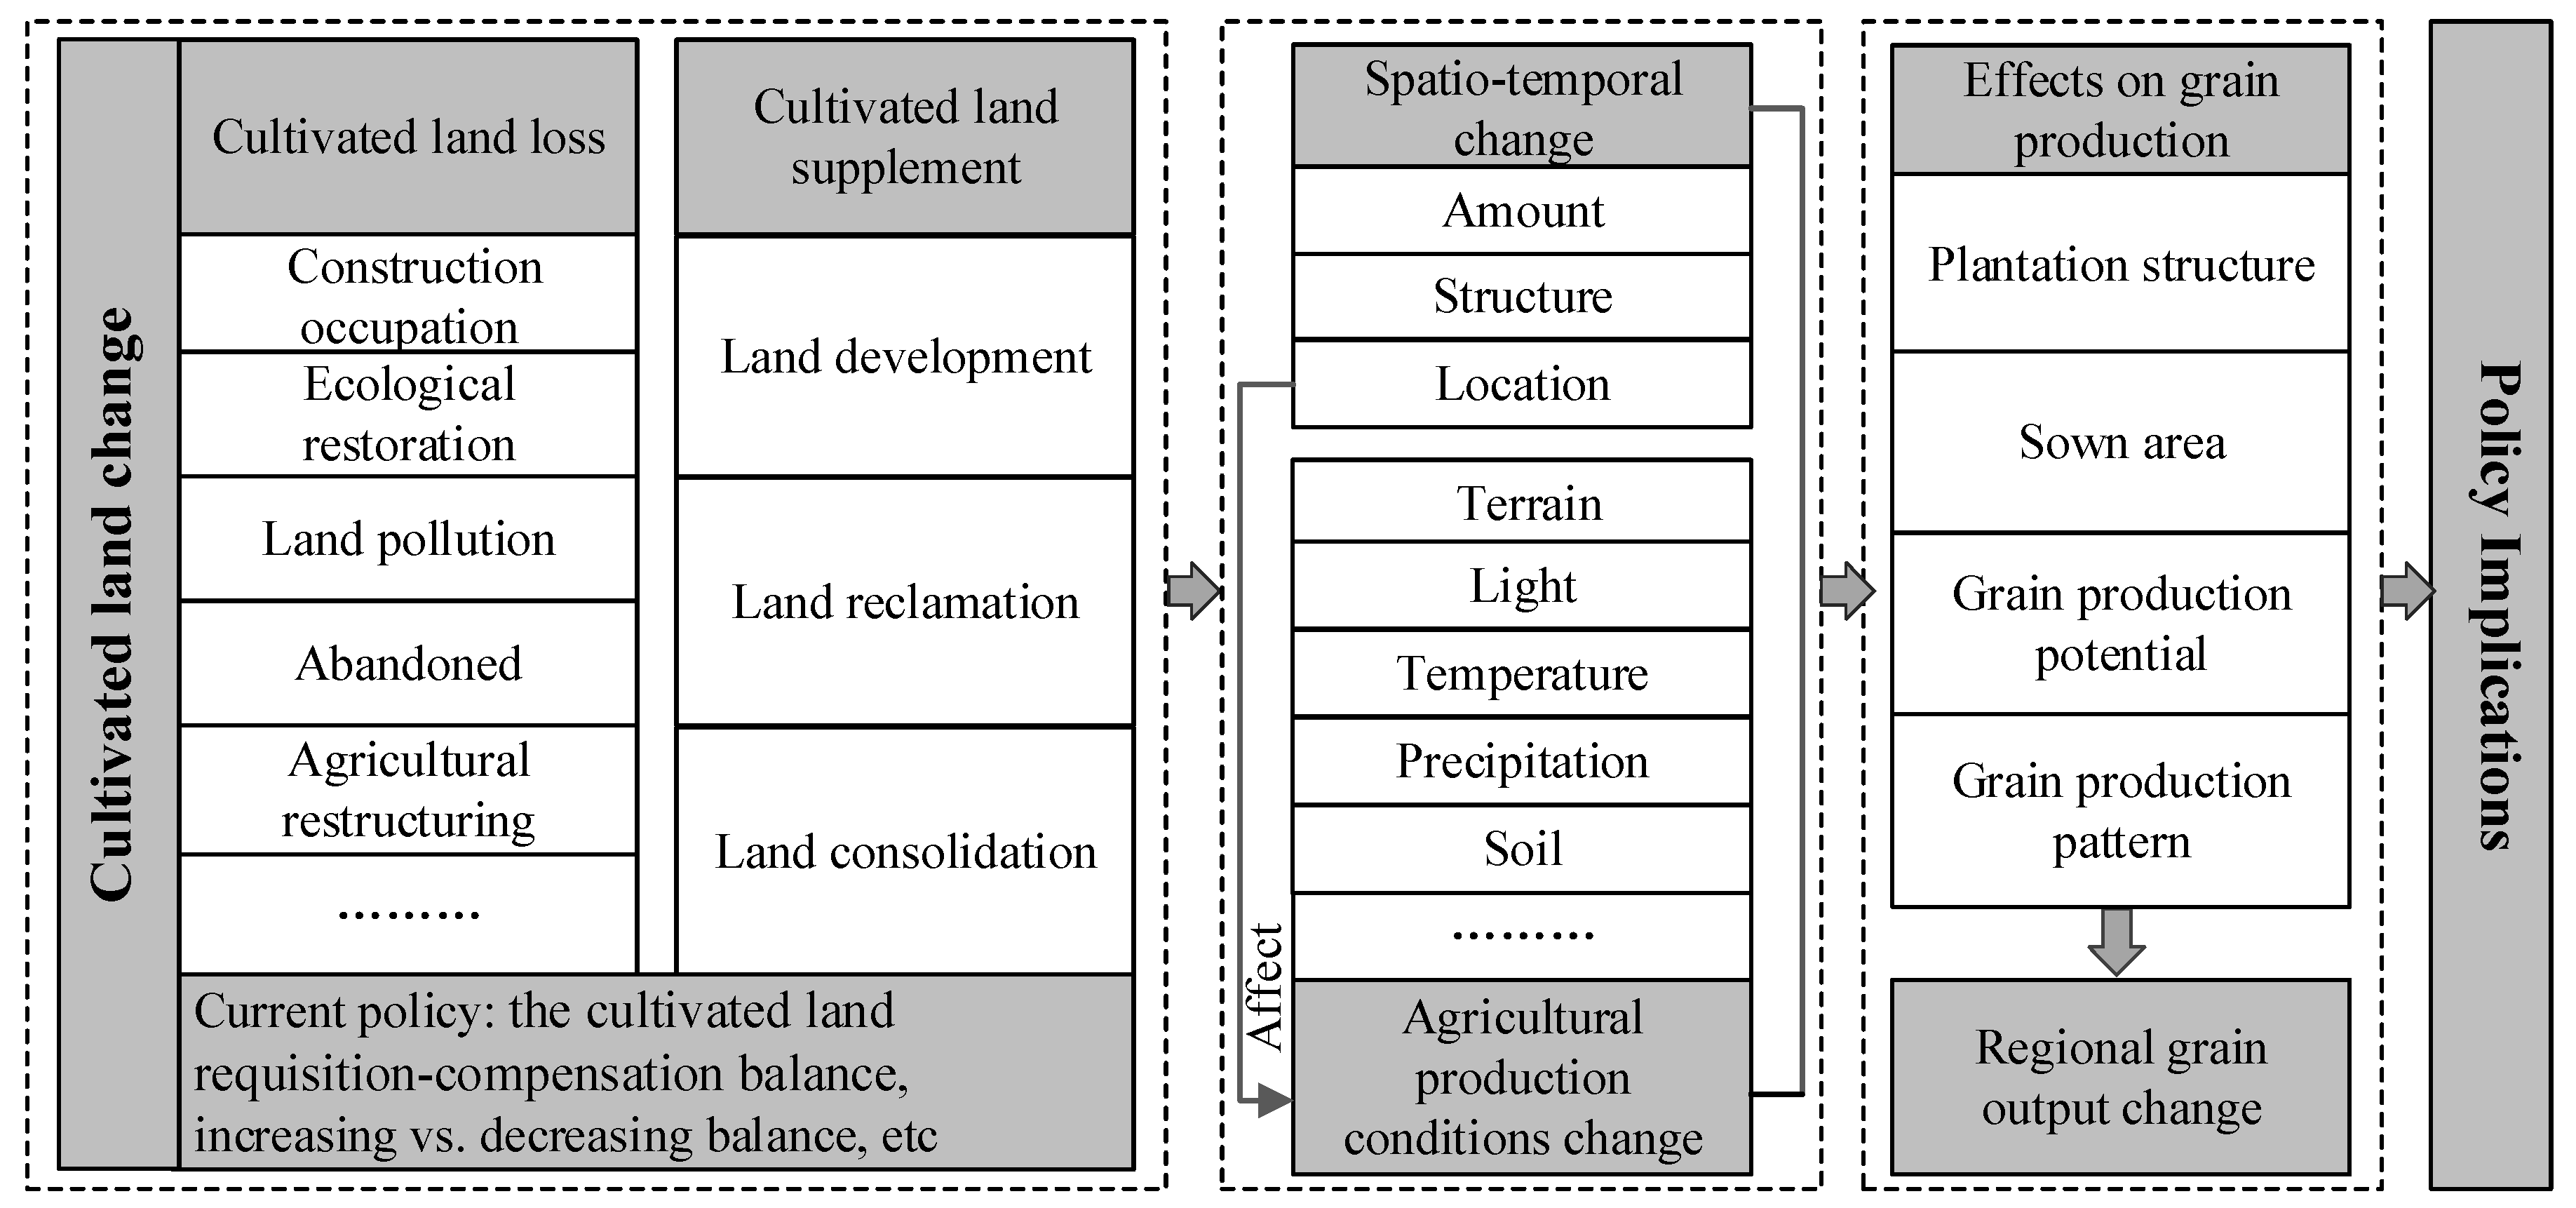
Figure 3.
Changes in cultivated land of each city in Hunan Province from 1990 to 2014.
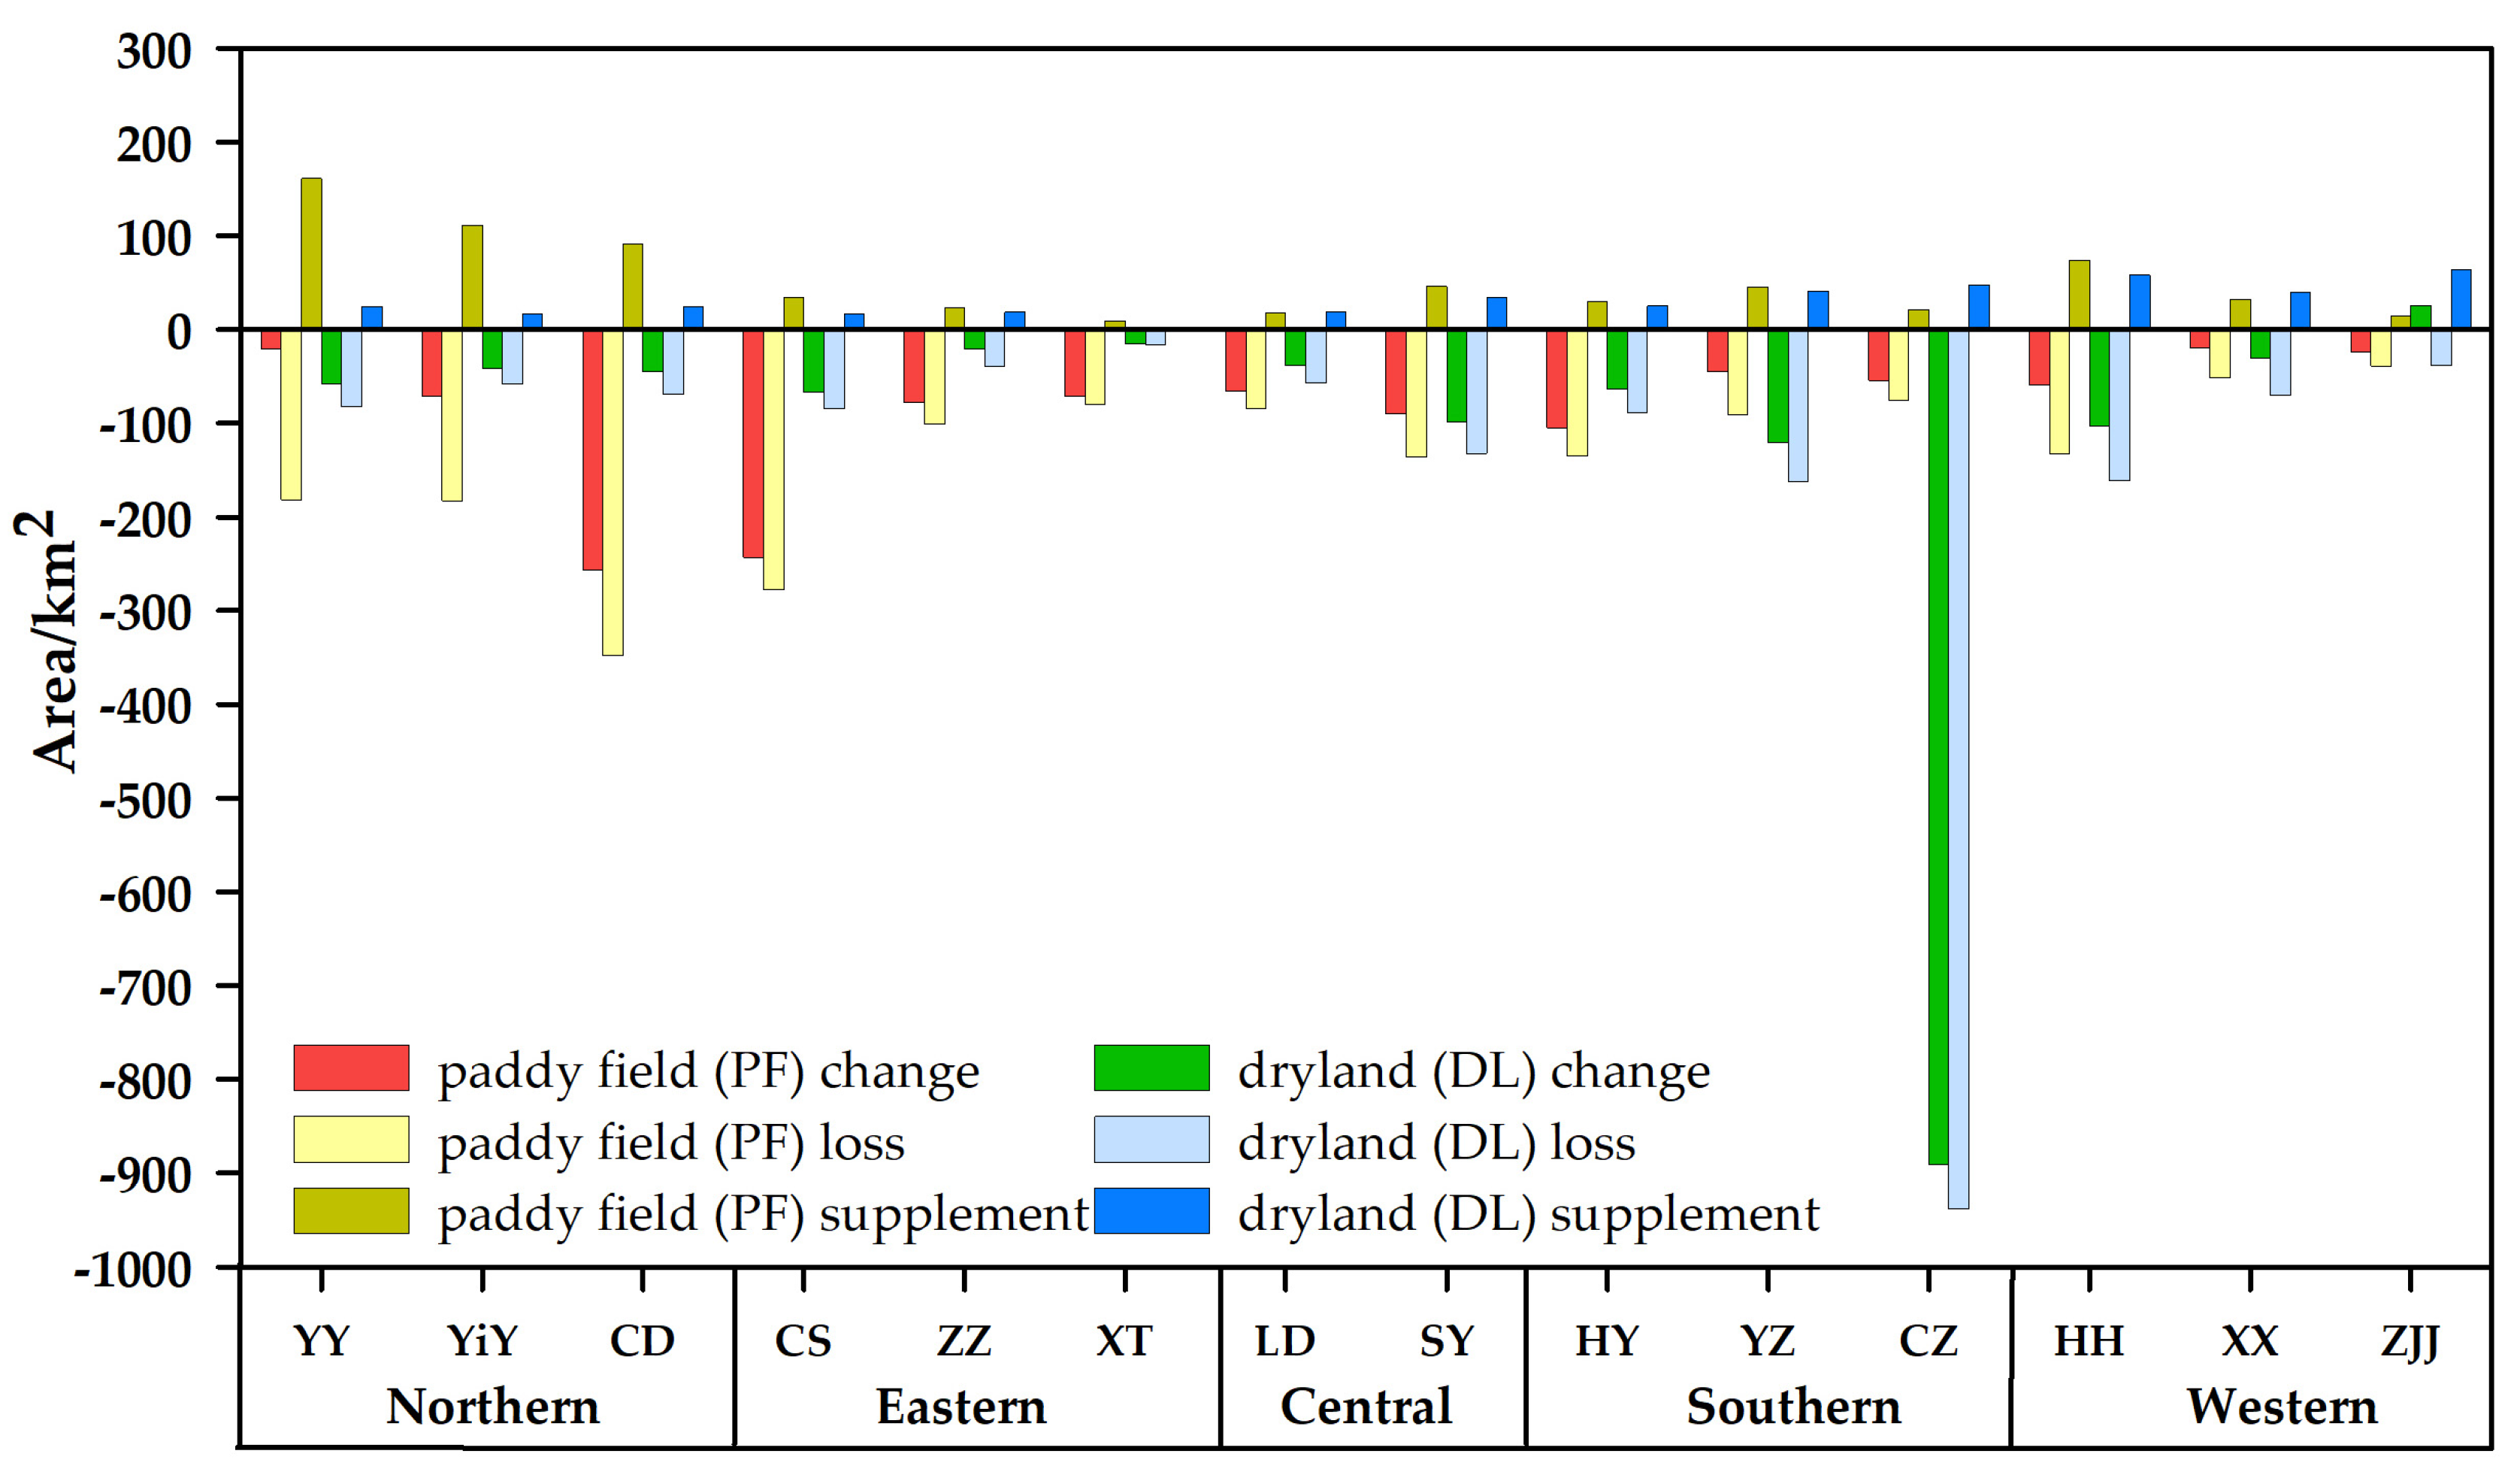
Figure 4.
Changes in cultivated land at different altitudes. (a) The variation in land-use change intensity at different altitudes acrossing different periods, (b) the change of area in cultivated land at different altitudes during 1990–2014, (c) the ratio of cultivated land change at different altitudes compared to that in the whole Hunan province.

Figure 5.
Changes in cultivated land at different slope levels. (a) The variation in land-use change intensity at different slopes in different periods, (b) the change of area in cultivated land at different slopes during 1990–2014, (c) the ratio of cultivated land change at different slopes compared to that in the whole Hunan province.

Figure 6.
Changes in cultivated land under different temperature conditions. (a) The variation in land-use change intensity at different temperature zones in different periods, (b)the change of area in cultivated land at different temperature zones during 1990–2014, (c) the ratio of cultivated land change at different temperature zones compared to that in the whole Hunan province.
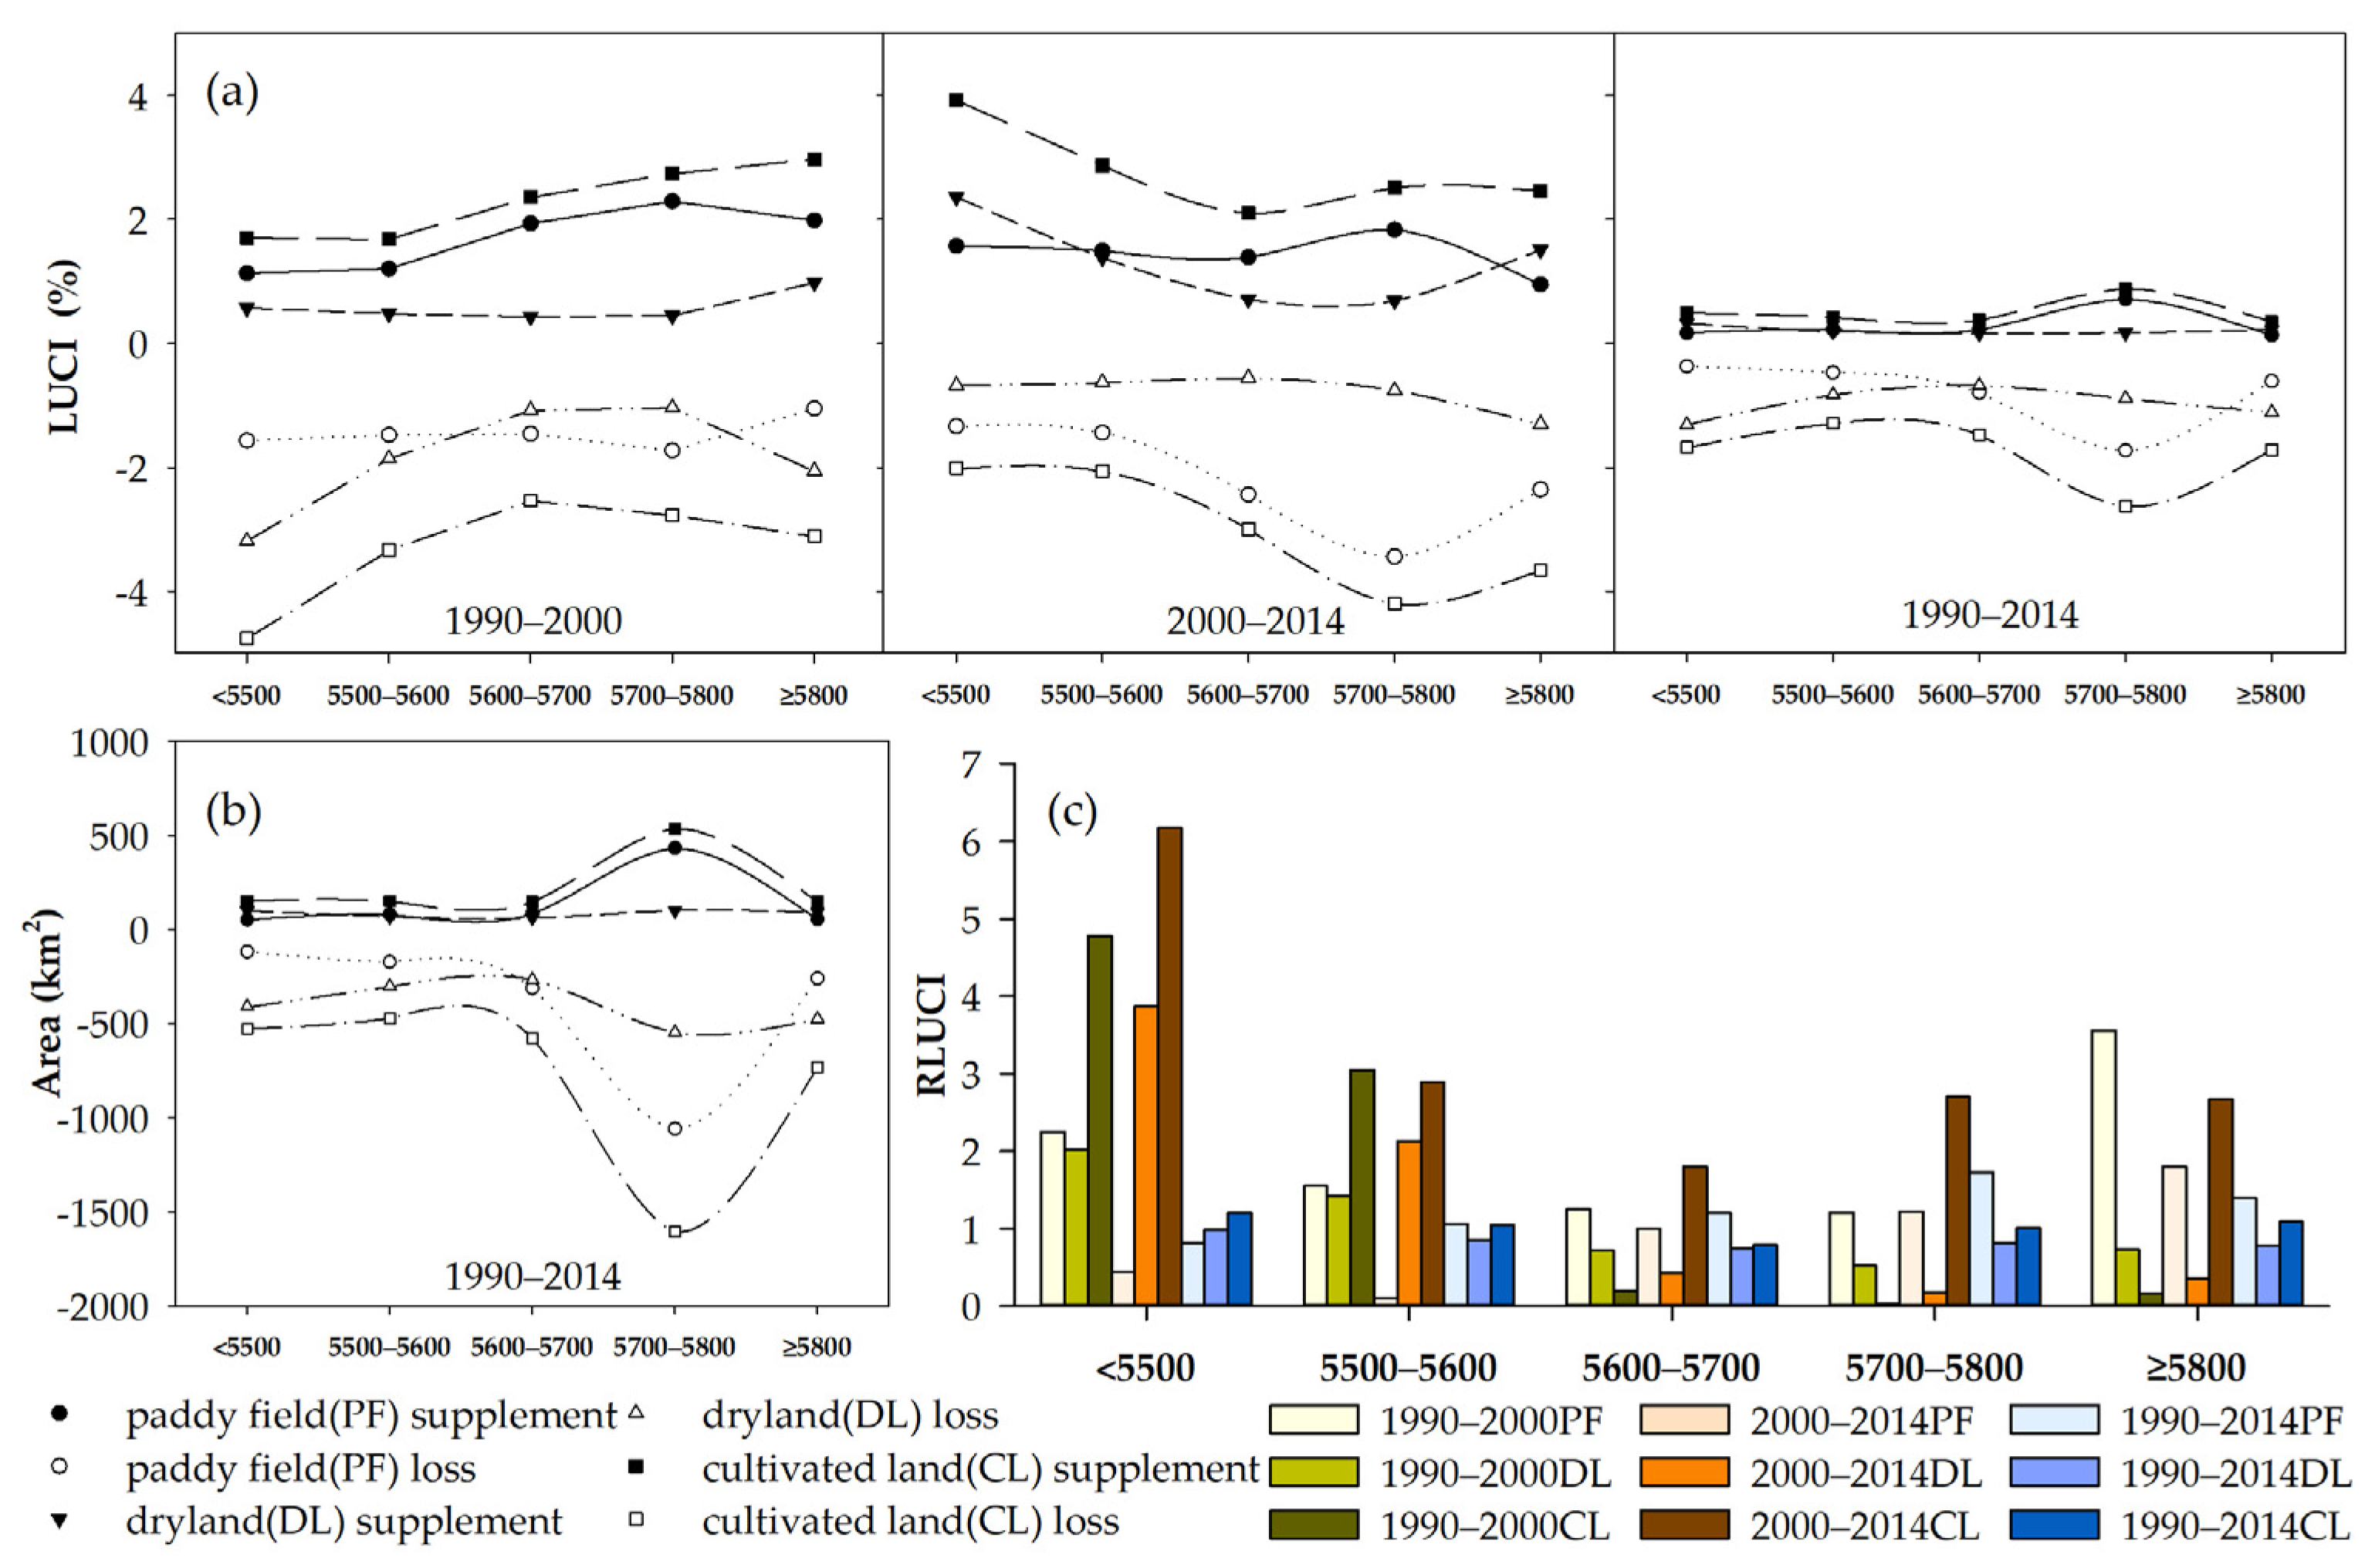
Figure 7.
Changes in cultivated land under different rainfall conditions. (a) The variation in land-use change intensity at different precipitation areas in different periods, (b) the change of area in cultivated land at different precipitation areas during 1990–2014, (c) the ratio of cultivated land change at different precipitation areas compared to that in the whole Hunan province.
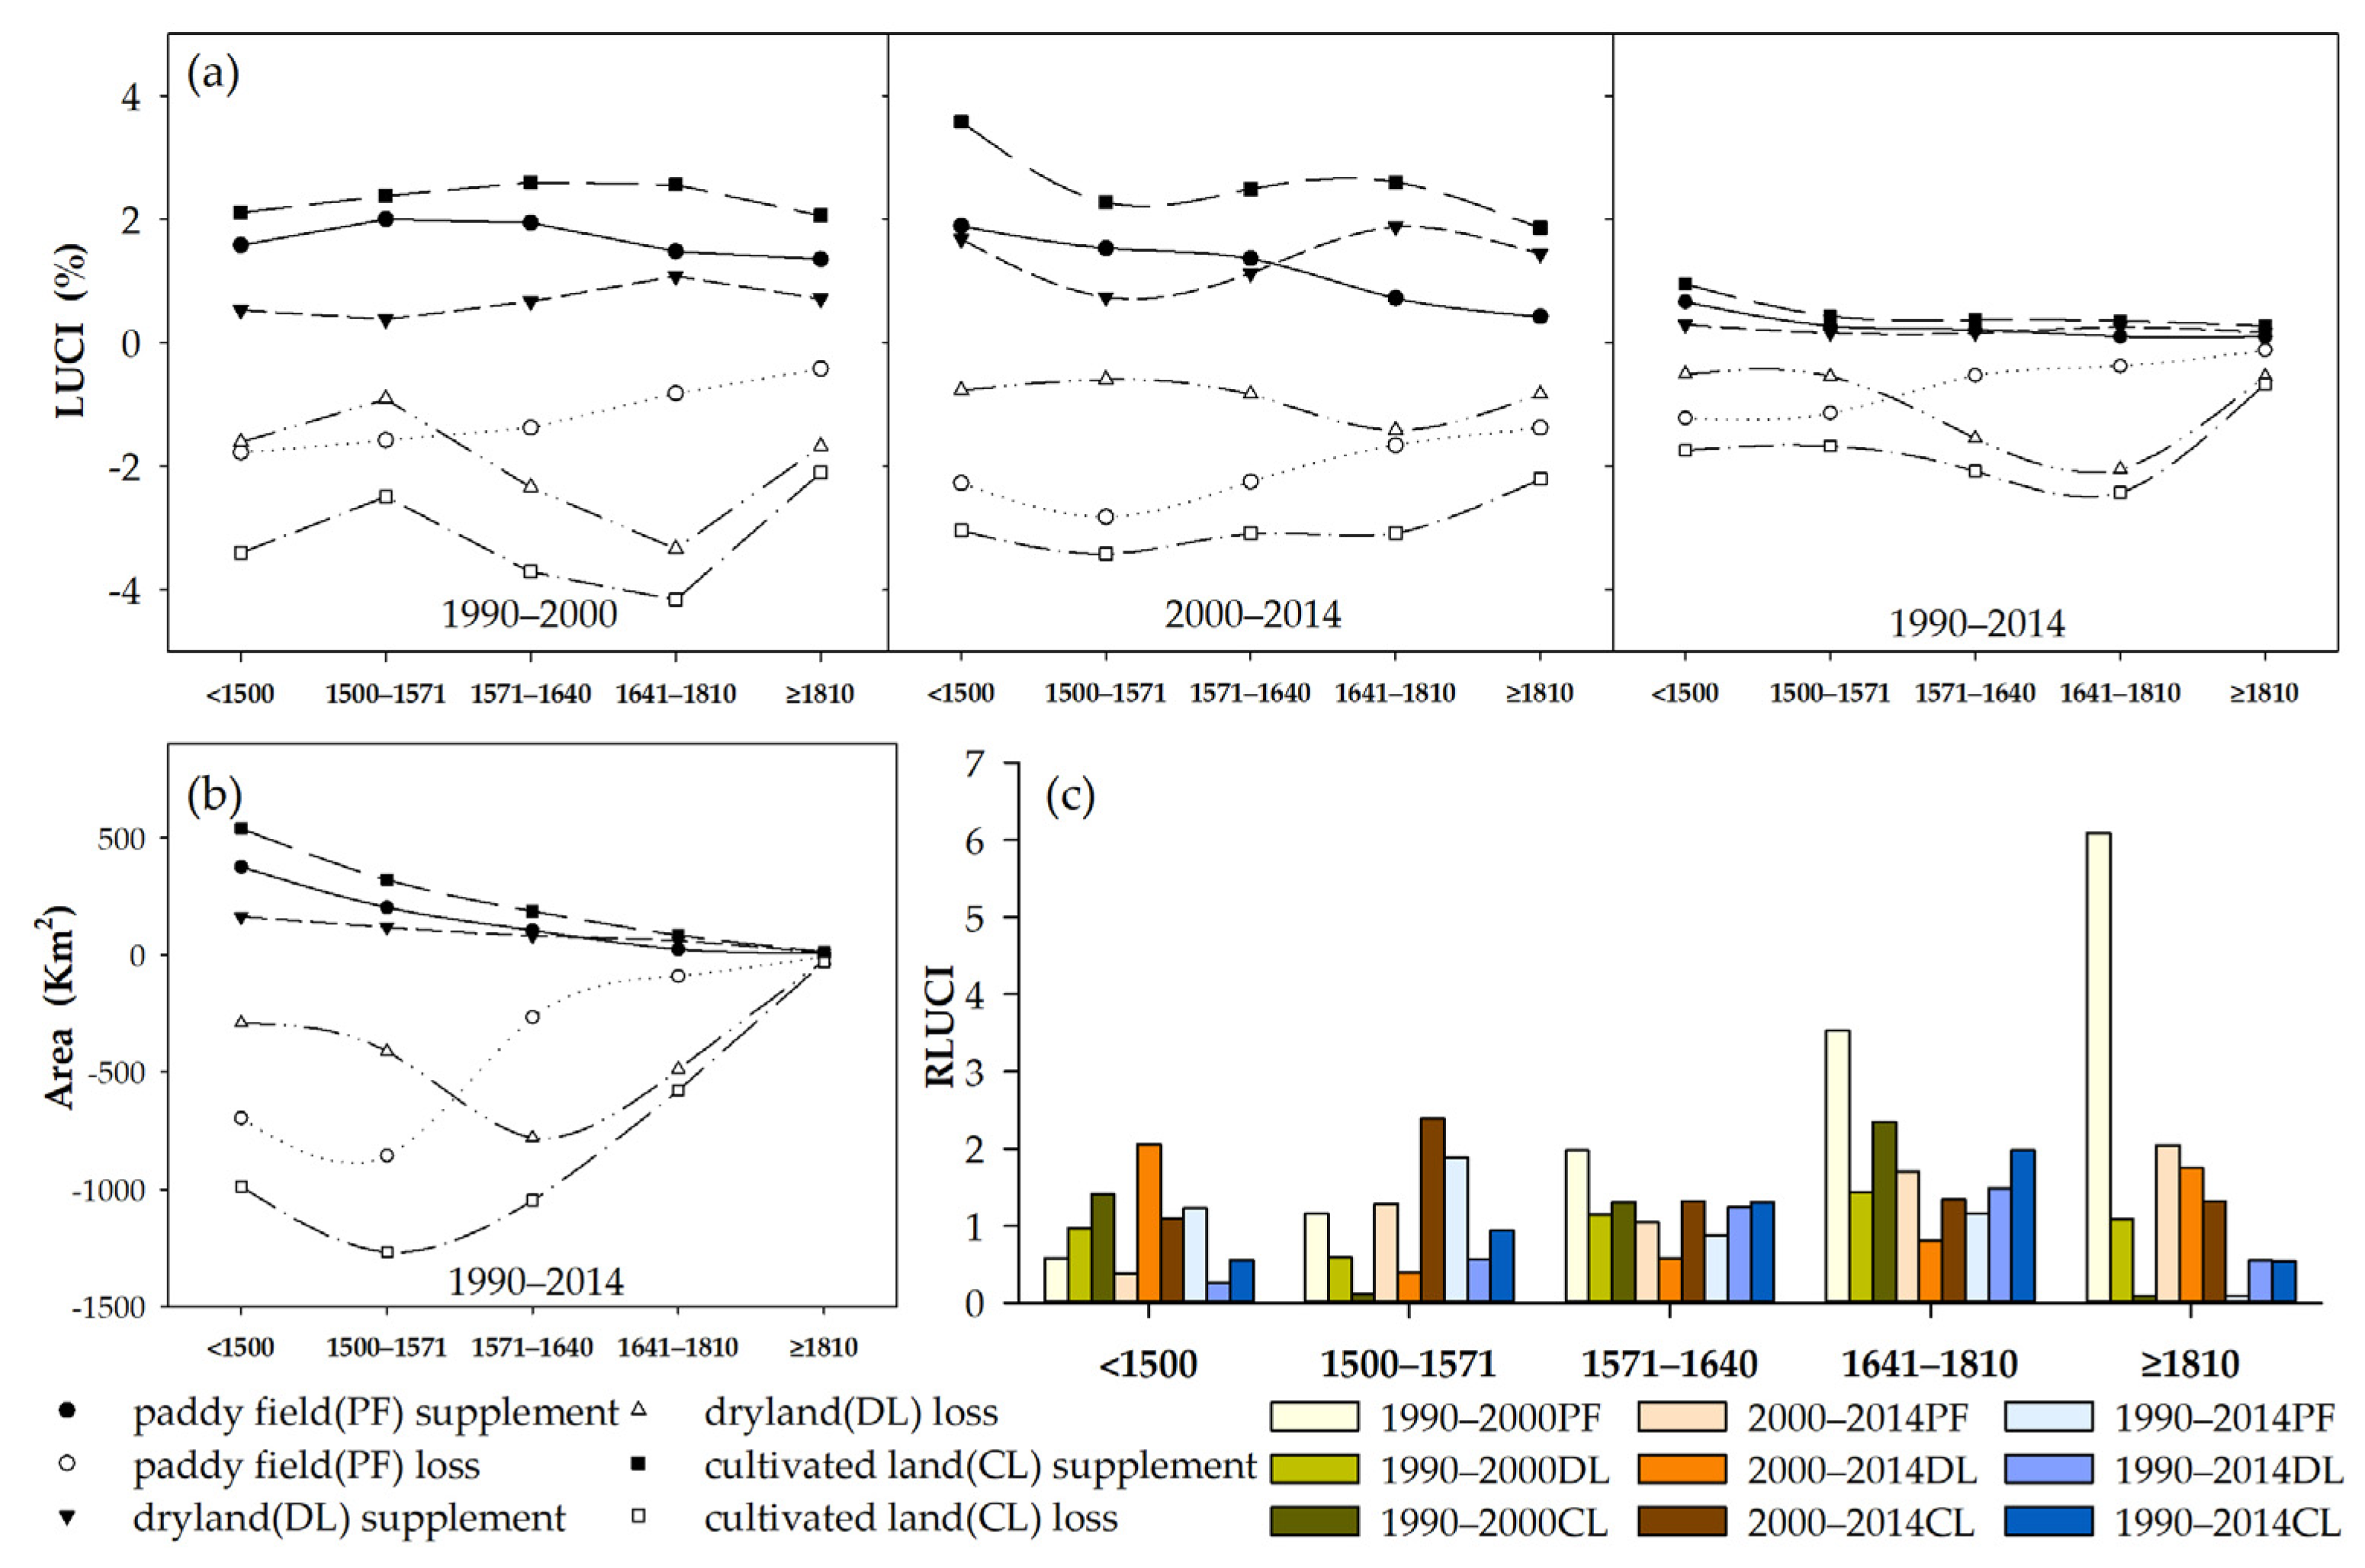
Figure 8.
Impacts of cultivated land conversion and spatial location change on the grain production potential (GPP).
Figure 8.
Impacts of cultivated land conversion and spatial location change on the grain production potential (GPP).

Figure 9.
The relationship between land-use transfer and grain production potential per unit area.
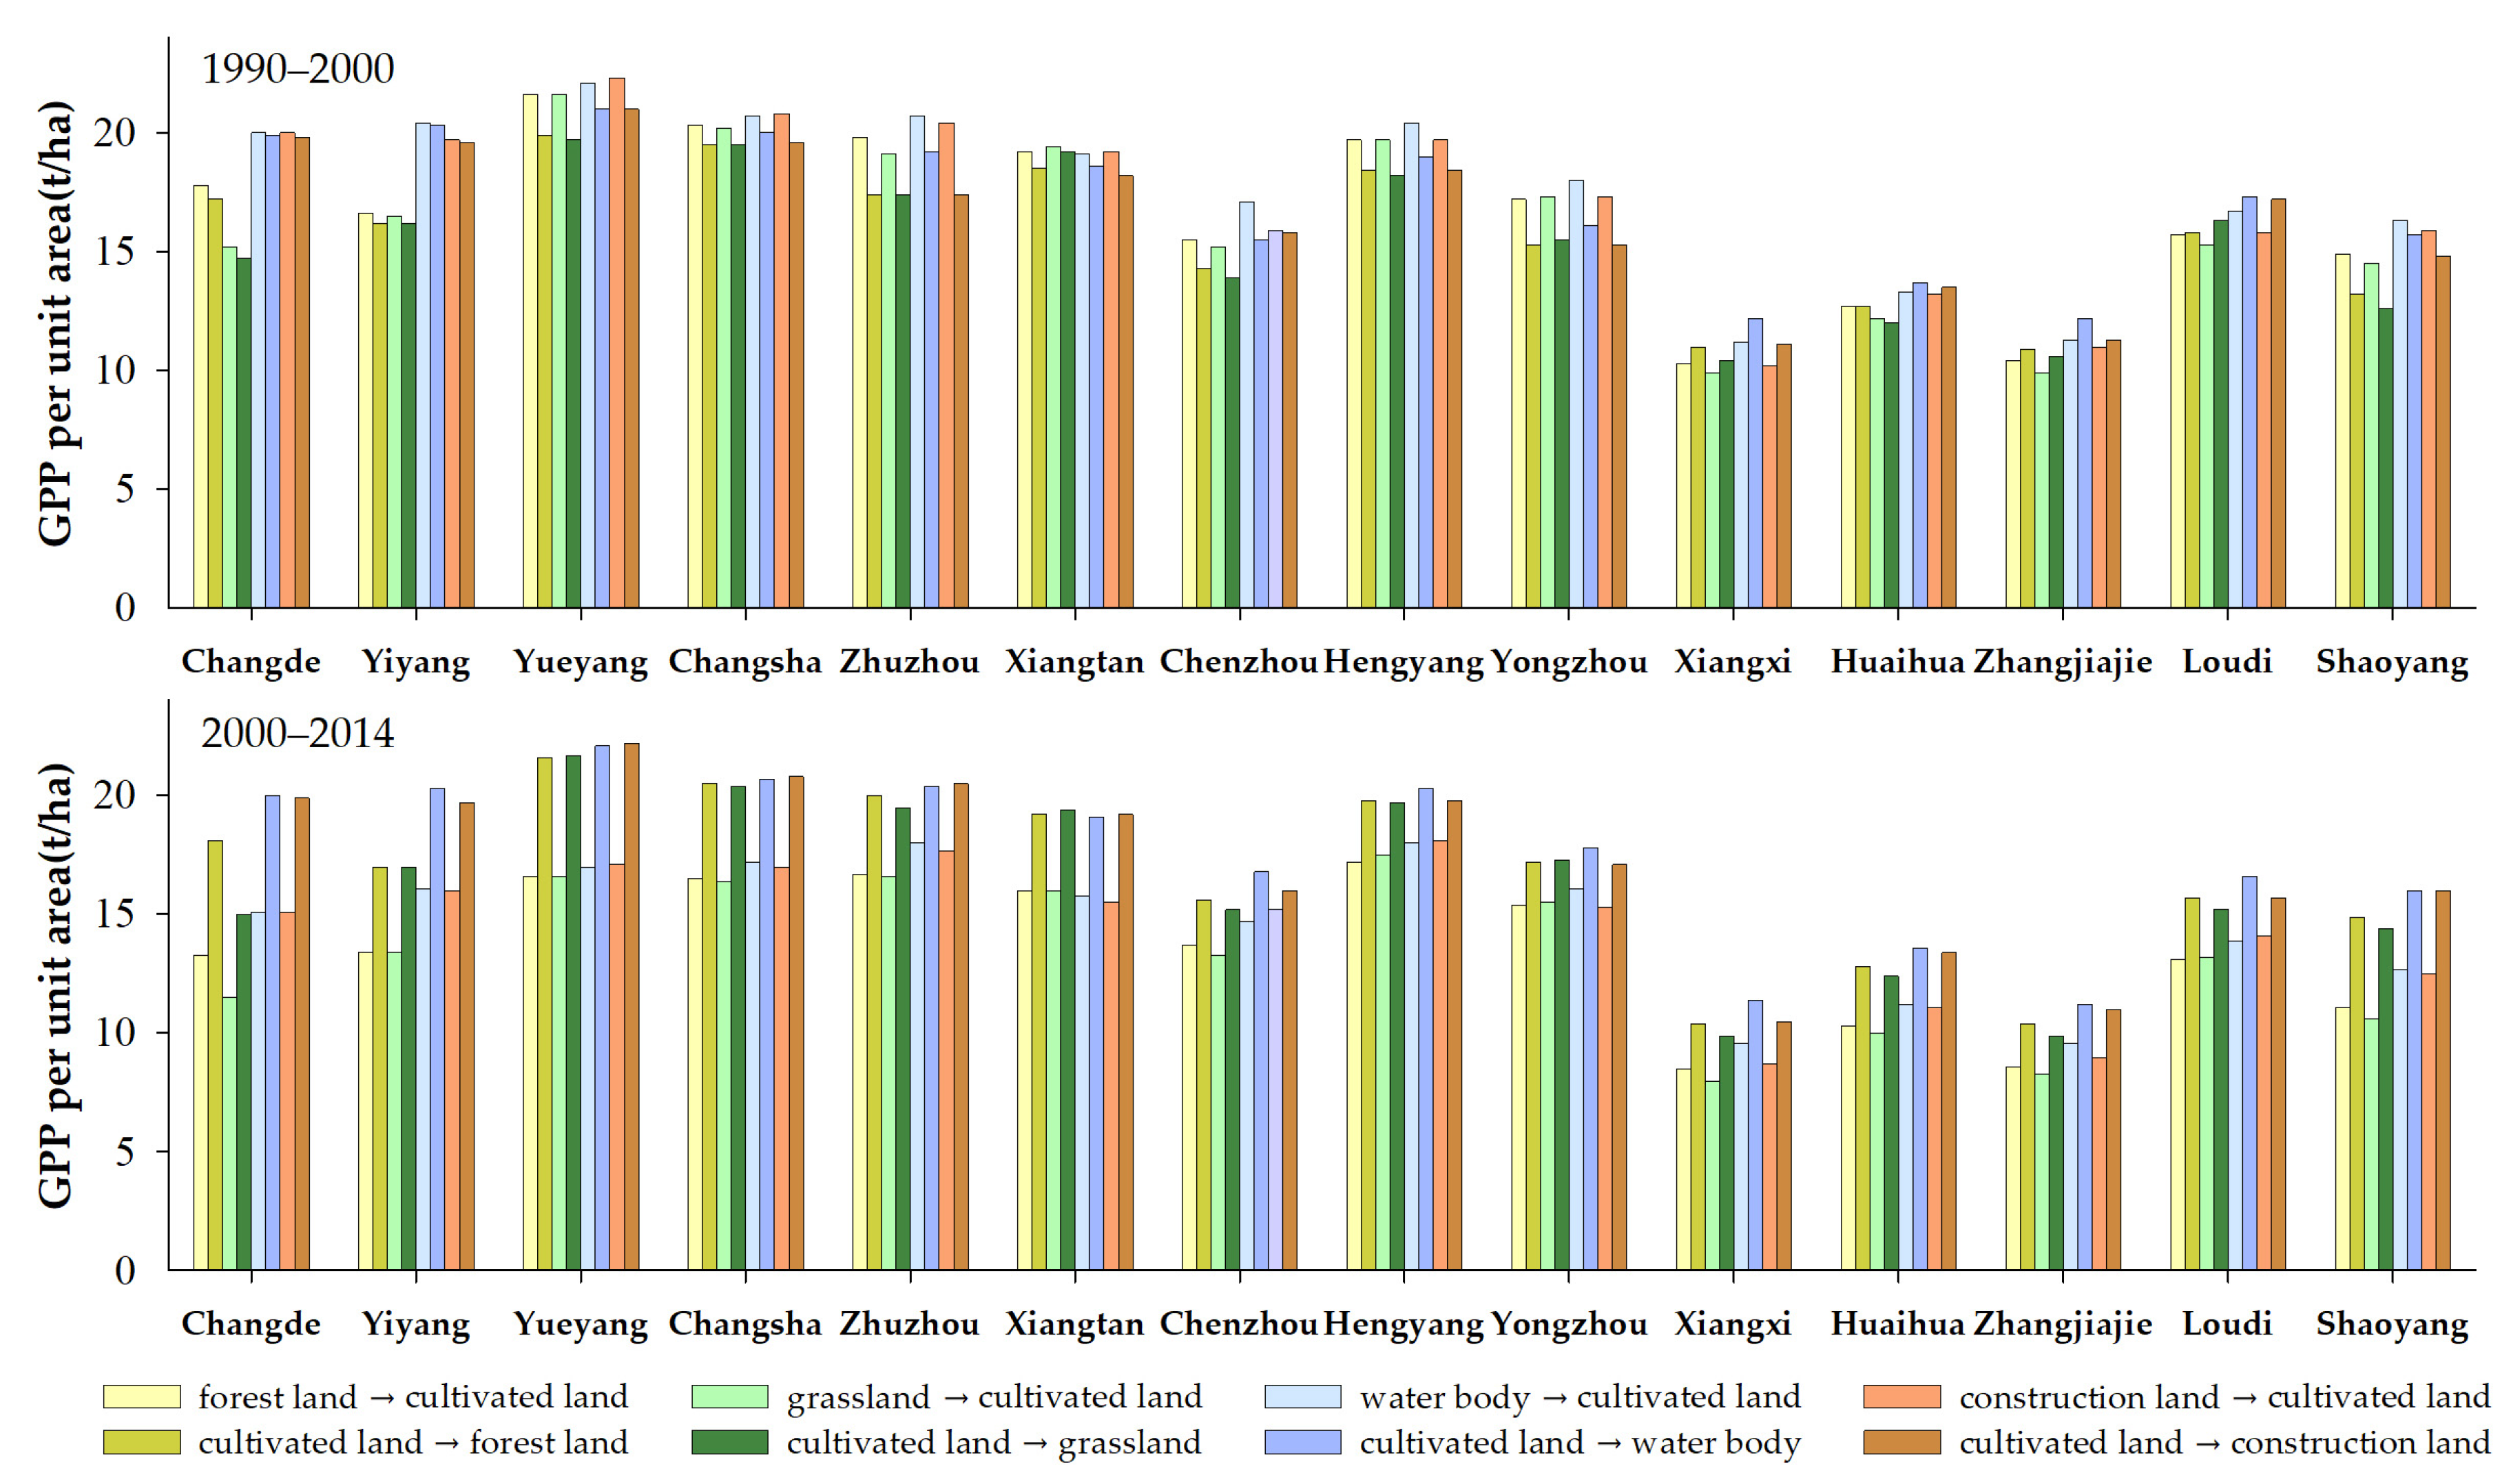
Figure 10.
The movement of the barycenter of (a) cultivated land area and (b) grain production in Hunan Province from 1990 to 2014.
Figure 10.
The movement of the barycenter of (a) cultivated land area and (b) grain production in Hunan Province from 1990 to 2014.

Figure 11.
The sensitivity of grain potential productivity changes to arable land in Hunan Province.
Figure 11.
The sensitivity of grain potential productivity changes to arable land in Hunan Province.


Table 1.
Land-use/land cover classification system.
| First Classification | Second Classification | First Classification | Second Classification |
|---|---|---|---|
| Cultivated land | Paddy field Dryland | Forest land | Woodland shrubland Open forest land Others |
| Grassland | High-cover grassland Medium-cover grassland Low-cover grassland | Waterbody | River Lake Reservoir pond Permanent ice and snow Tidal flat Beach land |
| Construction land | Urban land Rural residential land Others | Unused land | Sandy land Gobi Saline land marshland Bare land Bare rock ground Others |
Table 2.
The change in potential grain production in Hunan Province from 1990 to 2014.
| Cities | Paddy Field/Million tons, % | Dryland/Million tons, % | ||||||||||
|---|---|---|---|---|---|---|---|---|---|---|---|---|
| 1990 | 2000 | 2014 | R1990–2000 | R2000–2014 | R1990–2014 | 1990 | 2000 | 2014 | R1990–2000 | R2000–2014 | R1990–2014 | |
| Changde | 12.16 | 12.86 | 9.01 | 5.81 | −29.96 | −25.89 | 2.15 | 1.91 | 1.57 | −10.81 | −18.19 | −27.03 |
| Yiyang | 7.48 | 7.32 | 5.85 | −2.08 | −20.06 | −21.73 | 0.82 | 0.72 | 0.61 | −11.44 | −15.46 | −25.13 |
| Yueyang | 8.87 | 9.40 | 7.17 | 6.02 | −23.70 | −19.11 | 2.10 | 2.24 | 1.74 | 6.38 | −22.48 | −17.53 |
| Changsha | 6.32 | 6.81 | 4.98 | 7.81 | −26.95 | −21.25 | 1.01 | 0.98 | 0.77 | −2.64 | −21.13 | −23.21 |
| Zhuzhou | 4.25 | 5.30 | 4.13 | 24.73 | −22.01 | −2.72 | 0.95 | 0.85 | 0.87 | −10.83 | 2.47 | −8.63 |
| Xiangtan | 3.21 | 3.45 | 2.69 | 7.48 | −21.89 | −16.04 | 0.18 | 0.15 | 0.14 | −13.08 | −10.93 | −22.58 |
| Hengyang | 8.00 | 9.29 | 7.67 | 16.18 | −17.43 | −4.07 | 3.07 | 2.72 | 2.51 | −11.51 | −7.83 | −18.43 |
| Chenzhou | 3.53 | 4.02 | 3.36 | 13.78 | −16.43 | −4.91 | 3.24 | 2.02 | 1.97 | −37.48 | −2.62 | −39.12 |
| Yongzhou | 5.96 | 7.48 | 5.97 | 25.51 | −20.13 | 0.24 | 3.99 | 3.98 | 3.65 | −0.05 | −8.41 | −8.45 |
| Huaihua | 3.92 | 3.94 | 3.16 | 0.48 | −19.65 | −19.27 | 2.40 | 1.90 | 1.82 | −20.66 | −4.17 | −23.96 |
| Xiangxi | 1.72 | 1.53 | 1.32 | −10.73 | −13.74 | −22.99 | 1.55 | 1.17 | 1.17 | −24.70 | 0.36 | −24.43 |
| Zhangjiajie | 1.33 | 1.26 | 1.05 | −5.02 | −17.07 | −21.23 | 1.10 | 0.89 | 0.90 | −19.00 | 0.50 | −18.59 |
| Loudi | 3.72 | 3.78 | 3.01 | 1.60 | −20.26 | −18.99 | 1.17 | 1.08 | 0.90 | −7.05 | −16.84 | −22.70 |
| Shaoyang | 5.68 | 7.31 | 5.08 | 28.71 | −30.59 | −10.67 | 3.13 | 2.46 | 2.19 | −21.68 | −10.99 | −30.29 |
| Total | 76.13 | 83.76 | 64.46 | 10.02 | −23.04 | −15.33 | 26.85 | 23.09 | 20.80 | −14.01 | −9.92 | −22.54 |
Publisher’s Note: MDPI stays neutral with regard to jurisdictional claims in published maps and institutional affiliations. |
© 2020 by the authors. Licensee MDPI, Basel, Switzerland. This article is an open access article distributed under the terms and conditions of the Creative Commons Attribution (CC BY) license (http://creativecommons.org/licenses/by/4.0/).
Share and Cite
MDPI and ACS Style
Yu, D.; Hu, S.; Tong, L.; Xia, C. Spatiotemporal Dynamics of Cultivated Land and Its Influences on Grain Production Potential in Hunan Province, China. Land 2020, 9, 510. https://doi.org/10.3390/land9120510
AMA Style
Yu D, Hu S, Tong L, Xia C. Spatiotemporal Dynamics of Cultivated Land and Its Influences on Grain Production Potential in Hunan Province, China. Land. 2020; 9(12):510. https://doi.org/10.3390/land9120510
Chicago/Turabian StyleYu, De, Shougeng Hu, Luyi Tong, and Cong Xia. 2020. "Spatiotemporal Dynamics of Cultivated Land and Its Influences on Grain Production Potential in Hunan Province, China" Land 9, no. 12: 510. https://doi.org/10.3390/land9120510
Note that from the first issue of 2016, this journal uses article numbers instead of page numbers. See further details here.