Article

A GIS-Based Multicriteria Index to Evaluate the Mechanisability Potential of Italian Vineyard Area

1
Department of Land, Environmental, Agriculture and Forestry, University of Padova, Via dell’Università 16, 35020 Legnaro (PD), Italy
2
Department of Engineering, Aarhus Universitet, 8200 Aarhus, Denmark
3
School of Agriculture, Food and Wine, Waite Research Institute, The University of Adelaide, Glen Osmond, Adelaide, SA 5064, Australia
*
Author to whom correspondence should be addressed.
Land 2020, 9(11), 469; https://doi.org/10.3390/land9110469
Submission received: 19 October 2020 / Revised: 17 November 2020 / Accepted: 20 November 2020 / Published: 22 November 2020

Abstract

:
Planting criteria of new vineyards should comply with rational and sustainable criteria, taking into account the potential mechanisability of existing viticultural areas. However, an established methodology for this assessment is still lacking. This study aimed at analysing the parameters which influence the vineyard mechanisability, with the objective to propose a new mechanisability index. The mechanisability index proposed was based on GIS-analysis of landscape and management parameters such as mean slope, shape of the vineyard block, length-width ratio, headland size, training system and row spacing. We identified a sample of 3686 vineyards in Italy. Based on the above-mentioned parameters, vineyards were categorised by their level of mechanisability (l.m.) into four classes. Moreover, we analysed the correlation between l.m. and economic indicators (area planted with vineyard and wine production). Results showed that the main factors limiting the mechanisability potential of some Italian regions are the elevated slopes, horizontal training systems and narrow vine spacings. The l.m. showed a moderate positive correlation with the size of vineyards and the volume and value of production. The methodology presented in this study may be easily applied to other viticultural areas around the world, serving as a management decision-making tool.

1. Introduction

Italian agriculture, like that of other Mediterranean regions in the European Union, is characterised by great diversity of its rural environments and the large land area covered by extensive uses [1,2]. European landscapes experienced constant evolution to reflect changing demands, i.e., planting orchards and vineyards on former natural areas [1]. Grapevine (Vitis vinifera L.) represents one of the most important crops in the Mediterranean regions, with relevant economic value [3,4]. In this contest, Italy, with 696,512 ha of vineyards (ISTAT http://www.agri.istat.it, accessed on April 2020), has the fourth largest grape growing area in the world and is second to China in terms of grape production [5]. Moreover, with 47.5 mhl wine production, Italy is the first wine-producing country (OIV http://www.oiv.int, accessed on November 2020).
Further growth of the sector requires a reduction in production costs without penalizing product quality. However, to reach this goal, the production process needs to become more competitive and sustainable, which is in part obtainable with wider use of mechanisation [6,7,8]. The trend towards greater mechanisation involves all the vineyard cropping phases, and several agricultural machines are available on the market, performing all vineyard operation. For example, harvesting and pruning are the most labour intensive vineyard operations [9,10] and, together, account for approximately 70% of production costs [11].
Although an expansion of mechanisation has been obtained, thanks to the use of more suitable training systems and better organization of vineyard work, an assessment of the real potential of mechanisation is still not well defined for the main Italian wine-growing areas. For this purpose, traditional mechanisation indices are normally performed as an ex-post operation. For example, according to Nowacki [12], the mechanisation index can be determined as follows:
I M   ( % ) = E M E M + E H + E A
where:
IM = Mechanisation Index
EM = machine work in the field operations
EH = human work in the field operations
EA = animal work in the field operations
Based on (1), Singh [13] suggested a state-level mechanisation index for different crops taking into account the costs of agricultural operations (2):
I m i j   ( % ) = C E M i j C E M i j + C E H i j + C E A i j
where:
Imij = Mechanisation Index of the ith crop in the jth state
CEMij = cost of the use of machinery of the ith crop in the jth state
CEHij = cost of the use of human labour of the ith crop in the jth state
CEAij = cost of the use of animal labour of the ith crop in the jth state
According to several authors [14,15,16], the mechanisation level in a cultivated area can be defined as the ratio between the mechanised operation and the total cultivated area.
Zangeneh et al. [17] developed a mechanisation index based on an artificial neural network model evaluating the deviation of the amount of machine work of a farm from the values at the regional level. Sofia et al. developed a method for classification of land geomorphology based on slope local length of auto-correlation [18]. A new approach to compute a mechanisation index was assessed by Maheshwari and Tripathi [19], which takes into consideration the power of machines and animals and the time taken by machines, humans and animals to perform the cultivation operations.
Geographic Information Systems (GIS) analysis play a crucial role in the agricultural management process. Using remote spatial analysis, GIS allow improving land suitability evaluation [20]. Previous studies suggested the opportunity of using geospatial data to evaluate agricultural land potential use and mechanical accessibility. For example, Jasinski proposed a methodology to assess the likelihood of Brazilian land-use conversion to mechanised crop cultivation based on five landscape and environmental parameters (slope, soil type, precipitation, distance from roads and land-cover type before conversion) [21]. Slope, elevation, precipitation and soil maps were used to determine suitable locations for vineyard plantation [22]. Maps of optimal vineyard sites based on similar geospatial parameters were generated for Croatia [23] and Italy [24]. The methodology was implemented adding several climatic and hydrologic indicators for vineyard site selection in the US [25] and Italy [26]. The methodologies described address land suitability for wine production and the agricultural mechanisability from the physical landscape point of view. However, to the best of our knowledge, an approach aimed at evaluating the potential for mechanisability based on specific, measurable parameters concerning machinery accessibility is missing.
In this study, we developed an index to determine the level of mechanisability (l.m.) of Italian vineyards based on landscape and management parameters which limit machinery accessibility and can be assessed using a GIS. The objectives of this research were (i) to analyse landscape and vineyard management parameters of a large number of vineyards, (ii) to define the weight of these parameters with regard to their influence on viticultural machinery accessibility, and (iii) to define an index for the evaluation of the mechanisability potential based on the weight of the parameters. The index may be easily applied to other viticultural regions for an analysis of the potential mechanisability of vineyards.

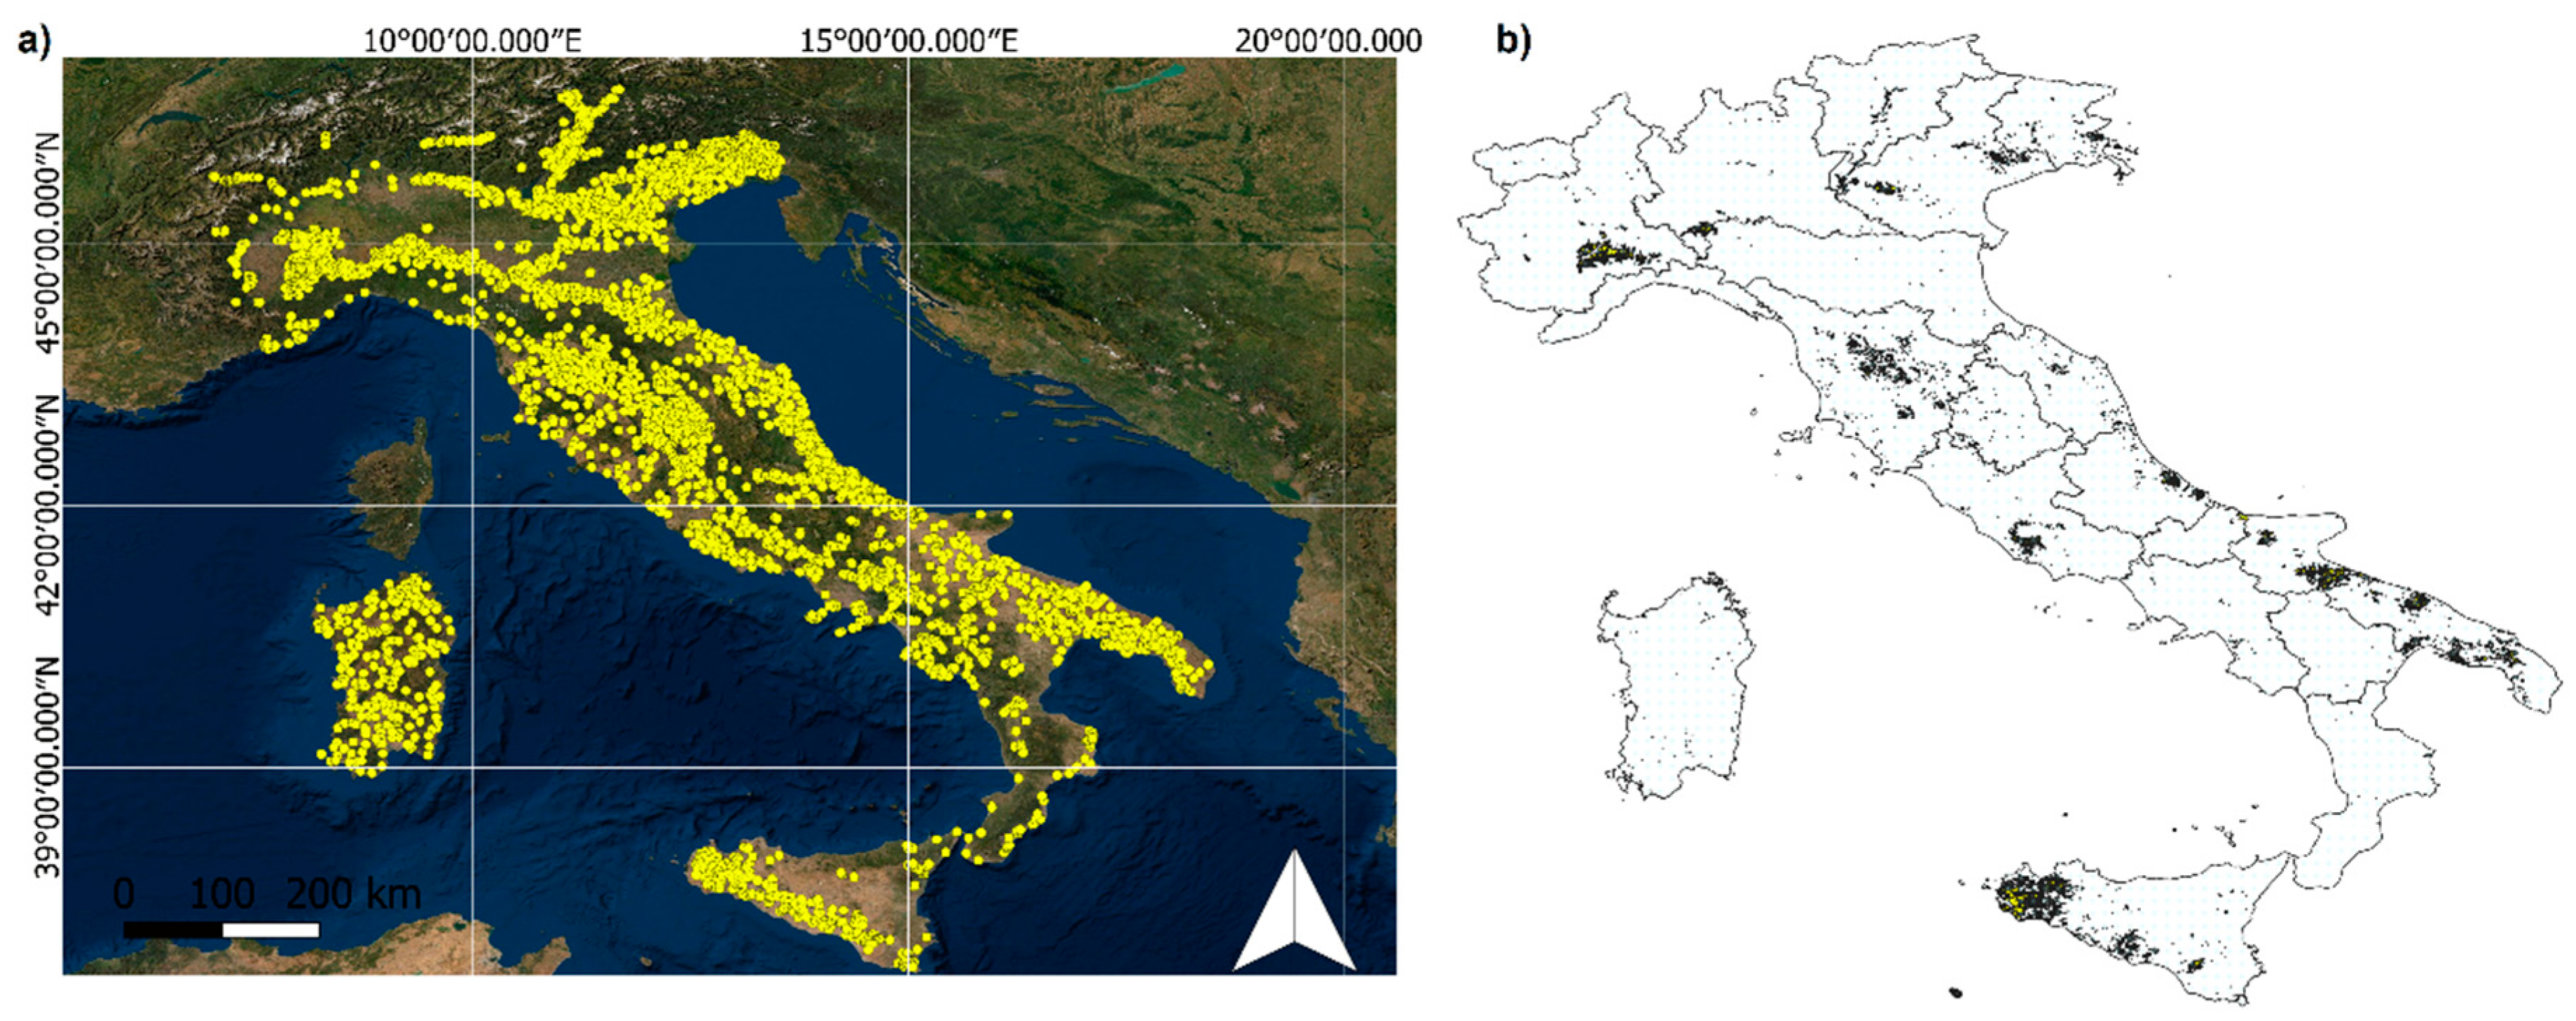
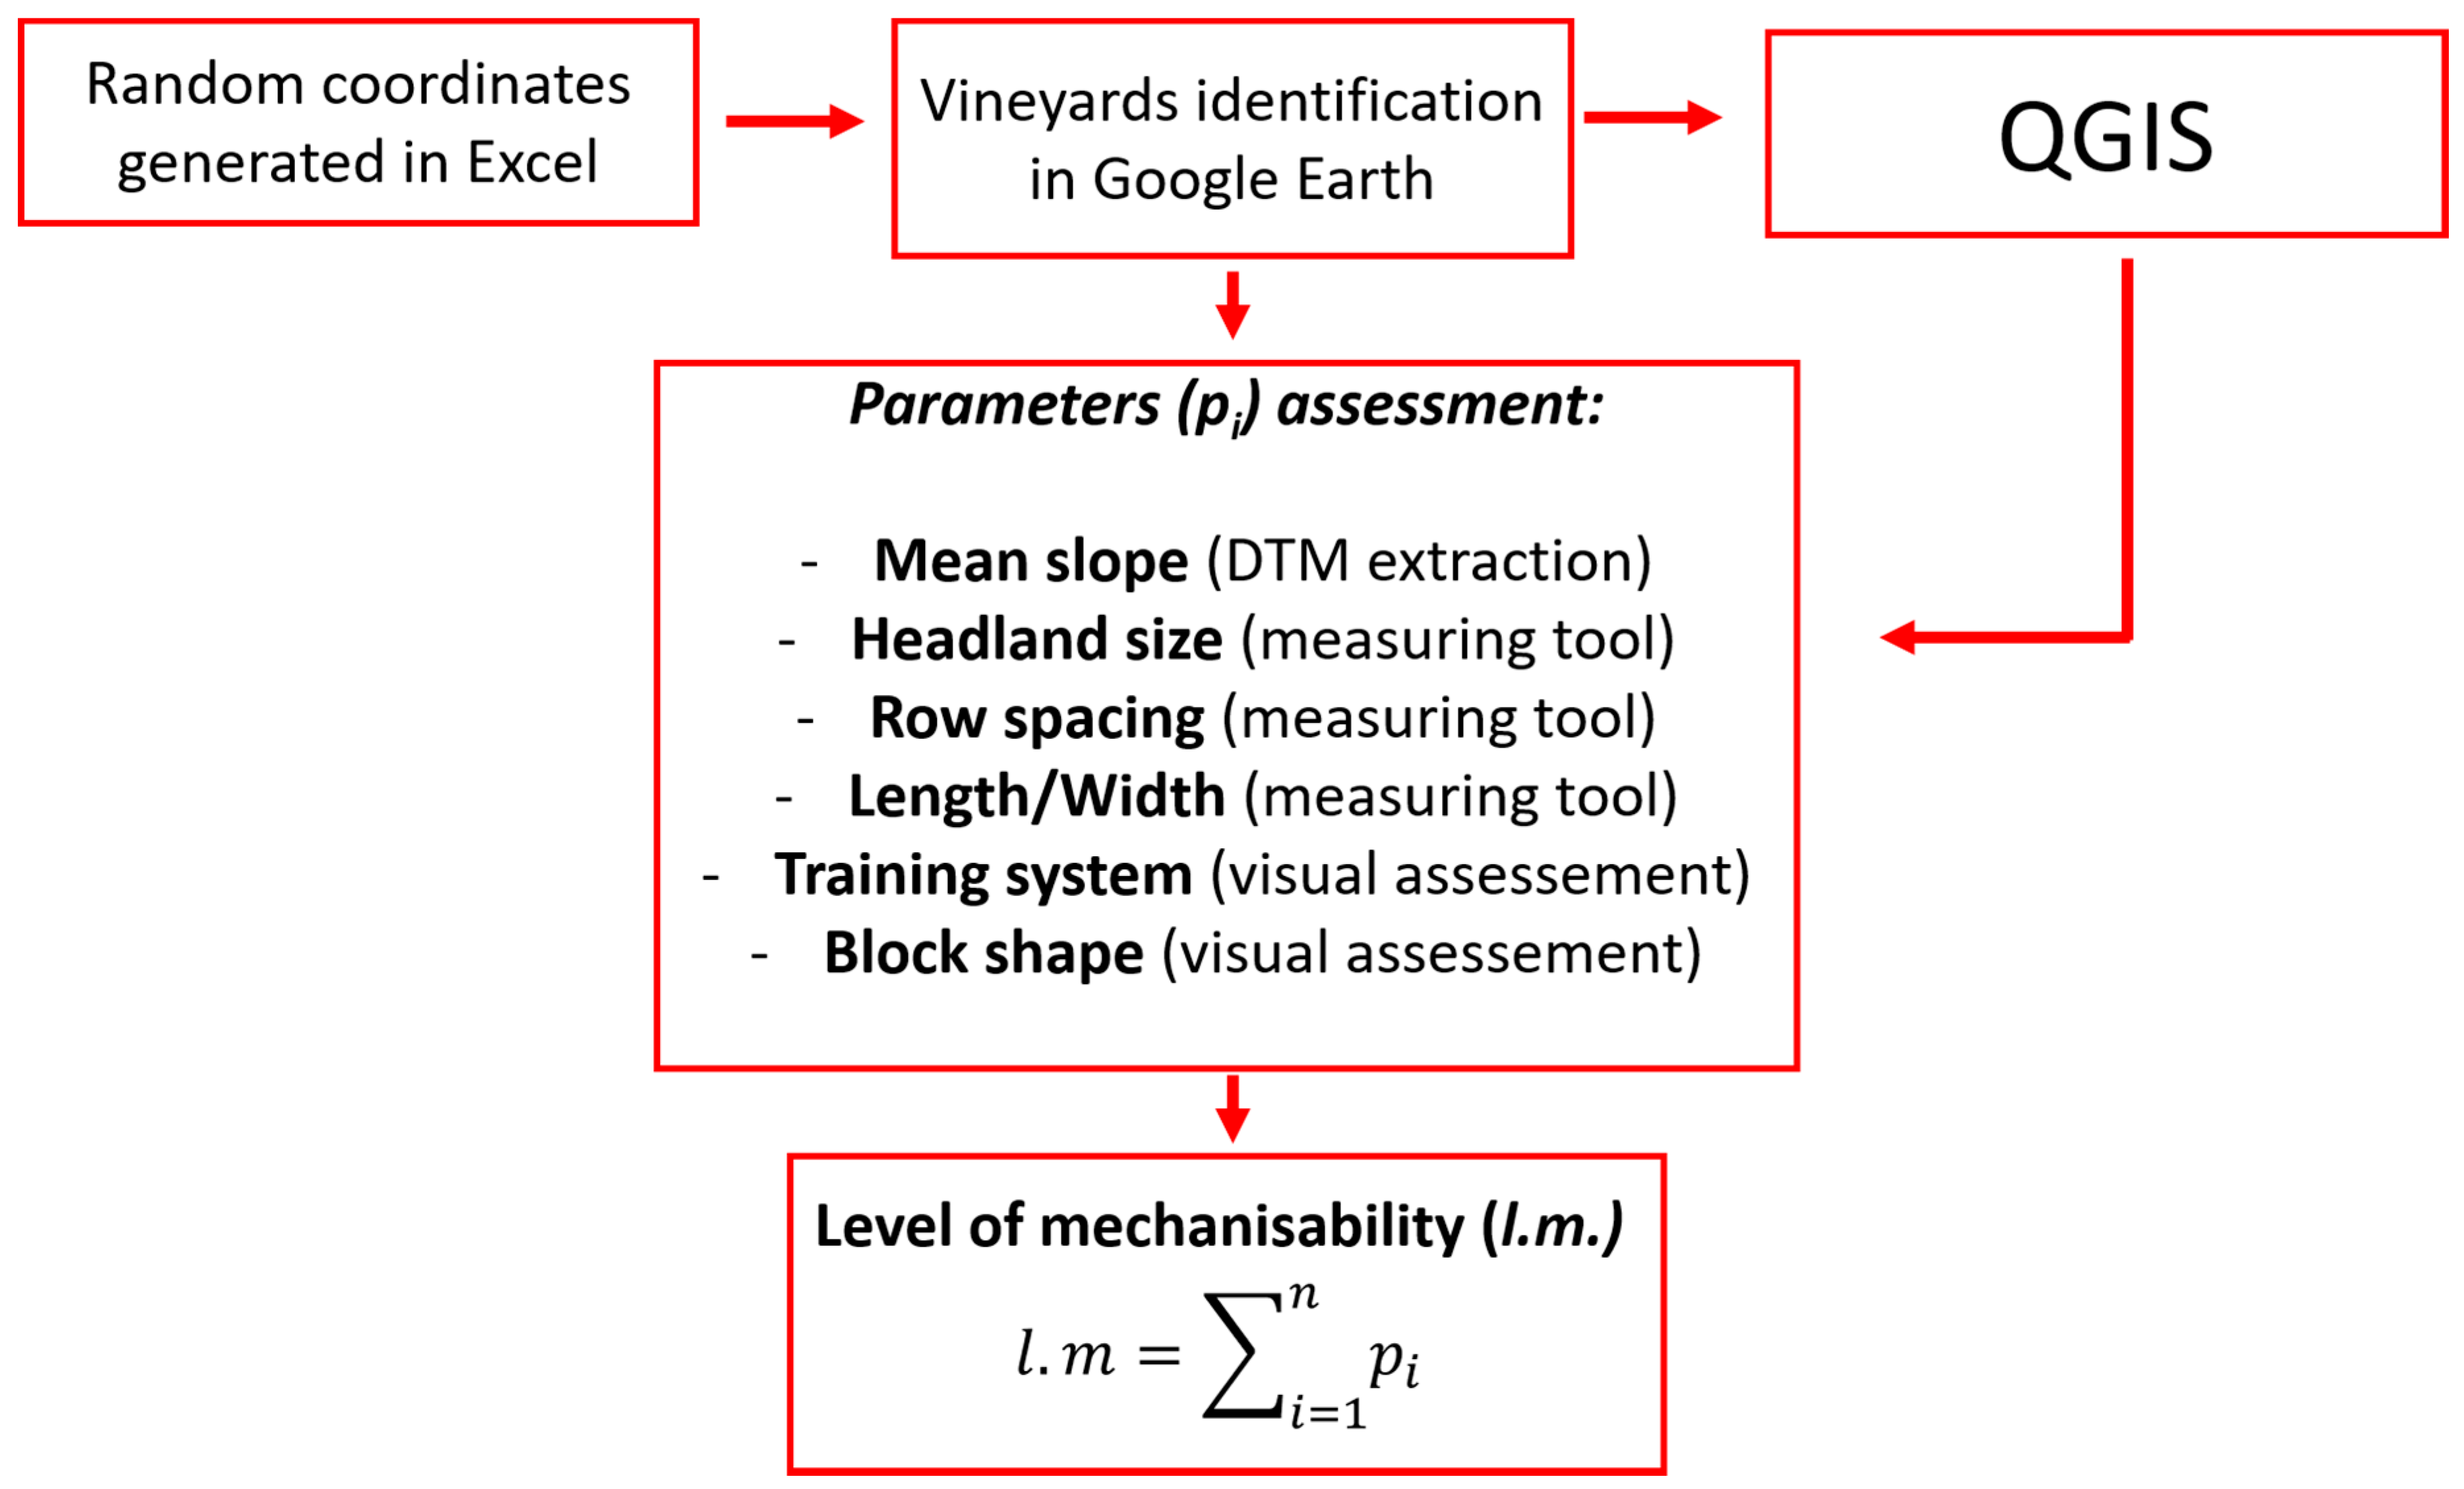
2. Materials and Methods

A number of 3690 vineyards located in all twenty Italian regions (NUTS 2) were analysed in this study (Figure 1). Vineyards were selected on a regional scale, using a random stratified sampling method with the available maps of local Wine Appellations. The number of vineyards selected in each region was proportional to the total planted area. Vineyards were randomly chosen, using the Microsoft Excel for Office 365 MSO randbetween function. Once a couple of coordinates was generated with the Excel function, it was imported in Google Earth app. The vineyard located as close as possible to the reference point was selected. The dataset can be assessed in [27].
Once vineyards were identified, a multistage GIS analysis was performed to include parameters such as: mean slope (average degree of inclination of a vineyard relative to the horizontal plane), block shape (shape of an operationally independent vineyard), length-width ratio (ratio between the average length of the rows and the width of the block measured along the perpendicular to the rows), headland size, training system (combination of trellising and pruning used to control a vine’s shape and size) and row spacing. The parameters influencing the machinery accessibility were identified through in-depth literature review and are analysed in detail in paragraphs 2.1 to 2.5. The analysis was carried out in the QGIS environment (QGIS 3.4 Madeira Version), an opensource geoinformation software that enables management and analysis of geographic data. After importing the database in Excel, each parameter was rated from 0 (nonmechanisable) to 100 (highly mechanisable), according to its contribution to mechanisability. The score assignment criteria prioritised harvest and pruning machinery, as these operations are the most labour intensive. The l.m. of each vineyard was then calculated by multiplying the ranking of the single parameters (pi) (3).
l . m . = i = 1 n p i
Based on the l.m. results, regions were divided into five classes of mechanisability: 0–20%, 20–40%, 40–60%, 60–80% and 80–100%.
Before assigning the weights to the six parameters, a Pearson’s correlation test between the scores attributed to the parameters was performed. The correlation analysis aimed to avoid double-counting. Moreover, a Principal Component Analysis (PCA) was performed to check the opportunity of reducing the dimensionality of the data. The statistical analysis was carried out using R statistical software (Version 3.5.2, RStudio Version 1.0.463).

2.1. Slope

Field’s slope is a key influencing factors for optimal manoeuvring and routing of agricultural machines [28]. The mean vineyard slope was derived from a Digital Terrain Model (DTM) with a 20 meters spatial resolution [29]. The DTM is available online (http://www.sinanet.isprambiente.it/it/sia-ispra/download-mais/dem20/view, accessed on November 2020) and was built by the Institute for Environmental Protection and Research of Italy (ISPRA). Slope is often the limiting factor for vineyard mechanisation and one that cannot be amended unless expensive operations are carried out (i.e., building terraces). Self-levelling and tilt correction devices allow to operate on steep ground [30,31,32], however, stability risk may occur when the slope exceeds 10°. The most suitable slopes for viticultural machinery are those in the 0–5° range, steep slopes (>15°) cause difficulty in using vineyard equipment [33,34,35].
Mean slopes of the sampled vineyards were categorised into four classes according to their mechanical accessibility (Table 1).

2.2. Vineyard Block Shape and Length-Width Ratio

The efficiency of agricultural machinery depends on many structural factors, such as manoeuvring ability, overlap, idling and route optimization [36,37,38]. At block level, its shape can also be a limiting factor. Rectangular shaped blocks reduce the turning times, increasing time efficiency [39,40,41]. Efficiency rises with a high length-width ratio by reducing the task times for manoeuvring [42].
Based on these considerations, vineyard shape was categorised into two classes: the contribution to mechanisability was considered equal to 100% for regular shapes (rectangular and square) and 90% for irregular ones. Shape was assessed through visual evaluation of Google satellite images available in the QGIS environment. The length-width ratio was divided into three classes (Table 2). The third class ranking was greater than 100% as long and narrow blocks not only allow but also promote mechanisation. Length and width were measured along the parallel and the perpendicular to the rows, respectively, employing the QGIS measuring tool in the Google images, which allows measuring angles and distances between two points according to a defined ellipsoid.

2.3. Headland Size

Sufficiently broad headlands are essential for turning equipment; with headland width below two meters, tractors might have difficulties when manoeuvring. Compact trailed equipment requires headlands wider than two meters. The operating space can be even larger for bulkier machinery, such as harvesters. Headland size was measured from the Google images with the QGIS measuring tool. The class ranking for the contribution to mechanisability from the headland size [43,44] is shown in Table 3.

2.4. Training System

Training systems have a significant influence on vineyard mechanisation. Italian viticulture is well known for the presence of numerous traditional, often region or province-specific, training systems and this represents a barrier for mechanisation. Some traditional training systems are less suitable for mechanised operations and the coexistence of very different training systems requires modifications to the machinery. Systems such as the Pergola, for example, reduce transit width and heights [45]. Similarly, limitations for vineyard equipment are encountered in the Tendone system, which is common in southern Italy. Examples of Pergola and Tendone training systems are reported in Supplementary Materials (Figures S1 and S2).
Another typical cultivation system in some Italian regions is the Alberello (known in France as Goblet, in Australia as Bush vine). The use of traditional Alberello causes several limitations to machinery accessibility, due to its three-dimensional shape, the narrow inter row spacing and the canopy proximity to the ground [46]. To overcome these issues, many traditional Alberello have now been converted into two-dimensional wall form, thus allowing for specially-built machinery to operate [46].
Vertical training systems are most suitable to machinery accessibility, and trellising such as Geneva Double Curtain (GDC) and Free-cordon (FC) allow the full mechanisation of harvesting and pruning [47,48].
For the vineyards considered in this study, training systems were visually assessed from the Google images available in the QGIS environment. Any unclear issues were resolved using the Street View function available in Google Earth maps. Training systems were divided into three classes (Table 4).

2.5. Row Spacing

Row spacing determines the minimum size of the equipment that can enter the vineyard. Generally, machinery cannot access vineyards with row spacing below 1.7 m [49]. A spacing larger than 2 m ensures transit for even the bulkier tractors. For the studied vineyards, row spacing was determined with the QGIS measuring tool by dividing the width of the whole vineyard by the number of mid-rows, and the ranking was based on the width of tractors available on the market, as described in a database built with the support of Edizioni L’Informatore Agrario Sr.l. and discussed by Yezekyan et al. [50] (Table 5).
Table 6 summarises the contribution of every parameter to the potential vineyard mechanisability. Figure 2 provides the workflow of the l.m. assessment.

2.6. Level of Mechanisability and Economic Indicators

The most relevant indicators describing the economic structure of all 20 Italian regions were analysed. The parameters considered were the area planted with vineyard (hectares) and the wine production expressed in volume (hectoliters) and value (euros). This information was available online on the website of the Italian National Institute of Statistics (ISTAT http://www.agri.istat.it, accessed on April 2020).
The above-mentioned parameters were correlated with the l.m. of the 20 regions using Pearson’s correlation. This analysis was carried out using GraphPad Prism 8.0.0 (GraphPad Software, Inc., La Jolla, CA, USA) and aimed to unveil the relationship between the potential mechanisability of different areas and their economic status. The correlation analysis was repeated considering only the regions ranked at the first and last places for l.m., thus excluding anomalous situations where, despite low l.m., the existence of prestigious appellations generates high income, i.e., Trentino Alto Adige and Piemonte.

3. Results

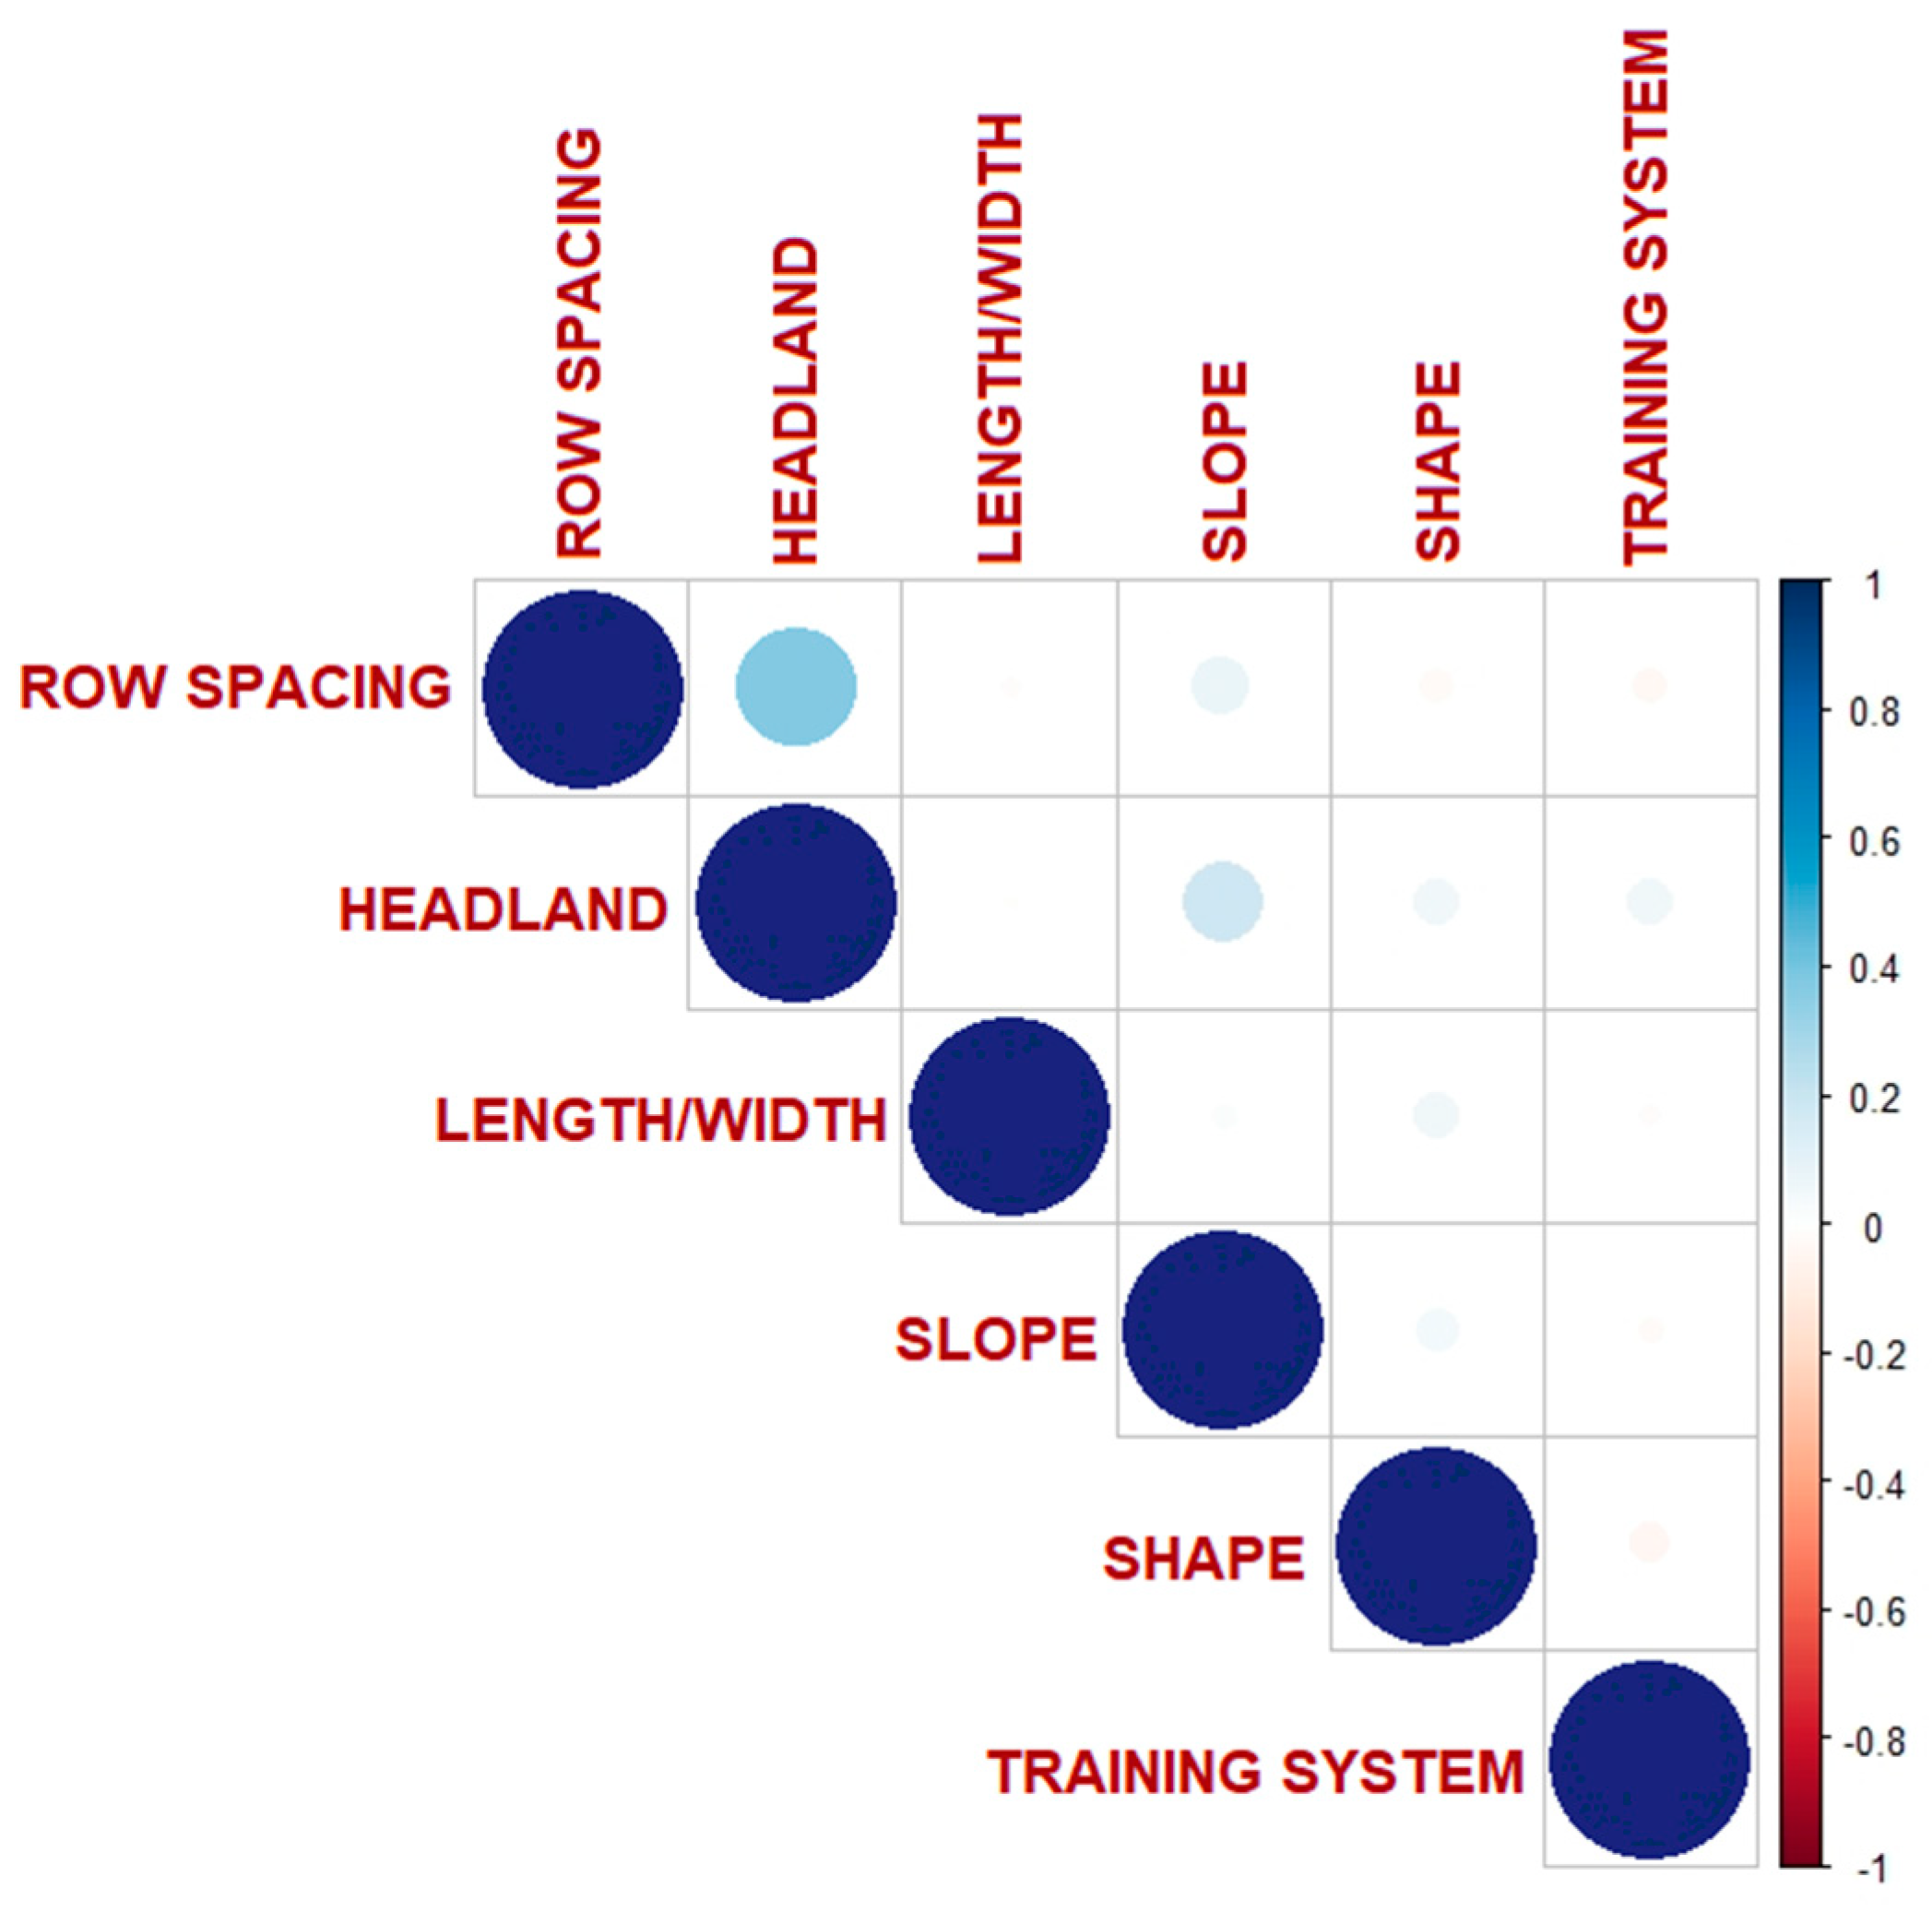
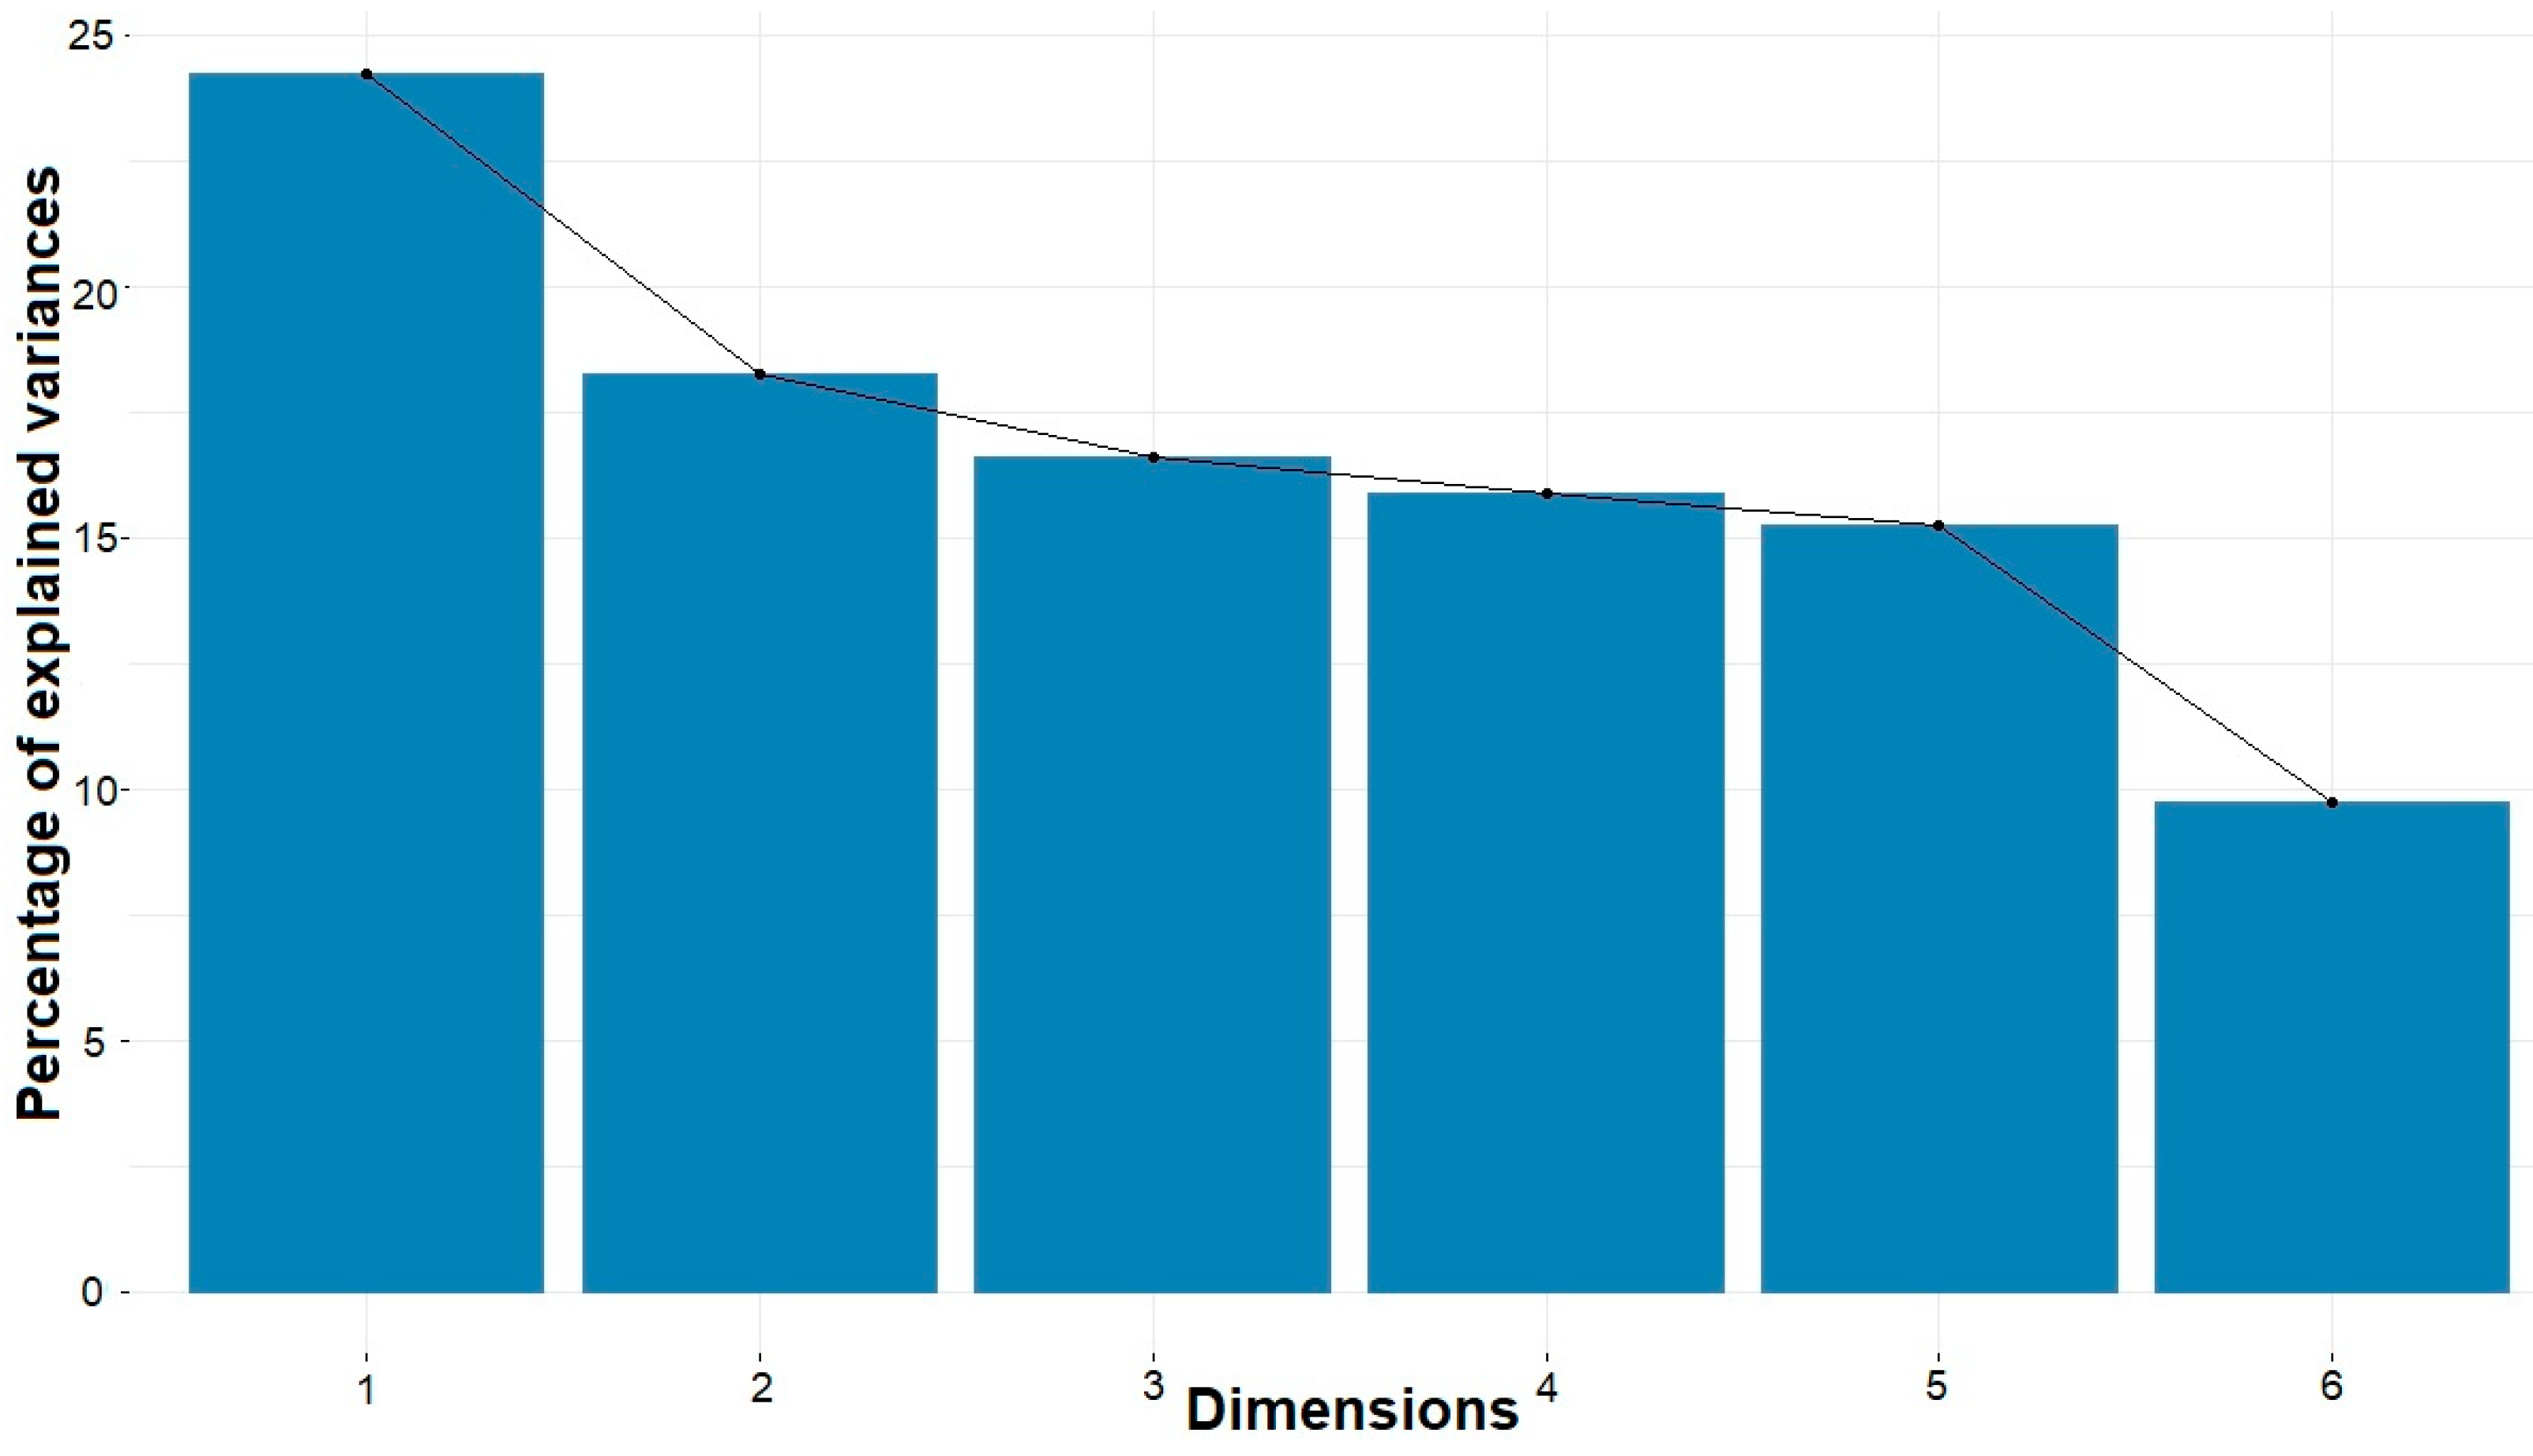
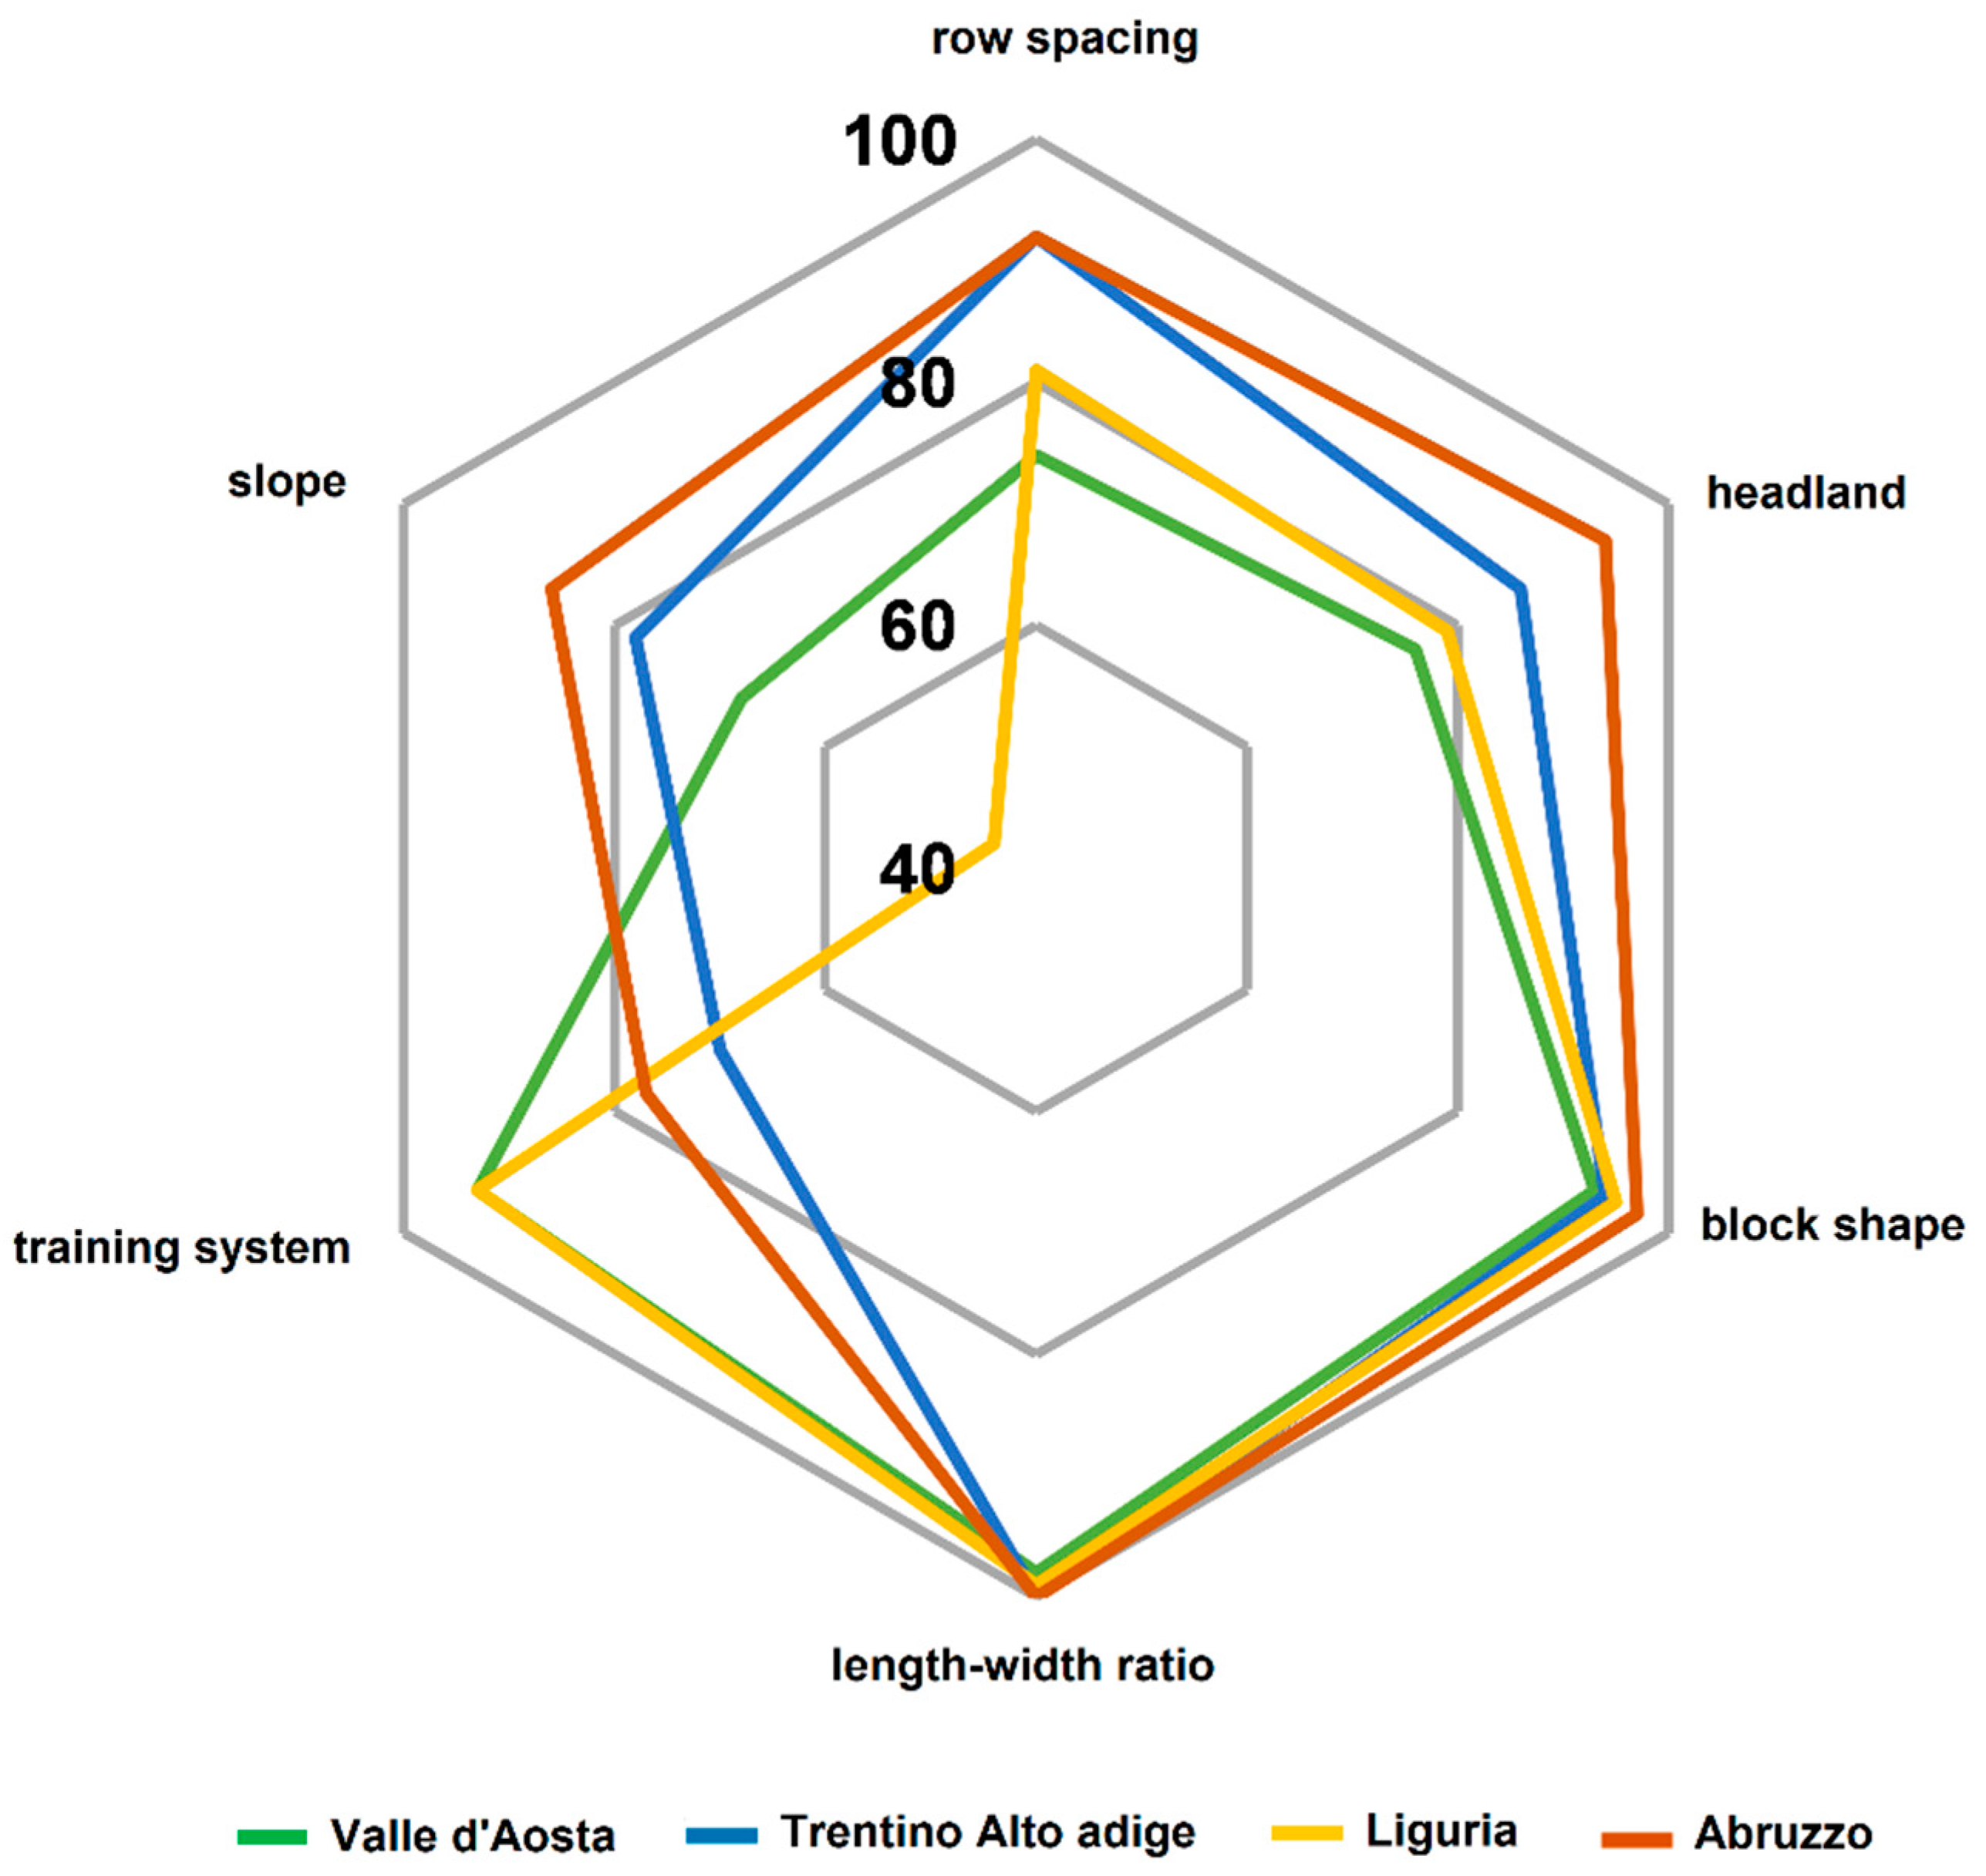
3.1. Preliminary Analysis of the Contributing Parameters

The preliminary analysis of the contributing parameters aimed at verifying the correctness of the attributed score. The determination coefficients between the scores attributed to the contributing parameters were very low (between 3.8 × 10⁻⁵ and 0.14), thus excluding cocorrelation (Figure 3).
PCA was carried out to assess if the number of variables could be reduced by elimination of cocorrelating ones. The first two principal components explained 42.5 % of the total variance (Figure 4). The principal component 1 (PC1) and 2 (PC2) contributed 24.3% and 18.2%, respectively. Values above 90% of total variance explained were achieved only originating from five principal components. PC1 was dominated by headland size and row spacing, while the parameters that contributed most to PC2 were block shape and length/width ratio (Figure 5).

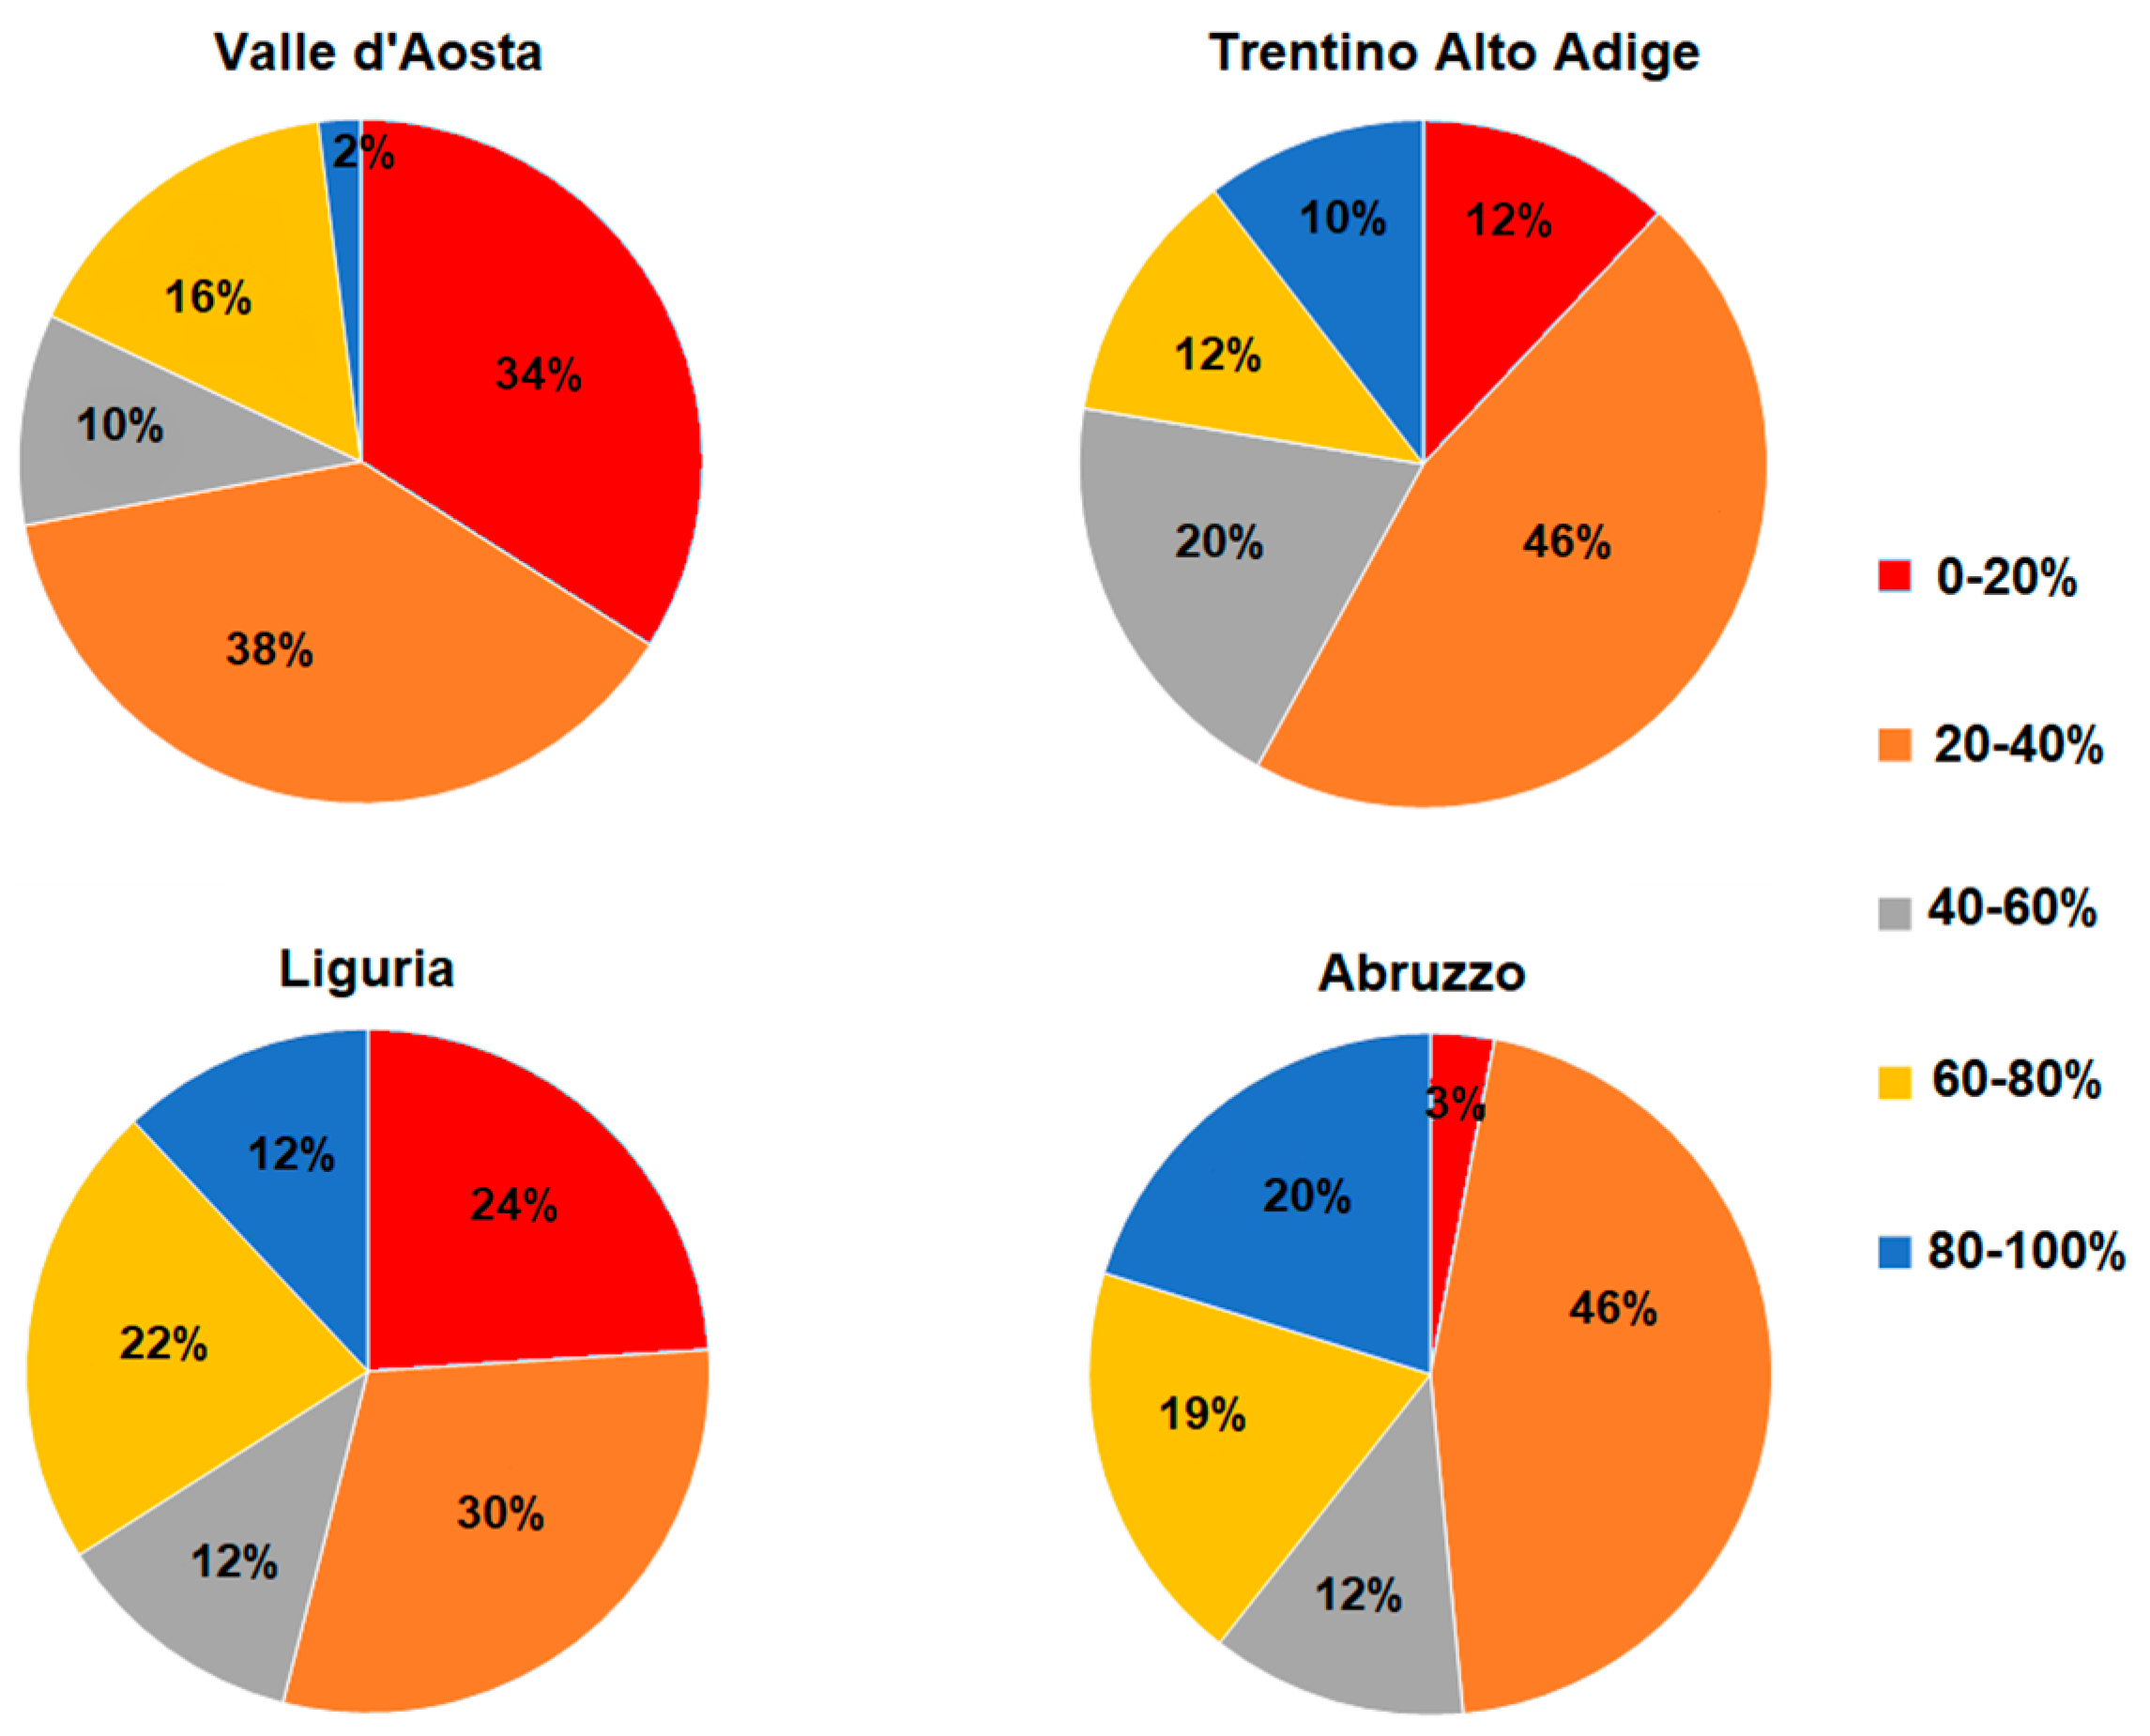
3.2. Level of Mechanisability of Italian Viticultural Areas

Figure 6 shows the map of Italy and its regions colour coded according to the average value of mechanisability assessed by multicriteria analysis (a) and slope (b). The poorly mechanisable regions are mainly located in the areas of steepest slopes, thus highlighting the crucial influence of slope on machinery accessibility.
When considering the sum of the sample vineyards placed in class 1 (80–100% of mechanisability) and class 2 (60–80% of mechanisability), the regions exhibiting greater accessibility by vineyards equipment were Friuli Venezia Giulia, Umbria, Tuscany, Veneto and Sicily (Figure 7). In particular, the l.m. for the most mechanisable region, Friuli Venezia Giulia, varied between 60 and 100% while Sicily, fifth most mechanisable region, showed a much wider range with vineyards in all categories but the 0–20%.
The spider plot in Figure 8 represents the influence of the six parameters analysed in this study on the l.m. and it shows that slope, headland, training system and block shape were never ideal (100) in all five regions. Conversely, the sufficiently wide row spacing and the optimal length-width ratio positively influenced the high l.m. calculated for these regions.
The regions showing the lowest average predisposition to mechanisation were Valle d’Aosta, Trentino Alto Adige, Liguria and Abruzzo (Figure 9). Figure 10 shows the high influence of the slope and, to a lesser extent, training system, headland and row spacing on the low l.m. of most of the low-mechanisability regions.
A summary table of the average values of the parameters considered for every region is reported in Supplementary Materials Table S1. Moreover, Figures S3–S8 in Supplementary Materials show the distribution of each parameter in the sample vineyards.

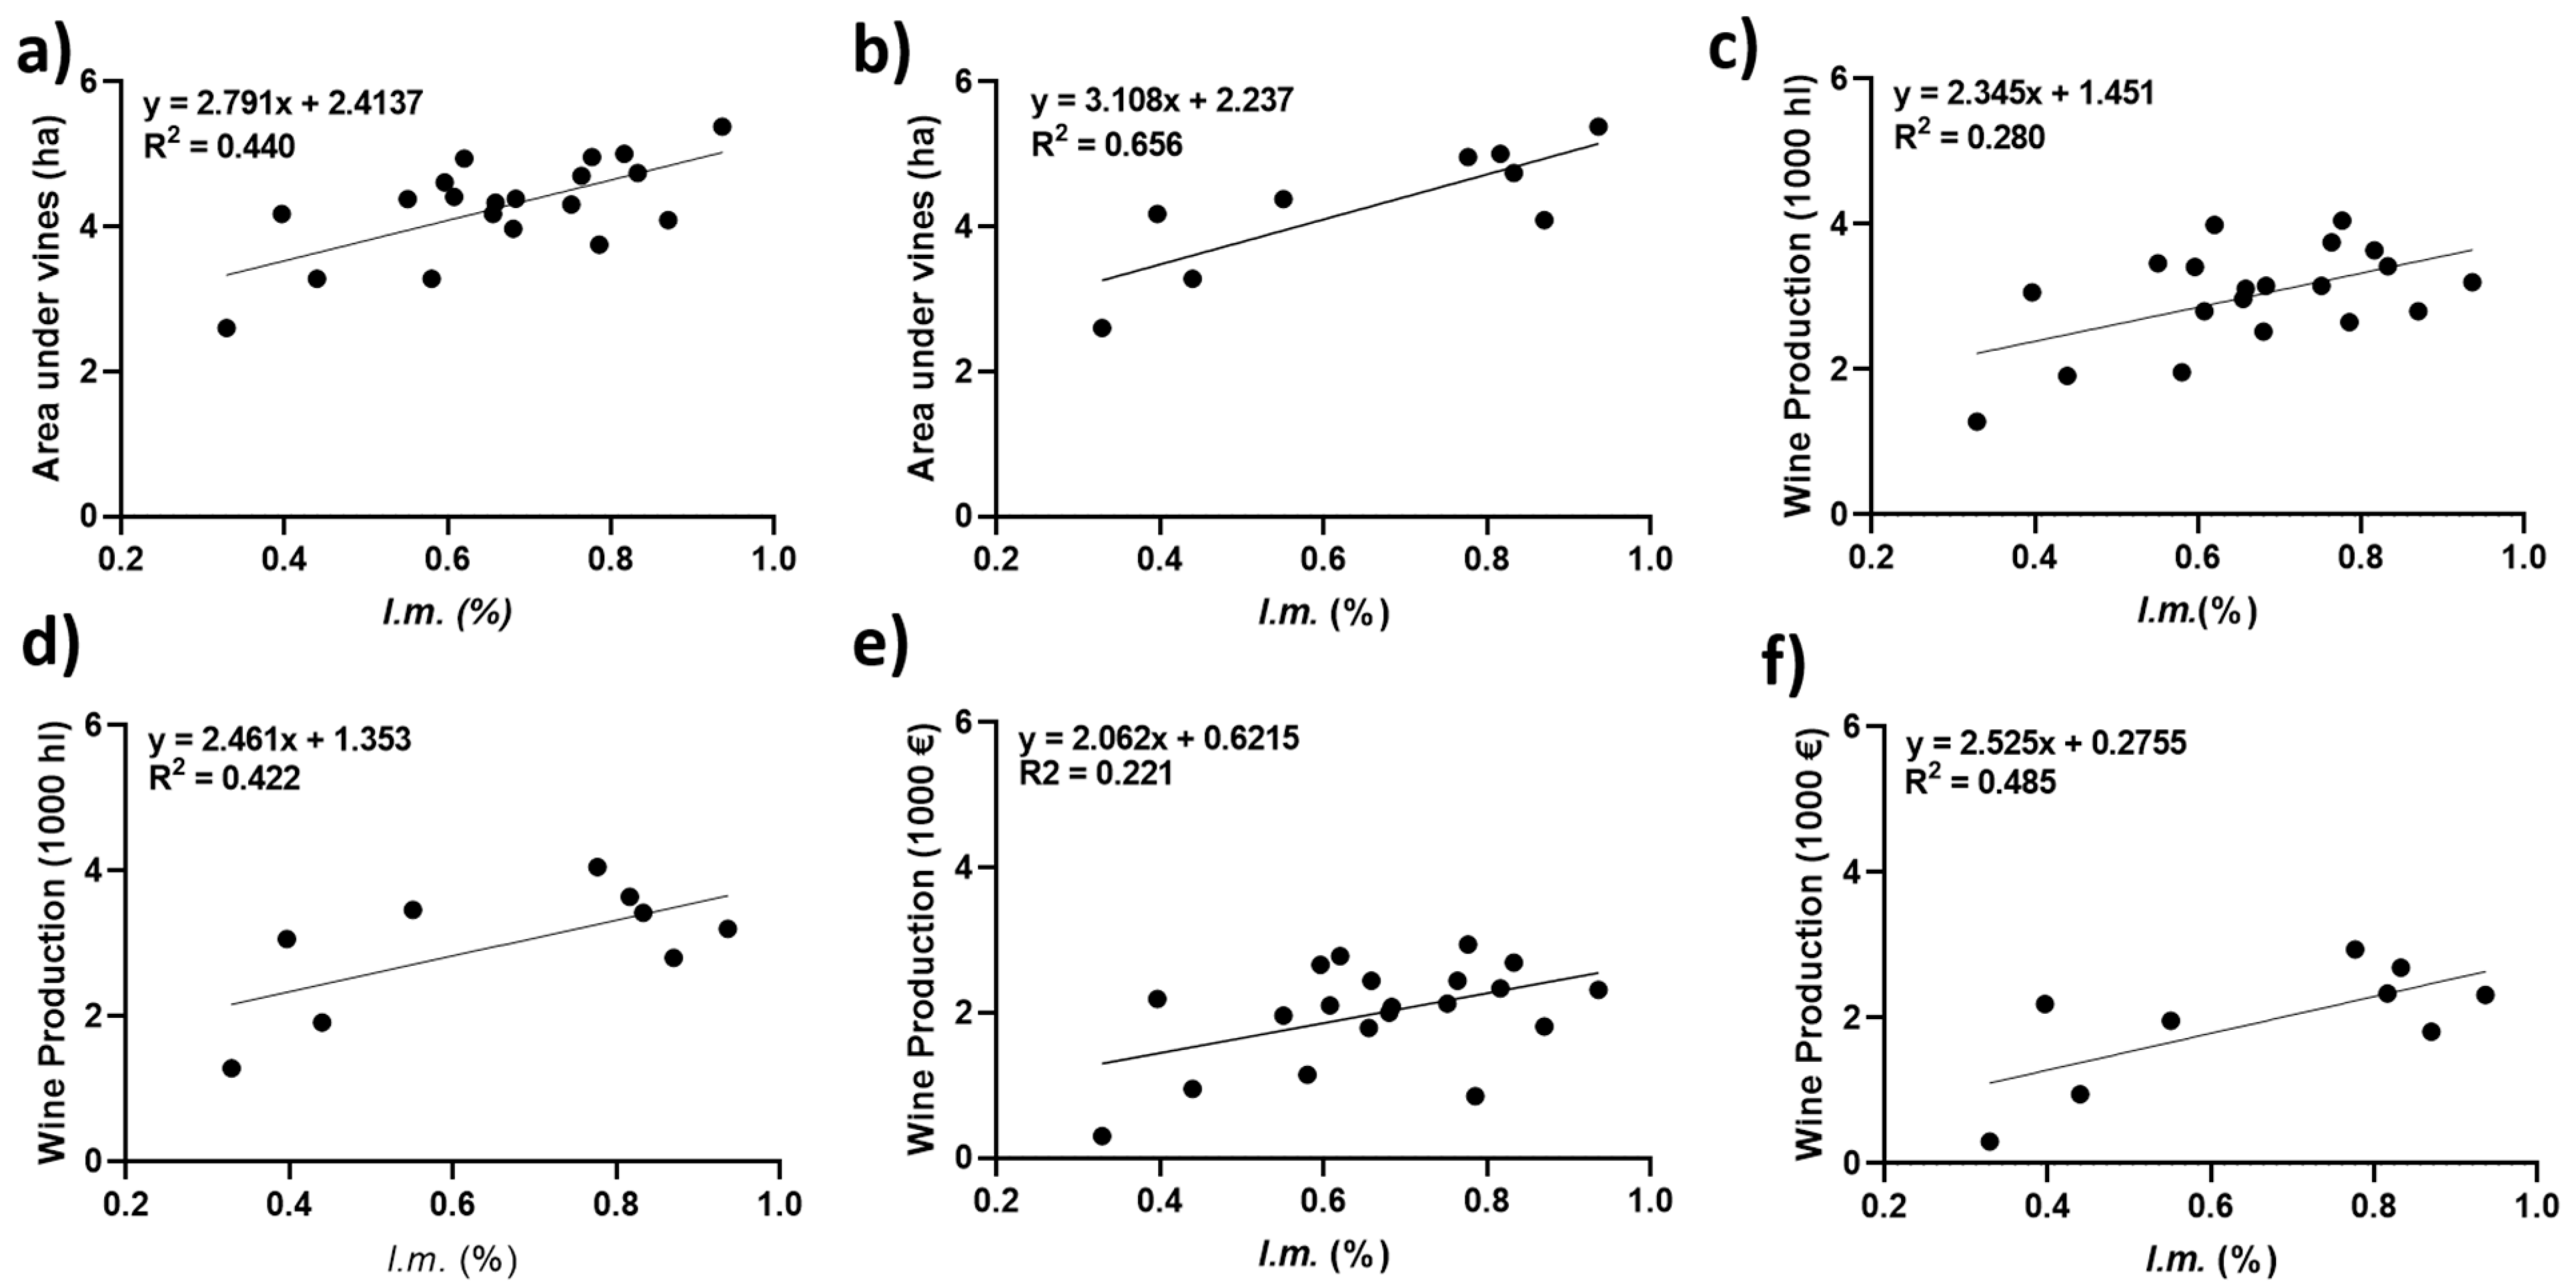
3.3. Correlation between Mechanisability Potential and Economic Indicators

Pearson’s analysis showed a significant positive correlation between the l.m. and the area planted with vineyard (R2 = 0.440, p < 0.01). The correlation coefficient improved when considering only the top five regions (as defined in Figure 7) and the low-mechanisability (as defined in Figure 9) regions (R2 = 0.656, p < 0.01). A lower positive correlation was found between l.m. and the volume (R2 = 0.278, p < 0.05) and the value (R2 = 0.221, p < 0.05) of wine production. As for the vineyard planted area, the correlation between l.m. and wine production (in value: euros) was slightly higher when including in the test only the top five and the low-mechanisability regions (R2 = 0.485, p < 0.05). The correlation between l.m. and wine production (in volume) for the reduced samples of regions was not significant. Figure 11 shows the individual correlation plots. Due to the wide span of values, a logarithmic representation was preferred.

4. Discussion

In Italy, 59% of vineyards are cultivated on hilly territory and 6% in the mountains [51]. The high topographical variability and intense urban settlements have fostered the adaptation of marginal land to agricultural use [52]. The evaluation land suitability for viticulture, as hilly territory imposes some limitations, such as low soil fertility, the need of vineyard terraces and inadequate accessibility [24,26]. This study focused on the constraints to mechanisability showing that slope is the main factor affecting mechanical accessibility of Italian vineyards (Figure 6). It might be assumed that some viticultural management decisions depend on the slope of the block. In particular, in case of steep slopes, the headland size and the row spacing would appear a minor concern. Before the attribution of the scores, this potential interdependence was verified to avoid double-counting. The results of the Pearson correlation test between the variables showed that the factors were not correlated (Figure 3). The reason may be related to the high variability of the Italian territory suitable for wine production. In this situation, it is plausible that farmers’ planting choices are imposed by the need to adapt to local peculiarities, such as remoteness and morphological features [53]. Moreover, the PCA proved that some management parameters showed a reciprocal correlation, for example, headland size and row spacing were positively correlated, as well as block shape and length/width ratio (Figure 5). Nevertheless, Figure 4 showed that, in order to explain about 90% of the variability, the variable number could not be reduced.
The results of the classification by potential mechanisability of the twenty Italian regions, showed that Friuli Venezia Giulia ranked first, with a considerable distance from the other regions (Figure 7). The analysed vineyards of this region were entirely classified in the two highest classes of mechanisability, with 95% of the blocks in the first class (80–100%). The average slope of the sample vineyards in this region (1.3°) was the lowest in the whole Italian territory. The average size of the headland (6.5 m) was at least one meter wider than the other highly mechanisable regions. Furthermore, the row spacing had an adequate width (almost 90% exceeded 2 m), and the ratio between length and width was above 0.8 m, considered as ideal, in 92% of cases (Supplementary Materials Table S1).
Friuli Venezia Giulia, since it presented an ideal combination of factors to foster vineyard mechanisation, was then used as the reference point against which to compare all other regions.
Overall, the main factors penalising the potential mechanisability in the top-ranking regions were the mean slope, the irregular block shape and the narrow headlands (Figure 8). All these factors are linked to the inconsistent conformation of the Italian territory. As an example, the Veneto region, which is the biggest wine producer in Italy (11 million of hectoliters in 2019) was characterised by narrow headlands (50% was in the range between 3 and 4.5 m) and by a high number of irregularly shaped blocks. In the last decade, Italy faced a considerable contraction of the area planted with vineyard (−8.4% from 2008 to 2019, http://www.agri.istat.it, accessed on September 2019). Concurrently, winegrowing was increasing in Veneto (+23% from 2008 to 2019, http://www.agri.istat.it, accessed on September 2019). This expansion is mainly due to the Prosecco phenomenon, which has seen an increase in production of 129% between 2003 and 2016 [54], leading to rapid land-use changes. Such changes in this fragmented territory may have led to the establishment of new vineyards in marginal areas.
As a brief overview of the main characteristics of the viticulture of the top-ranking regions, 79% of the vineyards in Friuli Venezia Giulia are grown in the lowland, and the average size of wine farms is 3 ha. Conversely, in Umbria, 94% of the vineyards are located in the hills, characterised by gentle slopes; the average size of the wine farms is 1.1 ha. Similarly, 89% of vineyards are grown in the Hills in Tuscany, but the average size of the farms is more than double (2.3 ha). As already mentioned, Veneto shows an expansion of viticultural areas, its vineyards are homogeneously distributed in lowland and hilly areas and the average farm size is two hectares. In Sicily, vineyards are located both in the lowland and in the hills. The size of the wine farms is 2.7 ha. Data provided about the average size of the farms are based on the 2010 agricultural census (http://dati-censimentoagricoltura.istat.it, accessed on November 2020).
Analysing the Italian regions less suited to mechanisation, Figure 9 shows that the mountain regions were disadvantaged. In addition to the slope, Figure 10 shows that mechanical accessibility was complicated by the high percentage of horizontal training systems (mainly Pergola trentina and Tendone). Despite their gradual replacement with vertical trellis systems, Pergola and Tendone are still the primary training method in some regions [45,55,56]. Farmers still consider these trellis systems necessary for local cultivars given their beneficial contribution to grape maturation [45,57]. Moreover, Pergola is well suited to the terraces adopted in the steepest soils. However, the shape of these horizontal training systems makes it difficult for the mechanical accessibility of the vineyards, implying about 500–700 h of workers’ labour per hectare. It should be considered that in some of the regions which showed a low mechanisability potential, terraced vineyards are a widespread practice, thus impeding any possible access to machinery. Trentino Alto Adige, Valle D’Aosta and Liguria, are indeed defined as “heroic viticulture” regions. In Trentino Alto Adige and Valle d’Aosta, 100% of the vineyards are located in the mountain, while in Liguria and Abruzzo, in the hills.
Italian viticulture is characterised by a marked variability not only at a regional scale but also within the regional territory. Some regions range from vineyards along the coast to heroic viticulture practised in steep slopes and high elevation. Therefore, our results represent an average indication of the mechanisability potential, which needs to be applied to each specific situation. Nevertheless, the methodology proposed allows for a quick assessment and provides a tool for ex-ante land planning. To help understand intraregional variability, Figures S3–S8 of Supplementary Materials show the results of the assessment of the parameters with the background maps of the provinces (NUTS 3).
The full mechanisation of Italian and, more generally, European viticultural areas has not yet been reached, due to the fragmented agricultural holdings and suited hillside areas [58,59,60,61]. In this study, we evaluated the planting and management parameters that influence vineyard mechanisability. When slope, row spacing and training system become limiting factors, mechanising some vineyard operations which employs bulkier machinery (i.e., harvesting) is not possible. On the other hand, harvest expenses have a high incidence on the product cost and introducing mechanised harvest would lead to a significant reduction of the annual costs. For this reason, along with the l.m., this study examined its correlation with the main economic indicators. The results showed that the potential mechanisability had a moderate positive correlation with wine production, both in terms of value and volume (Figure 11c–f). Wine production is influenced by several factors, such as environmental conditions, variety and wine appellations, where regulations impose a limit on production. For example, Wine Appellations regulation in Umbria, which resulted highly mechanisable, impose that yield may not exceed 9 t ha−1. On the other hand, regulations in Trentino Alto Adige, which was one of the less mechanisable regions, allow up to 15 t ha−1 yield. Moreover, the area planted with vines in Trentino Alto Adige is larger than Umbria. Similarly, the value of production is highly regional and related to the wine market. Nevertheless, on equal terms, the mechanisation of different stages has a positive influence on the value, due to the reduction of production costs. The peculiarities of the Italian wine sector, with an incredibly high number of wineries, varieties and wine styles make it difficult to highlight the positive influence of the l.m. on the production, explaining the moderate positive correlation shown in Figure 11. However, these findings highlight a trend that may foster the adoption of planting and management criteria, promoting the mechanisability across all viticultural areas. The positive correlation between the l.m. and the area planted with vineyard (Figure 11a,b) was a further confirmation of the positive influence of the mechanical accessibility of vineyards on the viticultural investments.
Vineyard mechanisation represents an opportunity to support sustainable management processes, as it is related to variable-rate technologies, which allow rational input employment. On the other hand, land planning needs to be sustained with objective tools and methodologies. The index proposed in this study provides the opportunity of an ex-ante evaluation of the mechanisability potential, which may help to promote the adoption of rational land planning decisions. The results of this study showed that Italian vineyards are characterised by high variability. Similarly, other viticultural areas present different peculiarities which give them a unique character. The availability on the market of different agricultural machines, adaptable to diverse situations, make it complicated to design a universal l.m. index. Nevertheless, the competitiveness of the viticulture industry cannot prescind from adopting new plantations ensuring high performance in terms of management [11]. This paper analysed the most effective vineyard management choices to promote machinery accessibility, thus providing a tool universally applicable for land use planning on a large scale.

5. Conclusions

This study developed a new GIS-based multicriteria index to evaluate the potential mechanisability of viticultural areas in Italy. The index was applied to classify the mechanical accessibility of Italian regions, based on geographical and managerial parameters. Other parameters influence the mechanisability, such as the final product (i.e., table wine, quality wine) and the proximity to main roads. However, this analysis focused on parameters easily retrievable from a Geographic Information System (GIS). The results showed that steep slopes, horizontal training systems and narrow row spacings are the factors limiting the potential mechanisability of Italian vineyards. The correlation analysis between l.m. and economic indicators showed a moderate positive correlation between l.m. and the vine planted area, the volume and the value of production. Thus, it may be assumed that when geographical and managing parameters promote vineyard mechanisation, production is more efficient and profitable. The assessment of vineyard l.m. has been, so far, carried out as an ex-post process. The method we have proposed represents a unique approach based on territorial analyses. The opportunity of establishing a priori the potential mechanisability of a block could aid managing decisions. Furthermore, the index could be used as an indicator for decision making in case of establishment of new vineyards. The methodology proposed was not intended to replace viticulture site suitability studies, as grapevine growing areas depend on several variables which were not considered in this study, such as climate and soil parameters. However, the future expansion of viticultural areas cannot prescind from a careful assessment of the mechanisability potential. This study provided a simple and effective tool for this assessment. The index has been developed in Italy, but, due to the parameters required for its calculation, it can be applied to any other geographical area.

Supplementary Materials

The following are available online at https://www.mdpi.com/2073-445X/9/11/469/s1, Figure S1: Tendone training system, Figure S2: Pergola training system, Table S1: Summary table of the average parameters for every region.

Author Contributions

Conceptualization, A.C. and F.M.; methodology, A.C., F.M., C.G.S. and R.D.B.; software, A.C.; validation, A.P., C.G.S., R.D.B. and M.S.; formal analysis, A.C.; data curation, A.C.; writing—original draft preparation, A.C. and A.P.; writing—review and editing, A.C., A.P., C.G.S., R.D.B., M.S., F.M.; supervision, F.M. All authors have read and agreed to the published version of the manuscript.

Funding

This research received no external funding.

Acknowledgments

The authors would like to thank Vitale Nuzzo, Department of European and Mediterranean Cultures: Architecture, Environment and Cultural Heritage (DiCEM), Università Degli Studi della Basilicata, for providing pictures of the traditional training systems.

Conflicts of Interest

The authors declare no conflict of interest.

References

  1. Kristensen, S.B.P.; Busck, A.G.; van der Sluis, T.; Gaube, V. Patterns and drivers of farm-level land use change in selected European rural landscapes. Land Use Policy 2016, 57, 786–799. [Google Scholar] [CrossRef]
  2. Cervelli, E.; di Perta, E.S.; Pindozzi, S. Identification of marginal landscapes as support for sustainable development: GIS-Based Analysis and Landscape Metrics Assessment in Southern Italy Areas. Sustainability 2020, 12, 5400. [Google Scholar] [CrossRef]
  3. Gazel, M.; Önelge, N. First report of grapevine viroids in the east Mediterranean region of Turkey. Plant Pathol. 2003, 52, 405. [Google Scholar] [CrossRef]
  4. Santillán, D.; Garrote, L.; Iglesias, A.; Sotes, V. Climate change risks and adaptation: New indicators for Mediterranean viticulture. Mitig. Adapt. Strat. Glob. Chang. 2019, 1–19. [Google Scholar] [CrossRef]
  5. Tudisca, S.; Di Trapani, A.M.; Sgroi, F.; Testa, R. The cost advantage of sicilian wine farms. Am. J. Appl. Sci. 2013, 10, 1529–1536. [Google Scholar] [CrossRef]
  6. Bates, T.; Morris, J. Mechanical cane pruning and crop adjustment decreases labor costs and maintains fruit quality in New York “concord” grape production. Horttechnology 2009, 19, 247–253. [Google Scholar] [CrossRef] [Green Version]
  7. Kurtural, S.K.; Dervishian, G.; Wample, R.L. Mechanical canopy management Reduces labor costs and maintains fruit composition in “Cabernet sauvignon” grape production. Horttechnology 2012, 22, 509–516. [Google Scholar] [CrossRef] [Green Version]
  8. Kurtural, S.K.; Beebe, A.E.; Martınez-Luscher, J.; Zhuang, S.; Lund, K.T.; McGourty, G.; Bettiga, L.J. Conversion to mechanical pruning in vineyards maintains fruit composition while reducing labor costs in ‘merlot’ grape production. Horttechnology 2019, 29, 129–139. [Google Scholar] [CrossRef]
  9. Intrieri, C.; Poni, S. Integrated Evolution of Trellis Training Grape Quality and Vintage Quality of Mechanized Italian Vineyards. Am. J. Enol. Vitic. 1995, 46, 116–127. [Google Scholar]
  10. Keller, M.; Mills, L.J.; Wample, R.L.; Spayd, S.E. Crop load management in concord grapes using different pruning techniques. Am. J. Enol. Vitic. 2004, 55, 35–50. [Google Scholar]
  11. Intrieri, C. Research and Innovations for Vineyard Mechanization in Italy. In Proceedings of the Justin R. Morris Vineyard Mechanization Symposium-Midwest Grape and Wine Conference, Osage Beach, MI, USA, 2–3 February 2008; pp. 33–52. [Google Scholar]
  12. Nowacki, T. Methodology Used by ECE Countries in Forecasting Mechanization Developments; AGRI/MECH Report No. 74; United Nations Economic Commission for Europe: Geneva, Switzerland, 1978. [Google Scholar]
  13. Singh, G. Estimation of a mechanisation index and its impact on production and economic factors—A case study in India. Biosyst. Eng. 2006, 93, 99–106. [Google Scholar] [CrossRef]
  14. Almassi, M.; Kiani, S.; Loveimi, N. Principles of Agricultural Mechanization; Hazrat Masomeh Publication: Qom, Iran, 2005. [Google Scholar]
  15. Priyadarshini, P.; Abhilash, P.C. Policy recommendations for enabling transition towards sustainable agriculture in India. Land Use Policy 2020, 96, 104718. [Google Scholar] [CrossRef]
  16. Ma, L.; Long, H.; Tu, S.; Zhang, Y.; Zheng, Y. Farmland transition in China and its policy implications. Land Use Policy 2020, 92. [Google Scholar] [CrossRef]
  17. Zangeneh, M.; Omid, M.; Akram, A. Assessment of agricultural mechanization status of potato production by means of Artificial Neural Network model. Aust. J. Crop Sci. 2010, 4, 372–377. [Google Scholar] [CrossRef]
  18. Sofia, G.; Marinello, F.; Tarolli, P. Metrics for quantifying anthropogenic impacts on geomorphology: Road networks. Earth Surf. Process. Landf. 2016, 41, 240–255. [Google Scholar] [CrossRef]
  19. Maheshwari, T.K.; Tripathi, A. Quantification of Agricultural Mechanization Status for Etawah District of Uttar Pradesh, India. Int. J. Curr. Microbiol. Appl. Sci. 2019, 8, 659–666. [Google Scholar] [CrossRef]
  20. Ostovari, Y.; Honarbakhsh, A.; Sangoony, H.; Zolfaghari, F.; Maleki, K.; Ingram, B. GIS and multi-criteria decision-making analysis assessment of land suitability for rapeseed farming in calcareous soils of semi-arid regions. Ecol. Indic. 2019, 103, 479–487. [Google Scholar] [CrossRef]
  21. Jasinski, E.; Morton, D.; DeFries, R.; Shimabukuro, Y.; Anderson, L.; Hansen, M. Physical landscape correlates of the expansion of mechanized agriculture in Mato Grosso, Brazil. Earth Interact. 2005, 9. [Google Scholar] [CrossRef] [Green Version]
  22. Alganci, U.; Kuru, G.N.; Yay Algan, I.; Sertel, E. Vineyard site suitability analysis by use of multicriteria approach applied on geo-spatial data. Geocarto Int. 2019, 34, 1286–1299. [Google Scholar] [CrossRef]
  23. Jurisic, M.; Stanisavljevic, A.; Plascak, I. Application of Geographic Information System (GIS) in the selection of vineyard sites in Croatia. Bulg. J. Agric. Sci. 2010, 16, 235–242. [Google Scholar]
  24. Stanchi, S.; Godone, D.; Belmonte, S.; Freppaz, M.; Galliani, C.; Zanini, E. Land suitability map for mountain viticulture: A case study in Aosta Valley (NW Italy). J. Maps 2013, 9, 367–372. [Google Scholar] [CrossRef] [Green Version]
  25. Yau, I.H.; Davenport, J.R.; Moyer, M.M. Developing a wine grape site evaluation decision support system for the inland Pacific Northwestern United States. Horttechnology 2014, 24, 88–98. [Google Scholar] [CrossRef] [Green Version]
  26. Bollati, A.; Molin, P.; Cifelli, F.; Petrangeli, A.B.; Parotto, M.; Mattei, M. An integrated methodology of viticultural zoning to evaluate terrains suitable for viticulture: The test area of Cesanese DOC (Latium, central Italy). J. Wine Res. 2015, 26, 1–17. [Google Scholar] [CrossRef]
  27. Cogato, A.; Pezzuolo, A.; Sozzi, M.; Marinello, F. A sample of Italian vineyards: Landscape and management parameters dataset. Data Brief 2020. [Google Scholar]
  28. Hameed, I.A.; Bochtis, D.D.; Sørensen, C.G.; Jensen, A.L.; Larsen, R. Optimized driving direction based on a three-dimensional field representation. Comput. Electron. Agric. 2013, 91, 145–153. [Google Scholar] [CrossRef]
  29. Statuto, D.; Cillis, G.; Picuno, P. Using historical maps within a GIS to analyze two centuries of rural landscape changes in southern Italy. Land 2017, 6, 65. [Google Scholar] [CrossRef] [Green Version]
  30. Hunter, A.G.M. A review of research into machine stability on slopes. Saf. Sci. 1993, 16, 325–339. [Google Scholar] [CrossRef]
  31. Morris, J.R. Development and commercialization of a complete vineyard mechanization system. Horttechnology 2007, 17, 411–420. [Google Scholar] [CrossRef] [Green Version]
  32. Chisango, F.F.T.; Dzama, T. An assessment of agricultural mechanisation index and evaluation of agricultural productivity of some fast track resettlement farms in Bindura District of Mashonaland Central Province: Zimbabwe. Int. J. Soc. Sci. Interdiscip. Res. 2013, 2, 62–82. [Google Scholar]
  33. Yisa, M.G.; Terao, H.; Noguchi, N.; Kubota, M. Stability criteria for tractor-implement operation on slopes. J. Terramech. 1998, 35, 1–19. [Google Scholar] [CrossRef]
  34. Madruga, J.; Azevedo, E.B.; Sampaio, J.F.; Fernandes, F.; Reis, F.; Pinheiro, J. Analysis and definition of potential new areas for viticulture in the azores (Portugal). Soil 2015, 1, 515–526. [Google Scholar] [CrossRef] [Green Version]
  35. Jones, G.V.; Snead, N.; Nelson, P. Modeling Viticultural Landscapes: A GIS Analysis of the Terroir Potential in the Umpqua Valley of Oregon. Geosci. Can. 2004, 31, 167–178. [Google Scholar]
  36. Spekken, M.; de Bruin, S. Optimized routing on agricultural fields by minimizing maneuvering and servicing time. Precis. Agric. 2013, 14, 224–244. [Google Scholar] [CrossRef]
  37. Pitla, S.K.; Lin, N.; Shearer, S.A.; Luck, J.D. Use of Controller Area Network (CAN) data to determine field efficiencies of agricultural machinery. Appl. Eng. Agric. 2014, 30, 829–839. [Google Scholar] [CrossRef] [Green Version]
  38. Søgaard, H.T.; Sørensen, C.G. A model for optimal selection of machinery sizes within the farm machinery system. Biosyst. Eng. 2004, 89, 13–28. [Google Scholar] [CrossRef]
  39. Oksanen, T. Shape-describing indices for agricultural field plots and their relationship to operational efficiency. Comput. Electron. Agric. 2013, 98, 252–259. [Google Scholar] [CrossRef]
  40. Lacour, S.; Burgun, C.; Perilhon, C.; Descombes, G.; Doyen, V. A model to assess tractor operational efficiency from bench test data. J. Terramech. 2004, 54, 1–18. [Google Scholar] [CrossRef]
  41. Bochtis, D.D.; Sørensen, C.G. The vehicle routing problem in field logistics part I. Biosyst. Eng. 2009, 104, 447–457. [Google Scholar] [CrossRef]
  42. Gambella, F.; Sartori, L. Comparison of mechanical and manual cane pruning operations on three varieties of grape (Cabernet Sauvignon, Merlot and Prosecco) in Italy. Trans. Asabe Am. Soc. Agric. Biol. Eng. 2014, 57, 701–707. [Google Scholar] [CrossRef]
  43. Trendafilov, K.; Delchev, N. Headland turns using the tractor’s “fifth wheel” steering device instead of front steering wheels. Bulg. J. Agric. Sci. 2018, 24, 1137–1147. [Google Scholar]
  44. Grose, D.T. Hill Slope Viability for Industrial Viticultural Development in the South Island of New Zealand. Master’s Thesis, University of Canterbury, Christchurch, New Zealand, 2013. [Google Scholar]
  45. Mazzetto, F.; Gallo, R.; Vidoni, R.; Bisaglia, C.; Calcante, A. Designing and testing a new small tractor prototype for the mechanisation of terraced-vineyard farming systems in South-Tyrol. In Proceedings of the International Conference RAGUSA SHWA 2012—“Safety Health and Welfare in Agriculture and in Agro-food Systems”, Ragusa, Italy, 3–6 September 2012; pp. 243–250. [Google Scholar]
  46. Bonsignore, R.; Romano, E.; Manetto, G.; Caruso, L.; Schillaci, G. Development of a towed multi-function row straddling machine for the cultivation of goblet vineyards. In Proceedings of the SHWA2010—Work Safety and Risk prevention in Agro-Food and Forest Systems, Ragusa, Italy, 16–18 September 2010; pp. 368–373. [Google Scholar]
  47. Intrieri, C.; Poni, S. Physiological response of winegrape to management practices for successful mechanization of quality vineyards. Acta Hortic. 2000, 526, 33–47. [Google Scholar] [CrossRef]
  48. Intrieri, C. Research and innovation for full mechanization of Italian vineyards at Bologna University. Acta Hortic. 2013, 978, 151–168. [Google Scholar] [CrossRef]
  49. Delenne, C.; Rabatel, G.; Agurto, V.; Deshayes, M. Vine Plot Detection in Aerial Images Using Fourier Analysis. In Proceedings of the 1st International Conference on Object-based Image Analysis (OBIA), Salzburg, Austria, 4–5 July 2006; pp. 1–6. [Google Scholar]
  50. Yezekyan, T.; Marinello, F.; Armentano, G.; Trestini, S.; Sartori, L. Definition of reference models for power, weight, working width, and price for seeding machines. Agriculture 2018, 8, 186. [Google Scholar] [CrossRef] [Green Version]
  51. ISTAT. 6° Censimento Generale dell’ Agricoltura: Dati Definitivi; ISTAT: Rome, Italy, 2012. [Google Scholar]
  52. Sallustio, L.; Pettenella, D.; Merlini, P.; Romano, R.; Salvati, L.; Marchetti, M.; Corona, P. Assessing the economic marginality of agricultural lands in Italy to support land use planning. Land Use Policy 2018, 76, 526–534. [Google Scholar] [CrossRef]
  53. Cattivelli, V. The motivation of urban gardens in mountain areas. The case of South Tyrol. Sustainability 2020, 12, 4304. [Google Scholar] [CrossRef]
  54. Basso, M. Land-use changes triggered by the expansion of wine-growing areas: A study on the Municipalities in the Prosecco’s production zone (Italy). Land Use Policy 2019, 83, 390–402. [Google Scholar] [CrossRef]
  55. Dalpez, A.; Zanoni, M.; Marcantoni, M.; Leveghi, M.; Bona, E.; Tonon, C.; Del Frate, M.; Zanotelli, A.; Clementel, G.; Davidovich, L.; et al. La Vitivinicoltura in Trentino Dati 2010; Camera di Commercio I.A.A. di Trento: Trento, Italy, 2011. [Google Scholar]
  56. Pascuzzi, S.; Guarella, P.; Percoco, A.; Guario, A.; Ganzelmeier, H.; Wehmann, H. Test-bench and computer-aided measurement sys-tem for checking and calibrating spraying machines used in “tendone”-trained vineyards. In Proceedings of the First European Workshop on Standardised Procedure for the Inspection of Sprayers in Europe-SPISE, Mitt Biol Bundesanst Land- Forstwirtsch, Braunschweig, Germany, 27–29 April 2004; pp. 133–142. [Google Scholar]
  57. Giorio, P.; Nuzzo, V. Leaf area, light environment, and gas exchange in Montepulciano grapevines trained to Tendone trellising system. Plant Biosyst. 2012, 146, 322–333. [Google Scholar] [CrossRef]
  58. Fraga, H.; Amraoui, M.; Malheiro, A.C.; Moutinho-Pereira, J.; Eiras-Dias, J.; Silvestre, J.; Santos, J.A. Examining the relationship between the Enhanced Vegetation Index and grapevine phenology. Eur. J. Remote Sens. 2014, 47, 753–771. [Google Scholar] [CrossRef]
  59. Townsend, C.G. Viticulture and the Role of Geomorphology: General Principles and Case Studies. Geogr. Compass 2011, 5, 750–766. [Google Scholar] [CrossRef]
  60. Jobbágy, J.; Krištof, K.; Schmidt, A.; Križan, M.; Urbanovičová, O. Evaluation of the mechanized harvest of grapes with regards to harvest losses and economical aspects. Agron. Res. 2018, 16, 426–442. [Google Scholar] [CrossRef]
  61. Barrena-González, J.; Rodrigo-Comino, J.; Gyasi-Agyei, Y.; Fernández, M.P.; Cerdà, A. Applying the RUSLE and ISUM in the Tierra de Barros Vineyards (Extremadura, Spain) to estimate soil mobilisation rates. Land 2020, 9, 93. [Google Scholar] [CrossRef] [Green Version]
Figure 1. (a) Identification of the centroids of the 3686 sample vineyards (yellow dots). (b) Political map of Italy with the vineyard land cover (shading). Source: Copernicus CORINE Land Cover (CLC) 2018 (https://land.copernicus.eu/).
Land 09 00469 g001
Figure 2. Workflow for the assessment of the level of mechanisability (l.m.).
Land 09 00469 g002
Figure 3. Correlogram of the contributing variables. Positive correlations are displayed in blue and negative correlations in red. Colour intensity is proportional to R2, while the magnitude of the circles is proportional to p-value.
Land 09 00469 g003
Figure 4. Scree plot from Principal Component Analysis (PCA).
Land 09 00469 g004
Figure 5. Principal component analysis (PCA) with loading plots related to the first (PC1) and second components (PC2).
Land 09 00469 g005
Figure 6. Classification of the level of mechanisability (l.m.) of Italian regions (a) compared to the map of the mean slope of the Country (b).
Land 09 00469 g006
Figure 7. Classification by l.m. of the top five regions.
Land 09 00469 g007
Figure 8. Kiviat diagram of the influence of the parameters considered on the mechanisability of the five top regions. The score from 85 to 100 indicates the percentage of mechanisability as a function of every contributing parameter.
Land 09 00469 g008
Figure 9. Classification by mechanical accessibility of the low-mechanisability regions.
Land 09 00469 g009
Figure 10. Kiviat diagram of the influence of the parameters considered on low-mechanisability regions. The score from 40 to 100 indicates the percentage of mechanisability as a function of every contributing parameter.
Land 09 00469 g010
Figure 11. Correlation plots between the level of mechanisability (l.m.) and the area under vines for all regions (a) and selected regions (b), wine production expressed in volume for all regions (c) and selected regions (d), wine production expressed in value for all regions (e) and selected regions (f). Selected regions correspond to the ones identified in Figure 3 and Figure 5. The R2 and the equation are shown for each dataset. The representation is logarithmic.
Land 09 00469 g011
Table 1. Categorization by mechanical accessibility of the slopes in Italian vineyards.
Slope (°)Class Ranking (%)
0–5100
5–1080
10–1560
>1540
Table 2. Categorisation by time efficiency of the length-width ratio in Italian vineyards.
Length-Width RatioClass Ranking (%)
<0.890
0.8–2.0100
>2.0110
Table 3. Categorisation by operating space of the width of the headland in Italian vineyards.
Headland Size (m)Class Ranking (%)
<2.040
2.0–3.080
3.0–4.590
>4.5100
Table 4. Categorisation by mechanical accessibility of the training systems in Italian vineyards.
Training SystemClass Ranking (%)
Vertical System100
Alberello70
Horizontal system40
Table 5. Categorisation by mechanical accessibility of the row spacing width in Italian vineyards.
Row Spacing (m)Class Ranking (%)
<1.410
1.4–1.740
1.7–2.090
>2.0100
Table 6. Synopsis of the contribution of the single parameters on the mechanisability potential of vineyards.
Mechanisability Potential
ParameterHighMediumLowVery low
Slope (%)0–1010–2020–30>30
Block ShapeRegularNot regular
Length/Width ratio0.8–2.0<0.8
Headland size (m)>4.53.0–4.52.0–3.0<2.0
Training systemVertical system AlberelloHorizontal system
Row spacing (m)>2.01.7–2.0 <1.7
Publisher’s Note: MDPI stays neutral with regard to jurisdictional claims in published maps and institutional affiliations.

