Abstract
There is a growing interest for scientists and society to acquire deep knowledge on the impacts from environmental disasters. The present work deals with the investigation of vegetation dynamics in the Chernobyl area, a place widely known for the devastating nuclear disaster on the 26th of April 1986. To unveil any possible long-term radiation effects on vegetation phenology, the remotely sensed normalized difference vegetation index (NDVI) from the Moderate Resolution Imaging Spectroradiometer (MODIS) was analyzed within the 30 km Exclusion Zone, where all human activities were ceased at that time and public access and inhabitation have been prohibited ever since. The analysis comprised applications of seasonal trend analysis using two techniques, i.e., pixel-wise NDVI time series and spatially averaged NDVI time series. Both techniques were applied in each one of the individual land cover types. To assess the existence of abnormal vegetation dynamics, the same analyses were conducted in two broader zones, i.e., from 30 to 60 km and from 60 to 90 km, away from Chernobyl area, where human activities were not substantially altered. Results of both analyses indicated that vegetation dynamics in the 30 km Exclusion Zone correspond to increasing plant productivity at a rate considerably higher than that of the other two examined zones. The outcome of the analyses presented herein attributes greening trends in the 30 km and the 30 to 60 km zones to a combination of climate, minimized human impact and a consequent prevalence of land cover types which seem to be well adapted to increased radioactivity. The vegetation greening trends observed in the third zone, i.e., the 90 km zone, are indicative of the combination of climate and increasing human activities. Results indicate the positive impact from the absence of human activities on vegetation dynamics as far as vegetation productivity and phenology are concerned in the 30 km Exclusion Zone, and to a lower extent in the 60 km zone. Furthermore, there is evidence that land cover changes evolve into the prevalence of woody vegetation in an area with increased levels of radioactivity.
1. Introduction
Human casualties and associated increases in human mortality rate from natural and human-induced disasters have been extensively studied [1,2]. Nuclear disasters, in particular, have resulted in lasting impacts on human populations in the areas surrounding the disaster sites [3]. Those impacts are related to the acute radioactivity dose over a relatively short period, usually a few months, transforming into chronic exposure to decreasing levels of radioactivity, which are, however, lower than the lethal dose [4]. Furthermore, during the 35-year period since the nuclear accident in Chernobyl, numerous research articles have been published, aiming to highlight impacts from such an unprecedented event on humans as well as on plant and animal species. Results indicated the severity of impacts to people exposed to acute radioactivity immediately after the accident, whereas there is still no indisputable conclusion on the chronic effects of the exposure to lower radioactivity doses on life [4,5].
Several studies conducted within a decade of the accident found considerably higher mutation rates in both mice and human populations [6,7]. However, later studies contradict these earlier findings, showing inconclusive results on the long-term effects of such catastrophic events on biota [3,8]. Scientists that initially concluded on devastating effects on many organisms have gradually changed their position and acknowledge the lack of sound scientific data that could support reliable results for science and society [4]. Recently, researchers have demonstrated that the Chernobyl ecosystem supports a highly diverse and efficient vertebrate scavenging community, which is an indicator of abundant wildlife populations [9]. Surprisingly, recent research has documented thriving wildlife in exclusion zones, such as those associated with the Chernobyl and Fukushima nuclear disasters, and it is shown that rewilding of affected ecosystems can happen which is attributed, to a major extent, to the absence of humans after disastrous events [10,11,12,13]. Concerning plant species, there are considerably less works published mainly demonstrating the effects of chronic low-dose exposure in places like Chernobyl, affected by a serious radioactive accident, which can destabilize the genetic structure of plants [14]. An interesting finding is that plants seem to have developed a stress response and a defense strategy that prevents genome instability, which allows them to survive in extreme environments, like those contaminated by nuclear accidents [15].
While all previously mentioned works focus on field experiments and collection of in situ data, either for human or animal and plant impact studies, there is a great potential of remotely sensed information to contribute to an environmental impact assessment. Currently, there are numerous studies being published on environmental monitoring and impact assessment using mainly satellite derived remotely sensed data. Environmental remotely sensed information has been available to scientists for almost fifty years, e.g., the Landsat missions, or the Terra and Aqua satellites from the NASA’s Earth Observing System Data and Information System (EOSDIS), among many others. It is, however, only after the advances of IT and especially the evolution of the internet, when scientists achieved easy access to a long enough time series of environmental data at a global scale, that scientists have been able to perform regional and global assessments concerning climate change [16,17,18,19], hydrology [20,21,22,23,24], vegetation productivity and changes [25,26,27,28,29]. The aim of the present work is to identify whether vegetation productivity has been affected by the catastrophic failure of Chernobyl Power Plant on the 26th of April 1986, i.e., exactly 34 years before the present work. Vegetation productivity was assessed using MODIS remotely sensed normalized difference vegetation index (NDVI) data from 2000 to 2020, in three distinct zones in the Chernobyl Power Plant area, i.e., the 30 km Exclusion Zone and two surrounding zones, i.e., the 30 to 60 km zone (hereafter 60 km zone) and the 60 to 90 km zone (hereafter 90 km zone). The magnitude and direction of vegetation productivity (increasing or decreasing trends) were computed applying seasonal trend analysis at the pixel level and with spatially averaged time series of NDVI values, in various land cover types in each one of the three zones. Results were evaluated considering also the dominant land cover changes that took place in each zone.
Concerning Chernobyl’s vegetation monitoring and assessment, an interesting work is presented by [30], where vegetation conditions in the Chernobyl Exclusion Zone are studied before and after the accident using Landsat observations, and it concluded that NDVI showed to be independent from the radiation values measured and that the increase in NDVI values long after the accident is attributed mostly to land abandonment. Analogous conclusions also using Landsat data were reported in [31]. The present work, however, is considerably different from those two publications, since it focuses on comparison of vegetation productivity trends in Chernobyl’s Exclusion Zone compared to two surrounding zones where human activities were not interrupted after the accident. It also analyzes the NDVI time series of those three zones making use of the MODIS NDVI and land cover products. It does not aim to determine pre- and post-accident vegetation conditions such as the works of [30,31].
2. Materials and Methods
2.1. Study Area Description
The Chernobyl area is located in the north part of Ukraine, bordering Belarus. The region is a rural area, covered mostly by woodlands and marshlands. Major urban centers used to be the cities of Chernobyl and Pripyat which have been uninhabited for the last 35 years. Chernobyl is widely known for the nuclear accident that occurred on 26 April 1986. The disaster resulted in the evacuation of 116,000 individuals from the area. The wildlife that remained in the abandoned area was further affected by exposure to very high doses of radioactivity immediately following the accident. Studies related to the long-term effects of radiation on mammal abundance in the Chernobyl area did not support evidence of a negative influence of radiation [10], whereas the need for further research on the ecological consequences of radiation on specific vertebrate and invertebrate species is highlighted in relevant studies [3]. Many of the people who evacuated the Chernobyl area moved to a new city, 50 km east of Chernobyl, namely Slavutych. The Chernobyl accident released radioactive isotopes into the atmosphere, polluting a major portion of land in Europe [3]. Immediately after the accident, a 30 km radius area around Chernobyl Nuclear Power Plant was established by the Soviet Union, known as the Chernobyl Exclusion Zone (Figure 1). The study area is the bounding region of approximately 32,000 km2 of the Chernobyl Power Plant. It comprises the 30 km Exclusion Zone, and two additional bounding zones, i.e., the 60 km zone, formed as a region covering the area from 30 to 60 km around the Chernobyl site, and the 90 km zone covering the area from 60 to 90 km from Chernobyl (Figure 1). Land cover types based on the MODIS 2018 MCD12Q1 product [32] (MODIS/Terra+Aqua Land Cover Type Yearly L3 Global 500 m SIN Grid V006 DOI: 10.5067/MODIS/MCD12Q1.006) in the three examined zones can be seen in Figure 2. Land cover classes are defined according to the International Geosphere-Biosphere Program (IGBP) classification scheme. Table 1 provides information on the area occupied by the individual land cover types in each zone. Vegetation dynamics were determined in all three individual zones in the different land cover types and the results for the 30 km Exclusion Zone (abandoned area where no human activities take place) were compared against the 60 and 90 km zones (zones where human activities did not cease).
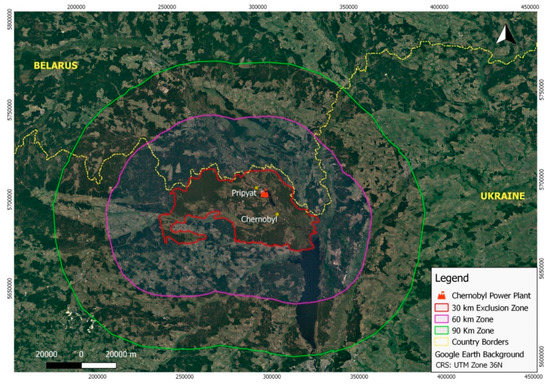
Figure 1.
Location map of the Chernobyl Power Plant area and the three examined zones.
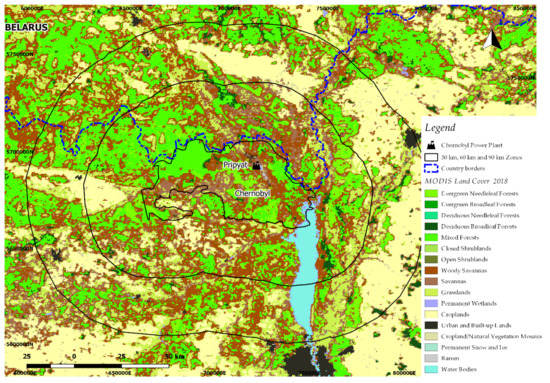
Figure 2.
Land cover types based on the Moderate Resolution Imaging Spectroradiometer (MODIS) 2018 MCD12Q1 product. Coordinates are in Universal Transverse Mercator (UTM) Zone 35N.

Table 1.
Areas occupied by various land cover types in the three examined zones based on the Moderate Resolution Imaging Spectroradiometer (MODIS) 2018 land cover product.
2.2. NDVI and Land Cover Change Analyses
NDVI is a non-dimensional index calculated from the remotely sensed reflectance measurements in the spectral regions of red (visible) and near-infrared and is a measure of the vegetation greenness but also health and productivity. It ranges from −1 to 1 [33]. Negative or very low positive NDVI values (<0.05) correspond to barren land, desert, snow or presence of water bodies. Moderate and high positive NDVI values correspond to various types of vegetation. The higher NDVI values correspond to locations where the more photosynthetically active vegetation is present, with NDVI > 0.6 typically highlighting areas of dense forests or tropical rainforests [34,35]. Various ecosystem changes have been studied at local and global scales such as plant growth [34], greening and browning patterns in specific areas [36,37,38], seasonal vegetation productivity [39], detecting and predicting vegetation anomalies [40], assessment of human impact on vegetation [41], monitoring of forest conditions [42], drought monitoring [43] and changes in length of growing seasons [44]. Known limitations of the satellite-derived NDVI are cloud cover, presence of very steep topographic features, presence of snow or ice and adverse atmospheric conditions [25].
Various satellite-derived NDVI products are today available. Among them, the NDVI from the Global Inventory Monitoring and Modeling System (GIMMS) project (“National Center for Atmospheric Research Staff (Eds). Last modified 14 Mar 2018. ‘The Climate Data Guide: NDVI: Normalized Difference Vegetation Index-3rd generation: NASA/GFSC GIMMS.’ Retrieved from https://climatedataguide.ucar.edu/climate-data/ndvi-nor”) has been widely used due to its long temporal coverage of approximately 30 years. GIMMS NDVI is produced from the Advanced Very High Resolution Radiometer (AVHRR) and provides high-quality NDVI data at a 2-weekly temporal and 8 km spatial resolution [45]. High-quality NDVI products are also released from the Earth Observing System (EOS) Terra and Aqua platforms carrying the MODIS instrument. MODIS NDVI products have been released at 16-day time steps at a spatial resolution from 1 km to 250 m from 2000 until today. MODIS NDVI products have been widely used and tested in numerous areas all over the world and are nowadays considered as a “state-of-the-art” standard dataset [46,47]. The high spatial resolution, the long coverage period and the extended validation over a wide range of representative conditions place MODIS NDVI products among the best NDVI datasets.
In the present work, the NDVI was retrieved from Collection 6 of MOD13Q1 [48], a product generated every 16 days at 250 m spatial resolution. Each MODIS NDVI product is released with pixel-level metadata in binary encoding [49], i.e., the VI quality layer, describing the quality, usefulness, atmospheric conditions, presence of clouds, snow or ice and presence of shadow or other conditions that constitute questionable pixel quality. In this work, the VI quality layer was used to filter pixels that were covered with clouds, snow or ice or whose quality was reported as low due to atmospheric conditions. More specifically, as the filtering procedure is conducted using the 16-bit flags provided in the VI quality layers of the MOD13Q1 product, information from the quality assurance bits/fields in the VI quality assessment science datasets table (Table 5 from [48]) was used. Regarding Bits 0–1 of the VI quality layer, those describing pixels produced, but most probably cloudy, or pixels not produced due to other reasons than clouds were excluded. Regarding Bits 2–5, only the highest-quality pixels remained, while for Bits 6–7, pixels with high aerosol quantities were excluded. For Bit 8, only pixels with no adjacent cloud detected were kept, while for Bit 9, all values were accepted. For Bit 10, only pixels with no mixed clouds were kept, while for Bits 11–13, only pixels describing moderate or continental ocean and deep ocean were excluded (not present in the study area anyway). Bit 14 describes the possible presence of snow/ice, therefore pixels with value of 1 (possible snow/ice) were excluded. For Bit 15, only pixels with a value of 0 were kept, i.e., possible shadows not present. The period of the NDVI data analyzed in this work spanned from 5 March 2000 to 18 February 2020.
Land cover changes in the three examined zones were assessed using the MODIS MCD12Q1 land cover product [50], and the dominant changes in all three zones were highlighted. MCD12Q1 comprises 5 legacy classification schemes, among which the IGBP classification provides the most categories, classifying Earth’s surface into 17 land cover types (Table 1). MCD12Q1 is provided globally at an annual time step from 2001 to 2018, with 500 m spatial resolution. The latest collection, i.e., Collection 6 of the MCD12Q1, was used in the present work.
2.3. Data Analysis
To determine the direction and magnitude of statistically significant vegetation trends, pixel-wise harmonic regression incorporating trend and seasonality was implemented, which is analogous to Fourier analysis and is known as seasonal trend analysis, which can also handle unequally spaced data in time [39,43,45,51]:
In Equation (1), t is time and is the frequency of the NDVI time series (i.e., in the present case of 16-day temporal resolution = 23), are amplitudes and are the phases (i.e., seasons), is the intercept of the NDVI series and is the trend (slope). Phase values range from 0° to 359°, with 30° representing a shift of approximately 30 days, i.e., one month. In the present case, three harmonic terms were employed and therefore This is found to robustly describe variations of the MODIS NDVI time series [43]. As normality of the NDVI time series is a requirement for applying Equation (1), a Box–Cox transformation [52] was applied in those time series where normal distribution was not evidenced.
The significance of the trend is estimated from a t-test with a rejection of the null hypothesis of zero trend being reported at a significance level of 5% (p-value < 0.05). Only pixels that did not experience land cover change during the period of analysis were used in the computational process. To avoid any bias in computed means due to different sample sizes in the three zones, equal areas (equivalent to the zone with the least areas with significant trends in the pixel-wise analysis) in each land cover type were selected randomly and their spatial means of NDVI trends in each land cover zone were evaluated.
Only a small portion of pixels in examined areas demonstrates statistically significant trends [38], especially in areas of high altitude or high latitude where snow cover is frequent. To overcome this problem, the spatial means of NDVI values were extracted for each date in each individual land cover category, excluding pixels that have undergone land cover change during the analysis period. Equal numbers of pixels in each land cover category were selected randomly in each one of the three examined zones, with total area in each land cover category being the smallest area among the three examined zones (lowest value from each line of Table 1). Thus, for each land cover category, a time series of spatial means of the NDVI was computed and analyzed using Equation (1) in each one of the three examined zones.
Input data were continuous MODIS NDVI images, at a 16-day time step for the period 2000 to 2020, i.e., the complete time series of MODIS NDVI products, after applying a filter based on the 250 m 16-day VI quality layer, to exclude problematic pixels as described in Section 2.2. It is true that the year 2000 is 14 years after the Chernobyl disaster happened, so the analysis presented herein does not represent the conditions immediately after the accident, which is beyond the scope of the present work. The methodology could have been applied blending multisource NDVI data, e.g., the GIMMS NDVI dataset, or the NDVI from Landsat satellites. However, the different products offer different spatial resolution and time coverage, and although data blending techniques have been developed [53], they all introduce errors to some extent. Therefore, in the present work, for keeping data consistency, one data source was used, even though it cannot capture the full progress of the phenomenon. However, the goal is to detect differences in vegetation dynamics and observe whether vegetation has recovered in the same manner in the 30 km Exclusion Zone and the two surrounding zones, i.e., the 60 and 90 km zones. This can be safely accomplished using the 20-year dataset of MODIS NDVI products.
All computations were conducted with the R open software for statistical computing (“The R Project for Statistical Computing. https://www.r-project.org/”). Spatial analysis was performed with the Raster R package [54].
3. Results
3.1. Land Cover Change Analysis
Analysis of all 18 annual land cover type images revealed that approximately 20% of the 30 km Exclusion Zone changed land cover type. Dominant land cover changes are identified in Savannas (tree cover 10–30%, canopy >2 m) with an increase of approximately 5%, followed by Mixed Forests with an increase of approximately 2.5%, Woody Savannas (tree cover 30–60%, canopy >2 m) with an increase of ~1.5% and Evergreen Needleleaf Forests with an increase of approximately 1%. A considerable decrease in Grasslands losing ~10% of the area is observed, whereas the rest of the land cover changes are related to <1% of this specific zone (Figure 3). It seems thus that land abandonment in this zone has led to an expansion of dense and sparse forest areas at the expense of grassland areas.
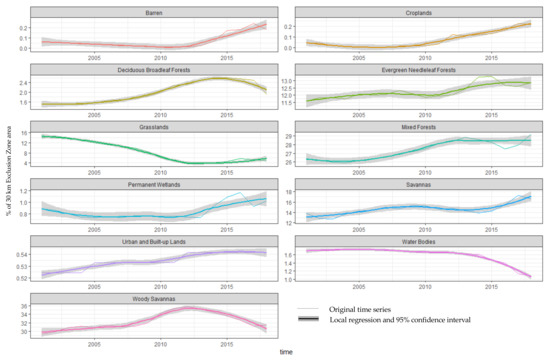
Figure 3.
Land cover type changes in the 30 km Exclusion Zone.
Concerning the 60 km zone, Figure 4 depicts the transitions that happened during the eighteen-year period, i.e., 2001 to 2018. According to the land cover change analysis conducted, the 60 km zone experienced a transformation of 12.7% of its land. Croplands demonstrated a steady increase in their area throughout the analysis period and gained areas of ~3% of the 60 km zone. Woody Savannas and Mixed Forests both increased up to 2013 and declined thereafter, resulting in net increases of ~1% and 0.7%, respectively. Grasslands demonstrated a decrease up to 2012 and an increase thereafter, gaining thus almost all previously transformed land. Savannas and Evergreen Needleleaf Forests lost around 3% and 0.75% of their areas, respectively, in the 60 km zone.
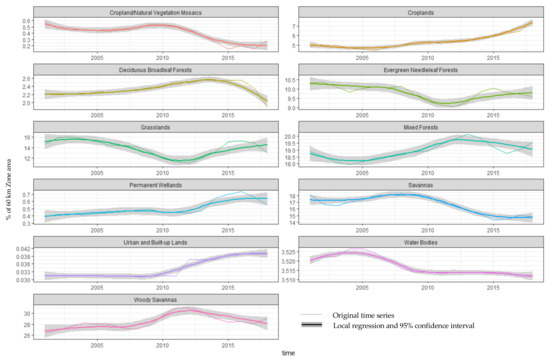
Figure 4.
Land cover type changes in the 60 km zone.
Land cover transitions in the 90 km zone are shown in Figure 5. Overall, 10.6% of this specific zone has changed land cover type. A common feature compared to the 60 km zone is the steady increase in Croplands, which gained ~4% of the 90 km zone. On the contrary, Savannas demonstrated a decrease of ~2%, whereas Woody Savannas experienced net gains of ~0.7%. Grasslands lost ~1%, whereas Mixed Forests demonstrated almost zero net changes. All other land cover types showed minor land transitions.
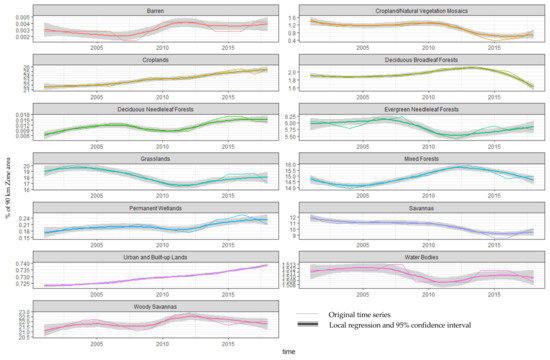
Figure 5.
Land cover type changes in the 90 km zone.
3.2. Pixel-Wise NDVI Time Series Analysis
Pixel-wise vegetation trend analysis in the three distinct zones provided statistically significant results at the level of 5% (p-values < 0.05) for an area of 6556 km2, approximately 20% out of the total 32,000 km2 of the study area. This is expected, as remotely sensed NDVI acquisitions are restricted by factors such as cloud cover or atmospheric conditions [45]. As the study area is in a high-latitude region, cloud and snow cover days are frequent, resulting in loss of data and consequently areas where statistically significant trends in vegetation (either increasing or decreasing) can be detected are considerably decreased compared to mid- and low-latitude regions. Table 2 provides means of the statistically significant NDVI trends in different land cover categories in the three distinct zones, but also mean NDVI trends that are randomly selected from equal areas in each examined zone in various land cover types. Only land cover types common to all three zones are included in Table 2. Water Bodies and Permanent Wetlands were excluded from this analysis.
Table 2.
Mean of the statistically significant (p < 0.05) pixel-wise Normalized Difference Vegetation Index (NDVI) trends from 2000 to 2020 in different land cover types in the three examined zones and the associated areas.
The weighted average (using equal areas of each land cover type as the weighting factor) of NDVI trends over the 30 km Exclusion Zone is 6.38 × 10⁻³yr−1, in the 60 km zone it is 4.11 × 10⁻³yr−1 and in the 90 km zone it is 2.61 × 10⁻³yr−1.
All three zones demonstrate both increasing and decreasing vegetation dynamics. In the 30 km Exclusion Zone, approximately 45% of the area showed statistically significant trends, whereas this percentage drops to approximately 27.5% in the 60 km zone and reaches the lowest value in the 90 km zone, with 11.2% of area demonstrating significant pixel-wise NDVI trends.
3.3. Time Series Analysis with Spatial Aggregates of NDVI
To estimate the regression line for each zone but also to highlight changes in seasonality in each land cover category in the three examined zones, the spatially averaged NDVI time series were extracted for different land cover types as described in Section 2.3. The observed and modeled, using Equation (1), time series are presented in Figure 6, Figure 7, Figure 8, Figure 9, Figure 10, Figure 11, Figure 12 and Figure 13, together with the trend lines and a 95% confidence interval. Trends were considered significant at the level of 5% (p values < 0.05), rejecting the null hypothesis of zero slope of the trend line. Table 3 shows the slopes of the trend lines in each land cover type and the associated examined areas.
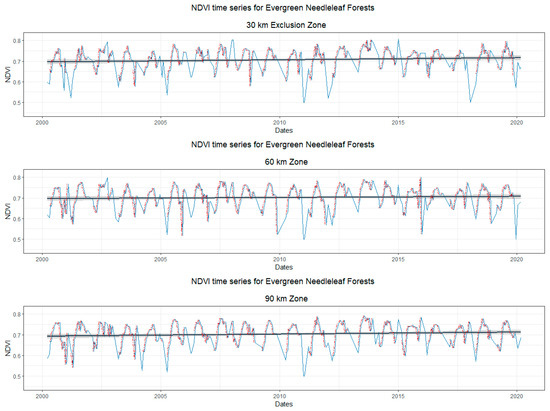
Figure 6.
Spatially averaged Normalized Difference Vegetation Index (NDVI) time series in Evergreen Needleleaf Forests. The red dotted line corresponds to observed values, the blue line is for modeled time series and the black line is the linear trend, whereas grey zones correspond to a 95% confidence interval.
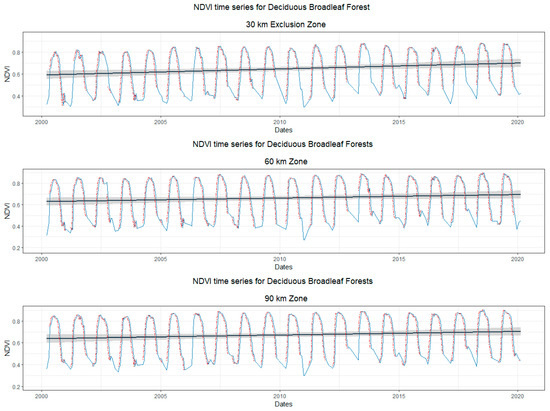
Figure 7.
Spatially averaged NDVI time series in Deciduous Broadleaf Forests. The red dotted line corresponds to observed values, the blue line is for modeled time series and the black line is the linear trend, whereas grey zones correspond to a 95% confidence interval.
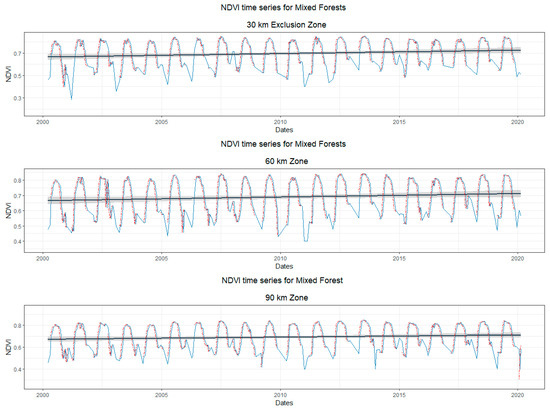
Figure 8.
Spatially averaged NDVI time series in Mixed Forests. The red dotted line corresponds to observed values, the blue line is for modeled time series and the black line is the linear trend, whereas grey zones correspond to a 95% confidence interval.
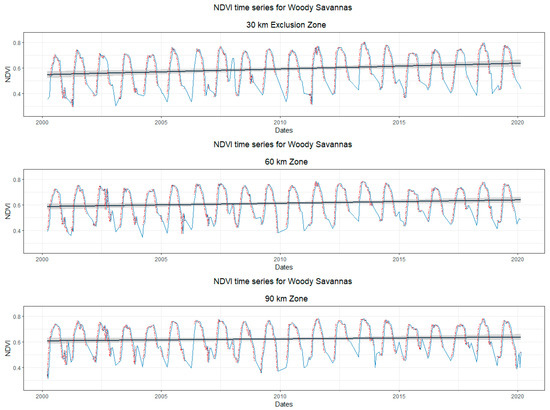
Figure 9.
Spatially averaged NDVI time series in Woody Savannas. The red dotted line corresponds to observed values, the blue line is for modeled time series and the black line is the linear trend, whereas grey zones correspond to a 95% confidence interval.
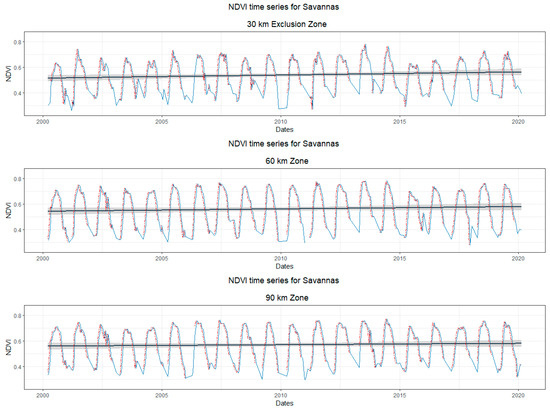
Figure 10.
Spatially averaged NDVI time series in Savannas. The red dotted line corresponds to observed values, the blue line is for modeled time series and the black line is the linear trend, whereas grey zones correspond to a 95% confidence interval.
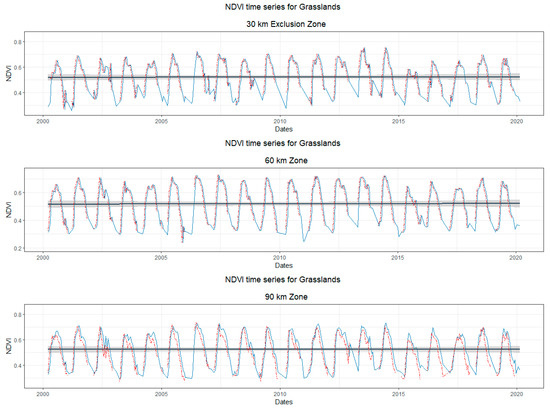
Figure 11.
Spatially averaged NDVI time series in Grasslands. The red dotted line corresponds to observed values, the blue line is for modeled time series and the black line is the linear trend, whereas grey zones correspond to a 95% confidence interval.
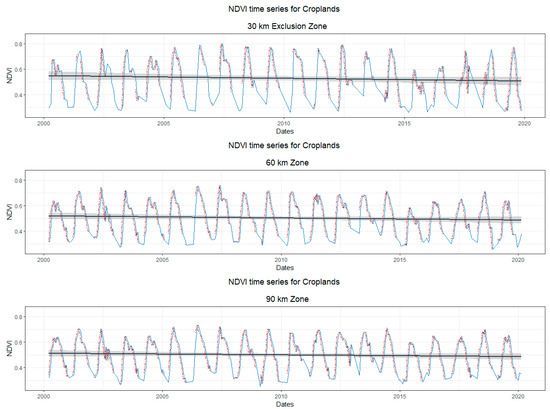
Figure 12.
Spatially averaged NDVI time series in Croplands. The red dotted line corresponds to observed values, the blue line is for modeled time series and the black line is the linear trend, whereas grey zones correspond to a 95% confidence interval.
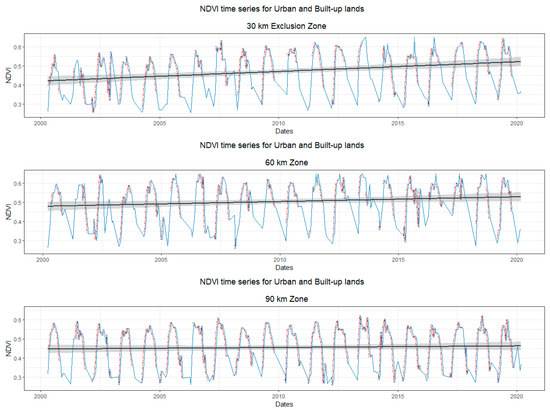
Figure 13.
Spatially averaged NDVI time series in Urban and Built-up Lands. The red dotted line corresponds to observed values, the blue line is for modeled time series and the black line is the linear trend, whereas grey zones correspond to a 95% confidence interval.
Table 3.
Slope of the trend lines of the time series (2000–2020) of spatial averages of the NDVI in different land cover types in three examined zones.
Averages of trend line slopes of Table 3 weighted based on areas of each land cover type in each examined zone were evaluated and found to be 5.77 × 10⁻³ yr−1 for the 30 km Exclusion Zone, 1.64 × 10⁻³ yr−1 for the 60 km zone and 1.10 × 10⁻³yr−1 in the 90 km zone. Concerning seasonality, all land cover types demonstrated analogous seasonal patterns of the NDVI in the three examined zones in all land cover types.
4. Discussion
Comparing values of the NDVI time series trends estimated with the two approaches outlined above, i.e., the pixel-wise approach and the spatially averaged NDVI, in the different land cover types of the 30, 60 and 90 km zones around Chernobyl, similar results concerning the 30 km Exclusion Zone are extracted, whereas lower values of NDVI trends were estimated using the spatial averaging technique for the other two zones. Considering that the spatially averaged NDVI time series over the three examined zones make use of more NDVI data over the extent of the study area, whereas results of the pixel-wise technique are only based on pixels with statistically significant trends, which were found to amount to ~20% of the study area, it is believed that the assessments using the spatially averaged NDVI are closer to reality. It is worth mentioning here that although the Urban and Built-up Lands did not demonstrate statistically significant trends in any of the three zones examined at the pixel level (Table 2), they provided NDVI greening trends with the spatially averaging technique, however at slightly higher p-values (Table 3). Both approaches, however, documented a clear difference of the NDVI trends in the 30 km Exclusion Zone compared to the other two zones examined.
In both approaches, the land cover type with the highest greening trends in the 30 km Exclusion Zone is the Woody Savannas, followed by Deciduous Broadleaf Forests. Deciduous Broadleaf Forests demonstrate the highest greening trend in the 60 km zone, followed by Mixed Forests and Woody Savannas in both approaches. In the 90 km zone, the highest greening pattern is observed in Deciduous Broadleaf Forests in both approaches, followed by Woody Savannas and Mixed Forests in the pixel-wise analysis, whereas Mixed Forests showed slightly higher greening trends than Woody Savannas during the spatially averaged NDVI time series approach. Browning vegetation patterns were detected in Grasslands and Croplands, with the spatially averaged NDVI time series approach, however those results were based on very limited areas as indicated in the results presented in Table 2 and Table 3. From Table 1, Table 2 and Table 3, it can be seen that Woody Savannas is the land cover type occupying the greatest part of the 30 and 60 km zones and is the second largest part in the 90 km zone, after Croplands (land cover type with the largest area in the 90 km zone).
Combining analysis of NDVI time series in various land cover types with the results from the evolution of land cover changes in the three zones, one may conclude that the land cover categories covering most of the area in the 30 km Exclusion Zone, i.e., Woody Savannas and Mixed Forests, both gain areas, expanding at the expense of Grasslands decline, and they also demonstrate substantial greening trends. The same situation can be observed for the 60 km zone, where Woody Savannas and Mixed Forests are the dominant land cover types, both expanding and demonstrating increasing NDVI trends.
Croplands, Woody Savannas, Mixed Forests and Grasslands are the dominant land cover types in the 90 km zone, with Croplands expanding steadily during the study period, Mixed Forests and Woody Savannas maintaining their areas and Grasslands losing areas. Grasslands and Croplands in the 90 km zone express browning vegetation trends, which might be related to human activities in the area and seem to reduce the overall increasing vegetation productivity in that zone.
In all three examined zones, the overall NDVI trend seems to be controlled by the land cover categories that gained area. For the 30 km Exclusion Zone, the expansion of Woody Savannas and Mixed Forests might be attributed to absence of human activities, as afforestation is a fate of abandoned agricultural areas with the savanna-type vegetation being an intermediate stage of this process. Prevalence of woody vegetation types may also indicate their resilience to increased radiation levels. In the 60 km zone, human activities were not totally halted but remained at a low level as indicated by the low coverage of Urban and Built-up Lands and Cropland areas. The fact that the same two land cover categories expand also in the 60 km zone supports the conclusion that the greening trends in both the 30 and 60 km zones can be attributed to a combination of climate, minimized human impact and prevalence of land cover types resilient to increased radioactivity. The third zone, i.e., the 90 km zone, is indicative of the combination of climate and increasing human activities, with Croplands but also Urban and Built-up Lands expanding. This area could be considered as indicative of the vegetation conditions that would have been present in the 30 km Exclusion Zone if the nuclear accident had not happened. Although the present work documents land cover changes in the 30 and 60 km zones around Chernobyl corresponding to a transition to woody vegetation, it cannot provide evidence or document changes in species composition and dominance over the study period, and this an interesting topic for further research.
Previous studies on NDVI trends revealed a mean global greening trend of 0.46 × 10⁻³ per year from 1982 to 2012 [55], which is close to the ones found with the spatially averaged NDVI time series in the present work for the 60 km zone and the 90 km zone. The 30 km Exclusion Zone demonstrates a considerably higher vegetation greening pattern. The temperate continental zones where the study area belongs are reported [55] to range from 2.08 × 10⁻³ per year during 1982–1994, followed by a browning period with annual NDVI trends of −0.39 × 10⁻³ during 1995–2004 and a greening period with an annual NDVI trend of 1.352 × 10⁻³ from 2005 to 2012. It should be noted, however, that the study of [56] was conducted using the GIMMS NDVI dataset which has a slightly coarser spatial resolution and covers a different period compared to the MODIS NDVI products. Another analogous work is that of [57], focusing, however, on trends of the maximum annual NDVI in North West Siberia from 2000 to 2014, using the same MODIS product (MOD13Q1) used herein as well. That work concluded on various annual NDVImax trends in different biomes of North West Siberia, with approximately 70% of the Tundra and 82% of the Forest Tundra regions demonstrating NDVImax changes from 3 × 10⁻³ to 6 × 10⁻³. In the Northern and Middle Taiga, most areas demonstrate a mixed character of annual NDVImax trends, ranging from −3 × 10⁻³ to 3 × 10⁻³. Analogous results indicating increasing plant growth in high latitudes were reported in earlier studies [34] and were associated with a lengthening of the active growing season. In any case, the results presented herein indicate that vegetation in the affected area of Chernobyl demonstrates a surprising productivity and an expansion of woody land cover types, i.e., Woody Savannas, and Forest, as a result of land abandonment, which seem to be resilient to radioactivity. Therefore, results of both approaches presented herein did not indicate any abnormal behavior of vegetation productivity as far as its phenological properties are concerned.
This study can be considered as complementary to previous works that focused on various animal and plant species [4,5,9,10,15], highlighting the impacts from the nuclear accident many years after. A general outcome is the surprising resilience of plants and animals to chronic exposure to radiation. The results of the present study are in agreement with the findings of [30,31], that both showed an increase in NDVI values long after the accident, while they highlighted that humanity still has not yet reached a full understanding of the consequences of the Chernobyl nuclear accident. An explanation of the remarkable resilience of plants comes from [58], explaining the various mechanisms of plants to replace dead cells or tissues easier than animals, irrespective of the source of damage, i.e., due to attack by an animal or due to radiation. Rewilding has also been demonstrated in both Chernobyl and Fukushima Exclusion Zones and is, in both cases, related to the absence of human activities in those areas [10,12], highlighting the dominant role of human activities on the environment. However, radiation does harm life and may shorten the lives of individual plants and animals. Nevertheless, if harm is not fatal and resources that support life are plentiful, then life will flourish again [58], and this argument is supported by the findings of the present work as well.
5. Conclusions
The present work deals with the determination of vegetation dynamics over three zones around the Chernobyl area, i.e., the 30 km Exclusion Zone, the 60 km zone and the 90 km zone, almost 35 years after the nuclear disaster caused by the failure of one reactor of the Chernobyl Power Plant. Remotely sensed MODIS NDVI data for a twenty-year period (2000 to 2020) at a 16-day temporal and 250 m spatial resolution were analyzed using pixel-wise and spatially averaged NDVI seasonal trend analysis. Both techniques were applied in the individual land cover types of the three zones. Results of both analyses indicated greening vegetation trends in all three zones, with the 30 km Exclusion Zone demonstrating considerably higher greening vegetation dynamics, which can be attributed to a combination of climate, the absence of human activities and the consequent expansion of woody land cover types, which seem to be resilient to radioactivity. The results presented herein agree with previous works demonstrating the rewilding of the Chernobyl Exclusion Zone a few decades after the accident, indicating a surprising resilience of plants and animals to chronic exposure to radiation. Further, the primary role of human presence and associated activities on ecosystem dynamics is highlighted.
Data Availability
MOD13Q1 data are available at no cost from the following url: https://e4ftl01.cr.usgs.gov/MOLT/MOD13Q1.006/. DOI: 10.5067/MODIS/MOD13Q1.006. MODIS land cover data MCD12Q1 are available at https://e4ftl01.cr.usgs.gov/MOTA/MCD12Q1.006/. DOI: 10.5067/MODIS/MCD12Q1.006.
Funding
This research was funded by THE TECHNICAL CHAMBER OF GREECE, through the project “Coupled use of remotely sensed and in situ observations for assessment of environmental changes” grant number 82430-Democritus University of Thrace
Acknowledgments
The author would like to thank the anonymous reviewers for their time and effort to review and improve this work
Conflicts of Interest
The author declares no conflict of interest.
References
- Zakharov, S.; Rulisek, J.; Hlusicka, J.; Kotikova, K.; Navratil, T.; Komarc, M.; Vaneckova, M.; Seidl, Z.; Diblik, P.; Bydzovsky, J.; et al. The impact of co-morbidities on a 6-year survival after methanol mass poisoning outbreak: Possible role of metabolic formaldehyde. Clin. Toxicol. 2020, 58, 241–253. [Google Scholar] [CrossRef] [PubMed]
- Moscona, J.C.; Peters, M.N.; Maini, R.; Katigbak, P.; Deere, B.; Gonzales, H.; Westley, C.; Baydoun, H.; Yadav, K.; Ters, P.; et al. The Incidence, Risk Factors, and Chronobiology of Acute Myocardial Infarction Ten Years After Hurricane Katrina. Disaster Med. Public Health Prep. 2019, 13, 217–222. [Google Scholar] [CrossRef] [PubMed]
- Møller, A.P.; Mousseau, T.A. Biological consequences of Chernobyl: 20 years on. Trends Ecol. Evol. 2006, 21, 200–207. [Google Scholar] [CrossRef] [PubMed]
- Baker, R.J.; Wickliffe, J.K. Wildlife and Chernobyl: The scientific evidence for minimal impacts. Bull. At. Sci. 2011, 14. [Google Scholar]
- Chesser, R.; Baker, R. Growing up with Chernobyl: Working in a radioactive zone, two scientists learn tough lessons about politics, bias and the challenges of doing good science. Am. Sci. 2006, 94, 542–549. [Google Scholar] [CrossRef]
- Dubrova, Y.E.; Plumb, M.; Brown, J.; Jeffreys, A.J. Radiation-induced germline instability at minisatellite loci. Int. J. Radiat. Biol. 1998, 74, 689–696. [Google Scholar] [CrossRef] [PubMed]
- Dubrova, Y.E.; Nesterovf, V.N.; Krouchinskyg, N.G.; Neumahnt, R.; Neilf, L. Human minisatellite mutation rate after the Ghernobyl accident. Nature 1986, 380, 683–686. [Google Scholar] [CrossRef] [PubMed]
- Møller, A.P.; Mousseau, T.A. Are Organisms Adapting to Ionizing Radiation at Chernobyl? Trends Ecol. Evol. 2016, 31, 281–289. [Google Scholar] [CrossRef]
- Schlichting, P.E.; Love, C.N.; Webster, S.C.; Beasley, J.C. Efficiency and composition of vertebrate scavengers at the land-water interface in the Chernobyl Exclusion Zone. Food Webs 2019, 18, e00107. [Google Scholar] [CrossRef]
- Deryabina, T.G.; Kuchmel, S.V.; Nagorskaya, L.L.; Hinton, T.G.; Beasley, J.C.; Lerebours, A.; Smith, J.T. Long-term census data reveal abundant wildlife populations at Chernobyl. Curr. Biol. 2015, 25, R824–R826. [Google Scholar] [CrossRef] [PubMed]
- Hostert, P.; Kuemmerle, T.; Prishchepov, A.; Sieber, A.; Lambin, E.F.; Radeloff, V.C. Rapid land use change after socio-economic disturbances: The collapse of the Soviet Union versus Chernobyl. Environ. Res. Lett. 2011, 6, 045201. [Google Scholar] [CrossRef]
- Lyons, P.C.; Okuda, K.; Hamilton, M.T.; Hinton, T.G.; Beasley, J.C. Rewilding of Fukushima’s human evacuation zone. Front. Ecol. Environ. 2020, 18, 127–134. [Google Scholar] [CrossRef]
- Perino, A.; Pereira, H.M.; Navarro, L.M.; Fernández, N.; Bullock, J.M.; Ceauşu, S.; Cortés-Avizanda, A.; Van Klink, R.; Kuemmerle, T.; Lomba, A.; et al. Rewilding complex ecosystems. Science 2019, 364, 6438. [Google Scholar] [CrossRef]
- Geraskin, S.A.; Dikarev, V.G.; Zyablitskaya, Y.Y.; Oudalova, A.A.; Spirin, Y.V.; Alexakhin, R.M. Genetic consequences of radioactive contamination by the Chernobyl fallout to agricultural crops. J. Environ. Radioact. 2003, 66, 155–169. [Google Scholar] [CrossRef]
- Kovalchuk, O.; Burke, P.; Arkhipov, A.; Kuchma, N.; James, S.J.; Kovalchuk, I.; Pogribny, I. Genome hypermethylation in Pinus silvestris of Chernobyl—A mechanism for radiation adaptation? Mutat. Res. Fundam. Mol. Mech. Mutagen. 2003, 529, 13–20. [Google Scholar] [CrossRef]
- Eleftheriou, D.; Kiachidis, K.; Kalmintzis, G.; Kalea, A.; Bantasis, C.; Koumadoraki, P.; Spathara, M.E.; Tsolaki, A.; Tzampazidou, M.I.; Gemitzi, A. Determination of annual and seasonal daytime and nighttime trends of MODIS LST over Greece—climate change implications. Sci. Total Environ. 2018, 616–617, 937–947. [Google Scholar] [CrossRef]
- Li, H.; Meier, F.; Lee, X.; Chakraborty, T.; Liu, J.; Schaap, M.; Sodoudi, S. Interaction between urban heat island and urban pollution island during summer in Berlin. Sci. Total Environ. 2018, 636, 818–828. [Google Scholar] [CrossRef]
- Mao, K.B.; Ma, Y.; Tan, X.L.; Shen, X.Y.; Liu, G.; Li, Z.L.; Chen, J.M.; Xia, L. Global surface temperature change analysis based on MODIS data in recent twelve years. Adv. Space Res. 2017, 59, 503–512. [Google Scholar] [CrossRef]
- Shen, S.; Leptoukh, G.G. Estimation of surface air temperature over central and eastern Eurasia from MODIS land surface temperature. Environ. Res. Lett. 2011, 6, 045206. [Google Scholar] [CrossRef]
- Gemitzi, A.; Ajami, H.; Richnow, H.H. Developing empirical monthly groundwater recharge equations based on modeling and remote sensing data—Modeling future groundwater recharge to predict potential climate change impacts. J. Hydrol. 2017, 546, 1–13. [Google Scholar] [CrossRef]
- Gemitzi, A.; Lakshmi, V. Estimating Groundwater Abstractions at the Aquifer Scale Using GRACE Observations. Geosciences 2018, 8, 419. [Google Scholar] [CrossRef]
- Pellet, V.; Aires, F.; Munier, S.; Prieto, D.F.; Jordá, G.; Dorigo, W.A.; Polcher, J.; Brocca, L. Integrating multiple satellite observations into a coherent dataset to monitor the full water cycle—Application to the Mediterranean region. Hydrol. Earth Syst. Sci. 2019, 23, 465–491. [Google Scholar] [CrossRef]
- Sun, A.Y. Predicting groundwater level changes using GRACE data. Water Resour. Res. 2013, 49, 5900–5912. [Google Scholar] [CrossRef]
- Gemitzi, A.; Lakshmi, V. Evaluating Renewable Groundwater Stress with GRACE Data in Greece. Groundwater 2018, 56, 501–514. [Google Scholar] [CrossRef] [PubMed]
- Banti, M.Α.; Kiachidis, K.; Gemitzi, A. Estimation of spatio-temporal vegetation trends in different land use environments across Greece use environments across Greece. J. Land Use Sci. 2019, 14, 21–36. [Google Scholar] [CrossRef]
- Zhang, W.; Brandt, M.; Penuelas, J.; Guichard, F.; Tong, X.; Tian, F.; Fensholt, R. Ecosystem structural changes controlled by altered rainfall climatology in tropical savannas. Nat. Commun. 2019, 10, 1–7. [Google Scholar] [CrossRef]
- Cong, N.; Wang, T.; Nan, H.; Ma, Y.; Wang, X.; Myneni, R.B.; Piao, S. Changes in satellite-derived spring vegetation green-up date and its linkage to climate in China from 1982 to 2010: A multimethod analysis. Glob. Chang. Biol. 2013, 19, 881–891. [Google Scholar] [CrossRef]
- Rembold, F.; Atzberger, C.; Savin, I.; Rojas, O. Using Low Resolution Satellite Imagery for Yield Prediction. Remote Sens. 2013, 5, 1704–1733. [Google Scholar] [CrossRef]
- Tong, X.; Brandt, M.; Yue, Y.; Ciais, P.; Rudbeck Jepsen, M.; Penuelas, J.; Wigneron, J.P.; Xiao, X.; Song, X.P.; Horion, S.; et al. Forest management in southern China generates short term extensive carbon sequestration. Nat. Commun. 2020, 11, 1–10. [Google Scholar] [CrossRef]
- Santos, P.P.; Sillero, N.; Boratyński, Z.; Teodoro, A.C. Landscape changes at Chernobyl. In In SPIE Remote Sensing, Proceedings of the Volume 11149, Remote Sensing for Agriculture, Ecosystems, and Hydrology XXI, Strasbourg, France, 21 October 2019; International Society for Optics and Photonies: Bellihghom, WA, USA, 2019. [Google Scholar] [CrossRef]
- Modzelewska, A.; Jarocinska, A.M.; Pochrybniak, P.; Mostowsk, M. The vegetation condition changes near Chernobyl based on Landsat TM. In Towards Horizon 2020; Lasaponara, R., Masini, N., Biscione, M., Eds.; EARSeL: Warsaw, Poland, 2013. [Google Scholar]
- Sulla-Menashe, D.; Friedl, M. MCD12Q1 MODIS/Terra+Aqua Land Cover Type Yearly L3 Global 500m SIN Grid V006 2019, DistriZbuted by NASA EOSDIS Land Processes DAAC. Available online: https://doi.org/10.5067/MODIS/MCD12Q1.006 (accessed on 29 July 2020).
- Rouse, J.W.; Haas, R.H.; Schell, J.A.; Deering, D.W. Monitoring vegetation systems in the Great Plains with ERTS. In Third Earth Resources Technology Satellite–1 Symposium; Freden, S.C., Mercanti, E.P., Becker, M., Eds.; Volume I: Technical Presentations, NASA SP−351; National Aeronautics and Space Agency: Greentbelt, MD, USA, 1974; pp. 309–317. [Google Scholar]
- Myneni, R.B.; Keelingt, C.D.; Tucker, C.J.; Asrar, G. Increased plant growth in the northern high latitudes from 1981 to 1991. Nature 1997, 386, 698–702. [Google Scholar] [CrossRef]
- Myneni, R.B.; Hall, F.G.; Sellers, P.J.; Marshak, A.L. The Interpretation of Spectral Vegetation Indexes. IEEE Trans. Geosci. Remote Sens. 1995, 33, 481–486. [Google Scholar] [CrossRef]
- Ma, X.; Huete, A.; Yu, Q.; Coupe, N.R.; Davies, K.; Broich, M.; Ratana, P.; Beringer, J.; Hutley, L.B.; Cleverly, J.; et al. Spatial patterns and temporal dynamics in savanna vegetation phenology across the north australian tropical transect. Remote Sens. Environ. 2013, 139, 97–115. [Google Scholar] [CrossRef]
- Mishra, N.B.; Crews, K.A.; Neeti, N.; Meyer, T.; Young, K.R. MODIS derived vegetation greenness trends in African Savanna: Deconstructing and localizing the role of changing moisture availability, fire regime and anthropogenic impact. Remote Sens. Environ. 2015, 169, 192–204. [Google Scholar] [CrossRef]
- Mishra, N.B.; Mainali, K.P. Greening and browning of the Himalaya: Spatial patterns and the role of climatic change and human drivers. Sci. Total Environ. 2017. [Google Scholar] [CrossRef]
- Mishra, N.B.; Chaudhuri, G. Spatio-temporal analysis of trends in seasonal vegetation productivity across Uttarakhand, Indian Himalayas, 2000–2014. Appl. Geogr. 2015, 56, 29–41. [Google Scholar] [CrossRef]
- Asoka, A.; Mishra, V. Prediction of vegetation anomalies to improve food security and water management in India. Geophys. Res. Lett. 2015, 42, 5290–5298. [Google Scholar] [CrossRef]
- Levin, N. Human factors explain the majority of MODIS-derived trends in vegetation cover in Israel: A densely populated country in the eastern Mediterranean. Reg. Environ. Chang. 2016, 16, 1197–1211. [Google Scholar] [CrossRef]
- Maselli, F. Monitoring forest conditions in a protected Mediterranean coastal area by the analysis of multiyear NDVI data. Remote Sens. Environ. 2004, 89, 423–433. [Google Scholar] [CrossRef]
- Verbesselt, J.; Herold, M. Near Real-Time Disturbance Detection Using Satellite Image Time Series: Drought Detection in Somalia. Remote Sens. Environ. 2012, 123, 98–108. [Google Scholar] [CrossRef]
- Xu, G.; Zhang, H.; Chen, B.; Zhang, H.; Innes, J.L.; Wang, G.; Yan, J.; Zheng, Y.; Zhu, Z.; Myneni, R.B. Changes in vegetation growth dynamics and relations with climate over China’s landmass from 1982 to 2011. Remote Sens. 2014, 6, 3263–3283. [Google Scholar] [CrossRef]
- Forkel, M.; Carvalhais, N.; Verbesselt, J.; Mahecha, M.D.; Neigh, C.S.R.; Reichstein, M. Trend Change detection in NDVI time series: Effects of inter-annual variability and methodology. Remote Sens. 2013, 5, 2113–2144. [Google Scholar] [CrossRef]
- Huete, A.; Didan, K.; Miura, H.; Rodriguez, E.P.; Gao, X.; Ferreira, L.F. Overview of the radiometric and biopyhsical performance of the MODIS vegetation indices. Remote Sens. Environ. 2002, 83, 195–213. [Google Scholar] [CrossRef]
- Kern, A.; Marjanović, H.; Barcza, Z. Evaluation of the quality of NDVI3g dataset against collection 6 MODIS NDVI in Central Europe between 2000 and 2013. Remote Sens. 2016, 8, 955. [Google Scholar] [CrossRef]
- Didan, K. MOD13Q1 MODIS/Terra Vegetation Indices 16-Day L3 Global 250m SIN Grid V006; Distributed by NASA EOSDIS Land Processes DAAC; NASA: Sioux Falls, SD, USA, 2015. [Google Scholar] [CrossRef]
- Didan, K.; Munoz, A.B.; Huete, A. MODIS Vegetation Index User ’s Guide; MOD13 Series; The University of Arizona: Tucson, AZ, USA, 2015. [Google Scholar]
- Strahler, A.; Gopal, S.; Lambin, E.; Moody, A. MODIS Land Cover Product Algorithm Theoretical Basis Document (ATBD) MODIS Land Cover and Land-Cover Change; Boston University: Boston, MA, USA, 1999. [Google Scholar]
- Eastman, J.R.; Sangermano, F.; Ghimire, B.; Zhu, H.; Chen, H.; Neeti, N.; Cai, Y.; Machado, E.A.; Crema, S.C. Seasonal trend analysis of image time series. Int. J. Remote Sens. 2009, 30, 2721–2726. [Google Scholar] [CrossRef]
- Box, G.E.P.; Cox, D.R. An Analysis of Transformations Revisited, Rebutted. J. Am. Stat. Assoc. 1982, 77, 209–210. [Google Scholar] [CrossRef]
- Rao, Y.; Zhu, X.; Chen, J.; Wang, J. An improved method for producing high spatial-resolution NDVI time series datasets with multi-temporal MODIS NDVI data and Landsat TM/ETM+ images. Remote Sens. 2015, 7, 7865–7891. [Google Scholar] [CrossRef]
- Hijmans, R.J. Introduction to the ‘Raster’ Package (version 2.3-24). R-CRAN Proj. 2017, 1–27. [Google Scholar]
- Liu, Y.; Li, Y.; Li, S.; Motesharrei, S. Spatial and temporal patterns of global NDVI trends: Correlations with climate and human factors. Remote Sens. 2015, 7, 13233–13250. [Google Scholar] [CrossRef]
- Liu, S.; Roehrig, G.; Bhattacharya, D.; Varma, K. In-service Teachers’ Attitudes, Knowledge and Classroom Teaching of Global Climate Change. Sci. Educ. 2015, 24, 12–22. [Google Scholar]
- Esau, I.; Miles, V.V.; Davy, R.; Miles, M.W.; Kurchatova, A. Trends in normalized difference vegetation index (NDVI) associated with urban development in northern West Siberia. Atmos. Chem. Phys. 2016, 16, 9563–9577. [Google Scholar] [CrossRef]
- Thompson, S. Why plants don’t die from cancer. Conversation 2019. Available online: https://www.westminster.ac.uk/news/the-conversation-why-plants-dont-die-from-cancer (accessed on 10 June 2020).


Publisher’s Note: MDPI stays neutral with regard to jurisdictional claims in published maps and institutional affiliations. |
© 2020 by the author. Licensee MDPI, Basel, Switzerland. This article is an open access article distributed under the terms and conditions of the Creative Commons Attribution (CC BY) license (http://creativecommons.org/licenses/by/4.0/).