Article

An Analysis of Spatio-Temporal Urbanization Patterns in Northwest China

1
School of Environmental and Municipal Engineering, Xi’an University of Architecture and Technology, Xi’an 710055, China
2
Department of Geography and Environmental Sustainability, The University of Oklahoma, Norman, OK 73019, USA
*
Author to whom correspondence should be addressed.
Land 2020, 9(11), 411; https://doi.org/10.3390/land9110411
Submission received: 6 September 2020 / Revised: 12 October 2020 / Accepted: 19 October 2020 / Published: 27 October 2020

Abstract

:
Chinese metropolitan areas have been experiencing urbanization over the past decades, impacting biodiversity, carbon emissions, urban heat islands, and food security. Yet, systematic research on spatio-temporal urbanization patterns and drivers along the urban–rural gradient is rarely reported for northwest China. Here, we use land-use data from 1980 to 2015 to explore land-use change, urbanization intensity, and drivers in northwest China. Our results display direct and indirect effects of urban expansion on farmland loss, but also spatio-temporal heterogeneity in the urbanization patterns. While the earlier years were dominated by infill and land conversion close to city centers, the later years displayed sprawling urbanization following the constraints of terrain and administrative boundaries at the cost of farmland. Our regression analysis of spatial variables found a strong relationship with urban planning factors. The spatial analysis of urbanization patterns revealed indirect land-use change on former farmland. Furthermore, we found that regional geography and historic sites considerably influenced land conversion. Overall, our findings indicate the need for sustainable planning strategies that synthesize approaches to farmland and historic site protection and consideration of regionally specific landscape characteristics.

1. Introduction

Over the past decades, cities in developing countries and especially in China have experienced rapid urbanization [1]. Projections indicate a continuation of this trend with global urban expansion increasing from 0.653 million km2 in 2000 up to 1.21 million km2 in 2030 [2]. Furthermore, the World Bank projects that about 90% of the global increase in urban population between 2015 and 2050 is likely to take place in Asia and Africa, and specifically in China, India, and Nigeria [3]. According to the projections of the Chinese National Population Development Plan (2016–2030) issued by the State Council in 2016, China’s urbanization level has reached 56% with a total population of 1.37 billion and is projected to reach an urbanization level of 70% with a total population of 1.45 billion in 2030. These numbers show the increasing importance of understanding the spatio-temporal dynamics driving urbanization in general and especially in China—a hotspot of urbanization.
One of the characteristics of urbanization—urban expansion—has been receiving considerable attention from different disciplines, such as geography and urban planning (e.g., [4,5,6]). Recent studies on urban expansion in China explore topics such as spatial patterns of urban expansion [7,8], intensity of rural land consumption [9], urban expansion rates [10], processes driving expansion [4,11,12], and impact assessments of urban expansion [13,14]. Urban expansion also affects ecosystem services and human well-being; urban expansion is likely to have detrimental effects on biodiversity [2], degrade water quality [15], lead to displacement of farmlands [16,17], create urban heat islands [15], and even change the regional climate [18]. In China, the high urbanization rates resulted in a large loss of cultivated land, which led to significant concerns regarding food security [19]. With the per capita area of cultivated land below the world average [20], China is already facing the challenges of food security. A continuation of the rapid urbanization patterns would further aggravate the shortage of farmland in China, of which two-thirds have been converted into rural built-up areas since 2000 [21].
Xi’an, the largest city in northwestern China, is surrounded by agricultural land and has been experiencing rapid urbanization that resulted in significant cropland loss since the 1980s [22,23]. The tension between urban expansion and farmland protection has been intensified by socio-economic development of the region and the resulting immigration, especially since the establishment of development zones by national and local governments [24,25]. Frequently, studies use landscape metrics to identify the spatial patterns of urban expansion [4,14,26] and/or urbanization intensity indices to analyze the rates of urbanization [27]. A multitude of studies exist that focus on urban expansion patterns and the underlying driving forces in the southeastern cities in China (e.g., [4,11,28]). However, studies for northwest China or Xi’an (e.g., [23,24,25]) analyze spatial patterns and/or drivers of urbanization, but do not evaluate the urbanization intensity, which is a crucial factor to support the development of sustainable future urbanization policies and planning approaches.
In this study, we present a data-driven approach to analyzing the spatial and temporal trajectories and determinants of urbanization in northwest China. We analyze land-use change in Xi’an’s 13 districts as proxy for the larger region of northwest China, given Xi’an’s status as a core strategical location in the Guanzhong plain agglomeration. We use land conversion to urban built-up area as the primary indicator for analyzing spatial drivers of urbanization and for exploring spatio-temporal urbanization patterns along the urban–rural gradient for the period 1980 to 2015. It is important to emphasize that we focus our analysis on the proximate spatial drivers of urbanization and not on the underlying causes. Our findings show that the general trends in northwest China are in line with patterns observed on the national and global scale, yet unique regional and local factors are identified that need to be considered for developing regional planning approaches.

2. Materials and Methods
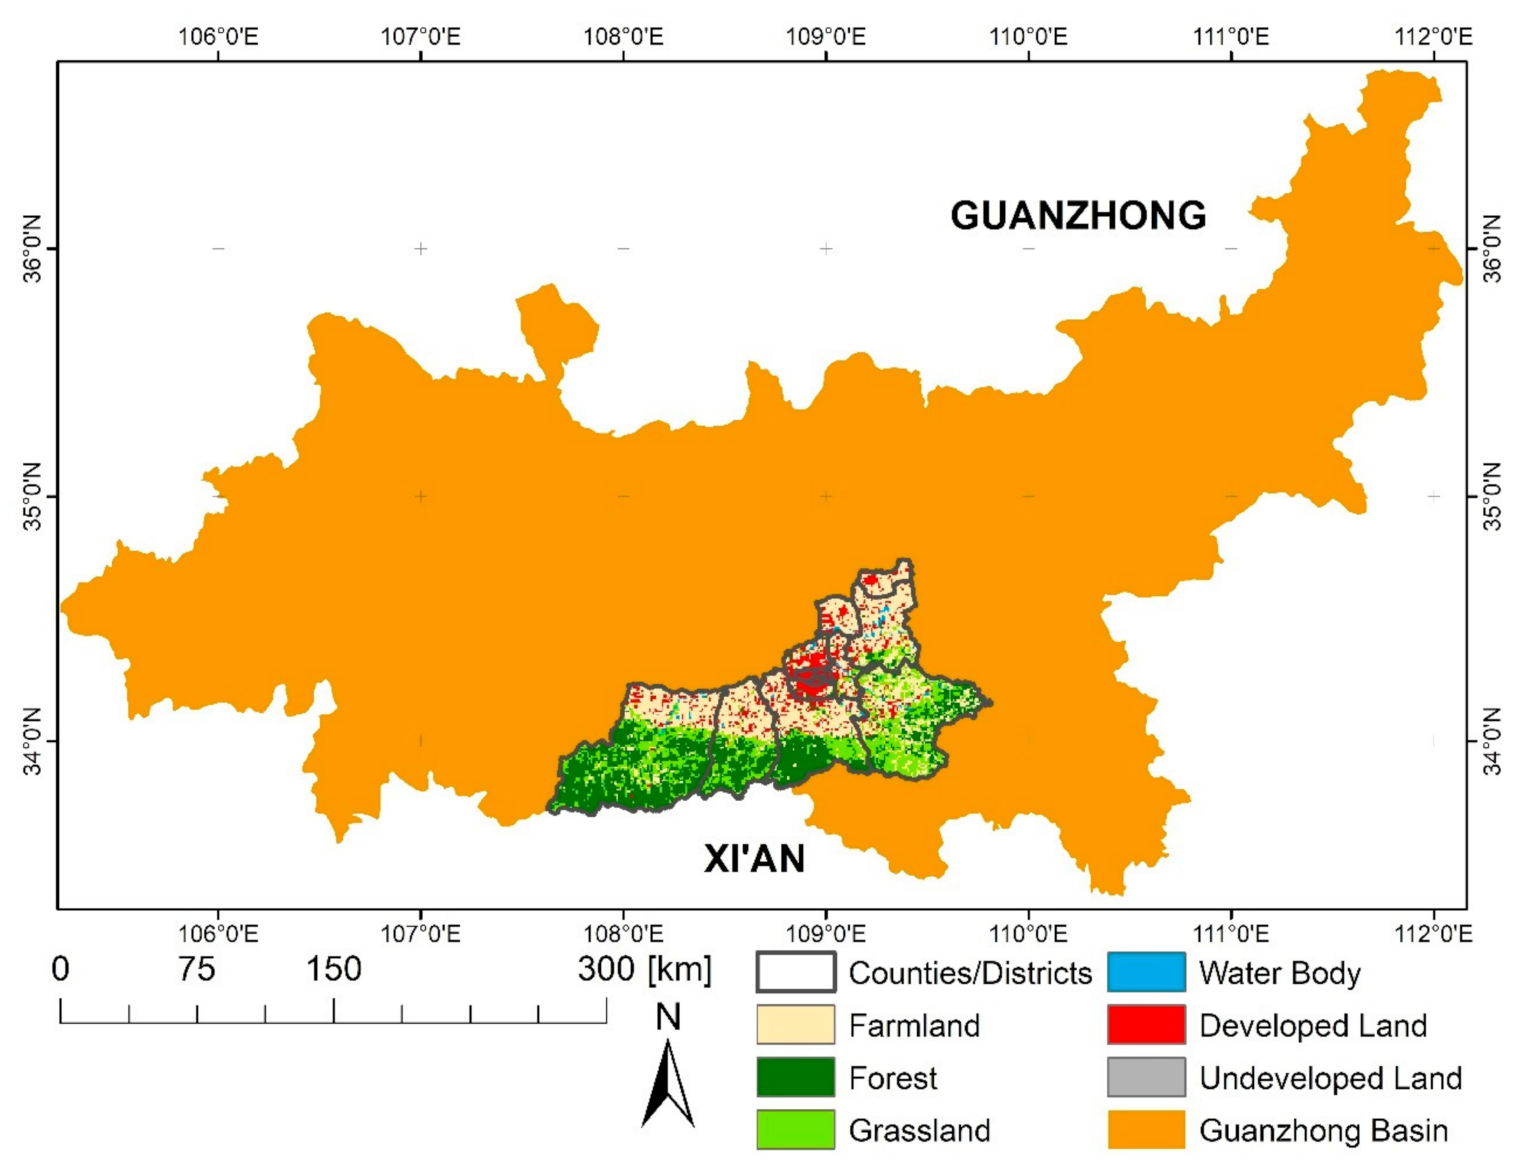
2.1. Study Area

Our study area covers the city of Xi’an, as shown in Figure 1. Xi’an, the largest city in northwest China, is the capital of Shaanxi Province, P.R. China and one of the birthplaces of Chinese civilization and its nation. Formerly called Chang’an, it has been an imperial capital since the Western Zhou Dynasty and other 12 Dynasties in ancient times, hence comprising many historical sites (e.g., the Terracotta Army). With an area of 10,108 km2, it covers six urban districts, five suburban districts, and two rural counties. It is located between the northern latitudes 33°39′ and 34°45′ and the eastern longitudes 107°40′ and 109°49′, with Weinan in the east, Shangluo, Ankang, and Hanzhong in the south, Baoji in the west, and Weihe in the north. Xi’an has been listed as the ninth National Central City due to its core strategical location in the Guanzhong plain agglomeration [29].
The central and northern parts of Xi’an are in alluvial plains with an elevation of about 400 m. The southern parts of the city spread over low fault block mountains with an elevation of about 1000 m and the northern parts of the Qinling Mountains with an elevation from 1500 to 3500 m. In the Qinling Mountains, forests, grassland, and unused land are the dominant land cover categories, accounting for 55% of the total land area of the city, as shown in Figure 1. In the northern plains, farmland, developed areas, and heritage sites protection land are the main land cover categories, accounting for 45% of the total land area of the city. Due to the geography of the surrounding areas, urbanization in and around Xi’an occurs mainly in the northern plains. The many historical and cultural sites in the study area are categorized as protected areas and are excluded from development activities.
Since the onset of the Chinese economic reform (also referred to as the Opening of China), and especially since 1990, Xi’an’s economy has been developing rapidly, and the per capita GDP steadily increased from CNY 623 in 1980 to CNY 66,938 in 2015. As an inland city, Xi’an’s industry has traditionally been dominated by agriculture. However, with an increase in GDP and a booming industrial economic sector, the percentage of the population occupied in the non-agricultural sector rose from 40% in 1995 to 67% in 2015, reaching 5.45 million in 2015. According to projections for the Xi’an region, this trend is likely to continue, with the non-agricultural part of the population expected to reach more than 70% in 2030 [30], making Xi’an the fastest urbanizing city in the Shaanxi Province.

2.2. Datasets and Processing

In this study, we combined geographic information systems methods, spatial pattern analysis, and logistic regression to evaluate urban expansion and spatial indicators for Xi’an over a 35-year period (1980–2015). For this purpose, we used several spatial datasets:
  • Land Use/Cover Data: We used seven land use/cover datasets covering the years 1980, 1990, 1995, 2000, 2005, 2010, and 2015. The datasets were provided by the West Data Center [31] and include six categories (farmland, forest, grassland, waterbody, developed land, and undeveloped land) and 25 subclasses. We focused our analysis on the farmland category and the two subclasses urban built-up area and rural built-up area, with urban built-up area referring to residential land area in a city and rural built-up area referring to residential land area in the countryside. While many land use/cover datasets are available, we chose this dataset because of its excellent spatial and temporal resolution and consistency across time steps.
  • Administrative Boundaries: We derived the boundaries for Xi’an with its 13 districts and counties from the digital version of the Chinese Administrative Zoning Map, obtained from the Data Application Environment of the Chinese Academy of Sciences [32].
  • Road Network, Conservation Areas, and Development Zones: We derived spatial data on road networks and boundaries of protected areas and development zones from the Xi’an City Planning and Design Institute [33].
  • Population Numbers and GDP: We extracted spatial data on population numbers (1995–2015) and GDP (1980–2015) on the county/district level from the Xi’an Statistical Yearbooks [34] spanning the period from 1980 to 2015.
To process the data for our urbanization analysis, we applied five processing steps: (1) for spatial alignment, we resampled all spatial datasets, as shown in Table 1, to the resolution of 30 × 30 m; (2) we used ESRI’s ArcMAP software to extract and tabulate urban built-up area, rural built-up area, and farmland for the different time steps (1980, 1990, 1995, 2000, 2005, 2010, and 2015); (3) we used ESRI’s ArcMAP software to perform sectoring, intersecting, and buffering of land urbanization intensity (see Section 2.3) for each time step and each spatial unit (county/district, buffer zones); (4) we used GRASS GIS version 7.4 to randomly sample 1500 grid cells across the study area; (5) we used the randomly sampled grid cells and R version 3.5 with the lme4 package to conduct a multilevel logistic regression analysis of land urbanization and spatial variables, as shown in Table 1, to identify the spatial variables associated with urbanization in Xi’an.

2.3. Urbanization Intensity

We calculated the land urbanization intensity index (LUII; [4,9]) to quantify the spatial structure of and heterogeneity in urban land conversion from rural built-up area and farmland, respectively. The LUII index quantifies the spatial extent and rate (measured in % per year) of urban land conversion from other land use/cover categories for various spatial units. The LUII is defined as
LUII = Δ U i n T A i × 1 n × 100 %
where Δ U i n is the area of new built-up land at the expense of farmland or rural built-up area in the spatial unit (district/county or buffer zone) i at the time interval n, and TAi is the total area of spatial unit i. We selected different spatial units to calculate the LUII; we calculated the LUII for the administrative districts defined on the county level and for circular areas along the urban–rural gradient (i.e., buffer zones; see Figure 2).

2.4. Logistic Regression Analysis

Logistic regression is a statistical analysis technique that has been used in many fields, including urban growth modeling [35,36]. It is an efficient way to systematically evaluate the statistical relationship between urban expansion patterns and spatial variables and has been used to identify the influence of multiple independent variables on spatial patterns of urban development [37]. Through the interpretation of the spatial relationship between a dependent variable and multiple independent variables, it is possible to identify the spatial indicators of change [38].
We used the multilevel logistic regression method with Laplace approximation, as implemented in the R lme4 package [39], to analyze and quantify the relationship between urban expansion and a set of explanatory spatial variables. Specifically, we analyzed the relationship between a binary response variable (change to urban built-up area between 2005 and 2015 versus no change, still categorized as rural land (including rural built-up area and farmland)) and a selection of spatial independent variables for the period 2005 to 2015, as shown in Table 1. We limited the regression analysis to the period 2005 to 2015, since our analysis displayed different urbanization patterns across different periods. Limiting the regression analysis to a recent period allowed us to test the association of urbanization and potential drivers in the recent policy context. We categorized the variables as environmental, socioeconomic, infrastructural, and planning and policy variables. Furthermore, we conducted range standardization of the explanatory variables as described in [40]. We then randomly sampled the study area and generated a binary, urban–rural response variable using this stratified/random sample of 1500 grid cells distributed across the 13 districts/counties within the Xi’an city boundary. The sample consists of n = 750 transitioning cells and n = 750 cells of farmland, rural built-up area, water bodies, and other areas excluded from urbanization. We then calculated the logistic regression as described in [40,41]. The probability p that a non-urbanized cell i becomes urbanized is defined as
p r p i = 1 = e y i 1 + e y i
where yi is a function of environmental, socioeconomic, infrastructure, and planning and policy factors described as
y i = α j i + h = 1 n β j i h   x h i
where for a non-urbanized cell i and varying across j districts/counties, α is the intercept, β is the regression coefficient, h is a predictor variable representing conditions in the year 2005, n is the number of predictor variables, and x is the value of a predictor variable h at a rural cell i. This is a strictly increasing function, and probability p will increase with value y. Regression coefficients β imply the contribution of each independent variable on probability value p. A positive coefficient means that the explanatory variable will help to increase the probability of the dependent variable from 0 to 1, and vice versa. The value of α describes the effect of existing urbanization on change, with closer development having a stronger impact as controlled by α. In this analysis, we referred to district/county as the level indicator in the multilevel model to reflect spatial heterogeneity across jurisdictional boundaries [42]. We selected a set of uncorrelated spatial determinants and significance (p < 0.05) from the list of Table 1 using forward and backward stepwise regression techniques.

3. Results

Since 1980, Xi’an has experienced considerable urban expansion, as shown in Figure 3a. Here, we present the results of analyzing the spatio-temporal patterns of urbanization organized into four categories: (1) overall land-use change, (2) intensity of urbanization, (3) spatial heterogeneity along the urban–rural gradient, and (4) drivers of urbanization.

3.1. Land-Use Change

According to the Xi’an Municipal Urban Planning and Management Bureau and the Xi’an Municipal Urban Planning and Design Institute, Xi’an’s total area comprises 13 districts/counties and a total area of 10,108 km2. Between 1980 and 2015, urban built-up area increased by 237 km2, rural built-up area increased by about 86 km2, and farmland area decreased by 382 km2, as shown in Table 2. The period between 2005 and 2010 stands out because of slowed down growth in urban built-up area (about 17%). Furthermore, between 1980 and 1990, there was a considerable increase in farmland (130 km2) and decrease in rural built-up area (45 km2). It is important to emphasize that increases in the three categories listed here also took place at the expense of other land use categories (see Section 2.2).
Table 3 displays the results from overlaying raster data for the different analyzed periods. Most urban expansion (87%) took place on former rural built-up area (27%) and former farmland (60%). It is noteworthy that although rural built-up area was converted to urban built-up area, the amount of rural built-up area increased by 86 km2 between 1980 and 2015, as shown in Table 2. This increase is related to a continued loss of farmland, as shown in Table 2.
The spatial orientation of urban expansion in Xi’an was clearly constrained by the region’s geography and its administrative boundaries, as shown in Figure 3. Figure 3b shows the spatial orientation and distance from the Xi’an urban center for new urban built-up areas. Each line represents the values (or outlines of expansion) for a time step. While urban expansions in the earlier years during the analyzed period displayed a more even pattern, the establishment of new urban built-up area followed a NE-SW orientation starting around the year 2000. This dynamic resulted in considerable sprawl of urban built-up area in the peripheral districts away from the urban center, as shown in Figure 3a.

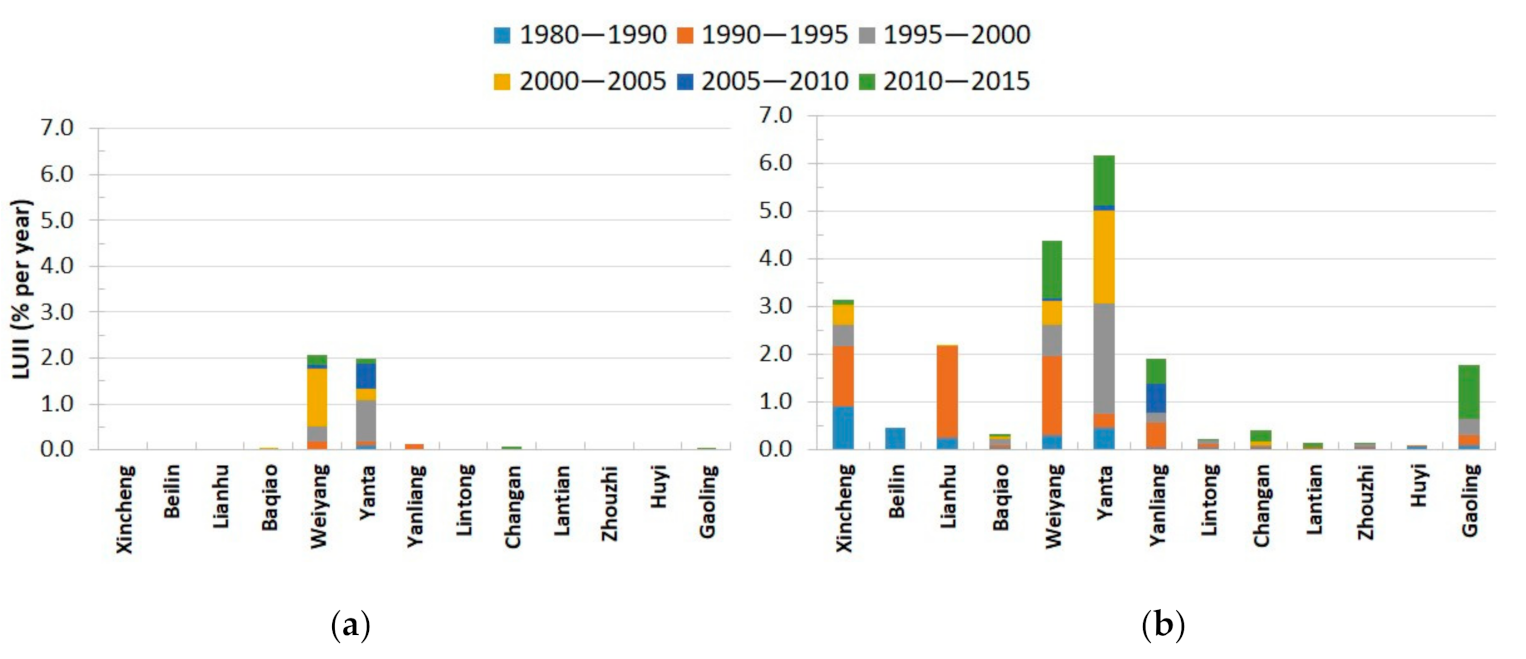
3.2. Urbanization Intensity

Figure 4 displays the land urbanization intensity index (LUII) on the district/county level for Xi’an covering the six periods. The analysis results show a non-trivial, outwards directed pattern starting with more intense urbanization in districts closer to the city center during the early analyzed periods. For the period 1980–1990, the highest LUII values are displayed for Xincheng, Beilin, Yanta, Lianhu, and Weiyang, as shown in Figure 4a, with a peak LUII value of about 1% and most of the urbanization taking place on farmland. The results for the 1990–1995 period show slowed urbanization intensity in Beilin and no conversion of farmland to urban built-up area in this district. However, Xincheng, Lianhu, Weiyang, Yanta, Gaoling, and Yanliang experience urbanization, as shown in Figure 4b. Overall, during the first two periods, we see urbanization realized through infill and new development in the core areas of Xi’an, with historical areas exempt from high-density development activities.
For the 1995–2000 period, Yanta shows the highest LUII value, followed by fast urbanization in Weiyang, medium urbanization in Xincheng and Gaoling, and slow urbanization in Yanliang and Baqiao, as shown in Figure 4c. During this period, the conversion of rural built-up area contributed about 30% to urbanization. For the period 2000–2005, urbanization occurred with fastest rates in Weiyang and Yanta, while Xincheng displays moderate urbanization intensity, as shown in Figure 4d. Most substantial farmland area conversion is displayed for Yanta with an LUII value of 2%. Between 2005 and 2010, Yanta, Yanliang, and Lantian show the highest LUII, as shown in Figure 4e. During the most recent period 2010–2015, Xi’an experienced a remarkable sprawl pattern, showing a qualitative difference from the earlier years, as shown in Figure 4f. Substantial urbanization is visible in almost all districts, except Huyi, Lianhu, and Beilin.
The conversion from rural built-up to urban built-up displays a clear trend, as shown in Figure 5a. For most of the analyzed periods, conversion takes place in two districts—Weiyang and Yanta. Between 1990 and 1995, the Yanliang district also displays conversion from rural built-up to urban built-up. In the most recent period (2010–2015), conversion happened in two districts surrounding the urban center (Chang’an and Gaoling), but at a much lower level. When analyzing the conversion from farmland to urban built-up, as shown in Figure 5b, most districts display this type of conversion to some degree. The highest values for this conversion type are found in one central district (Lianhu), and two districts with proximity to the city center (Weiyang and Yanta), as shown in Figure 5b. The districts Baqiao, Lintong, Lantian, Zhouzhi, and Huyi display the lowest values for this conversion type, which is surprising given Baqiao’s proximity to the Xi’an city center. The results also clearly display overall higher LUII values for the conversion of former farmland to urban built-up area as compared to the conversion of former rural built-up area, as shown in Figure 5a,b.

3.3. Urbanization along the Urban–Rural Gradient

We assessed the LUII along the urban–rural gradient, using buffer zones along 3 km intervals, as shown in Figure 2. We separated the two conversion types rural built-up to urban built-up, as shown in Figure 6a, and farmland to urban built-up, as shown in Figure 6b. Like the district/county-based analysis shown in Figure 5, the LUII for conversion from farmland to urban built-up displayed consistently higher levels as compared to rural built-up to urban built-up conversion. Most of the conversion during the analyzed period took place within 6 to 15 km from the city center, as shown in Figure 6a,b. The highest LUII values for rural built-up to urban built-up area transitions were reached in the period 1995–2000 at a 9 km distance, and moving outwards after that, with high LUII values in the period 2000–2005 at a 12 km distance, as shown in Figure 6a. The spatio-temporal dynamics for the conversion of farmland to urban built-up area displays a more complex pattern, as shown in Figure 6b. While there is an apparent outward trend over the analyzed period, the period 2005–2010 displays some land use conversion in proximity to the city center (9 km). Furthermore, the data for the period 2010–2015 shows two conversion peaks, one at 15 km and a second conversion peak at 27 km from the city center. Overall, we found the highest LUII values for the periods 1990–1995 at a 6 km distance, followed by the period 1995–2000 at a 9 km distance.

3.4. Drivers of Urbanization

Table 4 lists the results of the regression analysis of the environmental, socio-economic, infrastructural, policy, and planning characteristics that represent drivers of urbanization in Xi’an, as shown in Table 1 and Section 2.4. Drivers include four negatively associated parameters (distance to center and subcenters, distance to highways, travel time to cities, and terrain slope), and two positively associated variables (road density and planning area). Table 5 displays the intercepts α on the district/county level.

4. Discussion

We analyzed the drivers and spatio-temporal trajectories of urban expansion in northwest China. Specifically, we evaluated land-use change patterns (focusing on the three categories urban built-up area, rural built-up area, and farmland) within Xi’an’s 13 districts along the urban–rural gradient between 1980 and 2015, using the LUII to quantify the intensity of urbanization. Furthermore, we assessed the relationship between new urban built-up area and a set of independent spatial variables and explored the indirect effect of urbanization on farmland loss. Here, we discuss the key findings of our analysis.

4.1. Impacts of Land-Use Change

The analysis of Xi’an’s spatial urbanization patterns over the last 35 years revealed the intense competition between different land uses in northwest China. Our results display that a large part of urbanization took place at the expense of farmland and rural built-up area, accounting for 60% and for 27% of new urban built-up area, respectively. The general trends of urban area dynamics identified in our study are in line with findings on the global scale [43] and findings on the trends and order of magnitude of land-use change identified for the Xi’an area [23]. The competition between different land uses, i.e., land used for housing and industry and land used for food and fiber production, reveals a fundamental conflict between short-term economic development gains and long-term food security [23,44]. Historically, settlements developed in areas with access to water and fertile soils [45]. As a result, settlements and highly productive farmland are often located in proximity to each other, which frequently leads to a loss of farmland when urban areas expand [16]. This process can be observed around many cities in China [6,46] and across the globe [16,47]. The direct effect of urban expansion has important implications on food security [48] and provision of ecosystem services (e.g., formation of urban heat islands [49], and biodiversity loss [50]). Furthermore, the issue of farmland loss due to urban expansion is exacerbated through two additional factors:
(1)
Urbanization is often caused by population growth leading to an increase in food requirements. This means that farmland is lost due to urban expansion, while at the same time the demand for food and fiber increases [51].
(2)
Urban expansion leads to a displacement of farmland to new, often less productive areas (i.e., indirect land-use change). This indirect land-use change effect can result in additional area requirements to meet the same production values, and can lead to additional loss of biodiversity, either through loss of natural vegetation or an intensification of farming practices [16,17,52].
Our analysis did indeed reveal an indirect land-use change effect for our study area; new urban built-up area was established on former rural built-up area, pushing the rural built-up area on former farmland, which in turn was displaced to other areas. This chain of land-use changes, observable in Figure 4, is typical for the rural and urban dual-track land use policy in China [53], pushing rural built-up area on farmland often resulting in a net loss of farmland [17]. The net loss of farmland can be tied to growing concerns about food security, which is a common problem in many large cities in China [22,54]. Hence, our results emphasize that the regional direct and indirect land-use change patterns in northwest China are in line with the general urbanization pathways and impacts on farmland displacement and food security observed for China.

4.2. Spatial and Temporal Patterns of Urbanization in Northwest China

Two innovative components of our study, as compared to other research conducted for Xi’an and northwest China [23], are the analysis of spatial variables associated with urbanization and the analysis of the spatio-temporal urbanization patterns along the urban–rural gradient. The logistic regression analysis of spatial variables identified four negatively associated variables (distance to (sub)center, distance to highways, travel time, and terrain slope), and two positively associated variables (road density and planning area). These results reflect the relationship between infrastructure and urbanization in Xi’an, which is in line with urbanization studies for other Chinese cities [4,11,28]. The outward expansion is driven by infrastructure development. The urbanization of formerly rural built-up areas may occur to take advantage of the existing infrastructure, such as public transportation and highways. Distance to (sub)center is also (negatively) associated with urbanization, which indicates a sprawl pattern different from the mono-centric city. The relationship with the distance to (sub)center could also be due to the “five [development zones], one harbor and two bases”, which were set up and distributed in sub-centers to form development cores in Xi’an [24,25]. While the implementation of development zones caused some detrimental effects and resulted in cross-functional issues [55], development zones played a key role for developing domestic industries and for attracting developers, not only in Xi’an but also in other Chinese cities [4]. In Xi’an, the use of development zones as central and local government policies helped to realize fast land conversion for high technology, trade, and environment protection [24,25,56].
The results of our analysis indicate a high effectiveness of urban planning in Xi’an; the regression analysis showed a strong association between planning areas and urbanization and we found a prevalence of infill development until 2010 when the urbanization pattern showed a qualitative shift to a sprawling pattern. The former finding is in line with a study conducted for Nanjing, where urbanization patterns were also found to be highly consistent with planned areas [11], while being contradictory to the findings of [28] who found development zone expansion outside of the planning area and concluded that the effectiveness of planning zones was low. This contradiction displays the importance of studies for specific regions and consideration for their unique geographies. While the general urbanization trends are similar across China (or even globally), it becomes clear that regional and local differences exist that need to be considered for understanding current and potential future urbanization pathways. For example, in China, top-down land-use planning functions more like a land-use quota plan. In this context, urban master planning—like the urban planning for Xi’an—is implemented as a more bottom-up planning procedure that leaves room for consideration of regional geographical patterns and local development requirements, and helps to realize the balance between historical site protection, urbanization, and ecological land reservation.
In summary, while our analysis of spatial drivers indicate that Xi’an experienced urbanization guided by state-led plans, policies, and infrastructure, we also found some characteristics that are unique to the Xi’an area and need to be considered in future urbanization planning as carried out by the local government. Specifically, we found that the unique geography in Xi’an, with the Qinling Mountains in the south of the study area, pushed new development onto the less steep areas where a large fraction of the farmland is located. We also found that protected areas and development zone strategies were integrated into urban planning, which first led to a general infill of development, ultimately shifting to a sprawl pattern around 2010, which is likely to continue. These two key findings—a more sprawling pattern which is likely to be pushed towards the flat areas with farmlands—emphasize the need for local planning strategies and integrated management according to the principles of sustainable development to minimize the loss of fertile farmland [17,22] and biodiversity [50]. However, it is possible that achieving the three goals of modern Chinese society—a sustainable environment, food security, and urban development—represents a “wicked problem” which requires trade-offs because no single best solution exists [44,54].

4.3. Study Limitations and Next Steps

In this study, we focused on urban expansion and its spatio-temporal patterns and indicators. While we identified the location of new urban built-up and rural built-up areas, we did not conduct an in-depth analysis of the processes around the indirect effects of rural built-up area expansion on farmland, yield decrease or reduced crop production, or loss of ecosystem services caused by this process. However, based on current urbanization rates, it is likely that additional urban built-up area will be needed to accommodate an increasingly non-agricultural population. This increase in urban built-up area is likely to lead to increased competition between the land uses discussed above while affecting the environment in urban areas, at the urban fringe, and outside of urban areas. The United Nations recognized food security as a significant challenge (Sustainable Development Goal 2—Zero Hunger; [57]), while also calling for sustainable approaches to urbanization (Sustainable Development Goal 11—Sustainable Cities and Communities; [57]). How to best achieve this trade-off has been a focus of research for scholars and policymakers in China for several years [58]. There is also a need to study not only how to provide the space for continued urbanization while at the same time preserving productive, high-quality farmland, but also how to do that in a sustainable manner including the indirect effects of both urbanization and farmland displacement on natural vegetation, its fragmentation, and biodiversity in general (e.g., [41] or Sustainable Development Goal 12—Responsible Consumption and Production [57]).
To improve the understanding of the impacts of urbanization on food production and biodiversity requires exploring sustainable pathways for the expansion and intensification of urban development while taking into consideration not only regional and global trends, but also the unique local geography of an area. Understanding the impact of urbanization on the surrounding areas under potential future urbanization dynamics will allow identifying hotspots of change, addressing the competition between different land uses, and finding the most sustainable solutions for urban planning. Hence, we propose as a next step to use simulation models parameterized with our findings on the unique local settings as drivers for scenarios. These simulations will allow for the analyis of the effect of population growth on urbanization, the relationship between the increase of urban built-up area and decrease of rural built-up area, and farmland loss and biodiversity of surrounding areas. Testing different urban planning or policy scenarios for reducing farmland loss and the environmental impacts will help to explore the potential future trade-offs between urban spatial development and farmland protection. For this purpose, we propose the use of a simulation model specifically designed to analyze the dynamics at the urban–rural interface and the effects on the environment (e.g., [40,41,59]).

5. Conclusions

The objective of this study was to analyze the patterns and spatial drivers of urbanization in northwest China, using Xi’an—the largest and fastest growing city in northwest China—as a proxy for development patterns in this region. Our analysis of historical urbanization patterns found a concentric, yet northward oriented expansion with a clear association between urbanization and urban planning area, distance to subcenters, and slope, with the latter showing the unique geographical limitations imposed by the Qinling Mountains located south of Xi’an. We furthermore found a sequence of development patterns starting with an infill pattern that shifted to a development of rural built-up area in 2010, resulting in former farmland being converted to rural built-up area and farmland being displaced to other areas. Our analysis shows the importance of case studies for identifying drivers and limitations shaping the dynamics of urbanization patterns in a region. The shift from infill to indirect land-use change leading to the loss of farmland is likely to continue and expand beyond current urban planning areas and administrational boundaries given the strategic core position of Xi’an in the Guanzhong plain agglomeration. This trend displays the conflict between urban expansion and farmland loss in northwest China and emphasizes the need for policies that regulate expansion and protect fertile farmlands and historical and cultural heritage sites while considering the unique geography and urbanization history of different regions. Hence, future urban planning efforts need to focus on reducing the loss of productive farmland considering geographical constraints. Using land change simulations to explore and visualize the patterns and dynamics from different planning policies will help to find the best trade-offs between conflicting interests in a “wicked problem” setting.

Author Contributions

H.L. and H.S. conceived the study and acquired the data; H.L., H.S., and J.K. analyzed the data; H.S. contributed to the data checking; H.L. wrote the draft; H.L. and J.K. edited the manuscript. All authors have read and agreed to the published version of the manuscript.

Funding

H.L. received funding from the Chinese Scholarship Council.

Acknowledgments

We would like to thank Monica Dorning and Claire Curry for their valuable feedback on a draft version of this manuscript. We also would like to thank the three anonymous reviewers for their constructive comments that helped improve the quality of this manuscript.

Conflicts of Interest

The authors declare no conflict of interest.

References

  1. Seto, K.C.; Fragkias, M.; Güneralp, B.; Reilly, M.K. A meta-analysis of global urban land expansion. PLoS ONE 2011, 6, e23777. [Google Scholar] [CrossRef] [PubMed]
  2. Seto, K.C.; Guneralp, B.; Hutyra, L.R. Global forecasts of urban expansion to 2030 and direct impacts on biodiversity and carbon pools. Proc. Natl. Acad. Sci. USA 2012, 109, 16083–16088. [Google Scholar] [CrossRef] [PubMed] [Green Version]
  3. World Bank. World Development Indicators 2016; World Bank: Washington, DC, USA, 2016. [Google Scholar]
  4. Li, H.; Wei, Y.H.D.; Huang, Z. Urban land expansion and spatial dynamics in Globalizing Shanghai. Sustainability 2014, 6, 8856–8875. [Google Scholar] [CrossRef] [Green Version]
  5. Liu, J.; Zhan, J.; Deng, X. Spatio-temporal Patterns and Driving Forces of Urban Land Expansion in China during the Economic Reform Era. AMBIO J. Hum. Environ. 2005, 34, 450–455. [Google Scholar] [CrossRef]
  6. Song, W.; Deng, X. Effects of urbanization-induced cultivated land loss on ecosystem services in the north China plain. Energies 2015, 8, 5678–5693. [Google Scholar] [CrossRef]
  7. Tian, G.; Jiang, J.; Yang, Z.; Zhang, Y. The urban growth, size distribution and spatio-temporal dynamic pattern of the Yangtze River Delta megalopolitan region, China. Ecol. Model. 2011, 222, 865–878. [Google Scholar] [CrossRef]
  8. Wu, W.; Zhao, S.; Zhu, C.; Jiang, J. A comparative study of urban expansion in Beijing, Tianjin and Shijiazhuang over the past three decades. Landsc. Urban Plan. 2015, 134, 93–106. [Google Scholar] [CrossRef]
  9. Liu, Y.; Yang, Y.; Li, Y.; Li, J. Conversion from rural settlements and arable land under rapid urbanization in Beijing during 1985–2010. J. Rural Stud. 2017, 51, 141–150. [Google Scholar] [CrossRef]
  10. Zhao, S.; Zhou, D.; Zhu, C.; Qu, W.; Zhao, J.; Sun, Y.; Huang, D.; Wu, W.; Liu, S. Rates and patterns of urban expansion in China’s 32 major cities over the past three decades. Landsc. Ecol. 2015, 30, 1541–1559. [Google Scholar] [CrossRef]
  11. Chen, J.; Gao, J.; Yuan, F.; Wei, Y.D. Spatial determinants of urban land expansion in globalizing Nanjing, China. Sustainability 2016, 8, 868. [Google Scholar] [CrossRef] [Green Version]
  12. Liu, J.; Liu, Y.; Yan, M. Spatial and temporal change in urban-rural land use transformation at village scale—A case study of Xuanhua district, North China. J. Rural Stud. 2016, 47, 425–434. [Google Scholar] [CrossRef]
  13. Chen, L.; Sun, R.; Liu, H. Eco-environmental effects of urban landscape pattern changes: Progresses, problems, and perspectives. Acta Ecol. Sin. 2013, 33, 1042–1050. [Google Scholar] [CrossRef] [Green Version]
  14. Zhou, D.; Shi, P.; Wu, X.; Ma, J.; Yu, J. Effects of urbanization expansion on landscape pattern and region ecological risk in Chinese coastal city: A case study of Yantai city. Sci. World J. 2014, 2014, 1–9. [Google Scholar] [CrossRef] [Green Version]
  15. Foley, J.A.; Defries, R.; Asner, G.P.; Barford, C.; Bonan, G.; Carpenter, S.R.; Chapin, F.S.; Coe, M.T.; Daily, G.C.; Gibbs, H.K.; et al. Global consequences of land use. Science 2005, 309, 570–574. [Google Scholar] [CrossRef] [Green Version]
  16. Koch, J.; Wimmer, F.; Schaldach, R. Analyzing the relationship between urbanization, food supply and demand, and irrigation requirements in Jordan. Sci. Total Environ. 2018, 636, 1500–1509. [Google Scholar] [CrossRef] [PubMed]
  17. Yang, B.; Ke, X.; van Vliet, J.; Yu, Q.; Zhou, T.; Verburg, P.H. Impact of cropland displacement on the potential crop production in China: A multi-scale analysis. Reg. Environ. Change 2020, 20, 97. [Google Scholar] [CrossRef]
  18. Zhou, L.; Dickinson, R.E.; Tian, Y.; Fang, J.; Li, Q.; Kaufmann, R.K.; Tucker, C.J.; Myneni, R.B. Evidence for a significant urbanization effect on climate in China. Proc. Natl. Acad. Sci. USA 2004, 101, 9540–9544. [Google Scholar] [CrossRef] [Green Version]
  19. Tan, M.; Li, X.; Xie, H.; Lu, C. Urban land expansion and arable land loss in China—A case study of Beijing-Tianjin-Hebei region. Land Use Policy 2005, 22, 187–196. [Google Scholar] [CrossRef]
  20. Wang, J.; Chen, Y.; Shao, X.; Zhang, Y.; Cao, Y. Land-use changes and policy dimension driving forces in China: Present, trend and future. Land Use Policy 2012, 29, 737–749. [Google Scholar] [CrossRef]
  21. Long, H.; Zou, J.; Liu, Y. Differentiation of rural development driven by industrialization and urbanization in eastern coastal China. Habitat Int. 2009, 33, 454–462. [Google Scholar] [CrossRef]
  22. Liu, F.; Zhang, Z.; Zhao, X.; Wang, X.; Zuo, L.; Wen, Q.; Yi, L.; Xu, J.; Hu, S.; Liu, B. Chinese cropland losses due to urban expansion in the past four decades. Sci. Total Environ. 2019, 650, 847–857. [Google Scholar] [CrossRef] [PubMed]
  23. Wang, X.F.; Fu, B.J.; Su, C.H.; Wang, R.R.; Zhao, Y.H.; Li, T.S. Spatio-temporal characteristics and driving forces of built-up land in Xi’an, China. Acta Ecol. Sin. 2015, 35, 7139–7149. (In Chinese) [Google Scholar] [CrossRef]
  24. Li, W.; Shen, J.; Liu, D. Study on development zones in Xi’an. Econ. Anal. 2016, 7, 95–97. (In Chinese) [Google Scholar]
  25. Wang, H. The NSDZs-led Urban Sprawl in Xi’an: A Non-typical Suburbanization. Reg. Dev. 2007, 10, 93–103. (In Chinese) [Google Scholar]
  26. Fang, C.; Zhao, S. A comparative study of spatiotemporal patterns of urban expansion in six major cities of the Yangtze River Delta from 1980 to 2015. Ecosyst. Health Sustain. 2018, 4, 95–114. [Google Scholar] [CrossRef] [Green Version]
  27. Lu, S.; Guan, X.; He, C.; Zhang, J. Spatio-Temporal Patterns and Policy Implications of Urban Land Expansion in Metropolitan Areas: A Case Study of Wuhan Urban Agglomeration, Central China. Sustainability 2014, 6, 4723–4748. [Google Scholar] [CrossRef] [Green Version]
  28. Liu, Y.; Yue, W.; Fan, P. Spatial determinants of urban land conversion in large Chinese cities: A case of Hangzhou. Environ. Plan. B Plan. Des. 2011, 38, 706–725. [Google Scholar] [CrossRef]
  29. Development Planning of Guanzhong Plain Urban Agglomeration. Available online: https://www.ndrc.gov.cn/xxgk/zcfb/ghwb/201802/t20180207_962246.html (accessed on 14 July 2020).
  30. Population Development Plan of Shaanxi Province (2016–2030). Available online: http://www.shaanxi.gov.cn/gk/zfwj/99134.htm (accessed on 14 July 2020).
  31. West Data Center. Land Use/Land Cover Data. Available online: http://westdc.westgis.ac.cn/ (accessed on 18 April 2018).
  32. Data Application Environment of the Chinese Academy of Sciences. Chinese Administrative Zoning Map. Available online: http://rsr.csdb.cn (accessed on 28 April 2018).
  33. Xi’an City Planning and Design Institute. Road Network, Conservation Areas, and Development Zones. Available online: http://www.xaguihua.com/ (accessed on 25 April 2018).
  34. Xi’an Statistical Yearbook. Population Numbers and GDP. Available online: http://tjj.xa.gov.cn (accessed on 30 April 2020).
  35. Alsharif, A.A.A.; Pradhan, B. Urban Sprawl Analysis of Tripoli Metropolitan City (Libya) Using Remote Sensing Data and Multivariate Logistic Regression Model. J. Indian Soc. Remote Sens. 2014, 42, 149–163. [Google Scholar] [CrossRef]
  36. Hu, Z.; Lo, C.P. Modeling urban growth in Atlanta using logistic regression. Comput. Environ. Urban Syst. 2007, 31, 667–688. [Google Scholar] [CrossRef]
  37. Cheng, J.; Masser, I. Urban growth pattern modeling: A case study of Wuhan city, PR China. Landsc. Urban Plan. 2003, 62, 199–217. [Google Scholar] [CrossRef]
  38. Dale, M.R.T.; Fortin, M.-J. Spatial autocorrelation and statistical tests in ecology. Ecoscience 2002, 9, 162–167. [Google Scholar] [CrossRef]
  39. Bates, D.; Maechler, M.; Bolker, B.; Walker, S. lme4: {Linear} mixed-effects models using {Eigen} and {S}4. R Package Version 2014, 1, 1–23. [Google Scholar]
  40. Meentemeyer, R.K.; Tang, W.; Dorning, M.A.; Vogler, J.B.; Cunniffe, N.J.; Shoemaker, D.A. FUTURES: Multilevel Simulations of Emerging Urban–Rural Landscape Structure Using a Stochastic Patch-Growing Algorithm. Ann. Assoc. Am. Geogr. 2013, 103, 785–807. [Google Scholar] [CrossRef] [Green Version]
  41. Dorning, M.A.; Koch, J.; Shoemaker, D.A.; Meentemeyer, R.K. Simulating urbanization scenarios reveals tradeoffs between conservation planning strategies. Landsc. Urban Plan. 2015, 136, 28–39. [Google Scholar] [CrossRef] [Green Version]
  42. Fotheringham, A.S.; Brunsdon, C. Local Forms of Spatial Analysis. Geogr. Anal. 1999, 31, 340–358. [Google Scholar] [CrossRef]
  43. Liu, X.; Huang, Y.; Xu, X.; Li, X.; Li, X.; Ciais, P.; Lin, P.; Gong, K.; Ziegler, A.D.; Chen, A.; et al. High-spatiotemporal-resolution mapping of global urban change from 1985 to 2015. Nat. Sustain. 2020, 3, 564–570. [Google Scholar] [CrossRef]
  44. Xu, X.; Peng, H.; Xu, Q.; Xiao, H.; Benoit, G. Land changes and conflicts coordination in coastal urbanization: A case study of the shandong peninsula in china. Coast. Manag. 2009, 37, 54–69. [Google Scholar] [CrossRef]
  45. Hualou, L.; Tingting, L. Analysis of the Coupling of Farmland and Rural Housing Land Transition in China. Acta Geogr. Sin. 2012, 67, 201–210. [Google Scholar]
  46. Yue, W.; Zhang, L.; Liu, Y. Measuring sprawl in large Chinese cities along the Yangtze River via combined single and multidimensional metrics. Habitat Int. 2016, 57, 43–52. [Google Scholar] [CrossRef]
  47. Bren d’Amour, C.; Reitsma, F.; Baiocchi, G.; Barthel, S.; Güneralp, B.; Erb, K.-H.; Haberl, H.; Creutzig, F.; Seto, K.C. Future urban land expansion and implications for global croplands. Proc. Natl. Acad. Sci. USA 2016, 114, 8939–8944. [Google Scholar] [CrossRef] [Green Version]
  48. Tan, R.; Beckmann, V.; van den Berg, L.; Qu, F. Governing farmland conversion: Comparing China with the Netherlands and Germany. Land Use Policy 2009, 26, 961–974. [Google Scholar] [CrossRef]
  49. Chen, M.; Liu, W.; Lu, D. Challenges and the way forward in China’s new-type urbanization. Land Use Policy 2016, 55, 334–339. [Google Scholar] [CrossRef]
  50. Mattison, E.H.A.; Norris, K. Bridging the gaps between agricultural policy, land-use and biodiversity. Trends Ecol. Evol. 2005, 20, 610–616. [Google Scholar] [CrossRef]
  51. Yu, A.T.W.; Wu, Y.; Zheng, B.; Zhang, X.; Shen, L. Identifying risk factors of urban-rural conflict in urbanization: A case of China. Habitat Int. 2014, 44, 177–185. [Google Scholar] [CrossRef]
  52. Lapola, D.M.; Schaldach, R.; Alcamo, J.; Bondeau, A.; Koch, J.; Koelking, C.; Priess, J.A. Indirect land-use changes can overcome carbon savings from biofuels in Brazil. Proc. Natl. Acad. Sci. USA 2010, 107, 3388–3393. [Google Scholar] [CrossRef] [Green Version]
  53. Long, H.; Li, Y.; Liu, Y.; Woods, M.; Zou, J. Accelerated restructuring in rural China fueled by ‘increasing vs. decreasing balance’ land-use policy for dealing with hollowed villages. Land Use Policy 2012, 29, 11–22. [Google Scholar] [CrossRef]
  54. Liu, T.; Liu, H.; Qi, Y. Construction land expansion and cultivated land protection in urbanizing China: Insights from national land surveys, 1996-2006. Habitat Int. 2015, 46, 13–22. [Google Scholar] [CrossRef]
  55. Wei, Y.D. Zone Fever, Project Fever: Development Policy, Economic Transition, and Urban Expansion in China. Geogr. Rev. 2015, 105, 156–177. [Google Scholar] [CrossRef]
  56. Wei, Y.H.D. Restructuring for growth in urban China: Transitional institutions, urban development, and spatial transformation. Habitat Int. 2012, 36, 396–405. [Google Scholar] [CrossRef]
  57. United Nations General Assembly Resolution A/RES/70/1. Transforming Our World: The 2030 Agenda for Sustainable Development; Division for Sustainable Development Goals: New York, NY, USA, 2015. [Google Scholar]
  58. Liu, Y. Introduction to land use and rural sustainability in China. Land Use Policy 2018, 74, 1–4. [Google Scholar] [CrossRef]
  59. Koch, J.; Dorning, M.A.; Van Berkel, D.B.; Beck, S.M.; Sanchez, G.M.; Shashidharan, A.; Smart, L.S.; Zhang, Q.; Smith, J.W.; Meentemeyer, R.K. Modeling landowner interactions and development patterns at the urban fringe. Landsc. Urban Plan. 2019, 182, 101–113. [Google Scholar] [CrossRef]
Figure 1. The study area covers the city of Xi’an in northwest China.
Land 09 00411 g001
Figure 2. County/district boundaries and buffer zones around the city center in 3 km intervals, and land use for the year 2015. We used the buffer zones and county/district boundaries to define the spatial units for the calculation of the land use intensity index (LUII) along the urban–rural gradient.
Land 09 00411 g002
Figure 3. Spatial and temporal dynamics of urban expansion in Xi’an between 1980 and 2015: (a) urban built-up area in 1980 and new urban built-up area for the different time steps; and (b) spatial orientation and distance (in km) from the Xi’an urban center of urban expansion for the different time steps between 1980 and 2015.
Land 09 00411 g003
Figure 4. Spatial variation of the land urbanization intensity index (LUII) on the county/district level in Xi’an for the period 1980–2015. The LUII values (% per year) were categorized into six classes (No change: 0%/year, Slowest: >0–0.1%/year, Slow: >0.1–0.3%/year, Medium: 0.3–0.6%/year, Fast: >0.6–1.5%/year, Fastest: >1.5–4.0%/year). The panels present the different periods: (a) 1980–1990, (b) 1990–1995, (c) 1995–2000, (d) 2000–2005, (e) 2005–2010, and (f) 2010–2015. The numbers label the different districts/counties: 1. Xincheng, 2. Beilin, 3. Lianhu, 4. Baqiao, 5. Weiyang, 6. Yanta, 7. Yanliang, 8. Lintong, 9. Chang’an, 10. Lantian, 11. Zhouzhi, 12. Huyi, and 13. Gaoling.
Land 09 00411 g004aLand 09 00411 g004b
Figure 5. Evolution of the land urbanization intensity index (LUII) over the analyzed period (1980–2015) on the district/county level for two categories: (a) conversion from rural built-up to urban built-up area, and (b) conversion from farmland to urban built-up area.
Land 09 00411 g005
Figure 6. Evolution of the land use intensity index (LUII) over the analyzed period (1980–2015) along the urban–rural gradient for two categories: (a) conversion from rural built-up to urban built-up area, and (b) conversion from farmland to urban built-up area.
Land 09 00411 g006
Table 1. Spatial variables considered in the logistic regression analysis.
CategoryParameterDescription
EnvironmentTopographyTerrain slope 1
EnvironmentHydrological featuresDistance to water bodies 1
EnvironmentLand use/coverLand classification system (2nd level) 1
InfrastructureRoadsDistance to roadways 2
InfrastructureHighwaysDistance to highways (incl. national roads, provincial roads, and urban highways) 2
InfrastructureRoad densityRoad density within varying ranges (3000 m) 2
InfrastructureTravel timeTravel time to cities in the Guanzhong Plain City Agglomeration 3
InfrastructureSubwayDistance to subways 2
PolicyProtected areasDistance to historical relics sites 2
PolicyDevelopment zoneDistance to development zones 2
SocioeconomicCity center/subcentersDistance to city center and subcenters 2
SocioeconomicAdministrative boundariesCounty boundaries 3
PlanningPlanning areaPlanning area set to 1, all other areas set to 0 2
1 West Data Center [31], 2 Xi’an City Planning and Design Institute [33], 3 Data Application Environment of the Chinese Academy of Sciences [32].
Table 2. Urban built-up area, rural built-up area, and farmland area between 1980 and 2015.
YearUrban Built-Up (km2)Rural Built-Up (km2)Farmland (km2)
1980174.1542.03967.8
1990190.6497.64098.0
1995204.1475.23923.9
2000238.6586.63885.0
2005303.0604.13761.3
2010319.7599.63739.4
2015410.8627.93585.8
Table 3. Land-use change and percentage of contribution to urban built-up area for the different land-use categories between 1980 and 2015.
PeriodUrban Built-UpLoss of Rural Built-UpLoss of Farmland
Change (%)Area (km2)Area (km2)Contribution (%)Area (km2)Contribution (%)
1980–19909.516.51.48.312.877.8
1990–19957.113.56.850.65.439.9
1995–200016.934.511.232.417.450.4
2000–200527.064.420.231.329.245.3
2005–20105.516.85.432.4410.160.5
2010–201528.591.18.29.078.486.1
Table 4. Fixed effects for the spatial variables associated with urbanization in Xi’an.
EstimateStd. ErrorPr (>|z|)
(Intercept)2.5050.6770.000214***
Terrain slope−0.0480.0160.003243**
Road density0.0160.0070.013552*
Planning area2.0530.192<2 × 10⁻¹⁶***
Distance to (sub-)center−0.3140.025<2 × 10⁻¹⁶***
Highways−0.0720.0300.017157*
Travel time−0.0270.0160.091325
Significance codes: 0 ‘***’, 0.001 ‘**’, 0.01 ‘*’, 0.05 ‘.’.
Table 5. Random effects for the 13 districts/counties in the Xi’an study area.
District/CountyIntercept 1
Xincheng4.31
Beilin4.65
Lianhu4.95
Baqiao0.68
Weiyang4.47
Yanta3.65
Yanliang1.10
Lintong0.02
Chang’an3.83
Lantian1.61
Zhouzhi1.28
Huyi−0.57
Gaoling1.53
1 Random effects with standard deviation 2.03.
Publisher’s Note: MDPI stays neutral with regard to jurisdictional claims in published maps and institutional affiliations.

