Article

Contextualizing Landscape-Scale Forest Cover Loss in the Democratic Republic of Congo (DRC) between 2000 and 2015

1
Department of Geographical Sciences, University of Maryland, College Park, MD 20742, USA
2
College of Environmental Science and Forestry, State University of New York, Syracuse, NY 13210, USA
*
Author to whom correspondence should be addressed.
Submission received: 28 November 2019 / Revised: 10 January 2020 / Accepted: 11 January 2020 / Published: 16 January 2020
(This article belongs to the Section Landscape Ecology)

Abstract

:
Shifting cultivation has been shown to be the primary cause of land use change in the Democratic Republic of Congo (DRC). Traditionally, forested and fallow land are rotated in a slash and burn cycle that has created an agricultural mosaic, including secondary forest, known as the rural complex. This study investigates the land use context of new forest clearing (during 2000–2015) in primary forest areas outside of the established rural complex. These new forest clearings occur as either rural complex expansion (RCE) or isolated forest perforations (IFP), with consequent implications on the forest ecosystem and biodiversity habitat. During 2000–2015, subsistence agriculture was the dominant driver of forest clearing for both extension of settled areas and pioneer clearings removed from settled areas. Less than 1% of clearing was directly attributable to land uses such as mining, plantations, and logging, showing that the impact of commercial operations in the DRC is currently dwarfed by a reliance on small-holder shifting cultivation. However, analyzing the landscape context showed that large-scale agroindustry and resource extraction activities lead to increased forest loss and degradation beyond their previously-understood footprints. The worker populations drawn to these areas create communities that rely on shifting cultivation and non-timber forest products (NTFP) for food, energy, and building materials. An estimated 12% of forest loss within the RCE and 9% of the area of IFP was found to be within 5 km of mines, logging, or plantations. Given increasing demographic and commercial pressures on DRC’s forests, it will be crucial to factor in this landscape-level land use change dynamic in land use planning and sustainability-focused governance.

1. Introduction

The Democratic Republic of Congo (DRC) has one of the lowest per capita Gross National Incomes (GNI) in the world, estimated in 2016 at $460, compared to the Sub-Saharan average of $1516 [1]. An estimated 63.6% of the population is living in poverty [1], making the country rank 176th out of 187 countries in the Human Development Index [2]. In 2016, the DRC’s Gross Domestic Product (GDP) growth fell drastically to 2.4%, its lowest point since 2001 [3]. Further, a surge in violent conflict in 2017 has worsened an already critical humanitarian situation, adding to decades of brutal conflict and bringing the number of Internally Displaced People (IDPs) to 4.3 million [4]. Revisited projections of future global poverty highlight a paradox where the DRC, one of the countries with the most abundant natural resources in the world, will remain as one of the poorest countries [5]. This bleak outlook in fact occurs despite the country’s vast reserves of mineral deposits, potential for commercial plantations, and forests that are economically valuable not only for logging but also for conservation in payment for ecosystem services (PES) schemes like Reduced Emission from Degradation and Deforestation (REDD+) [6].
The population in the DRC is predominantly rural and relies for its livelihood on traditional small-holder shifting cultivation, small livestock, hunting, and gathering of NTFP. Forests are also used for gathering fuelwood, making charcoal, and building materials [6]. The footprint of this predominantly agricultural mosaic inside the humid tropical forest block is called the rural complex [7]. Forest cover loss in the DRC has been mapped for over a decade using satellite imagery and the rural complex has been observed and separated from primary forest [7,8,9,10]. However, advancements in classification accuracy, spatial and temporal resolution [11,12] have only recently allowed the separation of the rural complex from more isolated forest perforations [13]. These advances in synoptic forest change monitoring have enabled the estimation of a baseline shifting cultivation fallow periodicity within the core Congo Basin forest block of the DRC to be about 18 years [14]. Once primary forest is appropriated into the rural complex mosaic, it is not returned to pristine forest areas until decades later, if at all [15].
In the DRC, like in many countries, forest degradation from transforming unmanaged intact forests into managed non-intact forests is as important a source of Greenhouse Gas Emissions (GHGs) as deforestation [16], adding an estimated 6%–132% of emissions from forest lands [17]. There are a number of reasons why anthropogenic forest cover loss and degradation occur outside of the rural complex, but quantifying such dynamics is a challenge [18,19,20]. Shifting cultivation, hunting, and gathering of NTFP spills out of the established rural complex when farmers are led to claim new pristine forest because of increased demographic pressure and scarcity of available land, as well as socio-economic factors including conflict, political, religious, gender and tribal considerations, and economic incentives such as new transportation routes that allow access to new markets [6,15,21,22]. An important gender dynamic is at play in the spatial dynamics of shifting cultivation, as it is the men who traditionally open new fields in the forest, whereas women do more of the farming itself. Clearing of new forest in many places therefore remains also a cultural norm. Most women get land rights only through their husbands or the village chief, while land tenure is secured when traditional leaders allocate user rights among families and clan lines [23].
Forest fragmentation, and the erosion of core forests has important implications for the forest ecosystem, from increased edge effects to a loss of biodiversity habitat [24,25]. Forest intactness is therefore a good indicator of the conservation value of a forest landscape [26,27,28]. This is because remote forests are much less susceptible to anthropogenic degradation [29] as a population, and therefore deforestation rates drop with increased distance to roads [25,28,30,31]. Roads, including logging roads, facilitate contagious development, but also contagious environmental degradation if they are not planned and their impacts not fully integrated with their social and environmental costs [32,33].
Conflict has also fragmented forest areas by pushing farmers away from roads and further into the core forest, in the attempt to avoid contact with militias [34]. Conflict has led to increasing demographic pressure through migration and displacement [35]. For example, during the Rwandan genocide, hundreds of thousands of IDPs took refuge across the border in the eastern DRC, where they settled seeking shelter and sustenance. The burgeoning population density greatly increased forest loss and degradation, as shifting cultivation, hunting and gathering of NTFP, and fuelwood extraction provided livelihoods for refugees [35]. At the same time conflict has also prevented the safe operation of industries and transportation of goods, slowing the development of large-scale commercial land uses in many areas [35].
In addition to this, both artisanal and large-scale commercial operations for logging, mining, and plantations all have an influence on land use change that goes beyond the area that is traditionally and conservatively understood as their footprint, which is the land area visibly occupied by that operation itself. These artisanal and commercial activities provide essential economic benefits and development pathways, but also have important social and environmental impacts that need to be understood and planned [36,37]. These operations draw in worker populations, their families, and at times an entire network and community of supporting providers of services, ranging from general stores to prostitution [35,38,39]. The influence of large-scale commercial land uses, in the same way as settlements and transportation routes, can reach far beyond their observable physical boundaries [40,41,42].
While remote sensing cannot readily distinguish artisanal land uses like charcoal production or artisanal logging from the forest clearing that is part of the shifting cultivation land cover mosaic, large-scale commercial operations like plantations, mines and logging have a clear and unambiguous footprint that is observable in both Landsat-scale and high resolution satellite imagery. In previous research, [14] observed almost no large-scale commercial operations within the established rural complex for the year 2000, positing that new, isolated clearings may be more likely associated with extractive commercial land uses. In order to test this hypothesis, we set out to establish the proportion of forest cover loss outside of the established rural complex. In the current study, we quantified the co-location of remote-sensing-observable large-scale commercial land uses, roads and settlements. In doing so, we built on previous work done on separating the established rural complex from rural complex expansion (RCE) and isolated forest perforations (IFP) areas for the period 2000–2015 [13].
For the reasons above, forest cover loss and degradation need to be contextualized holistically which requires expanding context beyond per-pixel observations to include land use of the surrounding landscape. It is necessary to quantify the spatial and temporal characteristics of the successional vegetation types that replace a patch of cleared forest [43] and to identify what other proximate and underlying drivers influence land cover and land use change (LCLUC) [35]. Ultimately, the expansion of the rural complex is particularly important to model and understand because of the massive population growth predicted, reliance of this population on shifting cultivation, and estimates of dwindling if not vanishing forest resources in the country by the end of the century [44].

2. Materials and Methods

2.1. Data

The Forest D’Afrique Central Evaluee par Teledetection (FACET) map [11] provided the necessary data to map the baseline established rural complex for 2000. The growth of and separation of RCE and IFP areas in subsequent epochs (2005, 2010, 2015) was mapped using forest cover loss observed in the Global Forest Change (GFC) product [12]. Initially, a map was published using FACET only [13], which only had forest loss observations to 2010. The map was subsequently recreated using the GFC product as it became available, providing additional years of coverage at higher resolution. The GFC product has annual forest cover loss observations from the year 2000 at a spatial resolution of 30 meters.
DigitalGlobe (DG) imagery obtained from Google Earth (GE) was used for photo-interpretation of the sample points within the RCE and IFP (Figure 1). The National Geospatial Intelligence Agency (NGA)’s very high resolution satellite imagery archive available through the NextView license agreement [45] was also considered for filling in the sample points for which photo-interpretation was not possible, due to the absence of data in GE, but ultimately declined. The NGA archive was not used because it is predominantly composed of panchromatic imagery, which is sufficient for photo-interpreting the land cover at each sample point centroid [14], yet is excessively time consuming to interpret and not necessarily sufficient when photo-interpreting land cover within the broader landscape-scale buffers.

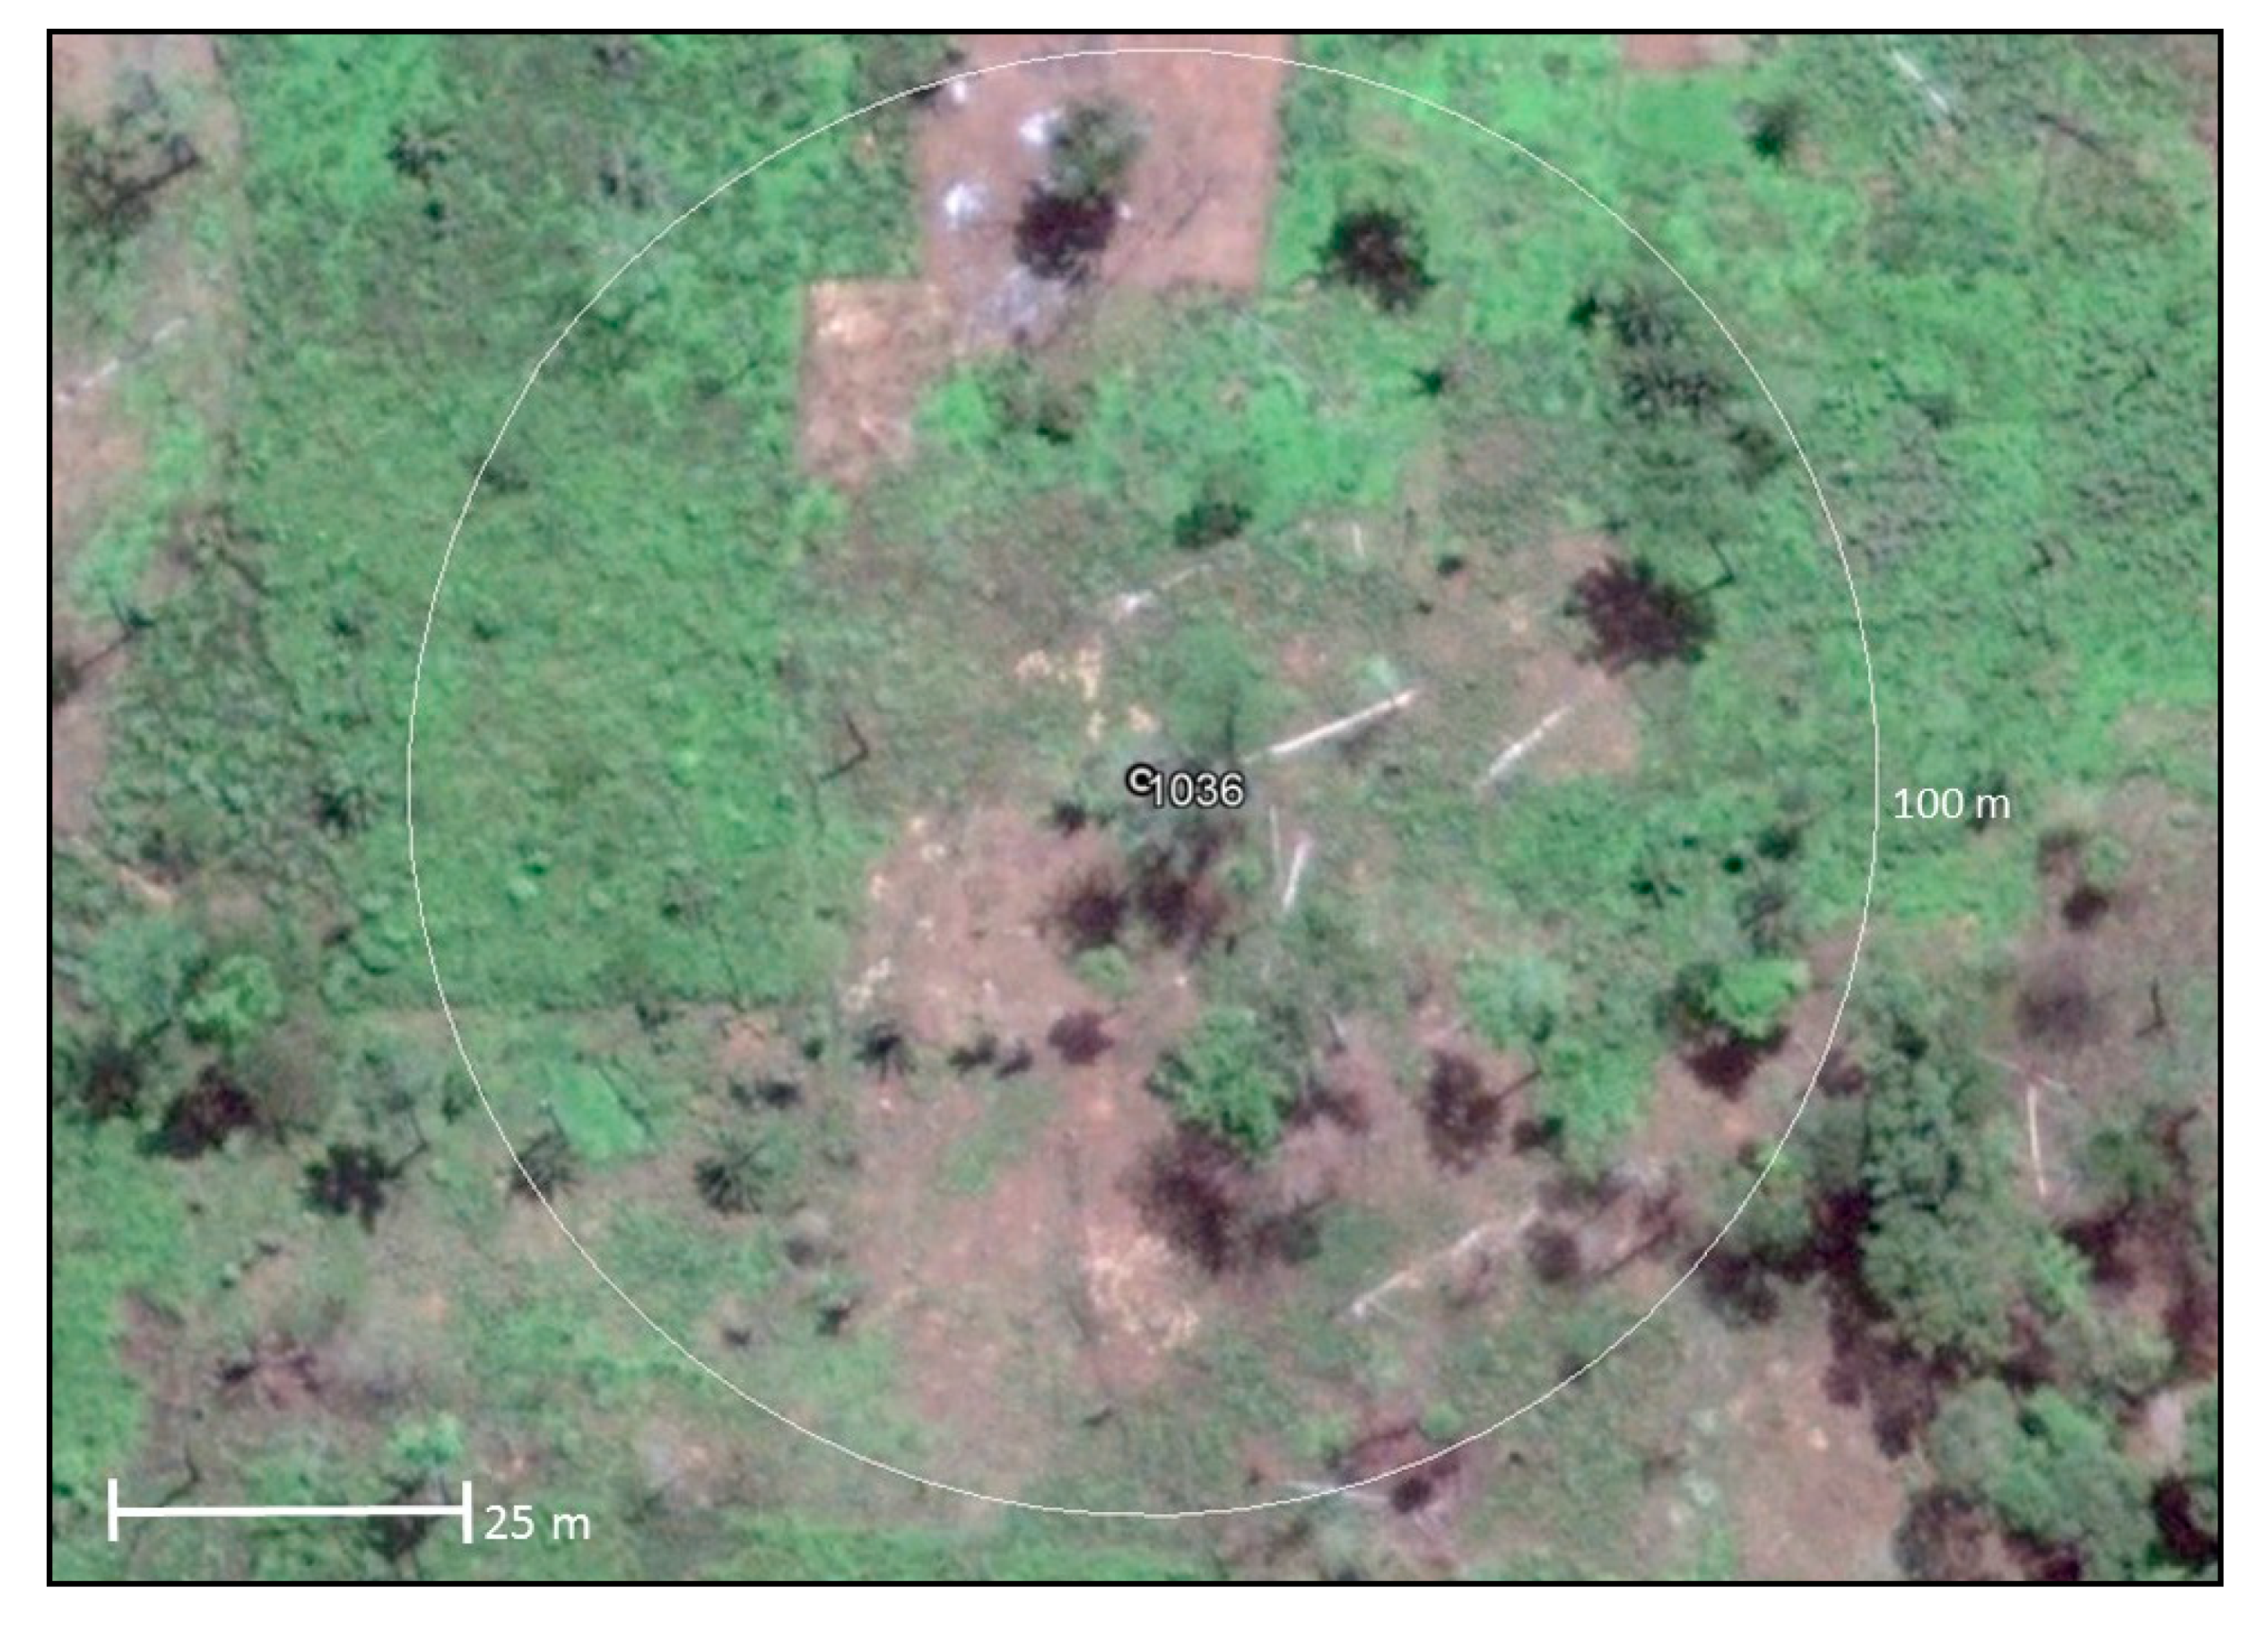
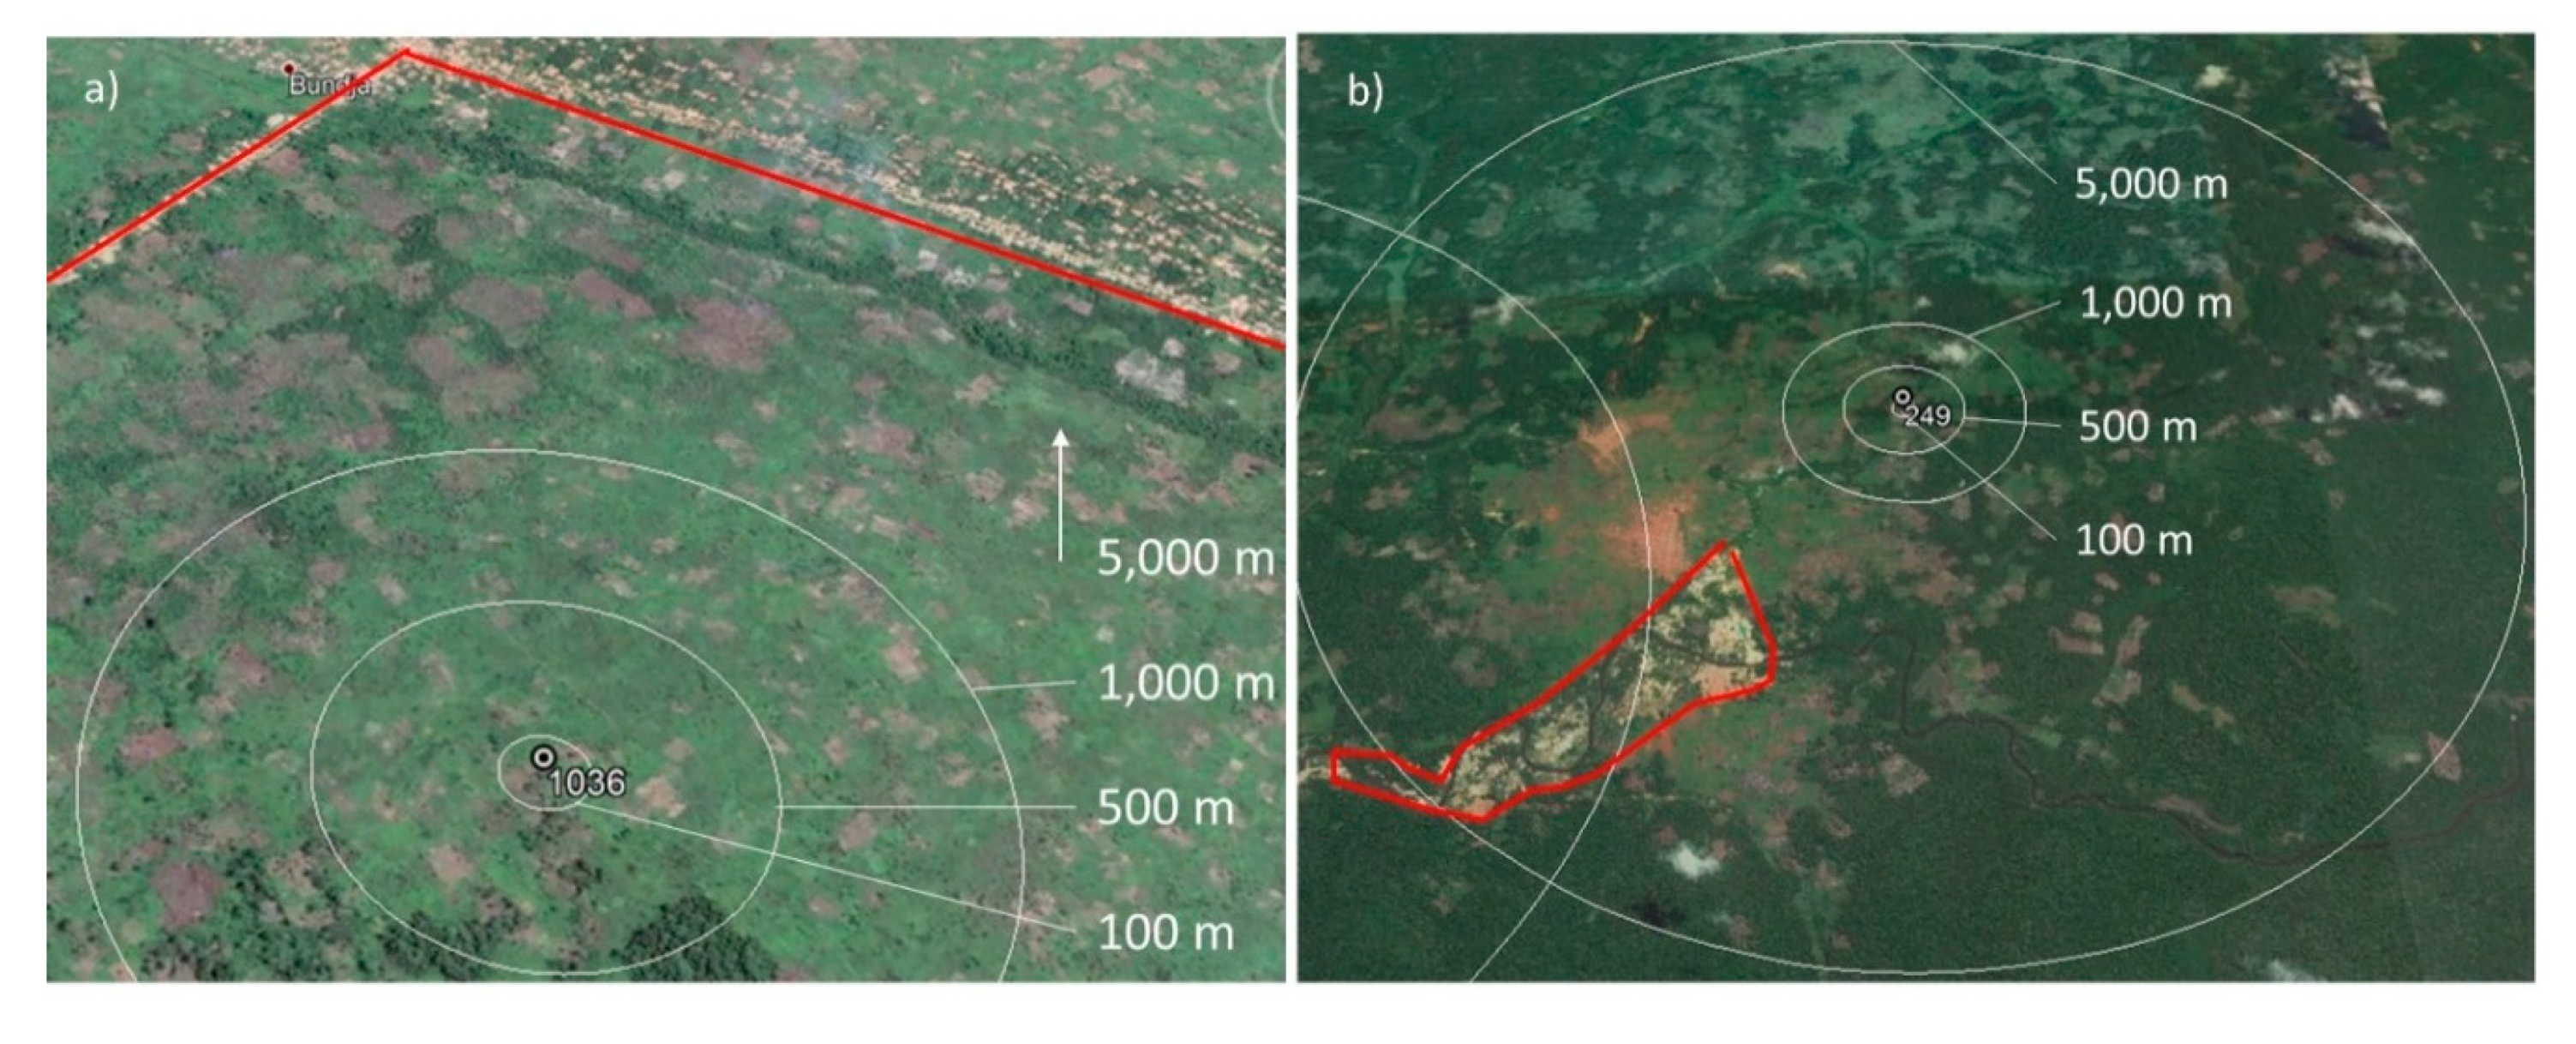
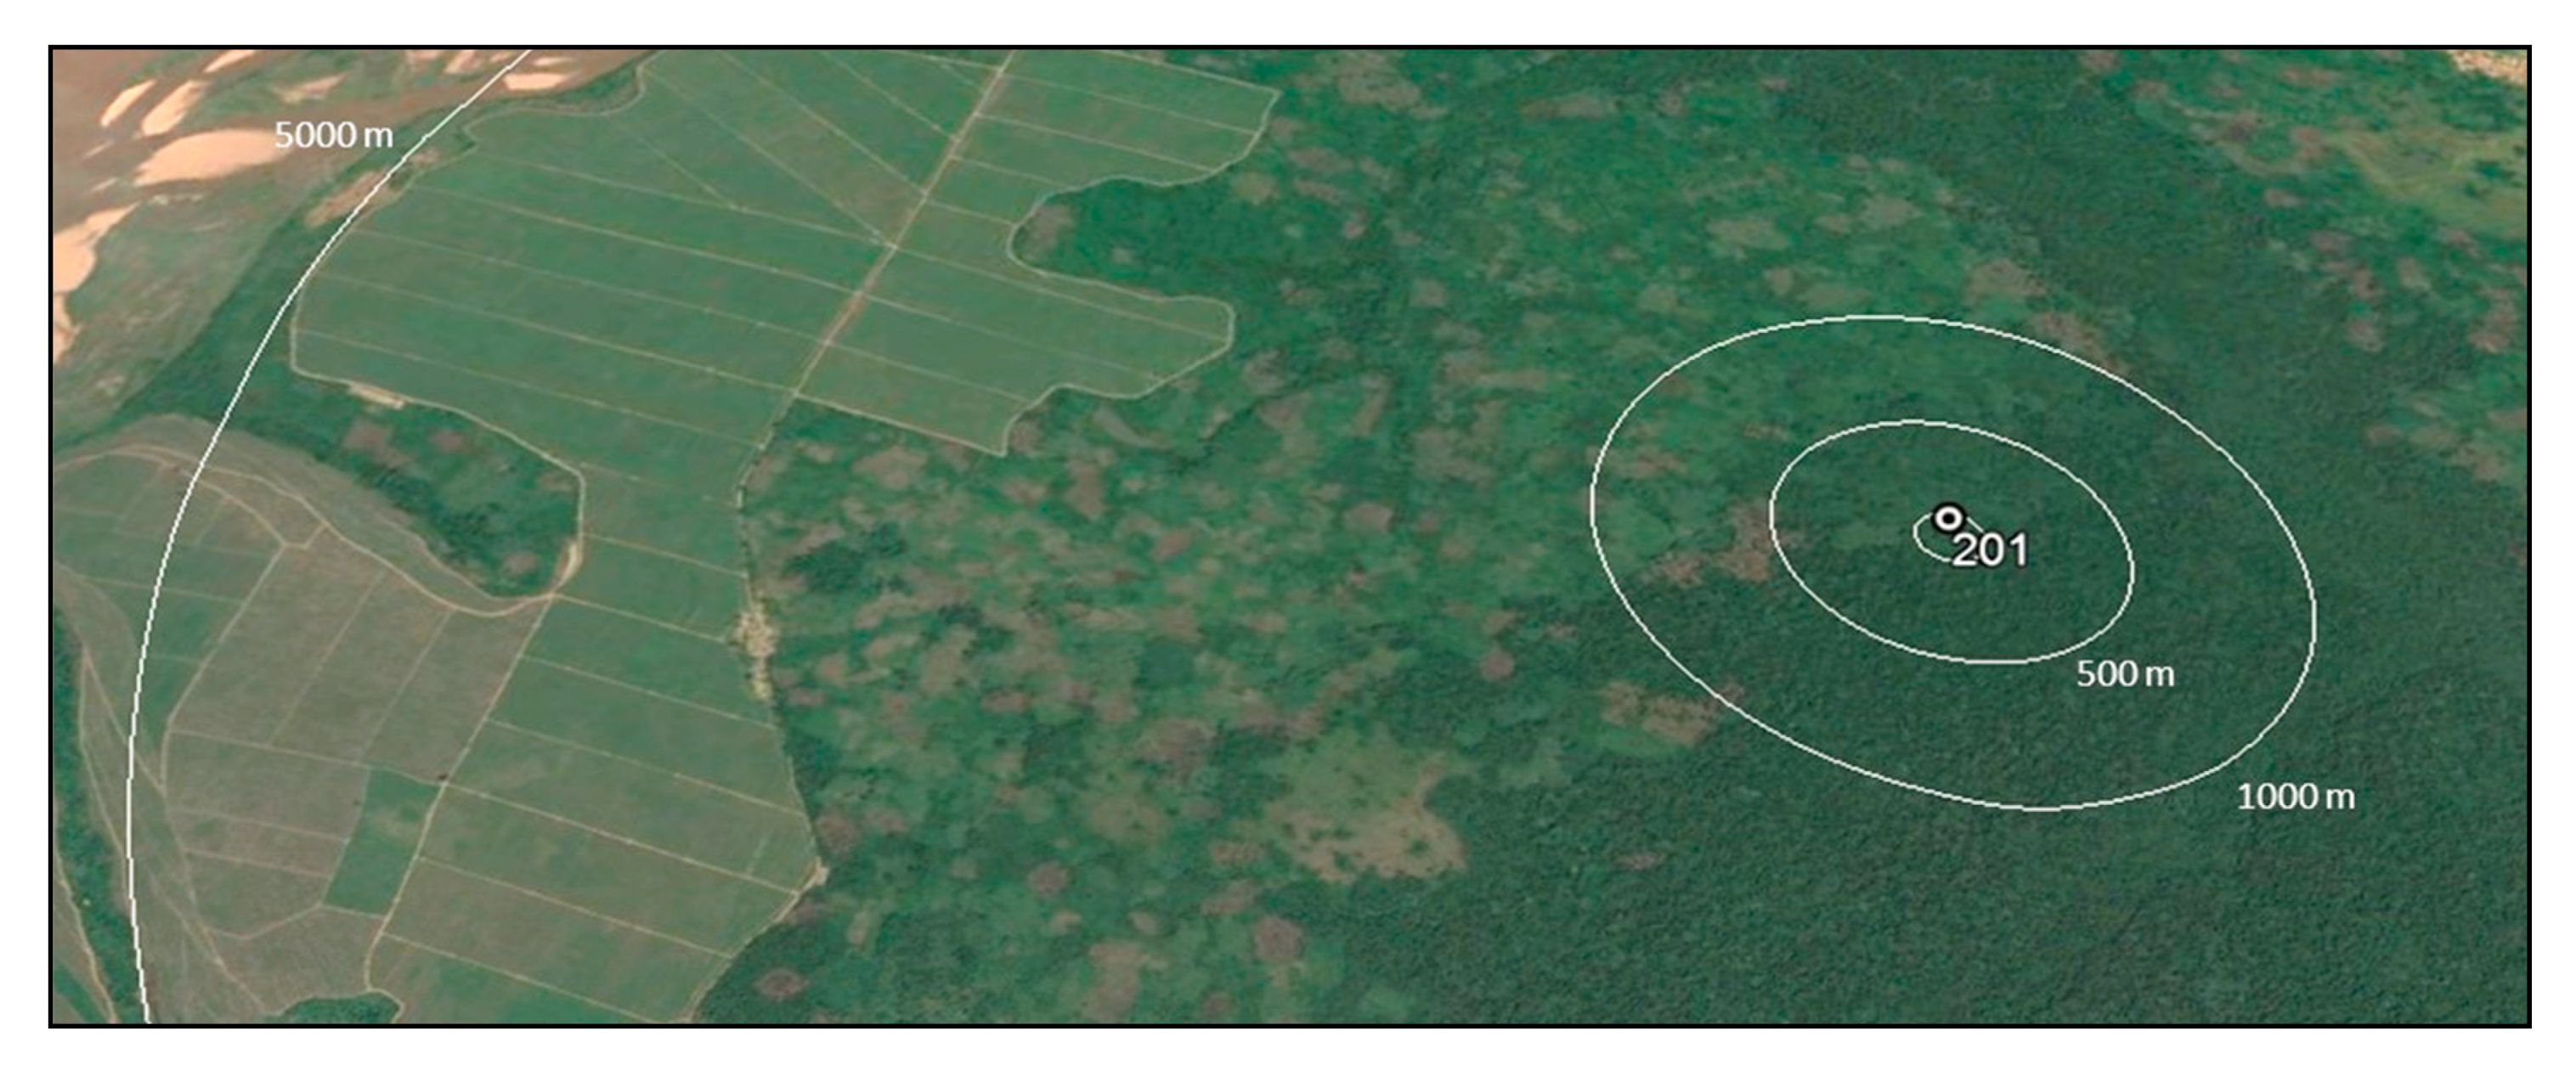
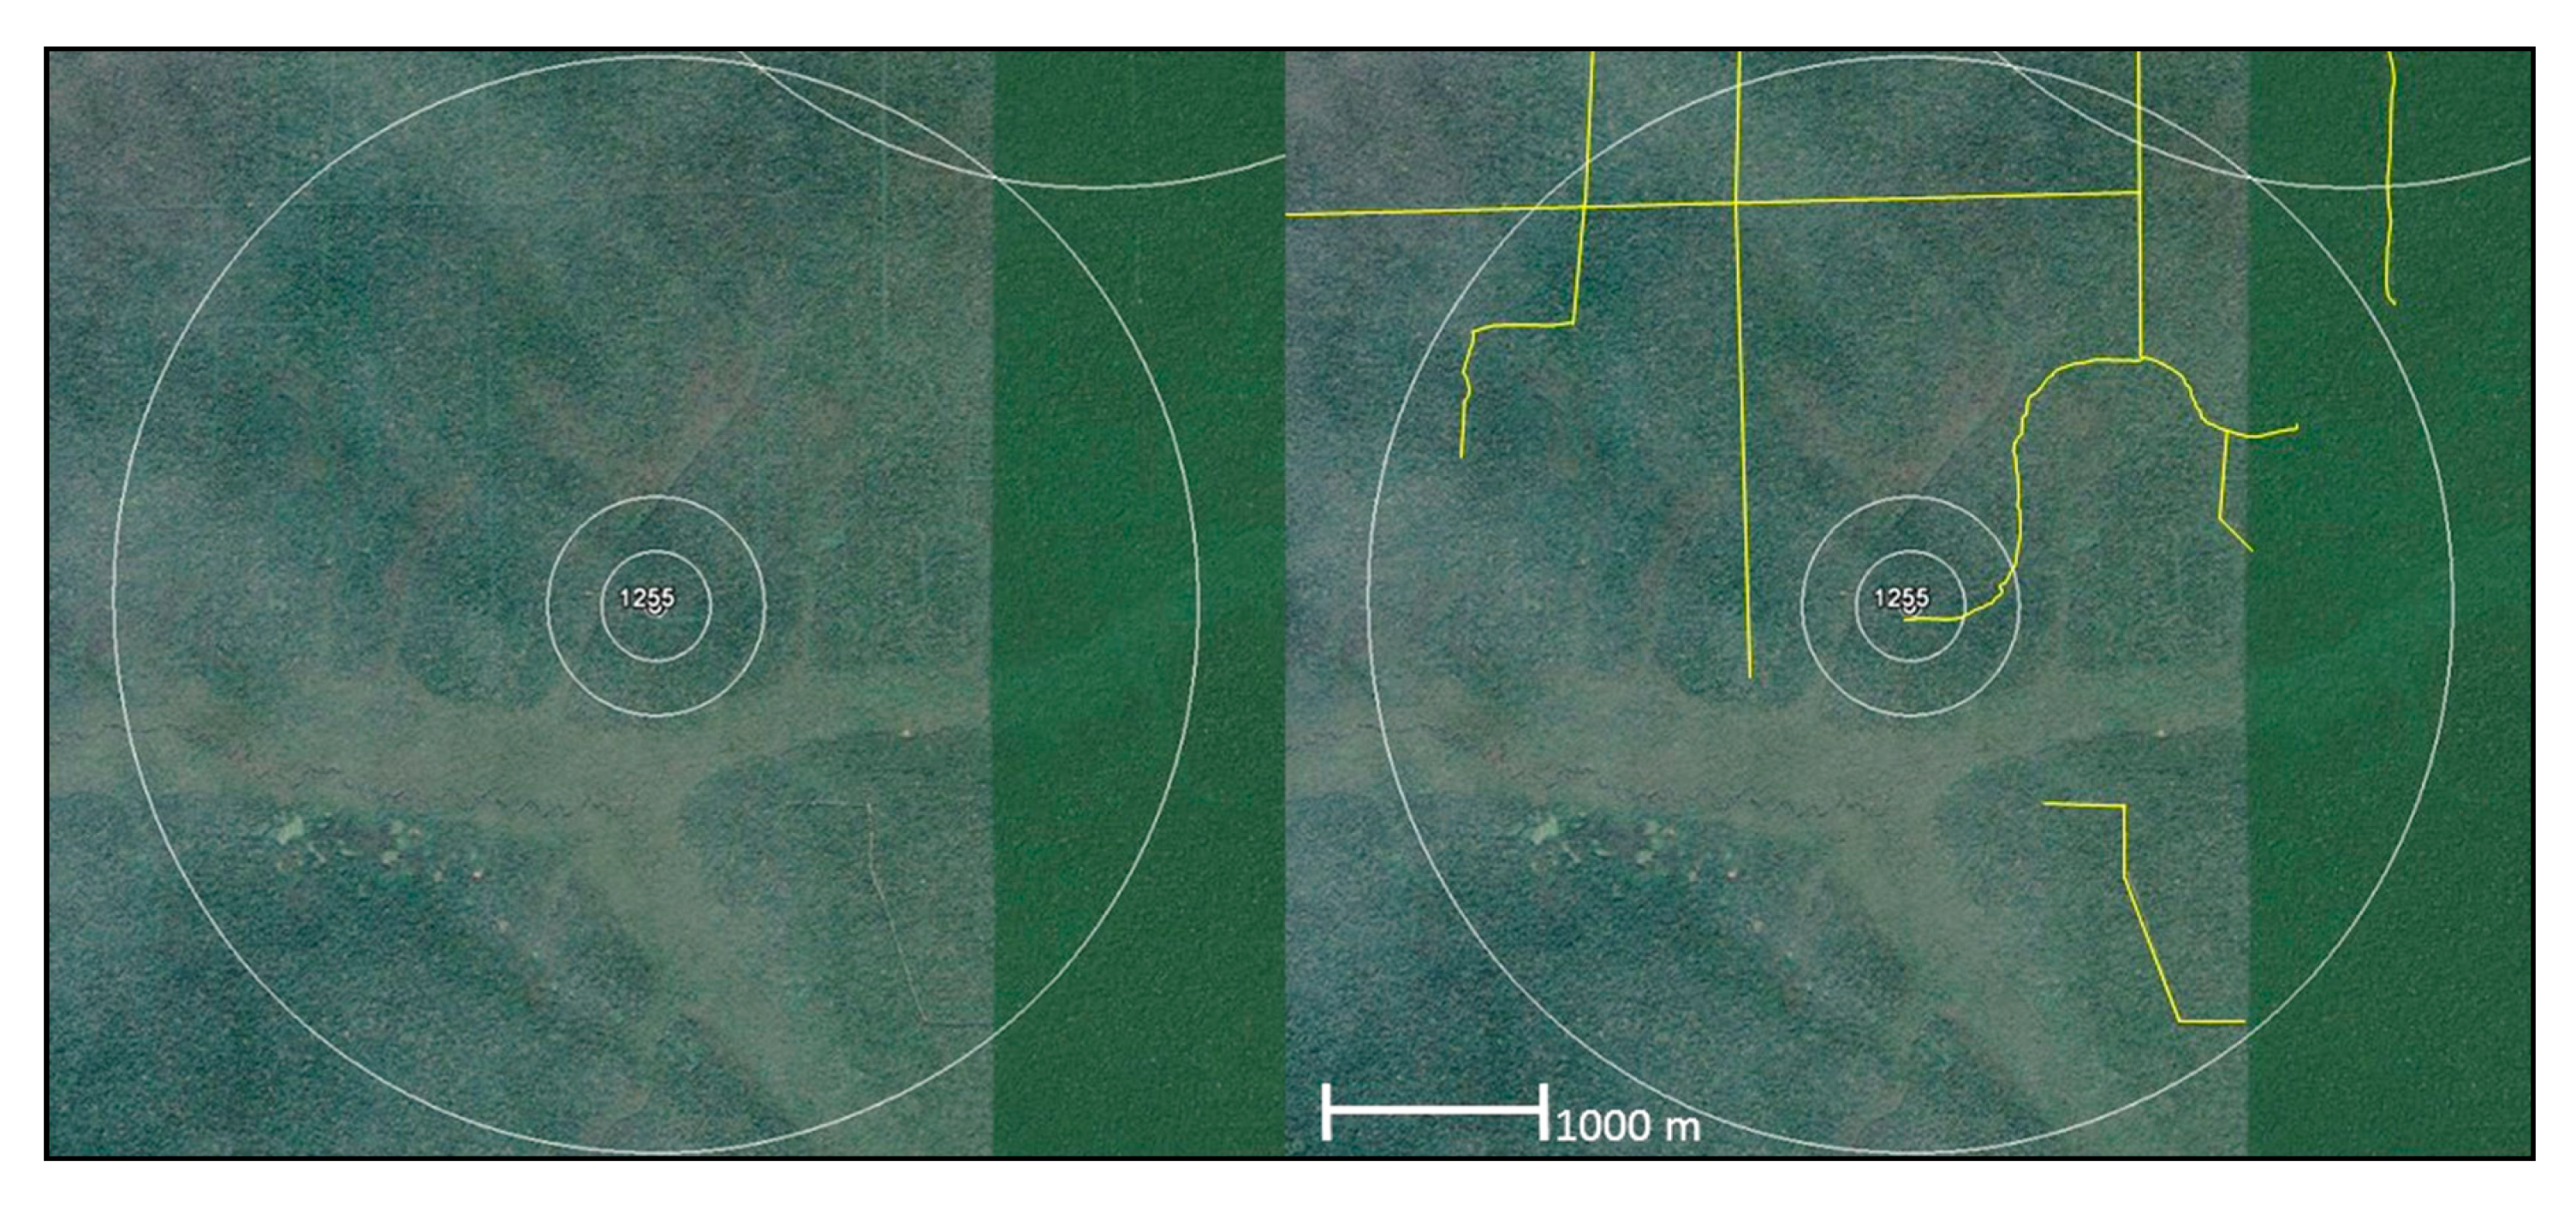
2.2. Sampling Design

The RCE and IFP areas sampled are within the area of interest (AOI) published in [13], defining the humid tropical forest block of the DRC (Figure 2). Sample points were chosen by simple random sampling from a population of GFC forest cover loss pixels within the RCE and IFP areas, then converted to vector points. For each of the two areas, 500 sample points were initially selected, and sample points were photo-interpreted using high spatial resolution imagery (Figure 2 and Figure 3). The list of sample points was randomly ordered and photo-interpreted in that random order. Finally, buffer areas around each sample point were also photo-interpreted to obtain a broader list of all the LCLU in proximity of the sample point, as explained below in Section 2.3. The methodology is outlined in Figure 4. Imagery was not available for photo-interpretation of all sample points, an issue revisited in the Discussion section. Our purpose was to describe the RCE and IFP holistically, and not to monitor individual LCLUC transitions at the pixel level. For example, a 2015 GFC forest cover loss pixel used to select the area to sample could be photo-interpreted with imagery from 2014. For our purposes this is acceptable as the collective sum of all the interpretations allows us to trade space for time and assert the quantitative LCLU percentages of the RCE and IFP, for the 15-year period of the study.

2.3. Image Interpretation Protocol

The legend for the photo-interpreted land cover and land use categories is shown in Table 1. It is composed of an initial set of classes that were previously photo-interpreted in [14], plus an additional set of classes that are only observable at the broader landscape scale investigated in this paper. Primary and mature secondary forests are not easily distinguished from one another, and young and old fallows are similarly difficult to distinguish from each other. For these classes, there is a continuum of vegetation maturity and species composition that requires its observation only through high resolution remote sensing but also benefits from ground truthing [14,25,46]. As we were not able to perform ground truthing, we instead opted to group these classes together when necessary, in the results.
The classes that require contextual, broader photo-interpretation in order to be distinguished include: gallery forests, commercial agriculture and logging concessions. A land cover category was assigned to each sample point, and the presence and spatial dominance of additional adjacent land cover types was assigned to each of four concentric circular buffer areas radiating around each sample point and comprising the following distances from the center point: 1st buffer: 1 m–100 m, 2nd buffer: 101 m–500 m, 3rd buffer: 501 m–1000 m and 4th buffer: 1001 m–5,000 m (Figure 5).
For each of the four buffer areas, the photo-interpreter recorded the first five most dominant land cover types within the buffer, yielding a matrix of up to 21 photo-interpreted land-cover observations for each sample point and its associated buffered areas (i.e., One land-cover class for the sample point centroid, and up to 20 classes in the four circular buffer areas). However, not all sample points had unique results for all 20 available slots for photo-interpretation in their buffers. For example, if a clearing (Figure 5 and Figure 6) was the interpreted class at the sample point centroid, and a settlement was observed in the 100 m buffer area, surrounded by only primary forest, meaning no other land cover class was observed throughout all the other buffer areas, then the photo interpreter recorded only the presence of these three unique land cover classes. The photo-interpreter in this case would enter the following information for the sample point: Slot 1: clearing, Slot 2: settlement, Slot 3: primary forest, Slots 4–21: primary forest Conversely, in those cases where there were more than five unique land cover types observed within the buffers, the interpreter recorded only the five most spatially dominant classes by visually separating each circular buffer into four quadrants, and interpreting the size (dominance) of each land cover type detected (Figure 5).
The class “rural complex” was used from the 100 m buffer outwards, when all the land cover types associated with the rural complex were detected within the buffer (i.e., clearings, active and fallow fields, and secondary and primary forest). Because of the minimum patch size of all these individual typologies of land cover, it was rare for them to all be present within the smallest buffer of 100 m, whereas this land cover mosaic was frequently found in all other buffer sizes. The presence of some land uses such as larger commercial land uses, roads, settlements and well established rural complex mosaics was easy to identify in the available multi-spectral imagery, even when photo-interpreting at smaller scales (Figure 7).

2.4. Estimating Proportion of Area

The results of the photo-interpretation were used to estimate the proportion of each land cover class within each of the RCE and IFP areas, and the proportion of area of large-scale commercial land uses such as plantations, logging, and mining co-located within 100 m, 500 m, 1 km, and 5 km buffers of the sample points. The estimated proportions were converted into estimates of the area of each land cover class, and the standard error of each estimated land cover class was also computed. The formulas are below.
The estimated proportion of area of land cover class i is:
p i = n i n
where n i = number of sample points identified as class i and n = the sample size. The estimated area of class i was provided by the following equation:
A i = A t o t × p i
where for RCE A t o t = 46,779 km2 (the total area of the RCE in the AOI in 2015) and for IFP A t o t = 25,428 km2 (the total area of the IFP in the AOI in 2015). Both the estimator of the proportion of area (pi) and the estimator of the area (Ai) of each class are unbiased estimators ([47], Chapter 3). The formula for estimating the variance of the estimated proportion was the following:
V ( p i ) = p i ( 1 p i ) n 1
The standard error formula for the estimated proportion of area of class i was:
S E ( p i ) = V ( p i )
The standard error for the estimated area of land cover class i is:
S E ( A i ) = A t o t × V ( p i )
The standard errors quantify the uncertainty or precision of the sample-based estimates. Clearly the standard error decreases as a function of the square root of the sample size n (e.g., a four-fold increase in sample size will halve the standard error) and the standard error also depends on pi.

3. Results

The total RCE area in 2015 was 46,779 km2 and the total area of IFP was 25,428 km2. These areas are composed of GFC-mapped forest cover loss areas in the period 2000–2015, together with “edge” primary and secondary forest and non-forest (Table 2) [13]. The area of GFC mapped forest cover loss for the 2000–2015 period within the RCE and IFP was 7338 km2 and 1137 km2 (16% and 3% of all GFC loss for the period), respectively, and occurred predominantly as primary forest loss. For reference, between 2000 and 2015, 36,905 km2 of GFC-mapped forest loss occurred within the established rural complex. The forest cover loss in the baseline area of established rural complex for 2000 was predominantly composed of secondary forest loss (81% of all GFC loss for the period).
The estimated percentages of the constituent land cover and land use components of the RCE and the IFP areas for 2000–2015 are shown in Table 2. The dominant land cover in the RCE is primary forest (34%), followed by secondary forest (29%), old fallows (14%), and clearings (9%). In the IFP, the dominant land cover is primary forest (41%), followed by secondary forest (22%), old fallows (10%), and clearings (9%). In the RCE, compared to the IFP, there is less primary forest (−7.5%), more secondary forest (+6.7%), more old fallows (+4%), and slightly less clearings (−0.3%) (see Table 2). The total percentage of shifting cultivation related land cover components (i.e., secondary forest, fallows, clearing, and active agriculture) in the RCE is 64% and in the IFP it is 51%. If we add the percentages of primary forest, respectively, in the RCE and IFP, the percentage of available land for future shifting cultivation is theoretically 98% in the RCE and 92% in the IFP. Clearings account for 9% of both the RCE and IFP.
With the above quantified percentages, and assuming the 9% clearing rate from 2000–2015 to be indicative of a theoretical annual clearing rate, every plot of available land in the RCE would take approximately 11 years to be cleared once (98%/9%) and 10 years in the IFP (93%/9%). Comparatively, in the established rural complex, the percentage of land used in the shifting cultivation cycle was found to be 76% and 11% was primary forest, meaning that 87% of the established rural complex was estimated to be available for future shifting cultivation [14]. With the derived annual clearing rate of 4.6% in the established rural complex, the theoretical reuse rate for all land to be cycled through the shifting cultivation cycle once, was found to be ~18 years [14]. The reason why an almost double forest clearing rate was found in the established rural complex compared to RCE and IFP is that the sample population for the RCE and IFP was comprised of only GFC forest cover loss pixels, whereas in the established rural complex it contained both GFC forest cover loss and also primary and secondary forest mapped in 2000.
However, even if we assume a lower clearing rate equal to the one found in the established rural complex (4.6%), then the reuse period of land in the RCE would be 21 years and 20 years in the IFP, compared to 18 years in the established rural complex. This means that despite percentages of primary forest as high as 41% in the IFP, and with the lowest average clearing rate observed [14], the temporal reuse period of land would still not be long enough for all fallows to reach “primary forest-like” maturity [46,48,49]. For fallows to transition to secondary forest and then eventually primary forest, several decades of growth are necessary in which both stand structure and species composition change. In the DRC, field observations estimate that this period begins after around 30 years from disturbance and a secondary forest stand may become indistinguishable from a primary one at around 50 years and beyond [46,48,49]. In sum, if all land in the RCE and IFP was available for shifting cultivation and considering clearing rates to be somewhere between 4.6% and 9%, then it would take between 11 and 21years for all available land to be cleared once.
The results of the LCLU proportions within the buffers of the sample points are similar in composition (Table 3). When considering their most proximate surroundings, as expected, the land cover adjacent to the IFPs is more pristine with fewer signs of anthropogenic activity. In the 100 m buffer of the IFPs, compared to that of the RCE area, active agriculture is more dominant and surrounded by a less established (younger) shifting cultivation mosaic (less clearings, active agriculture, fallows and secondary forest). In this area, we also find more settlements, logging, wetland forest, and woodlands than in the same 100 m buffer of the RCE. However, the estimated proportions for many of these rarer LCLU classes are within the uncertainty bounds defined by the standard errors (Table 3). In the entire 5 km of buffered area of the IFP, compared to that of the RCE, there is more primary forest throughout and there is less rural complex mosaic, including roads and settlements, more grassland, and more wetland forest. The inverse relationship between proximity to the rural complex and forest intactness is what would be expected and validates our stratification map [14] (Table 3).
The estimated percent of area in the RCE with commercial land uses within 5 km is 11.5% whereas in the IFP it is 8.8% (Table 3). Many sample points that occurred in primary forest areas were proximate to large anthropogenic disturbances such as areas of the rural complex, plantations, mining, and logging (Figure 8, Figure 9 and Figure 10). When mining was detected, it was within rural complex landscapes (Figure 11).

4. Data Issues

GE imagery was more frequently available in higher radiometric quality and spatial and temporal resolution in areas close to larger settlements and trunk roads. In more isolated areas, imagery was often Landsat-resolution only (30 m), sometimes either extremely bright or dark with cloud and haze cover. The percentage of sample points with no data in the rural complex area was 45%, whereas in isolated forest perforations no data occurred for 56% of the sample points. However, if we consider only the sample points within a 15 km area radiating from the established rural complex, then the no data percentage of the sample becomes 49%. In other words, the no data percentage of the sample is above 49% only for the most remote and isolated areas (Figure 12). As illustrated in Figure 13, the sample points for which imagery is not available are not geographically clustered and appear to be missing at random, therefore providing us some assurance that the absence of data is not associated with any feature we are investigating, such as land cover types. Furthermore, the imagery available in the RCE was also more recent, as 58% of it was taken since 2015, versus only 45% in the IFP. This indicates that GE has more recent imagery closer to settlements. Practitioners should recognize and consider these caveats in sample-based studies that use the GE platform to photo-interpret land cover.
High resolution satellite imagery acquisitions are needed to accurately interpret land cover. Planet labs’ aspirations to acquire and provide such imagery [50,51], as well as datasets from DigitalGlobe [45] could prove to be useful for the photo-interpretation of land cover over large areas [52]. However, the benefit of acquiring and processing commercial high-resolution imagery must be substantial to overcome the limitations of coarser resolution free imagery such as Landsat. This is especially relevant in large-scale country and regional studies. Novel cloud-based solutions for accessing high resolution imagery include DigitalGlobe’s EV-WHS, which operates under the auspices of the NextView license agreement to make imagery available to U.S. government-affiliated researchers through the NGA. However, this platform does not facilitate efficient use for photo-interpretation of hundreds of sample points in the cloud, as it is oriented instead towards a standard manual “select and download” paradigm. Other platforms like DigitalGlobe’s GBDX might fulfill these requirements, but it is only available at a cost. Conversely, nascent initiatives such as Radiant Earth Foundation’s earth observation platform will provide free imagery, but the efficiency for photo-interpretation and adequacy of the available image archive have to be tested [53]. The efficiency of the photo-interpretation protocol could also be improved by using specific and custom tools, like Collect Earth, in cases where more than one photo-interpreter is used [54].

5. Discussion

Currently shifting cultivation remains the primary proximate driver of deforestation in the DRC. The directly-observed impacts of commercial land uses, interpreted from satellite remote sensing, are dwarfed by the reliance of the population on shifting cultivation and associated gathering of NTFP for food, building materials and energy needs, both within the rural complex mosaic and outside of it in more pristine primary forest. These results echo what was recently found by [44].
Photo-interpretation of hundreds of images reinforces our belief that in the DRC’s tropical humid forest block some land uses with small spatial footprints are not directly observable, even in the highest resolution satellite imagery, (e.g., the harvesting of fuelwood, hunting, gathering, and charcoal production). Counterintuitively, we found that the LCLUs with large spatial extents, such as commercial plantations, mining and selective logging also have spatial footprints whose direct observation from remote sensing is not straightforward. While at first these large commercial land uses seem to have clear cut boundaries, they instead have often a heterogenous and fragmented boundary and contain within their footprint a mix of small-holder land uses that are associated with shifting cultivation.
While only 0.4%–0.5% of the area of RCE and IFP is strictly co-located with commercial land uses like mining, logging, or plantations, an estimated 8.9%–11.7% of the RCE and IFP area has large-scale commercial land uses within 5 km or closer. These results therefore support the conclusion that commercial land uses, such as logging, mining and plantations, might influence forest cover loss in a proportion that could be much larger than what is directly observable in strictly per-pixel sample point photo-interpretation.
The hypothesis that commercial land uses in the DRC have a larger proportion of influence on forest cover loss than what is directly observable in per-pixel satellite remote sensing is supported by several studies. For example, [38] observed how mining operations provide livelihoods for miners but also for their families and entire support communities that are present because livelihoods are possible within a context of extreme poverty. These services include transport, catering, and leisure, so much so that in some cases the internal economy is dependent on the mined minerals for business transactions, with gold being used also to pay a tax to the village chief [38]. Obviously, the food, energy, and building materials needed for these worker populations comes from shifting cultivation and NTFP. In another study it was found that each household managed 1–3 active fields along with 5–10 plots that are at different phases of fallow, for about 5–10 ha of land in total [23]. [38] also found that often, new rural complex areas are formed when transportation routes are established to reach areas where natural resources are extracted, such as in the north-east of Kisangani, where the informal (smuggling) of mined minerals has been cited as the main driver for rural complex expansion [38].
Results validate our map of the rural complex, the RCE and the IFP. Indeed, throughout the sample buffer area and up to 5 km around it, the IFP has more primary forest and less rural complex areas, including roads and larger settlements. The RCE has a larger proportion of area of LCLU classes associated with longer-term shifting cultivation agricultural landscapes, such as active agriculture, fallows and secondary forest. The RCE also has more commercial plantations. In contrast, the IFP has a greater proportion of area of primary forest, more individual settlements (bush camps and other outposts), and more logging areas.
Agriculture intensification is often proposed in the DRC to be a ‘land sparing’ alternative to shifting cultivation, but the academic debate regarding this continues [21,55]. Some aid organizations active in the DRC believe that supporting small farmers might help reduce the risk of larger scale deforestation carried out by loggers, large-scale plantations, and other investors. This results in aid projects proposing alternatives to development. But while some farmers appreciate alternatives offered, others are less optimistic, especially women, who expressed concerns in a series of interviews for a USAID project that many alternatives require more labor, which they are unable or unwilling to provide [23].
REDD+ aims to curb deforestation and habitat reduction, while at the same time providing a source of income for communities, monetizing and therefore, it is thought, protecting the common community forests. Yet, national REDD+ policies rarely include the complexity of shifting cultivation within rural complex LCLU mosaics, instead adopting a simple land-sparing hypothesis [56]. REDD+ has been criticized for being another type of “land grabbing” [57], sometimes referred to as “green-grabbing”: a land acquisition and transaction that works within inherently corrupt socio-political systems where the rule of law is not adequately entrenched to guarantee that the monetary and power transactions between private and public groups occur transparently and fairly [58]. Some authors have asked whether REDD+ projects in the DRC are merely a distraction from the goal of avoiding future large-scale industrial plantations and logging for world markets, such as palm oil [59]. The most accurate LCLU estimates are needed in order to incorporate REDD+ in effective and fair land use planning.
Future research should examine the density of the rural complex and its comparative size relative to the settlements it surrounds, as this characteristic can be an indicator of degradation of the rural complex area and an indicator of food security. Households that are closer together participate in inter-household cooperation and are able to improve food and nutrition security, whereas more isolated households (households with high pressure on productive individuals) are at risk for food insecurity and malnutrition [60]. Populations in the cities attract resources produced in rural areas and transported to these larger markets by road and river. A study found that 75%–95% of bushmeat harvested in rural areas is commonly consumed by hunters and neighbors, whereas 80% of bushmeat hunted within 10 km of urban areas is sold to markets [61].
On top of these concerns, the effects of conflict on land degradation have been shown to persist well after conflict [34,35]. Local research suggests conflict leads to militia rule, higher levels of charcoal production for refugee camps, and illegal logging and mining [62]. In the DRC, an estimated more than 200 people have died protecting natural parks [62,63]. Yet, conflict itself also counteracts on impacts on deforestation, for example making forests less viable for large-scale commercial operations by creating serious safety concerns and logistical barriers. Land-sparing therefore does not work alone in situations where feeble rule of law, large population growth, and displacement and conflict all make people compete for land and erode remote forest areas.

6. Conclusions

Between 2000 and 2015, the total percentage of shifting cultivation land cover components (secondary forest, fallows, clearing, and active agriculture) in the RCE was 64% and in the IFP 51%. If the proportion of primary forest area is added to the existing shifting cultivation, then the proportion of available land for future shifting cultivation is theoretically 98% in the RCE and 92% in the IFP. Clearings account for 9% of both the RCE and IFP. During the study period, 81% of GFC-observed forest cover loss occurred in the established rural complex, 16% in the RCE, and 3% in IFP. Commercial land uses occupied a very small proportion of the RCE (0.4%) and of the IFP (0.5%). The combined percentage of area (0.9%) of large-scale commercial land uses in these areas of new primary forest cover loss is therefore even lower than the 2.2% found in the baseline established rural complex for 2000 [14].
However, we caution that this result does not mean that there is considerably lower commercial land use further away from the established rural complex. Instead, we suggest that these land uses are dwarfed by the reliance of DRC’s population on shifting cultivation and the lack of infrastructure that allows core forest areas to remain impractical or impossible to exploit for natural resources. A more accurate accounting of the role of commercial land uses is obtained from a landscape-scale investigation, in which we found that there were commercial land uses within 5 km of the forest cover loss areas in 11.5% of the RCE and 8.8% of the IFP, a much larger percentage than the 0.4%–0.5% observed if only taking into consideration the sample point centroids.
If for example, the process in this study were to be repeated subsequently at decadal intervals, the results would inform the decadal change of LCLU composition of the studied areas. The resulting trends would inform land use planning quantitatively, yet also contextualizing forest cover loss at the broader landscape scale.
Multi-scale studies of deforestation, like the one presented here, are seldom performed because it is difficult to obtain consistent datasets, particularly at local scales [42]. “Results reveal that given lack of cross scale studies, policy makers are lacking context specific relevant information at local scales needed to design efficient effective and equitable policies” [42]. To effectively intervene in LCLUC trajectories, a mere description of patterns and identification of causal effects does not suffice [42]. Therefore, the only way to correctly internalize the economic, social, and environmental effects of large-scale commercial operations such as logging, plantations and mining, is to contextualize these activities within their landscapes, and to attempt to include the forest cover loss and degradation that they cause and enable, into their footprints.

Author Contributions

Conceptualization, G.M., M.H. and P.P.; methodology, G.M., M.H., S.S., A.T. and P.P.; investigation, G.M.; writing—original draft preparation, G.M.; writing—review and editing, G.M., M.H., S.S. and A.T.; All authors have read and agreed to the published version of the manuscript.

Acknowledgments

Support for this study was provided by USAID’s Central Africa Regional Program for the Environment (CARPE) and NASA Goddard Space Flight Center (GSFC) with grant NNX14AR46G.

Conflicts of Interest

The authors declare no conflict of interest.

References

  1. World Bank World Development Indicators. Available online: http://databank.worldbank.org/data/views/reports/reportwidget.aspx?Report_Name=CountryProfile&Id=b450fd57&tbar=y&dd=y&inf=n&zm=n&country=COD (accessed on 27 June 2018).
  2. UNDP Human Development Report 2016: Human Development for Everyone. 2017. Available online: http://hdr.undp.org/sites/default/files/2016_human_development_report.pdf (accessed on 27 June 2018).
  3. World Bank Democratic Republic of Congo Overview. Available online: http://www.worldbank.org/en/country/drc/overview (accessed on 8 October 2017).
  4. UNOCHA DRC Humanitarian Response Plan: 2018 Update. Available online: https://reliefweb.int/sites/reliefweb.int/files/resources/MAJ_DRC_HRP_2017_En.pdf (accessed on 27 June 2018).
  5. Kharas, H.; Rogerson, A. Global Development Trends and Challenges: Horizon 2025 Revisited; Overseas Development Institute (ODI): London, UK, 2017; p. 52. Available online: https://www.odi.org/sites/odi.org.uk/files/resource-documents/11873.pdf (accessed on 27 June 2018).
  6. DeWasseige, C. The Forests of the Congo Basin—Forests and climate change; Weyrich: Neufchâteau, Belgium, 2015; p. 128. [Google Scholar]
  7. Mayaux, P.; Richards, T.; Janodet, E. A vegetation map of Central Africa derived from satellite imagery. J. Biogeogr. 1999, 26, 353–366. [Google Scholar] [CrossRef]
  8. Achard, F.; Eva, H.D.; Stibig, H.-J.; Mayaux, P.; Gallego, J.; Richards, T.; Malingreau, J.-P. Determination of Deforestation Rates of the World’s Humid Tropical Forests. Science 2002, 297, 999–1002. [Google Scholar] [CrossRef] [PubMed] [Green Version]
  9. Ernst, C.; Mayaux, P.; Verhegghen, A.; Bodart, C.; Christophe, M.; Defourny, P. National forest cover change in Congo Basin: Deforestation, reforestation, degradation and regeneration for the years 1990, 2000 and 2005. Glob. Chang. Biol. 2013, 19, 1173–1187. [Google Scholar] [CrossRef]
  10. Hansen, M.C.; Stehman, S.V.; Potapov, P.V. Quantification of global gross forest cover loss. Proc. Natl. Acad. Sci. USA 2010, 107, 8650–8655. [Google Scholar] [CrossRef] [Green Version]
  11. Potapov, P.V.; Turubanova, S.A.; Hansen, M.C.; Adusei, B.; Broich, M.; Altstatt, A.; Mane, L.; Justice, C.O. Quantifying forest cover loss in Democratic Republic of the Congo, 2000–2010, with Landsat ETM + data. Remote Sens. Environ. 2012, 122, 106–116. [Google Scholar] [CrossRef]
  12. Hansen, M.C.; Potapov, P.V.; Moore, R.; Hancher, M.; Turubanova, S.A.; Tyukavina, A.; Thau, D.; Stehman, S.V.; Goetz, S.J.; Loveland, T.R.; et al. High-Resolution Global Maps of 21st-Century Forest Cover Change. Science 2013, 342, 850–853. [Google Scholar] [CrossRef] [Green Version]
  13. Molinario, G.; Hansen, M.C.; Potapov, P.V. Forest cover dynamics of shifting cultivation in the Democratic Republic of Congo: A remote sensing-based assessment for 2000–2010. Environ. Res. Lett. 2015, 10, 094009. [Google Scholar] [CrossRef]
  14. Molinario, G.; Hansen, M.C.; Potapov, P.V.; Tyukavina, A.; Stehman, S.; Barker, B.; Humber, M. Quantification of land cover and land use within the rural complex of the Democratic Republic of Congo. Environ. Res. Lett. 2017, 12, 104001. [Google Scholar] [CrossRef] [Green Version]
  15. Van Vliet, N.; Mertz, O.; Heinimann, A.; Langanke, T.; Pascual, U.; Schmook, B.; Adams, C.; Schmidt-Vogt, D.; Messerli, P.; Leisz, S.; et al. Trends, drivers and impacts of changes in swidden cultivation in tropical forest-agriculture frontiers: A global assessment. Glob. Environ. Chang. 2012, 22, 418–429. [Google Scholar] [CrossRef]
  16. Maniatis, D.; Mollicone, D. Options for sampling and stratification for national forest inventories to implement REDD+ under the UNFCCC. Carbon Balance Manag. 2010, 5, 9. [Google Scholar] [CrossRef] [Green Version]
  17. Bucki, M.; Cuypers, D.; Mayaux, P.; Achard, F.; Estreguil, C.; Grassi, G. Assessing REDD+ performance of countries with low monitoring capacities: The matrix approach. Environ. Res. Lett. 2012, 7, 014031. [Google Scholar] [CrossRef]
  18. Rudel, T.; Roper, J. Regional patterns and historical trends in tropical deforestation, 1976-1990: A qualitative comparative analysis. Ambio 1996, 25, 160–166. [Google Scholar]
  19. Mather, A.S.; Needle, C.L.; Fairbairn, J. The human drivers of global land cover change: The case of forests. Hydrol. Process. 1998, 12, 1983–1994. [Google Scholar] [CrossRef]
  20. Geist, H.J.; Lambin, E.F. Proximate Causes and Underlying Driving Forces of Tropical Deforestation. BioScience 2002, 52, 143–150. [Google Scholar] [CrossRef]
  21. Ickowitz, A. Shifting Cultivation and Deforestation in Tropical Africa: Critical Reflections. Dev. Chang. 2006, 37, 599–626. [Google Scholar] [CrossRef]
  22. Ickowitz, A.; Slayback, D.; Asanzi, P.; Nasi, R. Agriculoture and Deforestation in the Democratic Republic of Congo: A Synthesis of the Current State of Knowledg; CIFOR: Bogor, Indonesia, 2015. [Google Scholar]
  23. Pollini, J. Shifting Cultivation, Gender, and REDD+ in Cameroon and the Democratic Republic of the Congo; United States Agency for International Development: Arlington, VA, USA, 2014. [Google Scholar]
  24. Skole, D.; Tucker, C. Tropical Deforestation and Habitat Fragmentation in the Amazon: Satellite Data from 1978 to 1988. Science 1993, 260, 1905–1910. [Google Scholar] [CrossRef] [Green Version]
  25. Broadbent, E.N.; Asner, G.P.; Keller, M.; Knapp, D.E.; Oliveira, P.J.C.; Silva, J.N. Forest fragmentation and edge effects from deforestation and selective logging in the Brazilian Amazon. Biol. Conserv. 2008, 141, 1745–1757. [Google Scholar] [CrossRef]
  26. Luyssaert, S.; Schulze, E.-D.; Börner, A.; Knohl, A.; Hessenmöller, D.; Law, B.E.; Ciais, P.; Grace, J. Old-growth forests as global carbon sinks. Nature 2008, 455, 213–215. [Google Scholar] [CrossRef]
  27. Balmford, A.; Bruner, A.; Cooper, P.; Costanza, R.; Farber, S.; Green, R.E.; Jenkins, M.; Jefferiss, P.; Jessamy, V.; Madden, J.; et al. Economic Reasons for Conserving Wild Nature. Science 2002, 297, 950–953. [Google Scholar] [CrossRef] [Green Version]
  28. Potapov, P.; Hansen, M.C.; Laestadius, L.; Turubanova, S.; Yaroshenko, A.; Thies, C.; Smith, W.; Zhuravleva, I.; Komarova, A.; Minnemeyer, S.; et al. The last frontiers of wilderness: Tracking loss of intact forest landscapes from 2000 to 2013. Sci. Adv. 2017, 3, e1600821. [Google Scholar] [CrossRef] [Green Version]
  29. Mollicone, D.; Achard, F.; Federici, S.; Eva, H.D.; Grassi, G.; Belward, A.; Raes, F.; Seufert, G.; Stibig, H.-J.; Matteucci, G.; et al. An incentive mechanism for reducing emissions from conversion of intact and non-intact forests. Clim. Chang. 2007, 83, 477–493. [Google Scholar] [CrossRef]
  30. Potapov, P.; Yaroshenko, A.; Turubanova, S.; Dubinin, M.; Laestadius, L.; Thies, C.; Aksenov, D.; Egorov, A.; Yesipova, Y.; Gluskov, I.; et al. Mapping the world’s intact forest landscapes by remote sensing. Ecol. Soc. 2008, 13, 51. [Google Scholar] [CrossRef] [Green Version]
  31. Southworth, J.; Marsik, M.; Qiu, Y.; Perz, S.; Cumming, G.; Stevens, F.; Rocha, K.; Duchelle, A.; Barnes, G. Roads as Drivers of Change: Trajectories across the Tri-National Frontier in MAP, the Southwestern Amazon. Remote Sens. 2011, 3, 1047–1066. [Google Scholar] [CrossRef] [Green Version]
  32. Ibisch, P.L.; Hoffmann, M.T.; Kreft, S.; Pe’er, G.; Kati, V.; Biber-Freudenberger, L.; DellaSala, D.A.; Vale, M.M.; Hobson, P.R.; Selva, N. A global map of roadless areas and their conservation status. Science 2016, 354, 1423–1427. [Google Scholar] [CrossRef]
  33. Damania, R.; Wheeler, D. Road Improvement and Deforestation in the Congo Basin Countries. 2015. Available online: http://documents.worldbank.org/curated/en/762671467986281150/pdf/WPS7274.pdf (accessed on 27 June 2018).
  34. Nackoney, J.; Molinario, G.; Potapov, P.; Turubanova, S.; Hansen, M.C.; Furuichi, T. Impacts of civil conflict on primary forest habitat in northern Democratic Republic of the Congo, 1990–2010. Biol. Conserv. 2014, 170, 321–328. [Google Scholar] [CrossRef]
  35. Butsic, V.; Baumann, M.; Shortland, A.; Walker, S.; Kuemmerle, T. Conservation and conflict in the Democratic Republic of Congo: The impacts of warfare, mining, and protected areas on deforestation. Biol. Conserv. 2015, 191, 266–273. [Google Scholar] [CrossRef]
  36. Lambin, E.F.; Turner, B.L.; Geist, H.J.; Agbola, S.B.; Angelsen, A.; Bruce, J.W.; Coomes, O.T.; Dirzo, R.; Fischer, G.; Folke, C.; et al. The causes of land-use and land-cover change: Moving beyond the myths. Glob. Environ. Chang. 2001, 11, 261–269. [Google Scholar] [CrossRef]
  37. Rudel, T.K.; Coomes, O.T.; Moran, E.; Achard, F.; Angelsen, A.; Xu, J.; Lambin, E. Forest transitions: Towards a global understanding of land use change. Glob. Environ. Chang. 2005, 15, 23–31. [Google Scholar] [CrossRef]
  38. Geenen, S. Relations and regulations in local gold trade networks in South Kivu, Democratic Republic of Congo. J. East. Afr. Stud. 2011, 5, 427–446. [Google Scholar] [CrossRef]
  39. Acker, F.V. Where did all the land go? Enclosure & social struggle in Kivu (D.R.Congo). Rev. Afr. Polit. Econ. 2005, 32, 79–98. [Google Scholar]
  40. Asner, G.P.; Broadbent, E.N.; Oliveira, P.J.C.; Keller, M.; Knapp, D.E.; Silva, J.N.M. Condition and fate of logged forests in the Brazilian Amazon. Proc. Natl. Acad. Sci. USA 2006, 103, 12947–12950. [Google Scholar] [CrossRef] [PubMed] [Green Version]
  41. Wilkie, D.S.; Carpenter, J.F. Bushmeat hunting in the Congo Basin: An assessment of impacts and options for mitigation. Biodivers. Conserv. 1999, 8, 927–955. [Google Scholar] [CrossRef]
  42. Moonen, P.C.J.; Verbist, B.; Schaepherders, J.; Bwama Meyi, M.; Van Rompaey, A.; Muys, B. Actor-based identification of deforestation drivers paves the road to effective REDD+ in DR Congo. Land Use Policy 2016, 58, 123–132. [Google Scholar] [CrossRef]
  43. Akkermans, T.; Van Rompaey, A.; Van Lipzig, N.; Moonen, P.; Verbist, B. Quantifying successional land cover after clearing of tropical rainforest along forest frontiers in the Congo Basin. Phys. Geogr. 2013, 34, 417–440. [Google Scholar] [CrossRef] [Green Version]
  44. Tyukavina, A.; Hansen, M.C.; Potapov, P.; Parker, D.; Okpa, C.; Stehman, S.V.; Kommareddy, I.; Turubanova, S. Congo Basin forest loss dominated by increasing smallholder clearing. Sci. Adv. 2018, 4, eaat2993. [Google Scholar] [CrossRef] [Green Version]
  45. Neigh, C.S.R.; Masek, J.G.; Nickeson, J.E. High-Resolution Satellite Data Open for Government Research. Eos Trans. Am. Geophys. Union 2013, 94, 121–123. [Google Scholar] [CrossRef] [Green Version]
  46. Miracle, M.P. Agriculture in the Congo Basin. Tradition and change in African Rural Economies; The University of Wisconsin Press: Madison, WI, USA, 1967. [Google Scholar]
  47. Cochran, W.G. Sampling Techniques, 3rd ed.; John Wiley & Sons: New York, NY, USA, 1977. [Google Scholar]
  48. Conklin, H.C. The Study of Shifting Cultivation. Curr. Anthropol. 1961, 2, 27–61. [Google Scholar] [CrossRef]
  49. Service Permanent D’inventaire et d’Amenagement Forestiers (SPIAF) Normes de stratification forestière 2007. Available online: https://www.droitcongolais.info/files/9.11.26.1.-Vade-mecum-de-juillet-2007-pour-l-application-du-code-forestier.pdf (accessed on 27 June 2018).
  50. Planet Planet to Acquire Terra Bella from Google, Sign Multi-Year Data Contract. Available online: https://www.planet.com/pulse/planet-to-acquire-terra-bella-from-google/ (accessed on 14 February 2017).
  51. Planet Planet to Launch Record-Breaking 88 Satellites. Available online: https://www.planet.com/pulse/record-breaking-88-satellites/ (accessed on 14 February 2017).
  52. Finer, M.; Novoa, S.; Weisse, M.J.; Petersen, R.; Mascaro, J.; Souto, T.; Stearns, F.; Martinez, R.G. Combating deforestation: From satellite to intervention. Science 2018, 360, 1303–1305. [Google Scholar] [CrossRef]
  53. Lesiv, M.; See, L.; Laso Bayas, J.C.; Sturn, T.; Schepaschenko, D.; Karner, M.; Moorthy, I.; McCallum, I.; Fritz, S. Characterizing the Spatial and Temporal Availability of Very High Resolution Satellite Imagery in Google Earth and Microsoft Bing Maps as a Source of Reference Data. Land 2018, 7, 118. [Google Scholar] [CrossRef] [Green Version]
  54. Bey, A.; Sánchez-Paus Díaz, A.; Maniatis, D.; Marchi, G.; Mollicone, D.; Ricci, S.; Bastin, J.-F.; Moore, R.; Federici, S.; Rezende, M.; et al. Collect Earth: Land Use and Land Cover Assessment through Augmented Visual Interpretation. Remote Sens. 2016, 8, 807. [Google Scholar] [CrossRef] [Green Version]
  55. Rudel, T.K.; Defries, R.; Asner, G.P.; Laurance, W.F. Changing Drivers of Deforestation and New Opportunities for Conservation. Conserv. Biol. 2009, 23, 1396–1405. [Google Scholar] [CrossRef] [PubMed]
  56. Pirard, R.; Belna, K. Agriculture and Deforestation: Is REDD+ Rooted In Evidence? For. Policy Econ. 2012, 21, 62–70. [Google Scholar] [CrossRef]
  57. Carter, M.R.; Little, P.D.; Mogues, T.; Negatu, W. Poverty Traps and Natural Disasters in Ethiopia and Honduras. World Dev. 2007, 35, 835–856. [Google Scholar] [CrossRef]
  58. Fairhead, J.; Leach, M.; Scoones, I. Green Grabbing: A new appropriation of nature? J. Peasant Stud. 2012, 39, 237–261. [Google Scholar] [CrossRef] [Green Version]
  59. Megevand, C.; Mosnier, A.; Hourticq, J.; Sanders, K.; Doetinchem, N.; Streck, C. Deforestation Trends in the Congo Basin; Directions in Development-Environment and Sustainable Development; The World Bank: Washington, DC, USA, 2013; ISBN 978-0-8213-9742-8. [Google Scholar]
  60. Nelleman, C.; Redmond, I.; Refisch, J. The Last Stand of the Gorilla: Environmental Crime and Conflict in the Congo Basin. Available online: https://digital.library.unt.edu/ark:/67531/metadc28506/ (accessed on 2 August 2018).
  61. De Merode, E.; Smith, K.H.; Homewood, K.; Pettifor, R.; Rowcliffe, M.; Cowlishaw, G. The impact of armed conflict on protected-area efficacy in Central Africa. Biol. Lett. 2007, 3, 299–301. [Google Scholar] [CrossRef] [Green Version]
  62. Kismul, H.; Hatløy, A.; Andersen, P.; Mapatano, M.; Van den Broeck, J.; Moland, K.M. The social context of severe child malnutrition: A qualitative household case study from a rural area of the Democratic Republic of Congo. Int. J. Equity Health 2015, 14, 47. [Google Scholar] [CrossRef] [Green Version]
  63. Dupain, J.; Nackoney, J.; Mario Vargas, J.; Johnson, P.J.; Farfán, M.A.; Bofaso, M.; Fa, J.E. Bushmeat characteristics vary with catchment conditions in a Congo market. Biol. Conserv. 2011, 146, 32–40. [Google Scholar] [CrossRef]
Figure 1. Examples of land cover visually interpretable in the imagery on Google Earth: (a) an area is being burned to clear vegetation residue and fertilize the soil, next to areas of active agriculture; (b) a patch of secondary forest that has been cleared.
Land 09 00023 g001
Figure 2. The DRC area is colored in black. The southernmost extension of the country is not visible. The boundaries of the humid tropical forest (our AOI) are highlighted with a green line. Only the area within this AOI was part of our analysis. The stratification at the country level is visible in (a), (b) shows the simple random sample point distribution in the RCE and IFP, and (c) provides a detailed picture of Kisangani that illustrates the sample distribution in the two mapped areas.
Land 09 00023 g002
Figure 3. The methods of the paper can be summarized in three steps: Step 1) builds upon the map published by [13]. In [14], the area of each land cover and land use (LCLU) type within the established rural complex for 2000 was estimated; * Step 1 pertains to new forest loss during 2000–2015 that occurred outside of the established rural complex.
Land 09 00023 g003
Figure 4. (a) The separation of GFC forest cover loss pixels in three areas: (1) in the baseline “established rural complex” for the year 2000 which was established and sampled in [13,14], (2) in the rural complex expansion area (RCE), and (3) in isolated forest perforations (IFP). Buta (2°49′01.93″ N, 24°45′56.12″ E); (b) a zoomed in map detail for illustration.
Land 09 00023 g004
Figure 5. (a,b) (oblique view) Example of the photo-interpretation of a sample point and its buffers: In this example (point 1055), the imagery is from 2014, the centroid is marked as “young fallow” and the first slot of the interpreted land cover in each buffer shows the dominance of young fallow in the 100 m buffer and primary forest in the 500 m, 1 km, and 5 km buffer. The presence of other land cover types is noted in order of their spatial dominance, or presence, in the buffer. (Located at 4°29′15.23″ S, 23°39′28.05″ E).
Land 09 00023 g005
Figure 6. Sample 1036: The photo-interpretation of this point is labeled as “clearing”, although visualizing the 100 m radius circular buffer area aids the interpretation by adding context to the sample point. In this instance a number of shifting cultivation mosaic land cover types are observed, such as: clearings, active and fallow fields, and secondary forest (3°4′52.34″ N, 20°38′17.95″ E).
Land 09 00023 g006
Figure 7. (a,b) illustrate the goal of contextualizing forest cover loss within its broader land cover and land use landscape. In (a) a large trunk road and settled area is within 5 km of the sample point. In (b) a large gold mine is within 5 km of the sample (Sample point 1036 located at 3°4′52.34″ N, 20°38′17.95″ E; sample point 249 located at 4°20′4.63″ N, 23°42′6.38″ E).
Land 09 00023 g007
Figure 8. Point 201 (oblique view) is primary forest, with a palm oil plantation within 5 km (4°20′51.24″ S, 20°24′19.54″ E).
Land 09 00023 g008
Figure 9. Point 1255 is secondary forest, on an old logging road that has regrown, the network of abandoned logging roads is highlighted on the right for illustration (1°53′47.77″ N, 21°58′36.09″ E).
Land 09 00023 g009
Figure 10. Point 1255 in closer detail. The abandoned and regrown logging road are clearly visible in high resolution satellite imagery (1°53′47.77″ N, 21°58′36.09″ E).
Land 09 00023 g010
Figure 11. Gold mines (Oblique view) within 5km of sample 249, outlined in red, near Seridi, in the Bas-Uele Province, Bondo territoire (4°20′4.63″ N, 23°42′6.38″ E).
Land 09 00023 g011
Figure 12. The distribution of no-data sample points within the sample appears to be geographically random and not clustered.
Land 09 00023 g012
Figure 13. IFP sample points by distance to the established rural complex: (a) IFP w/data, (b) IFP w/o data. The red line shows the 15 km mark for reference.
Land 09 00023 g013
Table 1. The legend of land cover and land use classes that can be attributed to each sample point and their buffers in photo-interpretation.
Class CodeClass NameDescriptionPotential Confusion:Observed at What Scale?
1No-dataNo imagery available with sufficient resolution, or obscuration of the point by clouds, shadows, or bad dataNoneAll
2, 3, 4Water, rivers, pondsWater, rivers, and pondsNoneAll
5, 6, 7Roads, paths, settlementsMajor roads, paths, and settled areasNoneAll
8ClearingForest or fallow field that has been recently clearedNoneAll
9Active AgricultureField where crops are currently grownFallows500 m<
10, 11Young and old FallowsField either recently left fallow or overgrown, with vegetation ranging from grasses and shrubs to large shrubs, young trees, and bambooActive ag.500 m<
12Secondary ForestForest stand with over 60% tree cover of trees ≥5 m tall; canopy consists of small, relatively uniform tree crowns, resulting in a bright spectral responsePrimary forestAll
13Rural ComplexLand cover mosaic of roads, rivers, settlements, clearings, and active agriculture, secondary and primary forest patches.Grasslands>100 m
14Primary forestForest stand with over 60% tree cover of trees ≥5 m tall; canopy consists of highly varying crown size and vertical distribution, resulting in greater canopy shadowing and a dark spectral responseSec. forestAll
15, 16, 17Wetland, gallery and woodland forestsWetland forest: a stand with over 60% tree cover of trees ≥5 m tall proximate to water bodies & associated floodplains; Gallery forest: were once wetland forest, and remain unaltered as they are wet and low-lying, usually surrounded by derived savanna/grassland or rural complex landscapes. Woodland forest: is sparser, at the edges of the humid tropical forest, interfacing savannasPrimary and sec. forestAll
18GrasslandNatural and derived grassland/savanna areasActive ag. and fallowsAll
19CroplandsAgriculture that is semi-permanent, with a larger field area and more regular boundaries. They are not usually found in the rural complex mosaic.Active ag.All
20Commercial AgriculturePlantation land use associated with crops such as palm oilNoneAll
21MinesClearings and operations that have the appearance of mines: terraces, pits, and ponds clustered together with sometimes worker camps nearbyClearingsAll
22LoggingLogging concessions, roads, skid trails.ClearingsAll
23OtherOther features that are rare and do not fit in any other class, like natural landslide area, Inselbergs, etc.n/aAll
Table 2. Estimated area percent area of land cover classes in the RCE and IFP.
RCEIFPRCE-IFP
S E A r e a SE S E A r e a SE SE
Class   ( i ) Class CodeCount% Area% Area(km2)(km2)Count% Area % Area(km2)(km2)% Area% Area
Primary For.149333.92.8615,87813389141.43.3210,518844−7.54.38
Sec. Forest127828.52.7313,31712754821.82.7855487086.73.90
Old Fallow113713.52.066317966219.51.98242750442.86
Clearing8248.81.714097799209.11.942312493−0.32.59
Active Ag.9217.71.613585752104.51.4011563573.22.13
Young Fallow10165.81.422732663135.91.591503404−0.12.13
Grassland1831.10.6351229431.40.78347199−0.31.00
Road &Settled5, 6, 710.40.3617117041.80.90462229−1.40.97
Commercial Ag.2010.40.36171170--0.00000.40.36
Wetland For.15--0.00-083.61.26925321−3.61.26
Woodland For.17--0.00-010.50.45116115−0.50.45
Logging22--0.00-010.50.45116115−0.50.45
Grand Total274100%46,779170220100%25,428
Table 3. Percent land cover estimates for the sample points, compared to dominant land cover within the concentric circular buffer areas around them.
ClassCodeRCEIFP
Point100 m500 m1 km5 kmPoint100 m500 m1 km5 km
All primary forest types14, 15, 16, 1733.945.170.978.573.845.554.187.387.787.7
Secondary forest1228.520.45.51.1-21.815.00.50.50.5
Old fallows1113.510.20.7--9.57.7---
Clearings88.88.72.2--9.17.30.50.5-
Active fields97.73.6---4.52.70.50.5-
Young fallows105.83.6---5.93.6---
Grasslands, Savannas, and cropland18, 191.10.40.40.40.41.41.43.22.72.7
Roads, paths, and settlements5, 6, 70.40.41.10.4-1.82.30.5-0.5
Rural complex (all elements of the RC mosaic)13-7.318.218.923.6-5.56.46.46.4
Commercial ag.200.40.21.41.82.40.40.20.40.6
Mines210.00.01.42.60.00.61.01.8
Logging220.00.20.01.00.50.60.60.61.4
Total of Commercial land uses20, 21, 220.40.21.63.26.10.51.01.42.03.8
Other23----0.4----
Total

