Assessing Conflict Driven Food Security in Rakhine, Myanmar with Multisource Imagery


Abstract
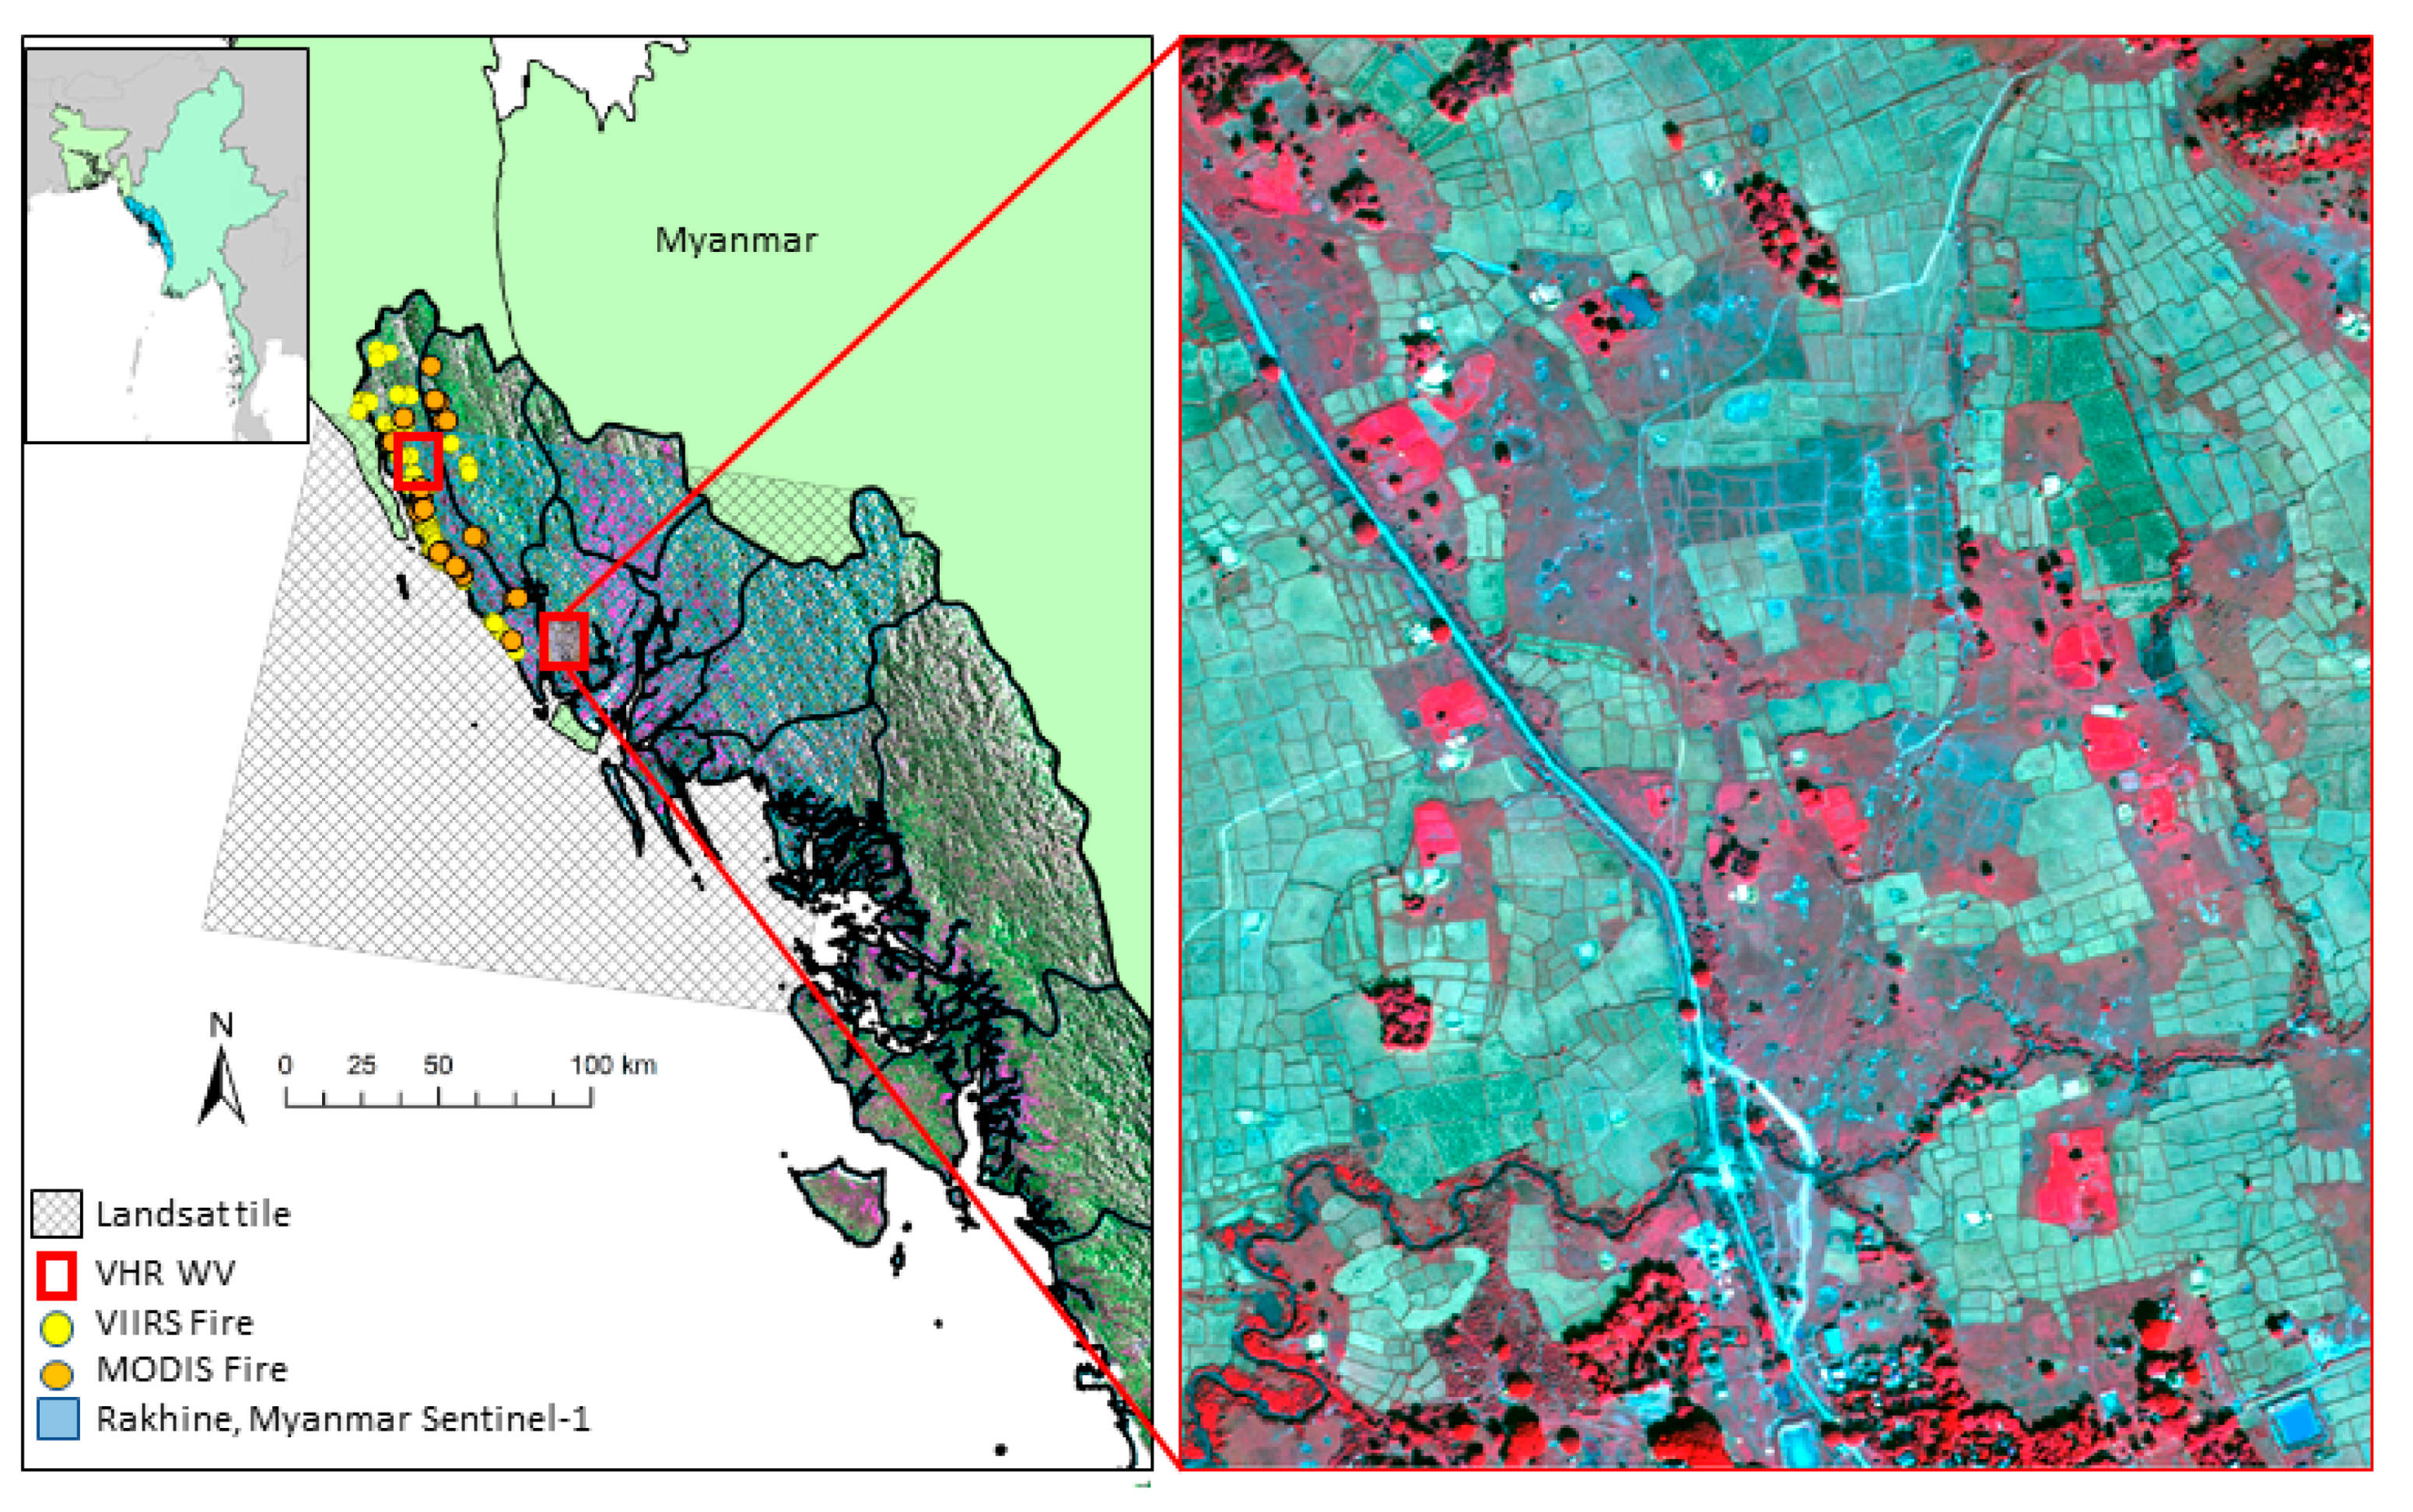
:1. Introduction
Mapping Food Security
2. Methods
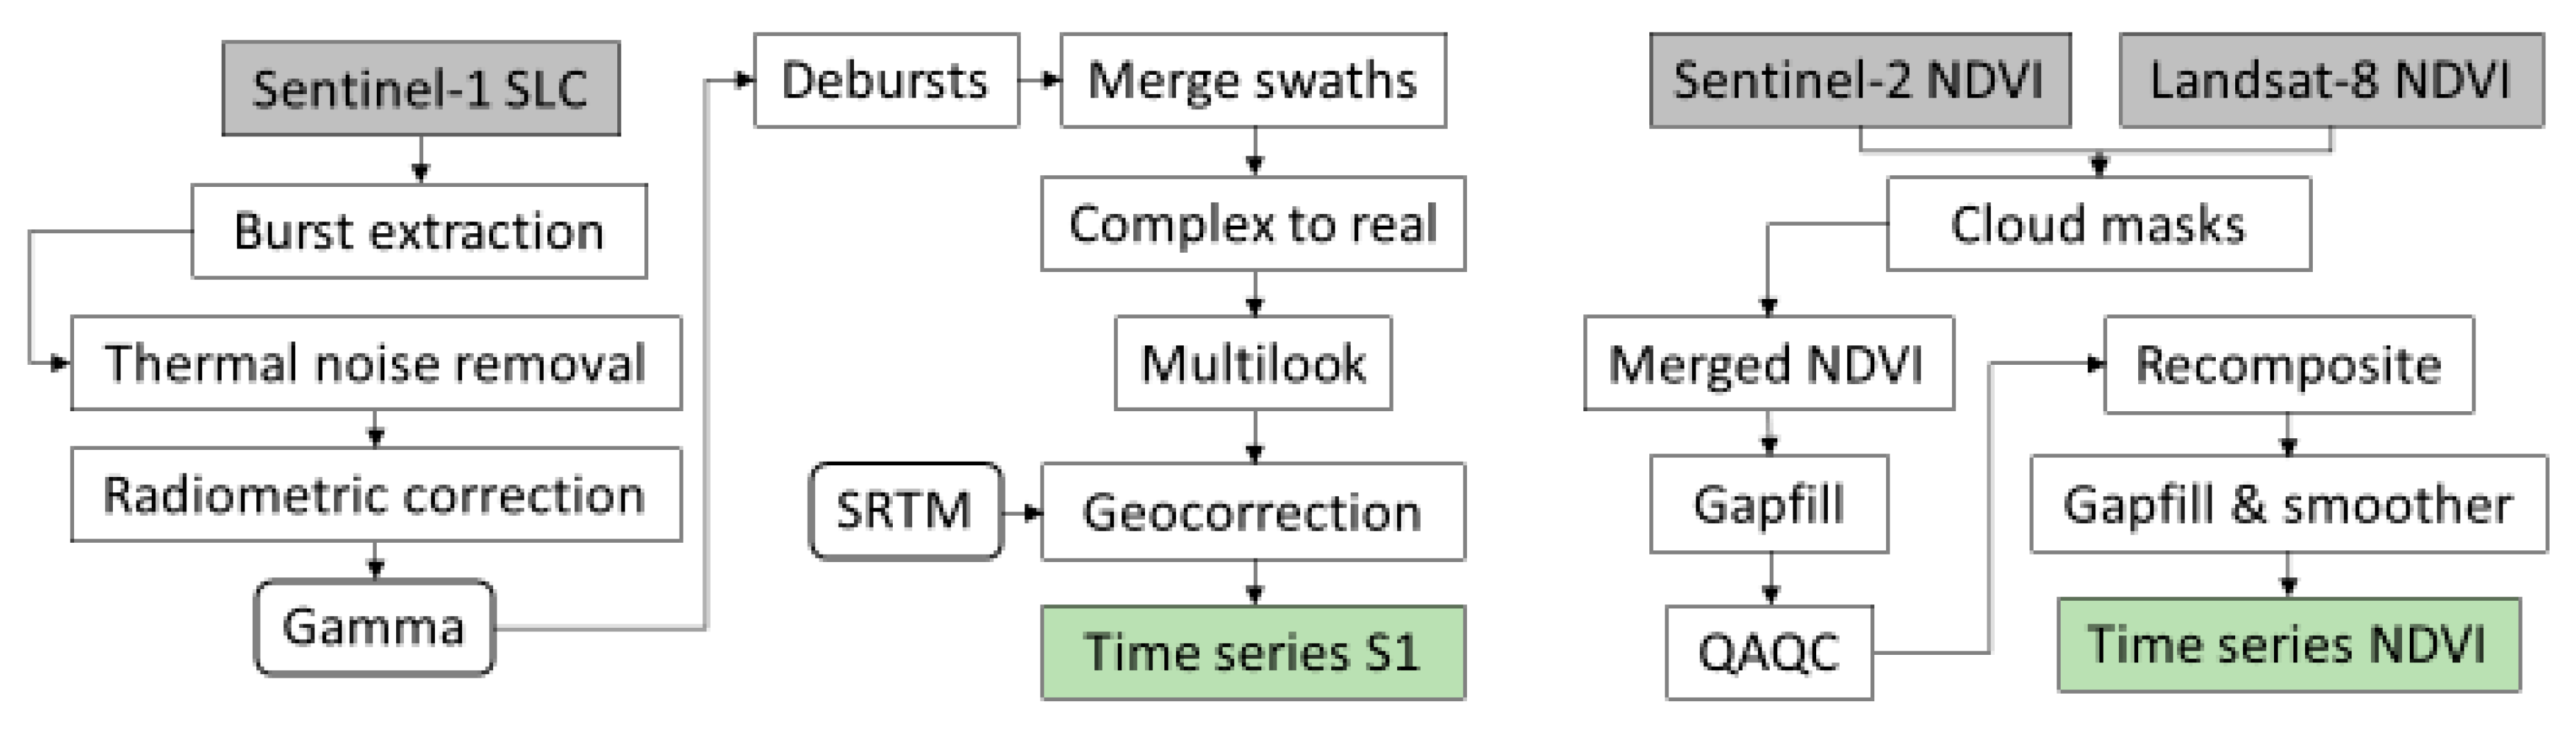
2.1. Satellite Preprocessing
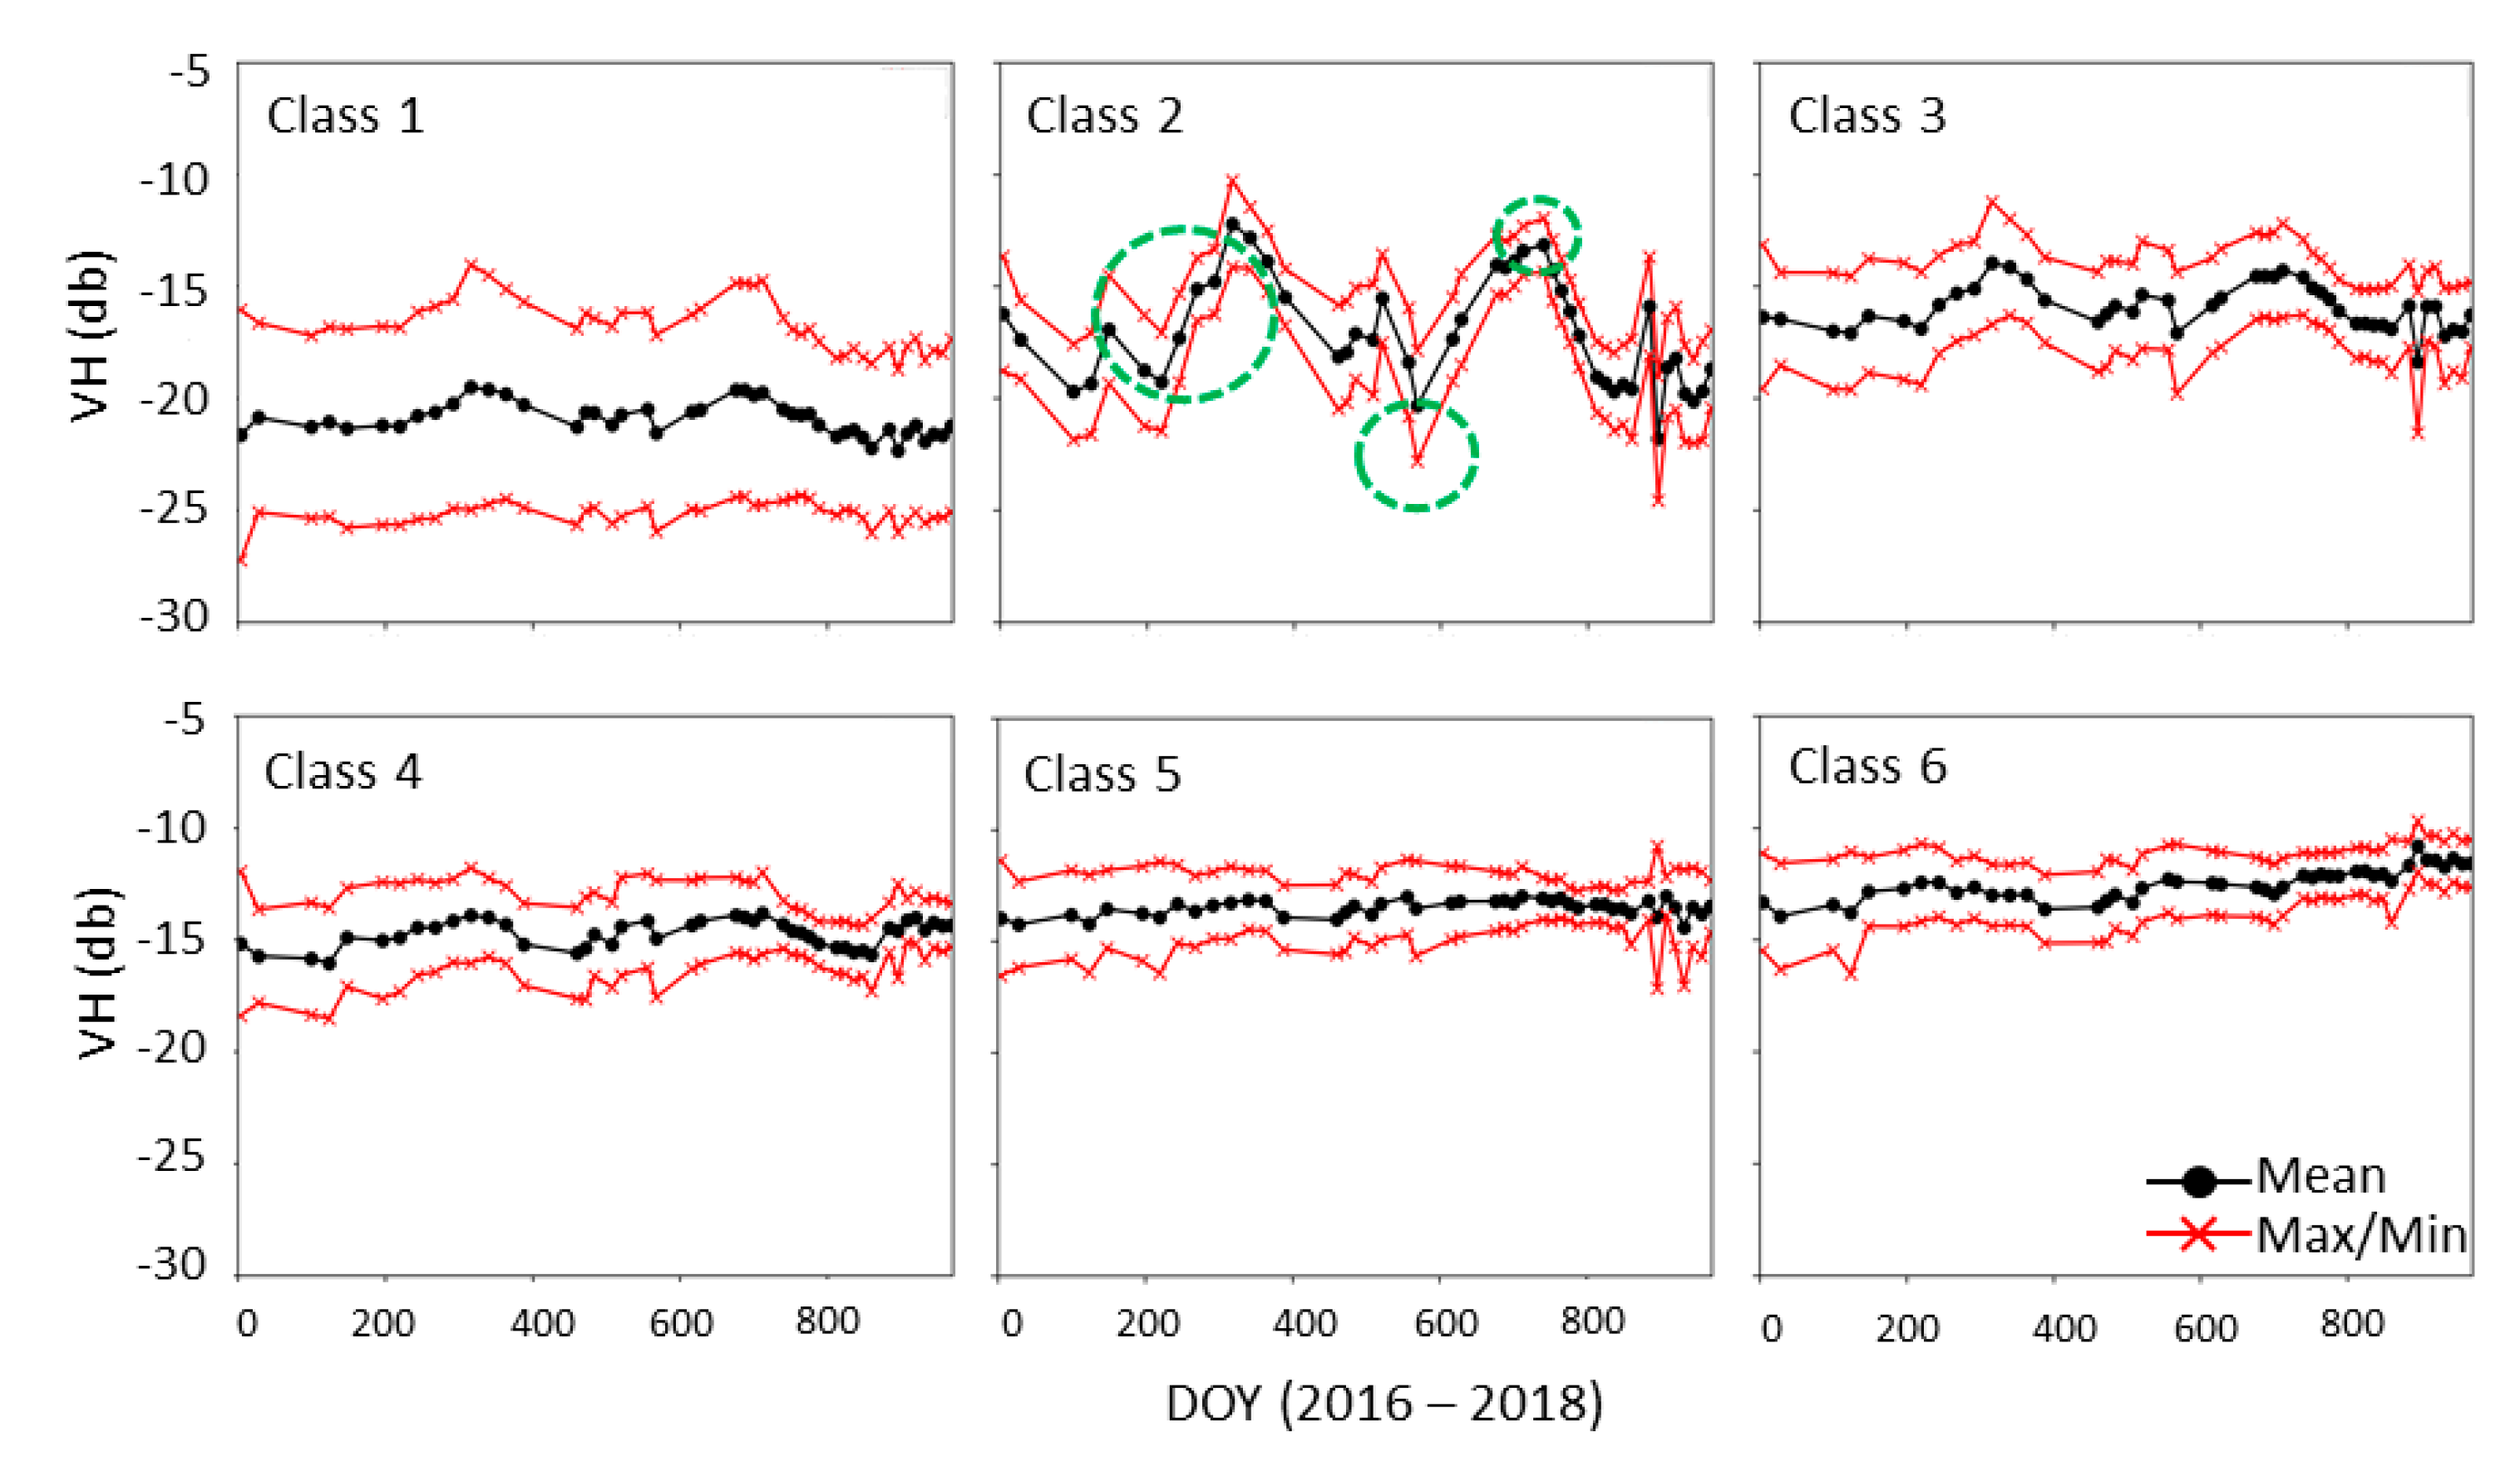
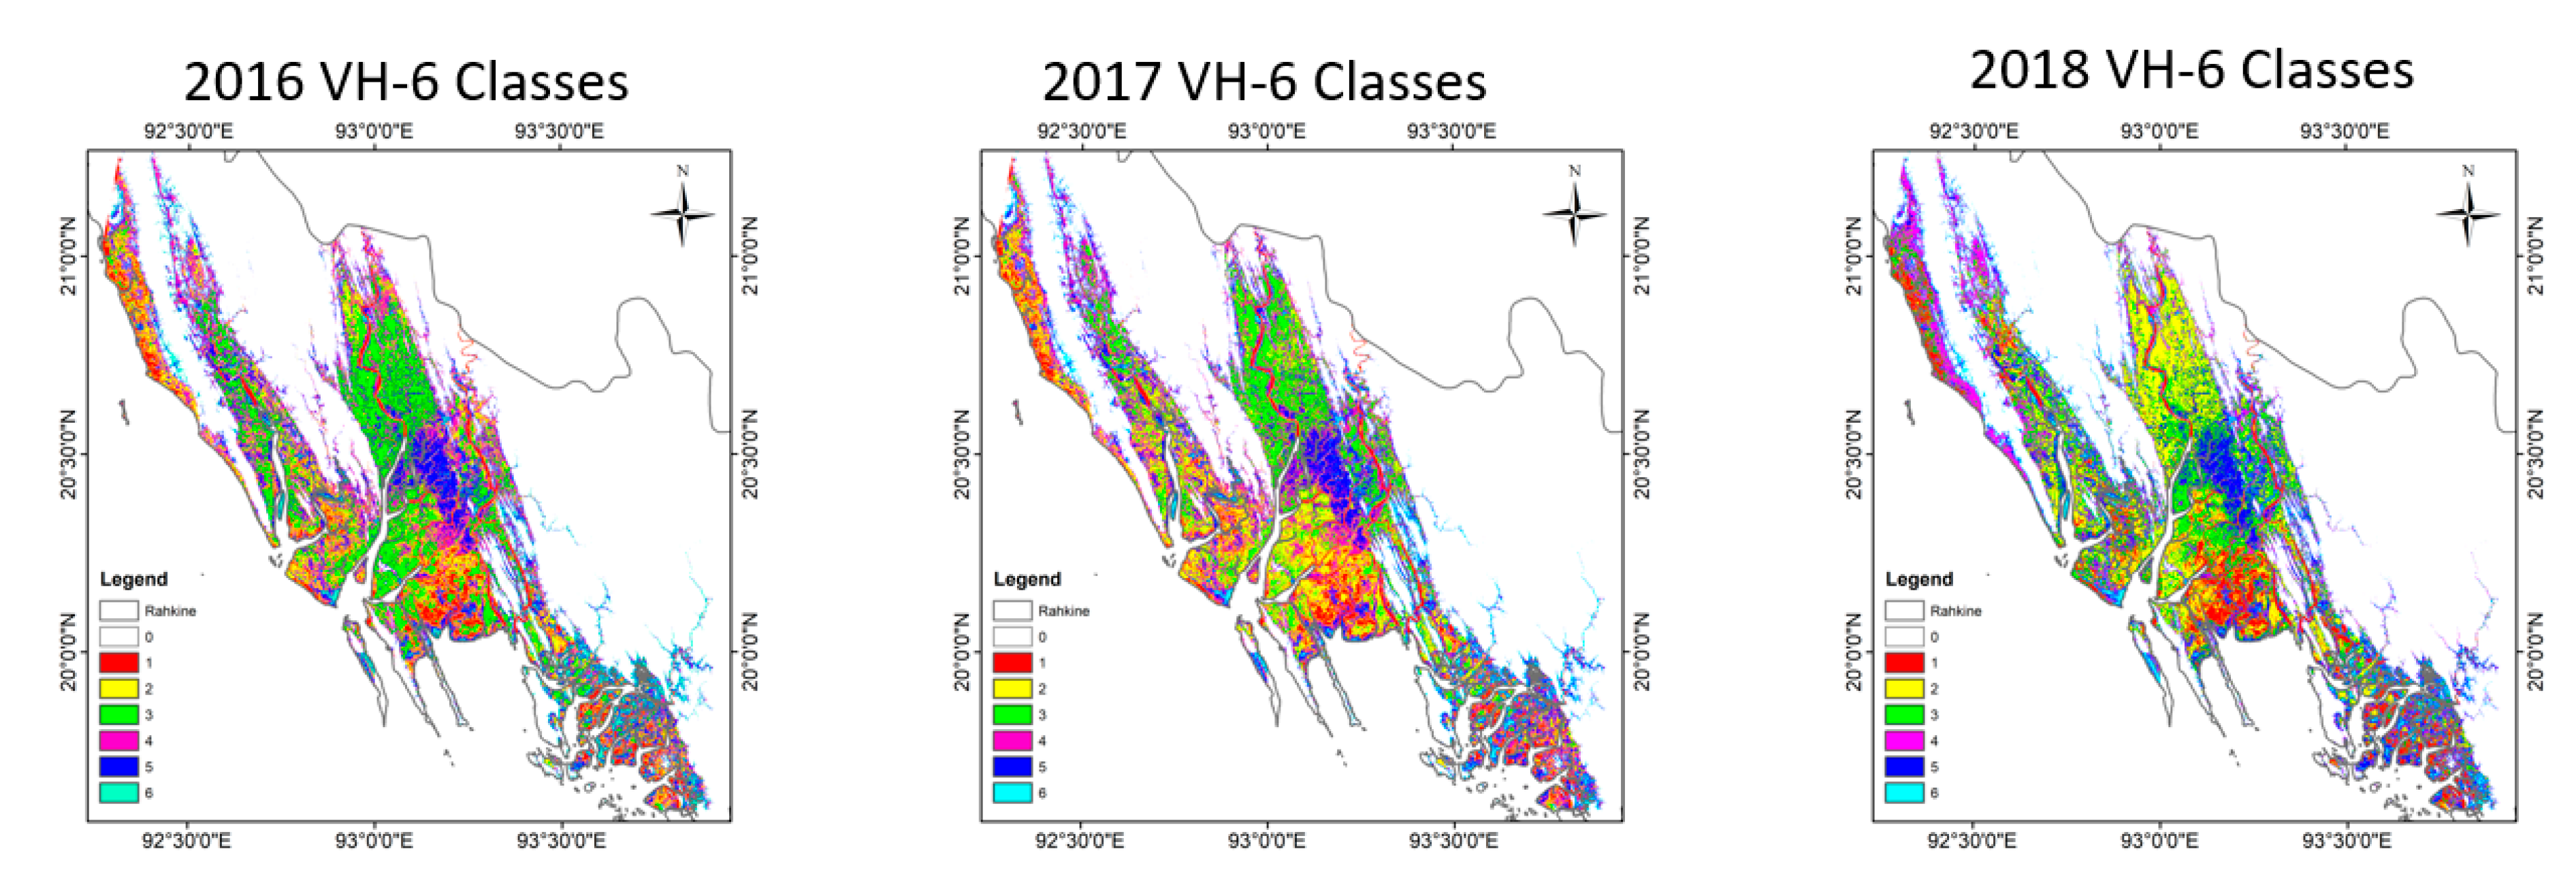
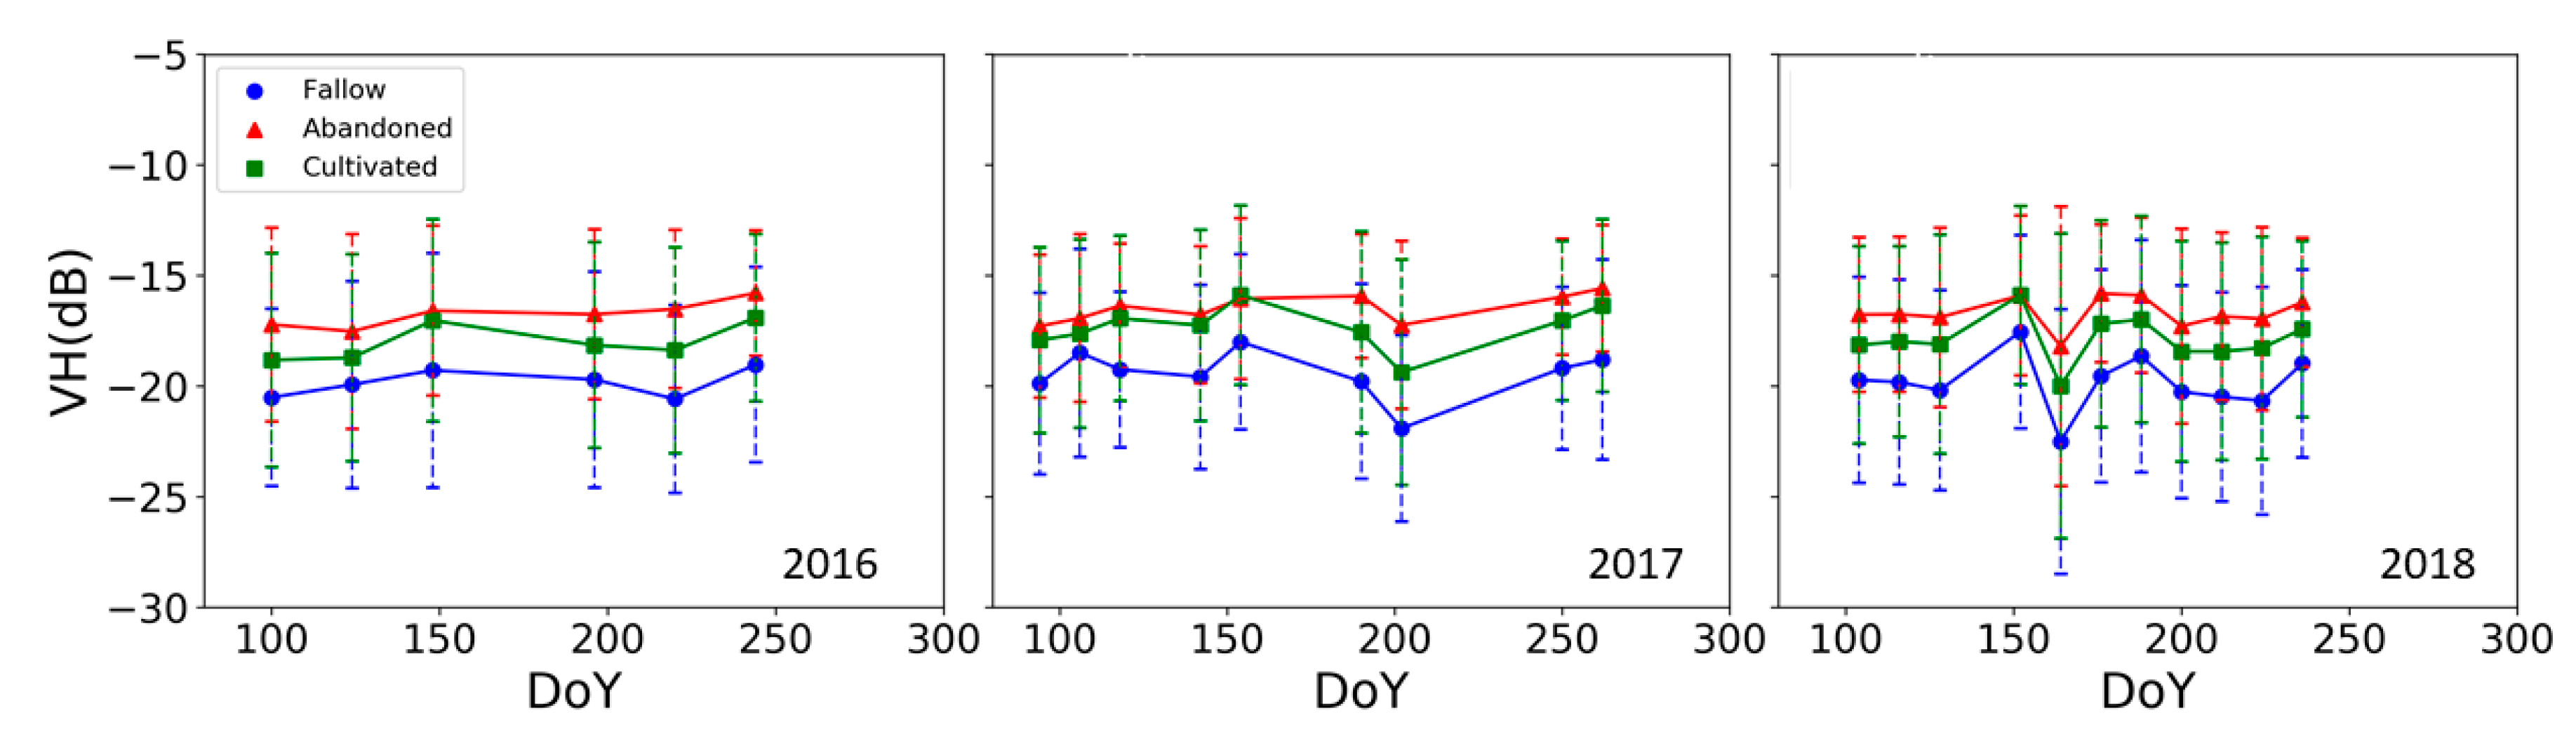
2.2. Sentinel-1 Mapping Approach
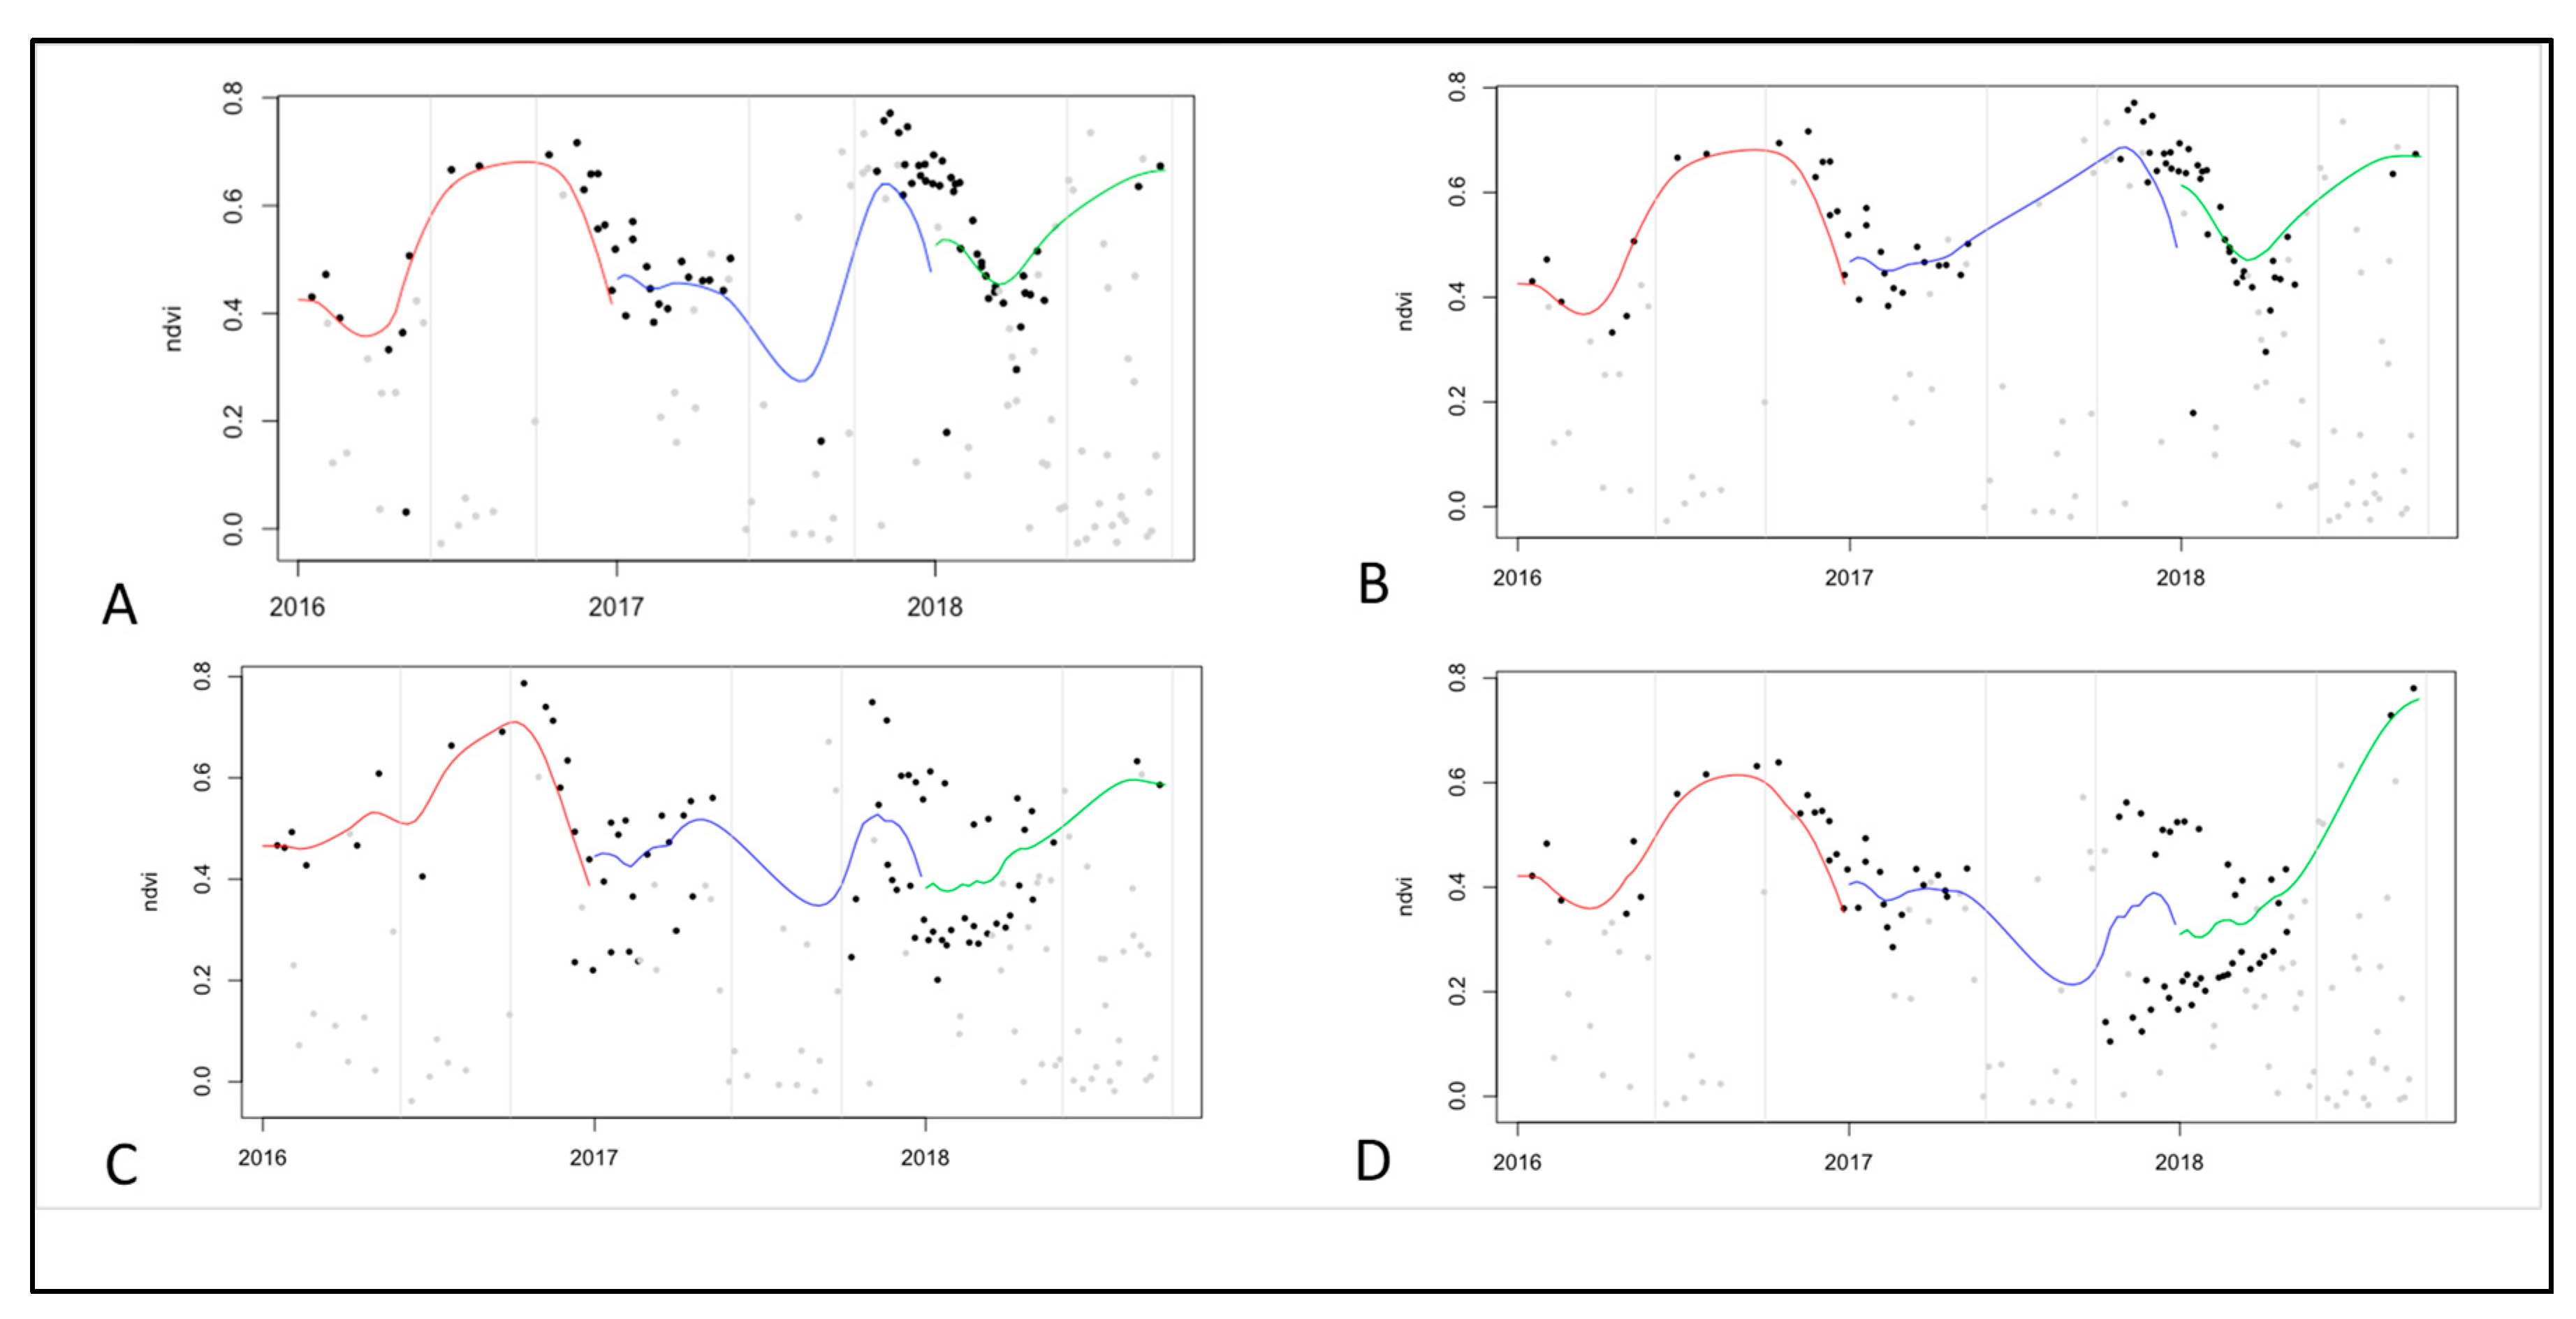
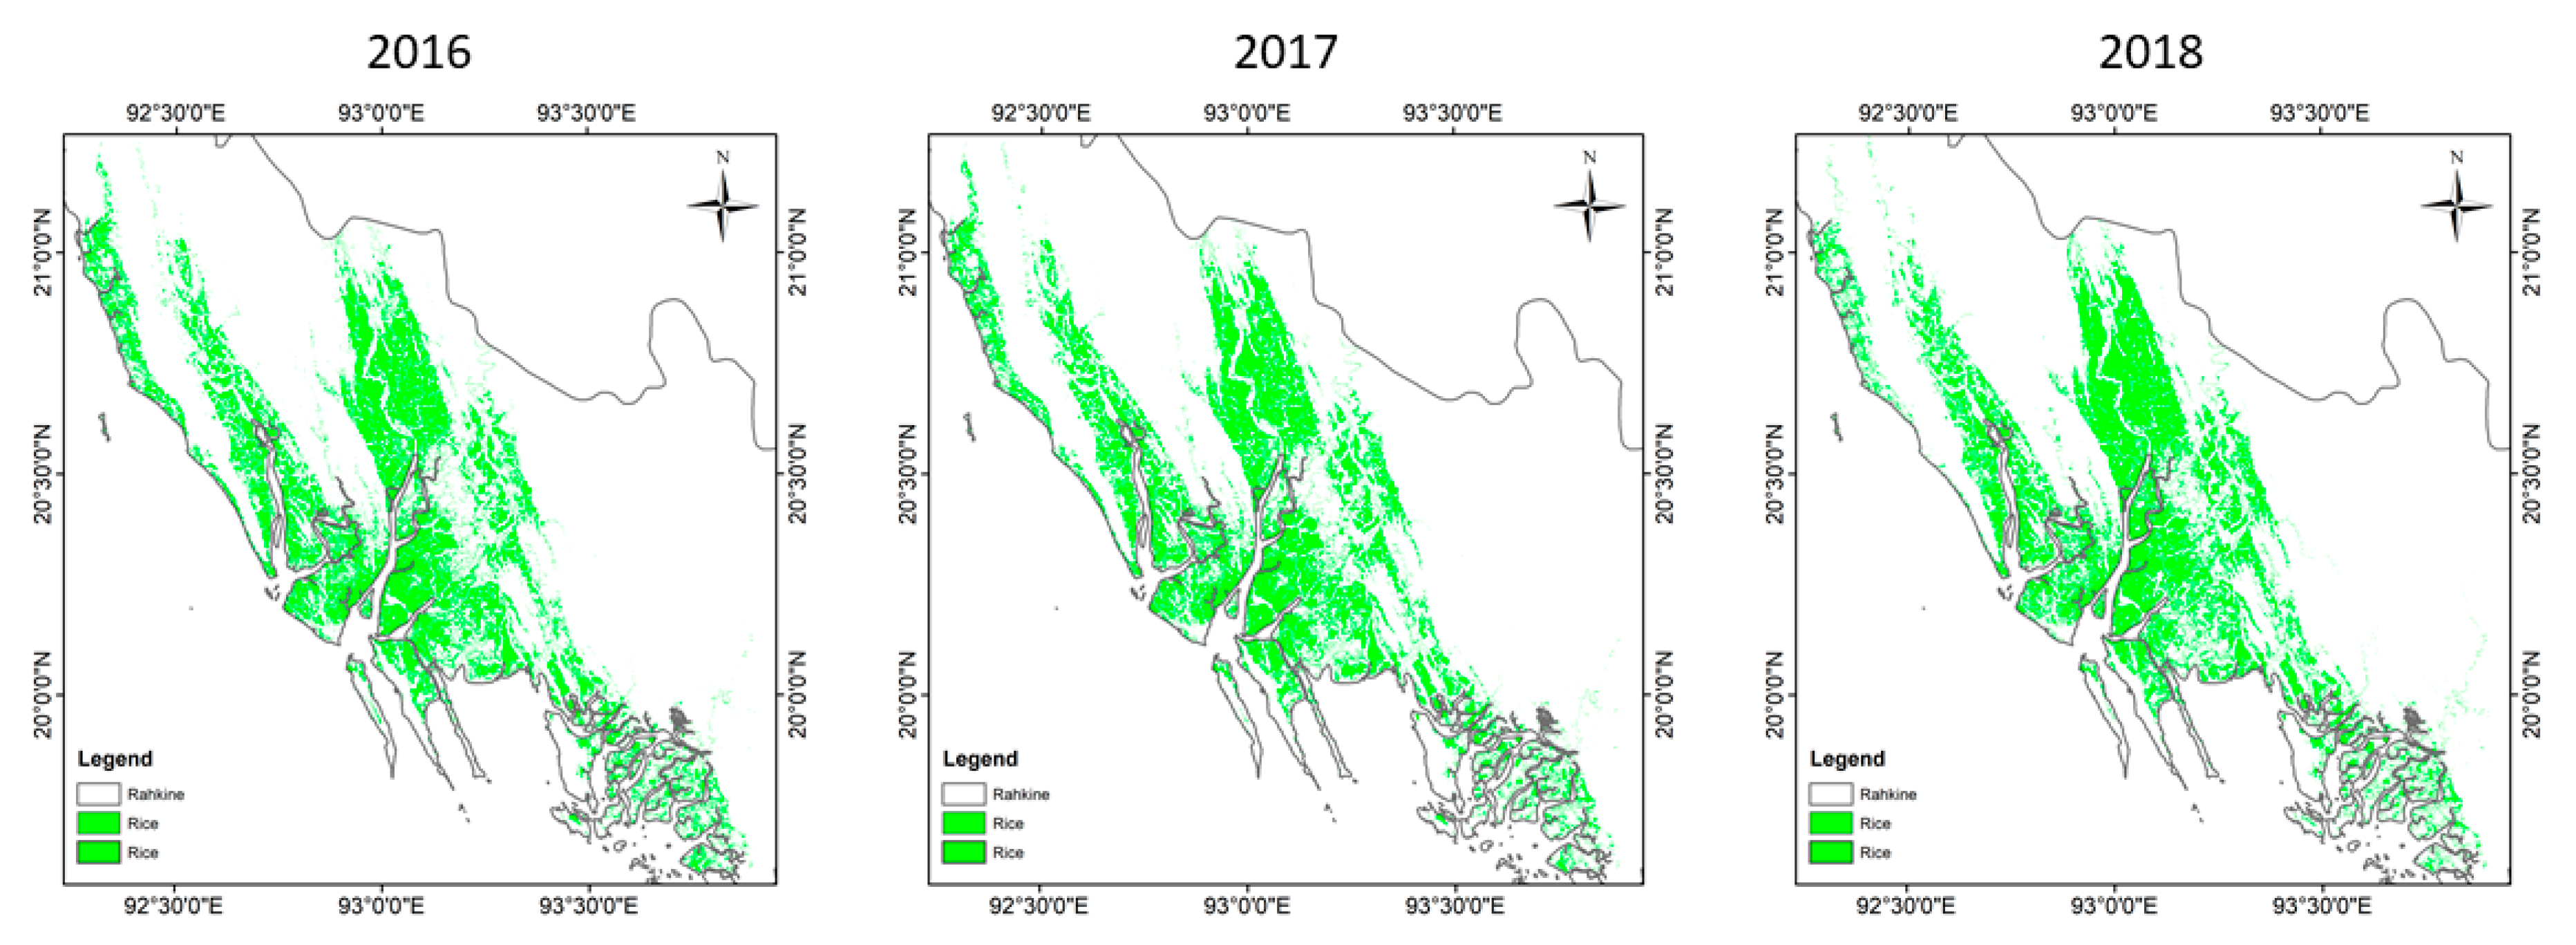
2.3. Optical Mapping Approach
3. Results and Discussion
3.1. Satellite Technical Outcomes and Considerations
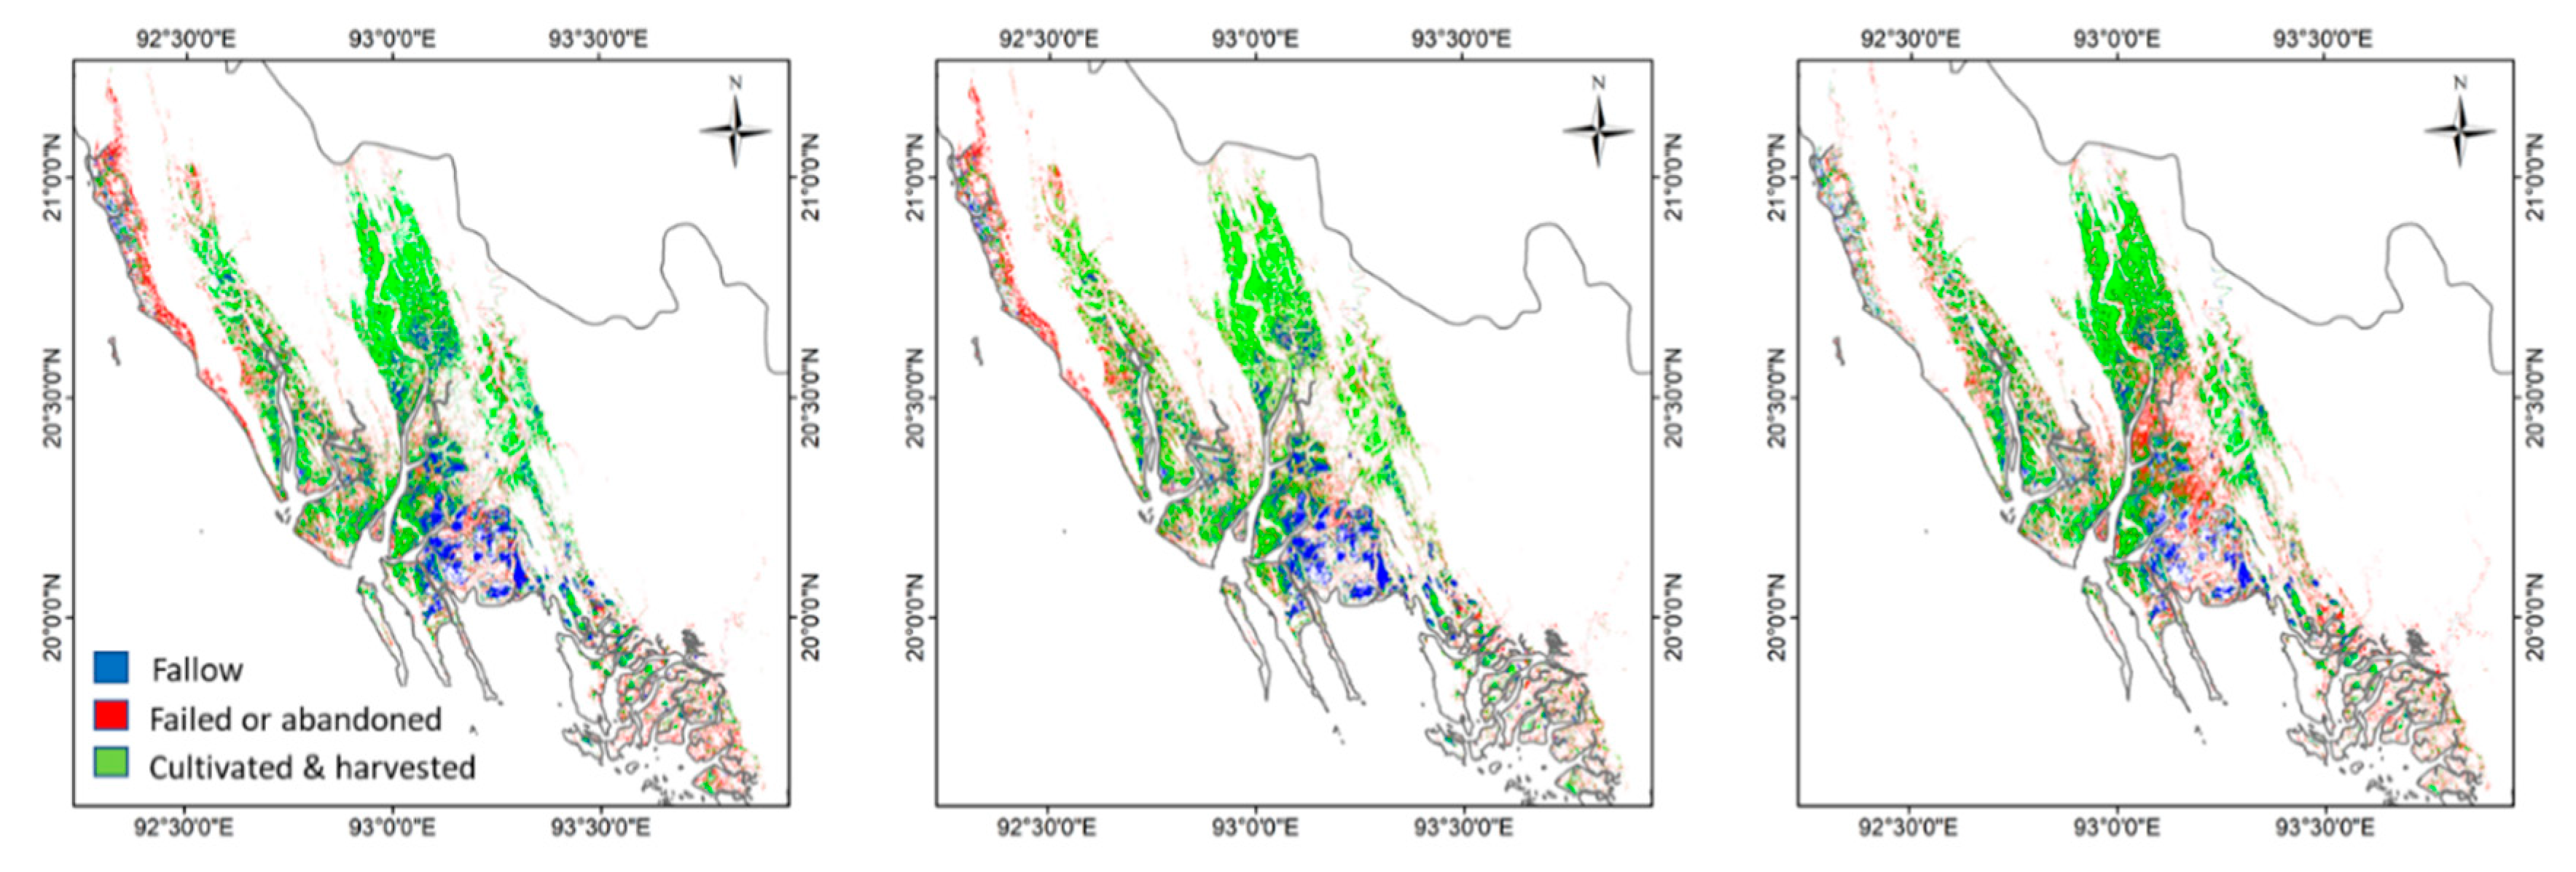
3.2. Food Security Assessment Outcomes
4. Conclusions
Author Contributions
Funding
Acknowledgments
Conflicts of Interest
References
- Food and Agriculture Organization of the United Nations. Available online: http://www.fao.org/home/en (accessed on 12 June 2019).
- World Bank. Myanmar—Analysis of Farm Production Economics (English); World Bank Group: Washington, DC, USA, 2016; Volume 1, p. 258. [Google Scholar]
- Torbick, N.; Chowdhury, D.; Salas, W.; Qi, J. Monitoring rice agriculture across Myanmar using time series Sentinel–1 assisted by Landsat–8 and PALSAR–2. Remote Sens. 2017, 9, 119. [Google Scholar] [CrossRef]
- Chris, F.; Peterson, P.; Landsfeld, M.; Pedreros, D.; Verdin, J.; Shukla, S.; Gregory Husak, G.; Rowland, J.; Harrison, L.; Hoell, A.; et al. The climate hazards infrared precipitation with stations—A new environmental record for monitoring extremes. Sci. Data 2015, 2, 150066. [Google Scholar] [CrossRef]
- Bouvet, A.; Le Toan, T.; Lam-Dao, N. Monitoring of the rice cropping system in the Mekong Delta using ENVISAT/ASAR dual polarization data. IEEE Trans. Geosci. Remote 2009, 47, 517–526. [Google Scholar] [CrossRef]
- Nelson, A.; Setiyono, T.; Rala, A.B.; Quicho, E.D.; Raviz, J.V.; Abonete, P.J.; Maunahan, A.A.; Garcia, C.A.; Bhatti, H.Z.M.; Villano, L.S.; et al. Towards an Operational SAR-Based Rice Monitoring System in Asia: Examples from 13 Demonstration Sites across Asia in the RIICE Project. Remote Sens. 2014, 6, 10773–10812. [Google Scholar] [CrossRef] [Green Version]
- Torbick, N.; Huang, X.; Ziniti, B.; Johnson, D.; Masek, J.; Reba, M. Fusion of Moderate Resolution Earth Observations for Operational Crop Type Mapping. Remote Sens. 2018, 10, 1058. [Google Scholar] [CrossRef]
- Whittaker, E.T.; Robinson, G. The Calculus of Observations. Trans. Fac. Act. 1924, 10, 1924–1925. [Google Scholar]
- Huang, X.; Ziniti, B.; Torbick, N.; Ducey, M.J. Assessment of Forest above Ground Biomass Estimation Using Multi-Temporal C-band Sentinel-1 and Polarimetric L-band PALSAR-2 Data. Remote Sens. 2018, 10, 1424. [Google Scholar] [CrossRef]
- Breiman, L. Random Forests. Mach. Learn. 2001, 45, 5–32. [Google Scholar] [CrossRef] [Green Version]
- Landholm, D.; Pradhan, P.; Kropp, J. Diverging forest land use dynamics induced by armed conflict across the tropics. Glob. Environ. Chang. 2019, 56, 86–94. [Google Scholar] [CrossRef]
- Pradhan, P.; Costa, L.; Rybski, D.; Lucht, W.; Kropp, J. A Systematic Study of Sustainable Development Goal (SDG) Interactions. Earth’s Future 2017, 5, 1169–1179. [Google Scholar] [CrossRef] [Green Version]


| Rice | Non-Rice | Total | UA | Rice | Non-Rice | Total | UA | Rice | Non-Rice | Total | UA | |||
|---|---|---|---|---|---|---|---|---|---|---|---|---|---|---|
| Rice | 132 | 12 | 144 | 91.7 | Rice | 126 | 15 | 141 | 89.4 | Rice | 125 | 21 | 146 | 85.6 |
| Non-Rice | 6 | 50 | 56 | 89.3 | Non-Rice | 12 | 47 | 59 | 79.7 | Non-Rice | 4 | 50 | 54 | 92.6 |
| Total | 138 | 62 | 200 | Total | 138 | 62 | 200 | Total | 129 | 71 | 200 | |||
| PA | 95.7 | 80.6 | PA | 91.3 | 75.8 | PA | 96.9 | 70.4 | ||||||
| OA | 91.0 | OA | 86.5 | OA | 87.5 | |||||||||
| Kappa | 78.4 | Kappa | 68.0 | Kappa | 71.2 |
| Fallow | Abandoned | Harvested | ||
|---|---|---|---|---|
| 2016 | Pixels | 460,533 | 997,096 | 1,635,051 |
| Percentage (%) | 14.89 | 32.24 | 52.87 | |
| Area (Hectare) | 41,447.97 | 89,738.64 | 147,154.59 | |
| 2017 | Pixels | 461,598 | 892,191 | 1,708,732 |
| Percentage (%) | 15.07 | 29.13 | 55.79 | |
| Area (Hectare) | 41,543.82 | 80,297.19 | 153,785.88 | |
| 2018 | Pixels | 356,885 | 1,140,015 | 1,667,031 |
| Percentage (%) | 11.28 | 36.03 | 52.689 | |
| Area (Hectare) | 32,119.65 | 102,601.35 | 150,032.79 |
© 2019 by the authors. Licensee MDPI, Basel, Switzerland. This article is an open access article distributed under the terms and conditions of the Creative Commons Attribution (CC BY) license (http://creativecommons.org/licenses/by/4.0/).
Share and Cite
Huang, X.; Ziniti, B.; Torbick, N. Assessing Conflict Driven Food Security in Rakhine, Myanmar with Multisource Imagery. Land 2019, 8, 95. https://doi.org/10.3390/land8060095
Huang X, Ziniti B, Torbick N. Assessing Conflict Driven Food Security in Rakhine, Myanmar with Multisource Imagery. Land. 2019; 8(6):95. https://doi.org/10.3390/land8060095
Chicago/Turabian StyleHuang, Xiaodong, Beth Ziniti, and Nathan Torbick. 2019. "Assessing Conflict Driven Food Security in Rakhine, Myanmar with Multisource Imagery" Land 8, no. 6: 95. https://doi.org/10.3390/land8060095
APA StyleHuang, X., Ziniti, B., & Torbick, N. (2019). Assessing Conflict Driven Food Security in Rakhine, Myanmar with Multisource Imagery. Land, 8(6), 95. https://doi.org/10.3390/land8060095