Abstract
Recent conflict along the border of Bangladesh and Myanmar has amplified a food security crisis and access to the region remains challenging. Moderate-resolution satellite remote sensing offers an approach to complement more traditional food insecurity hot spot assessment across Rakhine, Myanmar; however, conflict creates unique signals that are not agroclimatologically driven and need to be considered. Time series radar and optical data cubes were built and used to assess for deviations across space and time for rice paddy production areas based on established techniques. Ultimately, the Sentinel-1 radar was more helpful compared to fused Landsat-7 and -8 and Sentinel-2 data cubes that were substantially impacted by cloud cover during key growth stages. Anecdotal reporting, very high resolution (VHR) imagery, and expert knowledge were used to support operational analyses routines in an attempt to characterize rice into failed, abandoned, and cultivated classes across 2016 to 2018 seasons. Accuracy assessment using co-timed VHR showed overall accuracy (%) of 86.5, 87.5, and 91.0 for 2016, 2017, and 2018, respectively. Nearly one-third of rice production was characterized as failed or abandoned in any given year. Qualitative analyses showed paddy failure was often adjacent to conflict events. The moderate-resolution imagery and automated routines offer complementing metrics that can be used to help guide food security assessments. In regions where climate change, migration, and conflict coincide, decision support tools will need to evolve and continue to integrate human perspectives.
1. Introduction
An ongoing humanitarian crisis exists in South Asia along the border of Myanmar and Bangladesh in Rakhine State, which is part of Myanmar. Long running and complex cultural, political, and religious drivers have resulted in hundreds of thousands of largely Muslim Rohingya leaving Rakhine. A large percentage of the exodus has ended up in Cox’s Bazar, Bangladesh and nearby refugee shelter camps while a small percentage have migrated to Indonesia, Thailand, Nepal, and Malaysia. Recent conflicts in October and November of 2016, followed by more conflicts during August to October 2017 and again throughout 2018, substantially increased departures with international organizations estimating more than 750,000 emigrations since these occurrences [1]. Prior to these recent conflicts, approximately 1 million Rohingya resided in this region.
Part of this crisis is amplified by low food security with historical livelihoods tied to agriculture in this low-production, disaster-prone region [2,3]. Little to no transparent or robust food security information is available for the region regarding crop production. The Food and Agriculture Organization (FAO) estimates 80% of the Rakhine population is under nourished or suffer malnutrition with three-quarters living below the poverty line [1]. Many Rohingya—especially in the areas of Buthidaung, Maungdaw, Myinbya, Pauktauw, Sittwe, and Zawmadat—have abandoned their home and land including much of the male population, which tend to be the primary workers for crop production. About half the total population directly or indirectly participates in subsistence agriculture with most being paddy and some mixed rotation vegetables. FAO reports 90% suffer some form of hunger and this area remains one of the most food insecure locations in the world. Given the geopolitical circumstances, access to comprehensively assess food security has remained a challenge and mixed reports on field cultivation, ownership rights, and food production have created uncertainty and added to risks.
Mapping Food Security
Assessment of food security requires robust, timely, and transparent approaches and ability to respond to dynamic events. One approach to support assessment of food security is the use of satellite remote sensing. Many tools and approaches exist and often Earth Observation (EO) technology is used as part of a convergence of evidence framework that blends indices of landscape conditions with human and local knowledge. For example, the famine early warning systems network (FEWS NET) agroclimatological and satellite remote sensing approach typically relies on a convergence of evidence among three physically independent observational types, namely: landscape greenness (such as normalized difference vegetation index (NDVI)), evapotranspiration anomalies largely based on land surface temperature models, and ensemble gridded rainfall data, such as climate hazards infrared precipitation with stations [CHiRPS, 4]. In data-sparse regions like Myanmar, satellite remote sensing has been critical for supporting food security decision support tools [3]. However, in this case, the main driver of food security is not agroclimatological forces; rather, conflict is the primary driver of risk. Therefore, being able to distinguish crop field activity and cultivation is the need and challenge.
In Myanmar, the vast majority (>75%) of rice is produced during the main wet season (May to October). A second rice crop, if amenable weather conditions, stable market prices, and labor exist, can potentially be sowed during November and December with harvest by May the following year. Maize, potatoes, beans, and grasses are the usual cash, food, and rotational crops that might be grown outside of the main rice season. Rice crops make up a major portion of diet calories and is a major driver of livelihoods. Rotations, fallow land use, and yield vary remarkably within season and season-to-season making operational assessment very challenging.
In the case of Rakhine, use of more-coarse (250 m–1 km) satellite sensors, such as MODIS, have limitations due to the patchy landscape given the small fields, subsistence practices, and spatially varying growth stages. For these reasons, moderate spatial resolution (<30 m) sensors, such as Landsat-8 and Sentinel-2, are required for more thorough assessment of crop conditions. Typically, here, the main rice crop is sowed between May to early June, ripens toward September, and is followed by harvest starting as early as October. As noted, this corresponds with the main monsoon rains which concordantly coincide with high cloud cover. Given the crop calendar, it is very difficult to acquire quality optical imagery in an optimal time range to discriminate crop conditions given the repeat frequency of Landsat (16-day window).
Synthetic aperture radar (SAR) instruments offer abilities to assess crops due to their all-weather capabilities and sensitivity to crop and field characteristics (i.e., dielectric constant, roughness, and orientation) different from those derived from optical instruments. Thanks to this, SAR imagery can be captured at the best suited dates to extract unique features. However, historically SAR data have been limited due to no consistent, large-area operational acquisition strategies at appropriate scales; poor-quality digital elevation models (DEMs) required for processing; complex data structures relative to optical data; and lack of standardized workflows. Even the more progressive data acquisition plans have not met the requirements for operational monitoring of crop landscapes. For example, the ALOS–1 L-band acquisition strategy acquired an image in ScanSAR mode once every 46 days for the same area. For crops in Rakhine (Figure 1) this only provides a few images during the cropping season, making practical monitoring applications challenging.
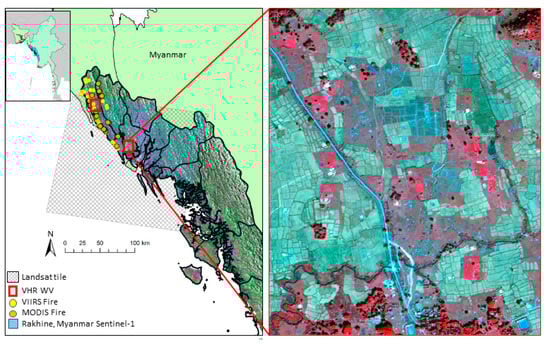
Figure 1.
Rakhine State, Myanmar study region where conflict has amplified risks of food security and created additional challenges to assess and monitor crop production across the patchy landscape. (Left): Study region with fires as detected from VIIRS (Visible Infrared Imaging Radiometer Suite) and MODIS (Moderate Resolution Imaging Spectroradiometer) satellite fire products during the 2016–2018 crop periods, example Landsat tile scale, and location of very high resolution (VHR) World View (WV) imagery (red boxes) for case studies and algorithm tuning. (Right): Very high resolution snapshot, false color composite (4: Near-infrared, 3: Red, 2: Green) illustrating small patchy fields, forest lots, and other land uses (red tones show forest and scrub, brown show individual barren crop fields during dormant season).
More availability from the recent (2014 and 2016) launches of Sentinel-1A and -1B has created new opportunities for using moderate-resolution (<30 m) SAR for food security assessment. This is especially relevant in cloud-prone regions, as well as during critical growth stages when intermittent clouds limit optical coverage [3,4,5,6,7]. However, an established approach of comparing current conditions to historical trends (e.g., 30-year climatology) or the past 5 years is not feasible given the relatively short archives. Further, the techniques for using automated SAR indices as indicators of food security are lacking compared to optical (i.e., NDVI anomalies).
Regardless of Landsat and Sentinel’s strength and limitations, these are the primary moderate-resolution, open access, and operational Earth Observation tools the remote sensing community has available for responding to “hot spot” food security crises. The overarching objective of this effort was to characterize recent production by categorizing fields into cultivated, fallow, or abandoned and illustrate how EO can be used to respond to food security events. Given security concerns, no robust quantitative ground truth data was available. Moderate-resolution Landsat-8 and Sentinel-2 optical imagery and Sentinel-1 radar imagery over the past three years (2016–2018) were used to classify cropland patterns. Exploratory analyses, data mining, time series analysis, thresholding, and qualitative assessments were all leveraged and applied to support a better understanding of food security in the region.
2. Methods
2.1. Satellite Preprocessing
Freely available, operational, moderate spatial resolution data were used to assess food security. All image preprocessing followed established best practices. We used our custom, open-source-based geospatial image processing (GIP) library and Python component GIPPY (GIP PYthon) to automate standardized preprocessing. GIPPY uses Python, C++ Boost libraries, GDAL, and Ubuntu LTS for data handling. Radar data was obtained as single look complex (SLC) Sentinel-1 from the Alaska Satellite Facility’s Vertex platform. SLC data were transformed into time series analysis ready data by removing thermal noise and executing radiometric corrections using shuttle radar topographic model (SRTM) data. To avoid incidence angle effects, only data with the same imaging mode (same incidence angle and small spatial baseline) were employed in this analysis. Optical data were processed into top-of-atmosphere (TOA) normalized difference vegetation index (NDVI) stacks along with cloud masks from all images acquired by Landsat (tile 135046) and by Sentinel-2 (tiles 46QDJ, 46QDH, and 46QEJ) for the past three years (Figure 2). These optical data were reprojected and resample to a 30 m resolution grid in UTM zone 46N projection. A small amount of very high resolution (VHR) images (n = 7) from the National Geospatial-Intelligence Agency (NGA) Commercial Archive Data (CAD) were processed into common TOA indices and used to support decision making and assessment routines given their submeter spatial resolution.
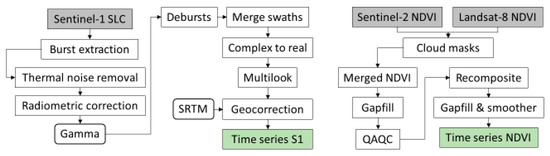
Figure 2.
Workflow of automated preprocessing routines for moderate-resolution radar and optical imagery into intermediate products and Analysis Ready Data for classifying field crop conditions. NDVI: Normalized difference vegetation index; QAQC: Quality assessment quality control; SLC: Single look complex; SRTM: Shuttle radar topographic model.
2.2. Sentinel-1 Mapping Approach
Inundation onset followed by increases in crop biomass, plant height, and leaf area index occur as rice plants are sowed and transition through growth stages. These growth stages can be categorized from sowing or transplanting into vegetative phases (tillering and stem elongation), to reproduction (panicle formation, heading, and flowering), and approach ripening and maturation prior to harvest. In this region, fields are typically inundated, both continuously and intermittently depending on local weather, labor resources, and irrigation schemes, until the maturation process. The changes in plant structure and growth stages, along with concordant inundation patterns, result in the unique SAR signal. By taking advantage of these dynamic ranges and field stages, the unique time series signal from Sentinel-1 can be used to map paddy extent and growth stages. The detailed scattering mechanisms are a function of wavelength and frequency, polarization (how the electric field is confined into one plane), and viewing geometry, and several studies have converged on best practices for using C-band SAR (Sentinel-1 is 5.405 GHz) for rice monitoring.
In this research application, the S1 analytical approach started with annual (2016–2018) arable land maps generated from time-series composites of S1 VH polarizations (VH cross-pol term is sensitive to dynamic vegetative canopy development [3,8]) using unsupervised K-means clustering. The clustering outcomes were then integrated with VHR imagery and digital elevation model data to mask out mountainous areas where very severe geometric distortion would lead to misclassification. This step provided general categories of land uses and land covers across the region. Next, pixel-wise time series profiles for agricultural classes were analyzed for patterns during key growth stage periods matched to the main monsoon rain periods. Case study fields were examined using very high resolution imagery from NGA’s CAD, World View, Google Earth, and Planet. Summary statistics (mean, maximum, minimum, and percentiles) using the time series S1 were then used to create profile signatures for the classes. Temporal signatures were examined for inflection points, slope during early vegetative stages, magnitude, absolute values, and timing to indicate rice patterns including potential abandoned, fallow, and “normal” fields (pixels) across 2016, 2017, and 2018 [3]. This enabled seasonal and annual comparisons of rice extent and rotations or transition across years. For example, fields might have gone rice-rice-rice during the main rain season indicating annual main season crop production over the past three years. Alternatively, fields might have gone rice-fallow-rice or rice-abandoned-fallow indicating different production cycles across the past three years.
2.3. Optical Mapping Approach
Changes in vegetation indices over time are a well-established technique to monitor agricultural fields. Similar to the time series S1 approach, the optical data cubes (stacks of analysis ready data) were converted into NDVI to gauge dynamic patterns in field conditions, cultivation, and production. In this region, substantial cloud and atmospheric attenuation were present in much of the optical data, especially during key growth stages given that the main crop season occurs during the monsoon rains. More advanced processing streams, such as harmonizing Landsat-8 and Sentinel-2, did not improve overall quality for this particular application. In an attempt to circumvent this noise and provide robust input for interannual comparisons, we implemented an iterative processing stream to remove and normalize the effect of clouds. All images of NDVI-TOA from Landsat and Sentinel-2 were merged into a single virtual data cube. Then date specific, default cloud masks (i.e., FMASK) were applied to remove corrupted NDVI values. Based on visual inspection of select masks, we observed that some cloud masks include areas without cloud cover and other masks miss clouds. To guard against cases where masks remove too many areas, we compared NDVI of the cloud-masked pixels with an interpolated NDVI based on previous dates. If the original NDVI value fell within a margin of ±0.05 of the interpolated value, then the cloud mask for that pixel was ignored. To reduce the effect of missed clouds and to provide a regular time series, we then recomposited the interpreted daily time series into 8-day periods and take the maximum NDVI for each time. This is followed by a smoothing step. The smoother we apply is a least squares penalized smoothing spline similar to the Whittaker smoother [7]. This is the solution to the following linear system;
where is the original 46 element time series, is the smoothed time series and is a 46 by 46 square matrix given as:
where is an adjacency matrix of the form:
and D is a diagonal matrix of the row sums of A, and I is the identity matrix. Finally, the parameter , where positive values closer to 1 increase the smoothness of the result. In this analysis, we use .
Next, using the fully preprocessed optical data cubes a series of data mining approaches were explored in an attempt to evaluate the ability of fused Landsat-8 and Sentinel-2 to characterize field outcomes and crop production, including fallow and abandoned. A broad-scale land use and land cover mask created from Sentinel-2 and a DEM was first applied to eliminate general non-crop areas (mountainous, waterbodies, forest, and built). Next, a machine learning technique leveraging the random forest algorithm [9] was explored following practices [6,7] to characterize interannual (2016, 2017, and 2018) crop fields and compare changes. Subsequently, the workflow was further adapted by using squared differences between years within the NDVI time series. Then, systematic thresholds were applied and K-means clustering was executed on those extracted differences to group fields. Finally, time series patterns of these groupings were examined to assess inflection point timing, slope, and absolute changes as indicators of crop development and field outcomes.
Accuracy assessments following established practices [3] were carried out for the rice map products. VHR imagery was juxtaposed with 200 stratified random samples across the study domain. This was carried out for each year (2016, 2017, and 2018) independently. To provide additional insight box and whisker plots for the rice outcome classes were generated to gauge variability and performance across years and growth stages.
3. Results and Discussion
3.1. Satellite Technical Outcomes and Considerations
In this application, optical data had limited ability to confidently assess field-scale crop production and crop status in an operational (automated) approach. The number of valid (non-cloud masked) observations during the key months, such as when crops begin to ripen and approach harvest (June to September), was typically only a few at most for any given field. This limits phenological analyses approaches that require consistent time steps to detect deviations from trends or interannual comparisons of patterns. While smoothing and interpolations techniques gapped filled the combination of Landsat-8 and Sentinel-2 NDVI products, the uncertainty and remaining noise created challenges for confidently distinguishing outcomes of field cultivation cycles (fallow, harvest, and abandoned). Further, the spatial variability of quality pixels (“salt and pepper” artifacts), combined with relatively small fields (Figure 1) within a patchy landscape, created challenges for identifying adjustments in automated processing chains and thus made simple routines unobtainable (Figure 3).
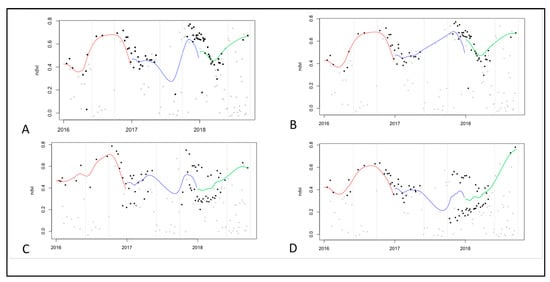
Figure 3.
Example optical timeseries processing chains colored by year. Points show raw NDVI values colored gray if classified as cloud in first QAQC processing pass and black if not. (A,B) are for the same pixel. (B) is the result after removing additional cloud scenes with 2nd QAQC routine demonstrating the sensitivity of the preprocessing methods when few quality scenes are observed. (C,D) are different pixel examples showing how interpolation and smoothing is challenging during key growth stages. Both show a failure of the cloud masks late 2017 into early 2018.
The K-means clustering method was used to map rice extent over the three consecutive years using the time series Sentinel-1 VH channel. K-means was first applied given the lack of sufficient available ground truth data. Based on the prior knowledge of this region, we initially ran many classifications to test the ability to create a general land use–land cover type map for broad classes over three years, as shown in Figure 4 (example shown is 6 classes). The classes are general land types at this stage which represent unique pixels of similar statistical properties. Next, we used time series phenology to identify cropland areas (pixels) for further analysis (Figure 4). For example, leveraging backscatter increase (>6 dB) and dynamic range of VH to isolate rice fields during the major rice season through selected temporal windows (i.e., onset of rain season and sowing and transplanting). Here, we show an example using the initial 2018 classification map over three years (Figure 5).
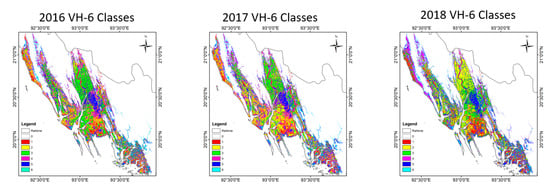
Figure 4.
General land use—land cover classes were created using simple K-means clustering of time series Sentinel-1 VH to help mask out non-cropland areas and focus further time series analysis on arable landscape pixels.
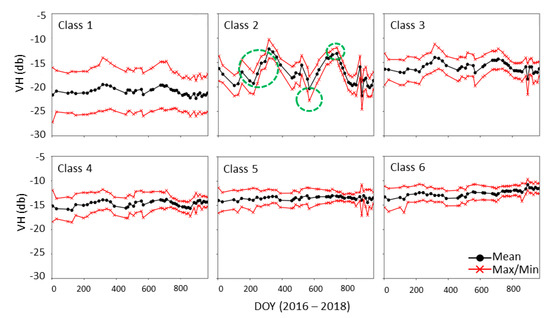
Figure 5.
Example Sentinel-1 VH time series aggregated to the broad land use—land cover classes illustrating varying phenological patterns attributed to cropping dynamics.
As can be seen, Class 2 and 3 show relatively sharp increases and dynamic range during crop seasons as compared to the other clusters (green circles illustrating features). Evident are the “peaks” representing mature biomass development of growth stages. Further, the cyclical pattern across years captures the timing of cultivation and production consistently from 2016 to 2018. The inflection points in slope in this example occurs roughly 9 April to 31 August, 4 April to 19 September, and 14 April to 24 August across 2016 to 2018, respectively. By extracting these patterns, maps of rice cultivation was feasible (Figure 6).
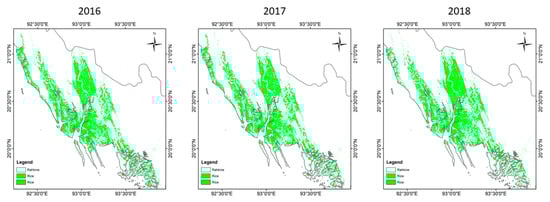
Figure 6.
Annual rice extent across Rakhine from year 2016 to 2018 as indicated by time series Sentinel-1 phenology.
Accuracy assessment using the co-timed VHR imagery to assess rice cropping extent showed overall accuracy (OA) ranging from 86.5, 87.5, and 91.0% for 2016, 2017, and 2018, respectively (Table 1). The VHR was juxtaposed across the raster maps of rice extent and leveraged the stratified sampling scheme. This helped create a robust and statistically valid error matrix given the constraints of mapping in a challenging landscape with limited ground truth data. The lowest user’s accuracy (UA) and producer’s accuracy (PA) was in 2017 with 79.9% for non-rice and 2018 with 70.4% for non-rice, respectively. These are relatively strong accuracy given that the error matrices are essentially 2 × 2 contingency tables and identifying other broad classes (i.e., forest, water, and built) is common practice and including these additional classes would inflate the accuracy values. In this application, understanding the rice outcomes was the ultimate focus. The time series (Figure 7) were key to distinguishing the outcomes. For any given day, overlap between the rice outcome classes exist in VH polarization; therefore, time series is absolutely required in order to categorize the outcomes for the cropping season. Optical data alone would not be capable of distinguishing these outcomes and the value of the moderate spatial resolution, open access radar was critical for this application.

Table 1.
Accuracy assessment for 2016, 2017, and 2018 using co-timed VHR optical imagery. OA: Overall accuracy; PA: Producer’s accuracy; UA: User’s accuracy.
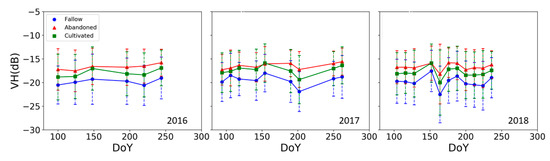
Figure 7.
Time series box and whisker plots during key growth stages for 2016 to 2018 for rice outcomes (fallow, abandoned, and cultivated) using VH polarization Sentinel-1 C-band radar. DoY: Day of Year.
3.2. Food Security Assessment Outcomes
The changes in the time series satellite information provided a mechanism to gauge changes in production. Using the technical approach described above, we ultimately categorized crop areas into fallow, abandoned, or cultivated for each year. For example, thresholding pixels with very low consistent VH (−20 dB) throughout the growing season was a useful method to identify fallow fields without rice cultivation cycles. The workflow allowed for crop fields to be qualitatively interpreted from the optical vegetation indices (i.e., NDVI time series differences) and their patterns across years. However, we noted these hot spot areas need to be cautiously considered as the timing of cloud cover was a driver of signals as opposed to differences in field conditions. In comparing the optical-derived abandoned hot spots to the radar (Sentinel-1 time series), the agreement was moderate. Optical interannual comparisons primarily identify the regions around Sittwe and Ma Gyi Chanug along the coast and the crop fields between Tein Nyo and Kyauktaw along the Kaladan River. Other regions where intense conflict has been reported and where and when VIIRS and MODIS fire products detected activity that were identified in Sentinel-1 were not consistently identified in the optical imagery when using automated techniques. Several regions of intense and widespread failed and abandoned cultivation derived from the Sentinel-1 occurred adjacent to areas of hot spot (locations of activity) fire activity (Figure 1 and Figure 8). Ultimately, the S1 imagery was the driver of the assessment rather than the optical data in this case.
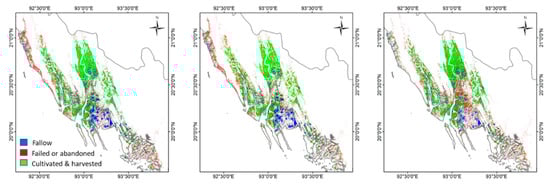
Figure 8.
Assessment of fallow, failed or abandoned, and cultivated rice paddies across Rakhine for 2016, 2017, and 2018 using time series Sentinel-1 showed nearly one-third of paddies are classified as failed or abandoned and anecdotally were spatially associated with reports of conflict and qualitatively affiliated with burnt area signals and limited field reports.
The dual pol, time series Sentinel-1 indices provided a more confident outcome in this application. When using time series for assessment having consistent metrics at systematic intervals is critical. However, a limitation is the relatively short timeline of available imagery that does not allow for a full comparison to a “normal baseline” sometimes defined by the previous 5 years. In this effort, absolute values, changes, and comparisons of the backscatter slope across years during estimated growth stages (i.e., transplanting, tillering, and heading) was key for discriminating cultivated and harvested, fallow, or failed or abandoned. Assumptions on the quality of training data (visual interpretation) had to be made considering the lack of ample ground truth. In this effort, the VHR imagery, anecdotal information, and expert knowledge of rice practices were all collectively used to make decisions.
Fallow area fluctuated between 11 and 15% of arable land area between 2016 and 2018. Cultivated and harvested area decreased by about 3% in 2018 compared to 2017 and this roughly corresponds to ongoing reports and limited anecdotal FAO surveys. Abandoned area fluctuated with a jump of nearly 7% in 2018 compared to 2017 (Table 2, Figure 8). We note that these estimates cannot be robustly evaluated using ground truth due to lack of safe access from conflict. While the data has uncertainty and we emphasize caution in drawing hard conclusions, we suggest use of automated moderate-resolution metrics and rapidly deployable techniques are valuable tools for supporting food security assessment.
Table 2.
Breakdown of cropland outcomes across crisis years in Rakhine, Myanmar.
We highlight that this work presents an approach to address availability and stability pillars of food security, which is complex and has several components that can be more challenging to map using satellite data alone. For example, other pillars of food security include access and utilization and these variables require social and economic methodologies for comprehensive assessment. Thus, food security requires highly interdisciplinary teams. Lastly, we emphasis that conflict needs more consideration in food security programs and could become a major driver in the next decade. Unintended consequences of conflict might also be observed as changes in productivity and cultivated area expansion into new fringes or areas have been seen in other examples [10].
Food security risks will grow in as climate change, migration, and conflict continue to occur. In regions when all these factors compound simultaneously it is likely food security will evolve into a full-blown humanitarian crisis without intervention. Ultimately, food security touches many Sustainable Development Goals including zero hunger (no. 2) and peace (no. 16). Understanding holistic and multidimensional views on development will become critical to understand tradeoffs and outcomes [11,12]. Therefore, decision support tools need to consider adapting to measure responses to conflict and be capable of integrating drivers beyond agroclimatological variables and include human perspectives and interpretation.
4. Conclusions
Operational, open access, moderate spatial resolution, time series radar imagery was crucial for supporting food security assessment in this effort. The approach here was fully automated in an effort to provide transparent and robust metrics. The optical data cubes provided supportive and anecdotal insight; however, cloud cover during key growth stages made optical data cubes less useful in this case. A limit of the radar data is the lack of longer time series for deeper annual comparisons. Combining the moderate-resolution radar and optical data with insights from very high resolution imagery was a synergistic effort that helped provide valuable information. Nearly one-third of active rice paddies were identified as abandoned or failed with approximately half of the arable landscape cultivated during the main monsoon rain season. We highlight the traditional agroclimatology signals are not clearly evident in conflict-driven crop outcomes which require ability to detect full cycles of crop stages and practices (i.e., planting through harvesting). This research application shows how moderate-resolution open access satellite remote sensing can complement food security hot spot analyses. The approaches are relatively straight forward and use all open source components.
Author Contributions
Conceptualization, N.T.; methodology, X.H., B.Z., N.T.; software, X.H., B.Z.; investigation, X.H., B.Z., N.T.; writing, review and editing, N.T., X.H., B.Z.
Funding
This research was funded by NASA Rapid Response Grant Number: 80NSSC18K0818.
Acknowledgments
We thank colleagues at FEWS NET and FAO for dialog on food security in the region and assessments. Three reviewers and editors greatly improved this manuscript with constructive feedback.
Conflicts of Interest
The authors declare no conflict of interest.
References
- Food and Agriculture Organization of the United Nations. Available online: http://www.fao.org/home/en (accessed on 12 June 2019).
- World Bank. Myanmar—Analysis of Farm Production Economics (English); World Bank Group: Washington, DC, USA, 2016; Volume 1, p. 258. [Google Scholar]
- Torbick, N.; Chowdhury, D.; Salas, W.; Qi, J. Monitoring rice agriculture across Myanmar using time series Sentinel–1 assisted by Landsat–8 and PALSAR–2. Remote Sens. 2017, 9, 119. [Google Scholar] [CrossRef]
- Chris, F.; Peterson, P.; Landsfeld, M.; Pedreros, D.; Verdin, J.; Shukla, S.; Gregory Husak, G.; Rowland, J.; Harrison, L.; Hoell, A.; et al. The climate hazards infrared precipitation with stations—A new environmental record for monitoring extremes. Sci. Data 2015, 2, 150066. [Google Scholar] [CrossRef]
- Bouvet, A.; Le Toan, T.; Lam-Dao, N. Monitoring of the rice cropping system in the Mekong Delta using ENVISAT/ASAR dual polarization data. IEEE Trans. Geosci. Remote 2009, 47, 517–526. [Google Scholar] [CrossRef]
- Nelson, A.; Setiyono, T.; Rala, A.B.; Quicho, E.D.; Raviz, J.V.; Abonete, P.J.; Maunahan, A.A.; Garcia, C.A.; Bhatti, H.Z.M.; Villano, L.S.; et al. Towards an Operational SAR-Based Rice Monitoring System in Asia: Examples from 13 Demonstration Sites across Asia in the RIICE Project. Remote Sens. 2014, 6, 10773–10812. [Google Scholar] [CrossRef]
- Torbick, N.; Huang, X.; Ziniti, B.; Johnson, D.; Masek, J.; Reba, M. Fusion of Moderate Resolution Earth Observations for Operational Crop Type Mapping. Remote Sens. 2018, 10, 1058. [Google Scholar] [CrossRef]
- Whittaker, E.T.; Robinson, G. The Calculus of Observations. Trans. Fac. Act. 1924, 10, 1924–1925. [Google Scholar]
- Huang, X.; Ziniti, B.; Torbick, N.; Ducey, M.J. Assessment of Forest above Ground Biomass Estimation Using Multi-Temporal C-band Sentinel-1 and Polarimetric L-band PALSAR-2 Data. Remote Sens. 2018, 10, 1424. [Google Scholar] [CrossRef]
- Breiman, L. Random Forests. Mach. Learn. 2001, 45, 5–32. [Google Scholar] [CrossRef]
- Landholm, D.; Pradhan, P.; Kropp, J. Diverging forest land use dynamics induced by armed conflict across the tropics. Glob. Environ. Chang. 2019, 56, 86–94. [Google Scholar] [CrossRef]
- Pradhan, P.; Costa, L.; Rybski, D.; Lucht, W.; Kropp, J. A Systematic Study of Sustainable Development Goal (SDG) Interactions. Earth’s Future 2017, 5, 1169–1179. [Google Scholar] [CrossRef]


© 2019 by the authors. Licensee MDPI, Basel, Switzerland. This article is an open access article distributed under the terms and conditions of the Creative Commons Attribution (CC BY) license (http://creativecommons.org/licenses/by/4.0/).