1. Introduction
While many recent articles begin by recounting the fact that over ½ of the world’s people now reside in cities, the increase in the absolute number of people now living in cities is the more dramatic statistic. In 1900, 220 million people lived in cities. By 2000, this number had increased ten-fold to 2.84 billion [
1]. The majority of future growth is expected to occur in cities in Asia and Africa. The United Nations states that by 2030, seven of every ten urban residents will be living in either Asia or Africa [
2]. Therefore, the African urban transition will have profound and long-lasting impacts on the lives of a large percentage of the world’s population.
A UN-Habitat-sponsored study of urban expansion between 1990 and 2015 used aerial photographs and population data to quantify changes in built-up areas, density, and informality in 200 cities [
3]. In cities worldwide, per capita density is decreasing as land consumption outpaces population growth. In cities in more developed nations, every additional person increased the urban area by a factor of 1.2. However, in cities in less developed nations, every additional person increased the urban area by a factor of 1.75. Therefore, the increase in per capita land consumption is substantially higher in cities in less developed nations. The study measured expansion in 16 Sub-Saharan African cities and density decreased in twelve of these locations. The average built-up density in the 16 cities was 121.5 people/ha (minimum of 52.5 to a maximum of 309.9). In summarizing the study’s findings, Burdett and Rode noted that lower-density development generally reduces the reliability of providing public transportation, power, and water infrastructure and increases infrastructure costs and car dependence. Since infrastructure investments last from 30 to 100 years, the establishment of low-density urban patterns has long-term implications for future residents, urban finances, and subsequent development [
4].
Another challenge in many Sub-Saharan Africa cities is the rise of informality and specifically, informal housing. While both informal housing and slum housing often occur, the terms are frequently conflated and definitions contested [
5]. UN-Habitat defines a residence as a slum if it lacks one or more of the following characteristics; durable, permanent construction that protects residents from climate extremes, sufficient living space, easy access to safe, affordable, and sufficient water, access to sanitation facilities, and security of tenure to prevents forced evictions. Therefore, unlike slum housing, informal housing is not necessarily substandard in quality. However, in both informal and slum housing, residents do not have a legal claim to occupy the house or land and the structure does not conform with local land use planning or zoning ordinances [
5].
Fox [
6] noted that over 60% of residents in Sub-Saharan African cities live in informal housing. Fox attributed this high level of informality to rapid urbanization, urban poverty, and inappropriate institutional arrangements. In the category of inappropriate institutional arrangements, Fox included reasons such as ill-suited urban planning practices often inherited from colonial legacies, the lack of municipal authority and autonomous funding relative to the federal government, informal tenure systems, and a general lack of political will. While the World Bank stated that, “informality is a brake on land development, constraining an efficient spatial transformation,” it represents a major challenge for nations who recognize the importance of urban development for economic growth but have limited financial resources for public investment [
7].
This research focuses on the urban spatial transformation occurring in Addis Ababa, Ethiopia and how rapid growth coupled with a major public housing initiative is reshaping this East African city. The City Administration, in conjunction with the federal government, initiated a large-scale housing program in 2005 to increase formal home ownership opportunities for low and moderate income residents. The housing program has evolved over time [
8]. By mapping and comparing land uses in 2006 and 2016, we can measure the changes with particular attention to the prevalence and location of different housing types throughout the city and determine the impact on urban density. In the following section, we introduce the city’s history, biophysical conditions, and physical organization, summarize its land tenure practices and the role of planning, and provide an overview of the publically sponsored, large-scale affordable housing program. We conclude this section with our research questions.
1.1. Addis Ababa, Ethiopia Background
Although Ethiopia is the second most populated African country, it is one of continent’s least urbanized countries. Only 20.7% of Ethiopian residents live in urban settlements [
9]. The Ethiopian Census of 2007 reported that 2.72 million people lived in Addis Ababa. For 2017, the Ethiopian Central Statistical Agency estimated 3,433,999 residents. This is the largest city in the country and its population growth is due to both in-migration and natural population increase. However, consistent with many African cities, the population fluctuates seasonally as people move between agricultural and urban areas [
1].
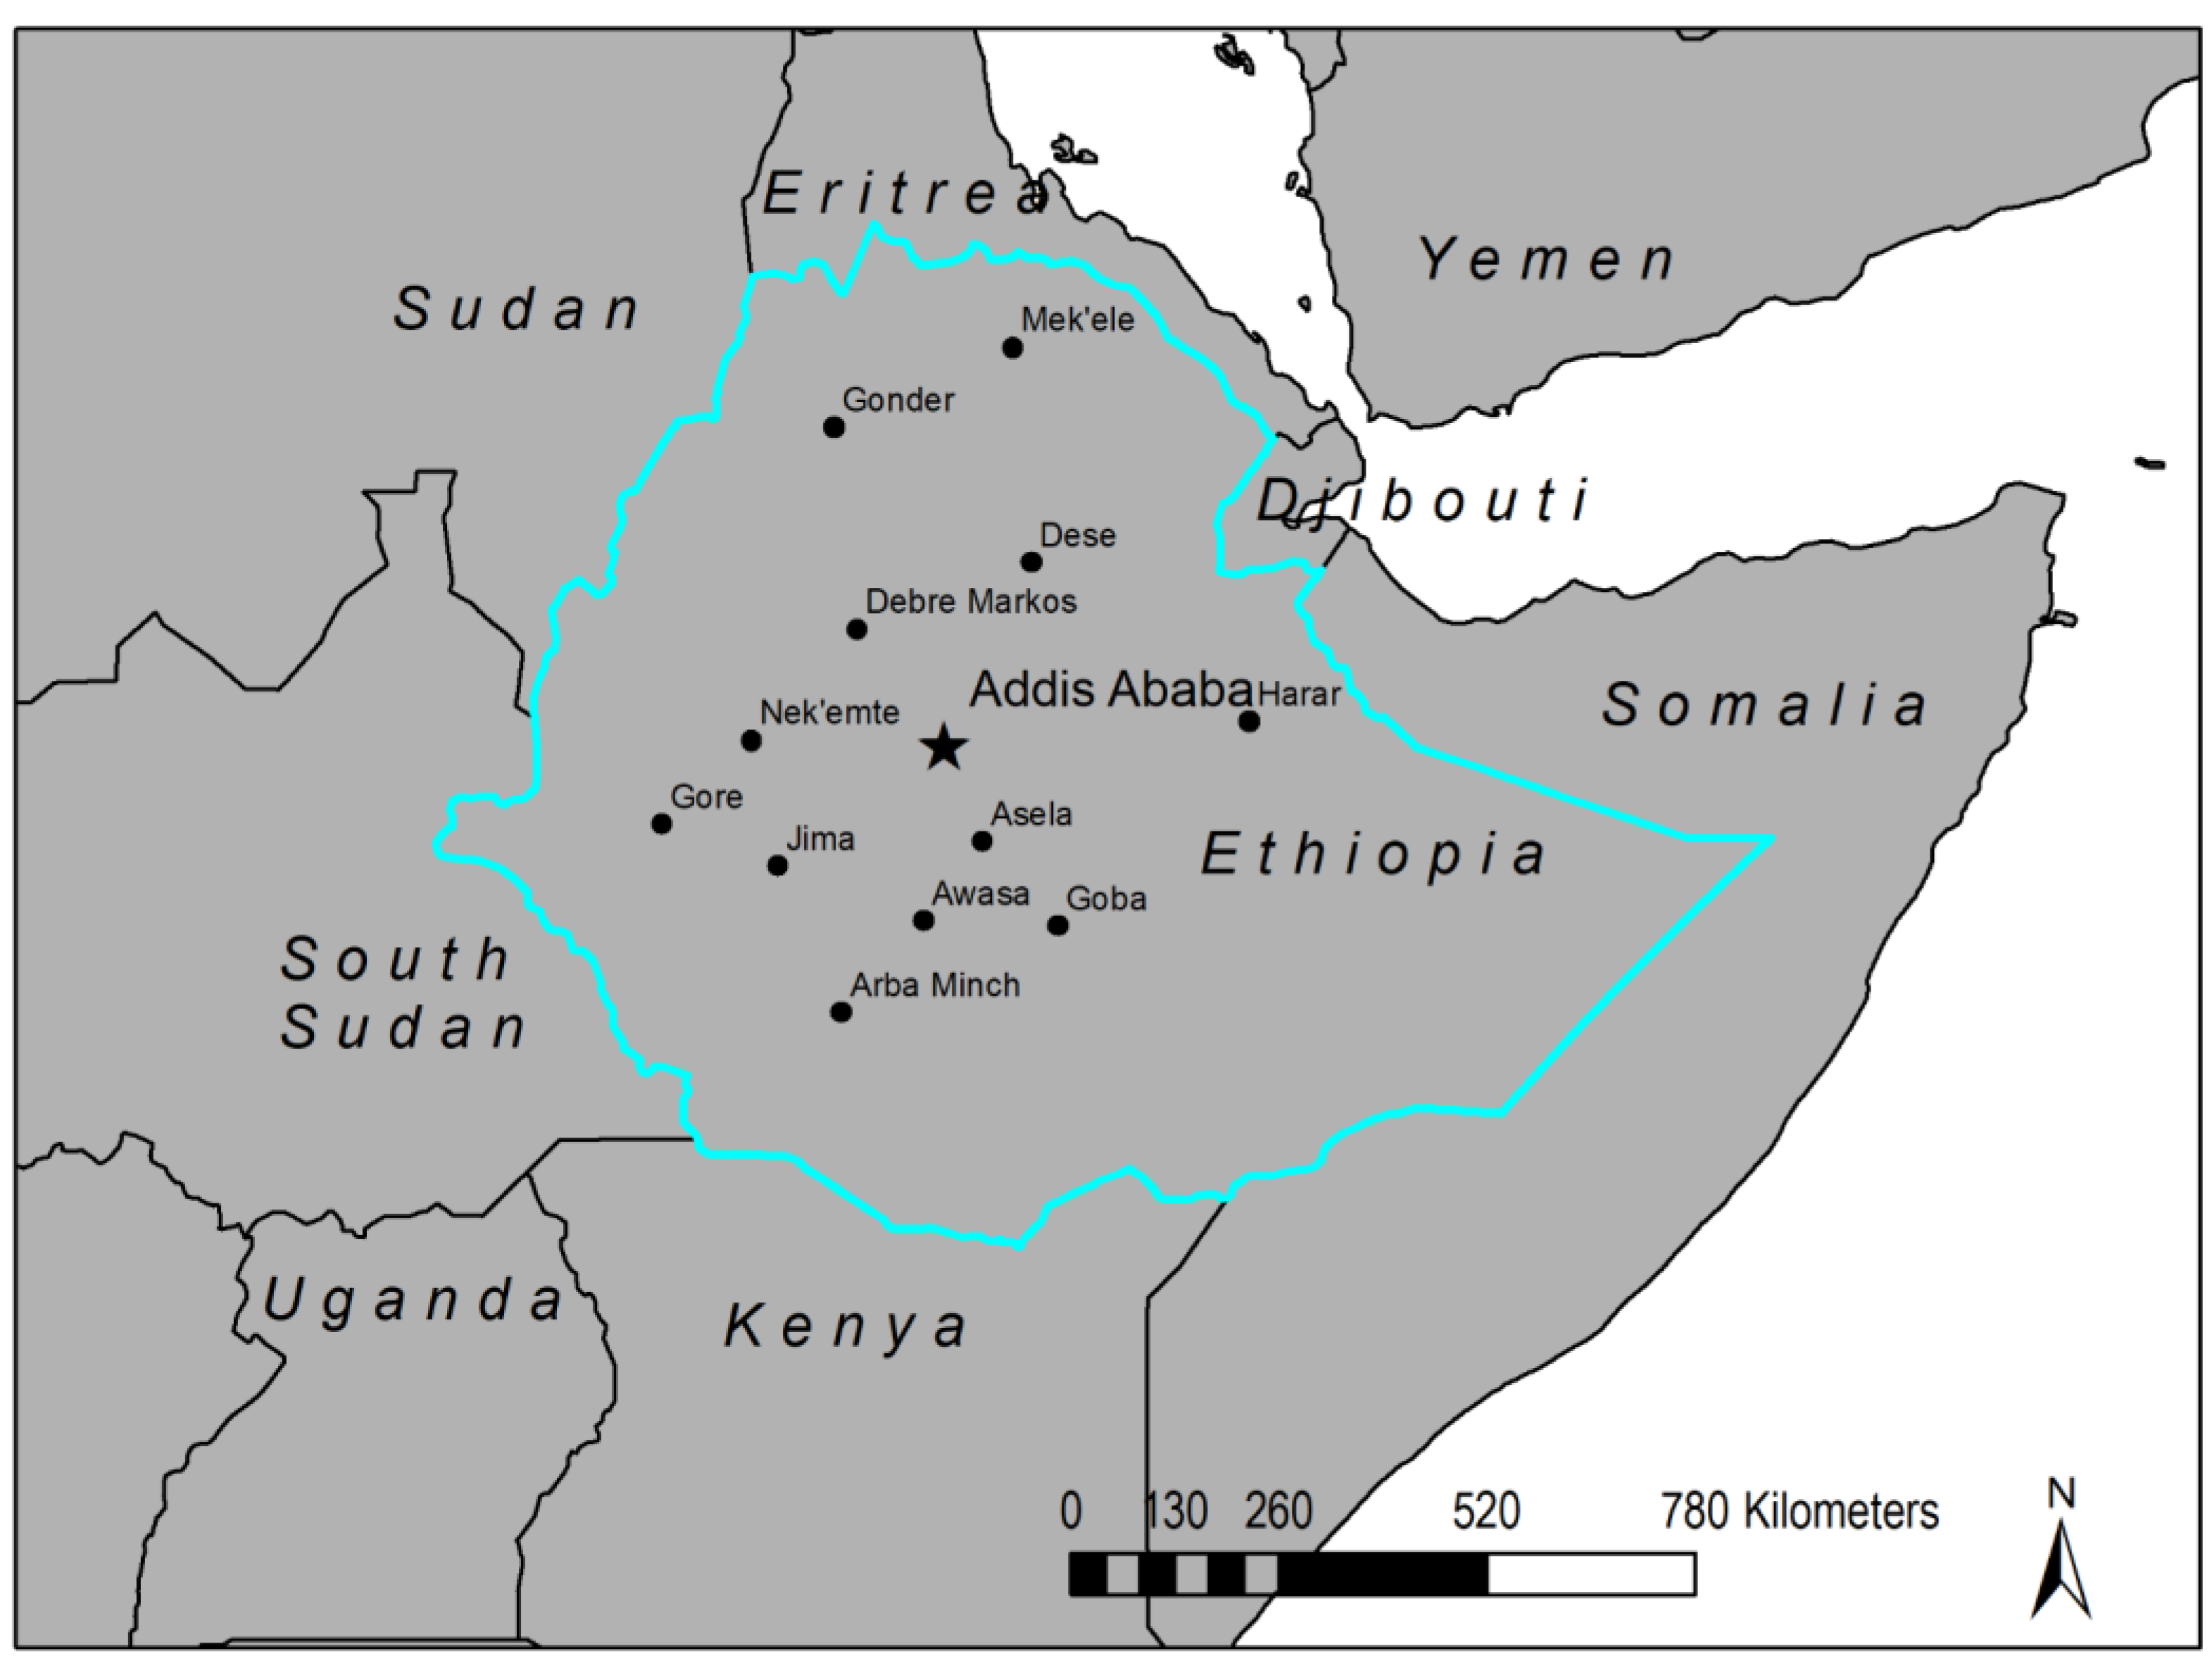
Despite Ethiopia’s long history of civilization, Addis Ababa is a relatively new city. After uniting the tribes to form the modern country of Ethiopia, King Menelik II established Addis Ababa as the country’s centrally located capital in 1886 (
Figure 1). Addis Ababa is one of the highest cities in the world with an elevation ranging from 2100 to 3000 meters above sea level. This elevation explains its moderate climate. Temperatures range between 15–18 °C with highs of 24 °C and lows of 10 °C. The city receives over one-half of its annual 110 cm (43 inches) rainfall during the summer months of June, July, and August [
10]. The city is divided into two watersheds; the Big Akaki (the eastern and central 2/3rds of the city) and the Little Akaki (the western 1/3). While the Big and Little Akaki are the city’s major rivers, five smaller rivers and many streams also flow through the city. These seasonal rains regularly result in urban flooding and flooding is expected to worsen with increasing imperviousness and climate change [
11].
1.2. Land Tenure Practices
While Ethiopia never experienced colonialization, it had an imperial ruler until 1974 and was occupied by the Italians from 1935 to 1941. The lack of a colonial ruler may explain the city’s organic street network and why informal housing is dispersed throughout the city. Ethiopia’s changing land tenure practices have reflected the ideologies of the country’s different governments [
8]. Prior to the overthrow of Emperor Haile Selassi in 1974, land was privately owned, predominantly by the ruling elite. Less than 1% of the population owned 70% of Ethiopia’s arable land and 80% of Ethiopians lived as tenant farmers. Most of the urban land was owned by few individual landlords and only less than 5% of the population of Addis Ababa owned 95% of the city’s land [
12].
After the overthrow of Emperor Haile Selassie, the ‘Derg’, a Soviet-sponsored junta, formed a new government and nationalized all privately-held land. In 1975, the ‘Derg’ passed Proclamation No. 47, “Government Ownership of Urban Lands and Extra Housing Proclamation”. This proclamation stated that a family could only possess their housing unit and any extra structures were confiscated by the state. As a result, the government took possession of a large portion of the city’s housing stock and subsequently decreased housing rents significantly. However, between 1975 and 1995, the state constructed very little new housing despite Addis Ababa’s increasing population. Additionally, little to no public investment was made in maintaining or upgrading the existing
Kebele rental housing units. While the socialist government created a Housing Cooperative program to encourage collective efforts, relatively few housing units resulted [
8].
In 1991, the Ethiopian People’s Revolutionary Democratic Force (EPRDF) overthrew the ‘Derg’ and established the government that continues today. The country is divided into nine states and the cities of Addis Ababa and Dire Dawa are two autonomous administrative areas with powers equal to a state. Early in this government’s term, it made several efforts to address affordable urban housing in Addis Ababa. The first effort was to discourage rural migrants from moving to Addis Ababa and to encourage them to move to one of Ethiopia’s secondary cities. The other effort was a market-oriented housing program that offered private developers an array of subsidies to construct new housing in Addis Ababa. Neither effort produced significant changes and the presence of informal housing dramatically increased. In 2003, 34.1% of Addis Ababa’s housing stock was composed of informal housing [
8].
Around 2000, the United Nations’ Millennial Development Goals called for action to address issues of environmental sustainability and poverty reduction [
13]. This coincided with Ethiopia’s improving economic situation and the country’s shift toward poverty-focused development strategies and infrastructure investment [
8]. Between 2002 and 2012, Ethiopia experienced an average annual increase of 10.3% in its economic growth rate. In Addis Ababa, this economic improvement reduced the number of low income residents from 80% to 66%. In 2017, Ethiopia overtook Kenya as having the largest economy in Eastern Africa [
14]. Recent surveys estimate that percent of people living in poverty is continuing to decline. In 2015/16, the Ethiopian government reported that 23.5% of its population lived beneath the poverty line and this figure was 16.8% in Addis Ababa. Despite these gains, Ethiopia is still a relatively poor country (ranked 164/187 by the World Bank in 2017) but it aspires to become a lower middle-income nation by 2025 [
15].
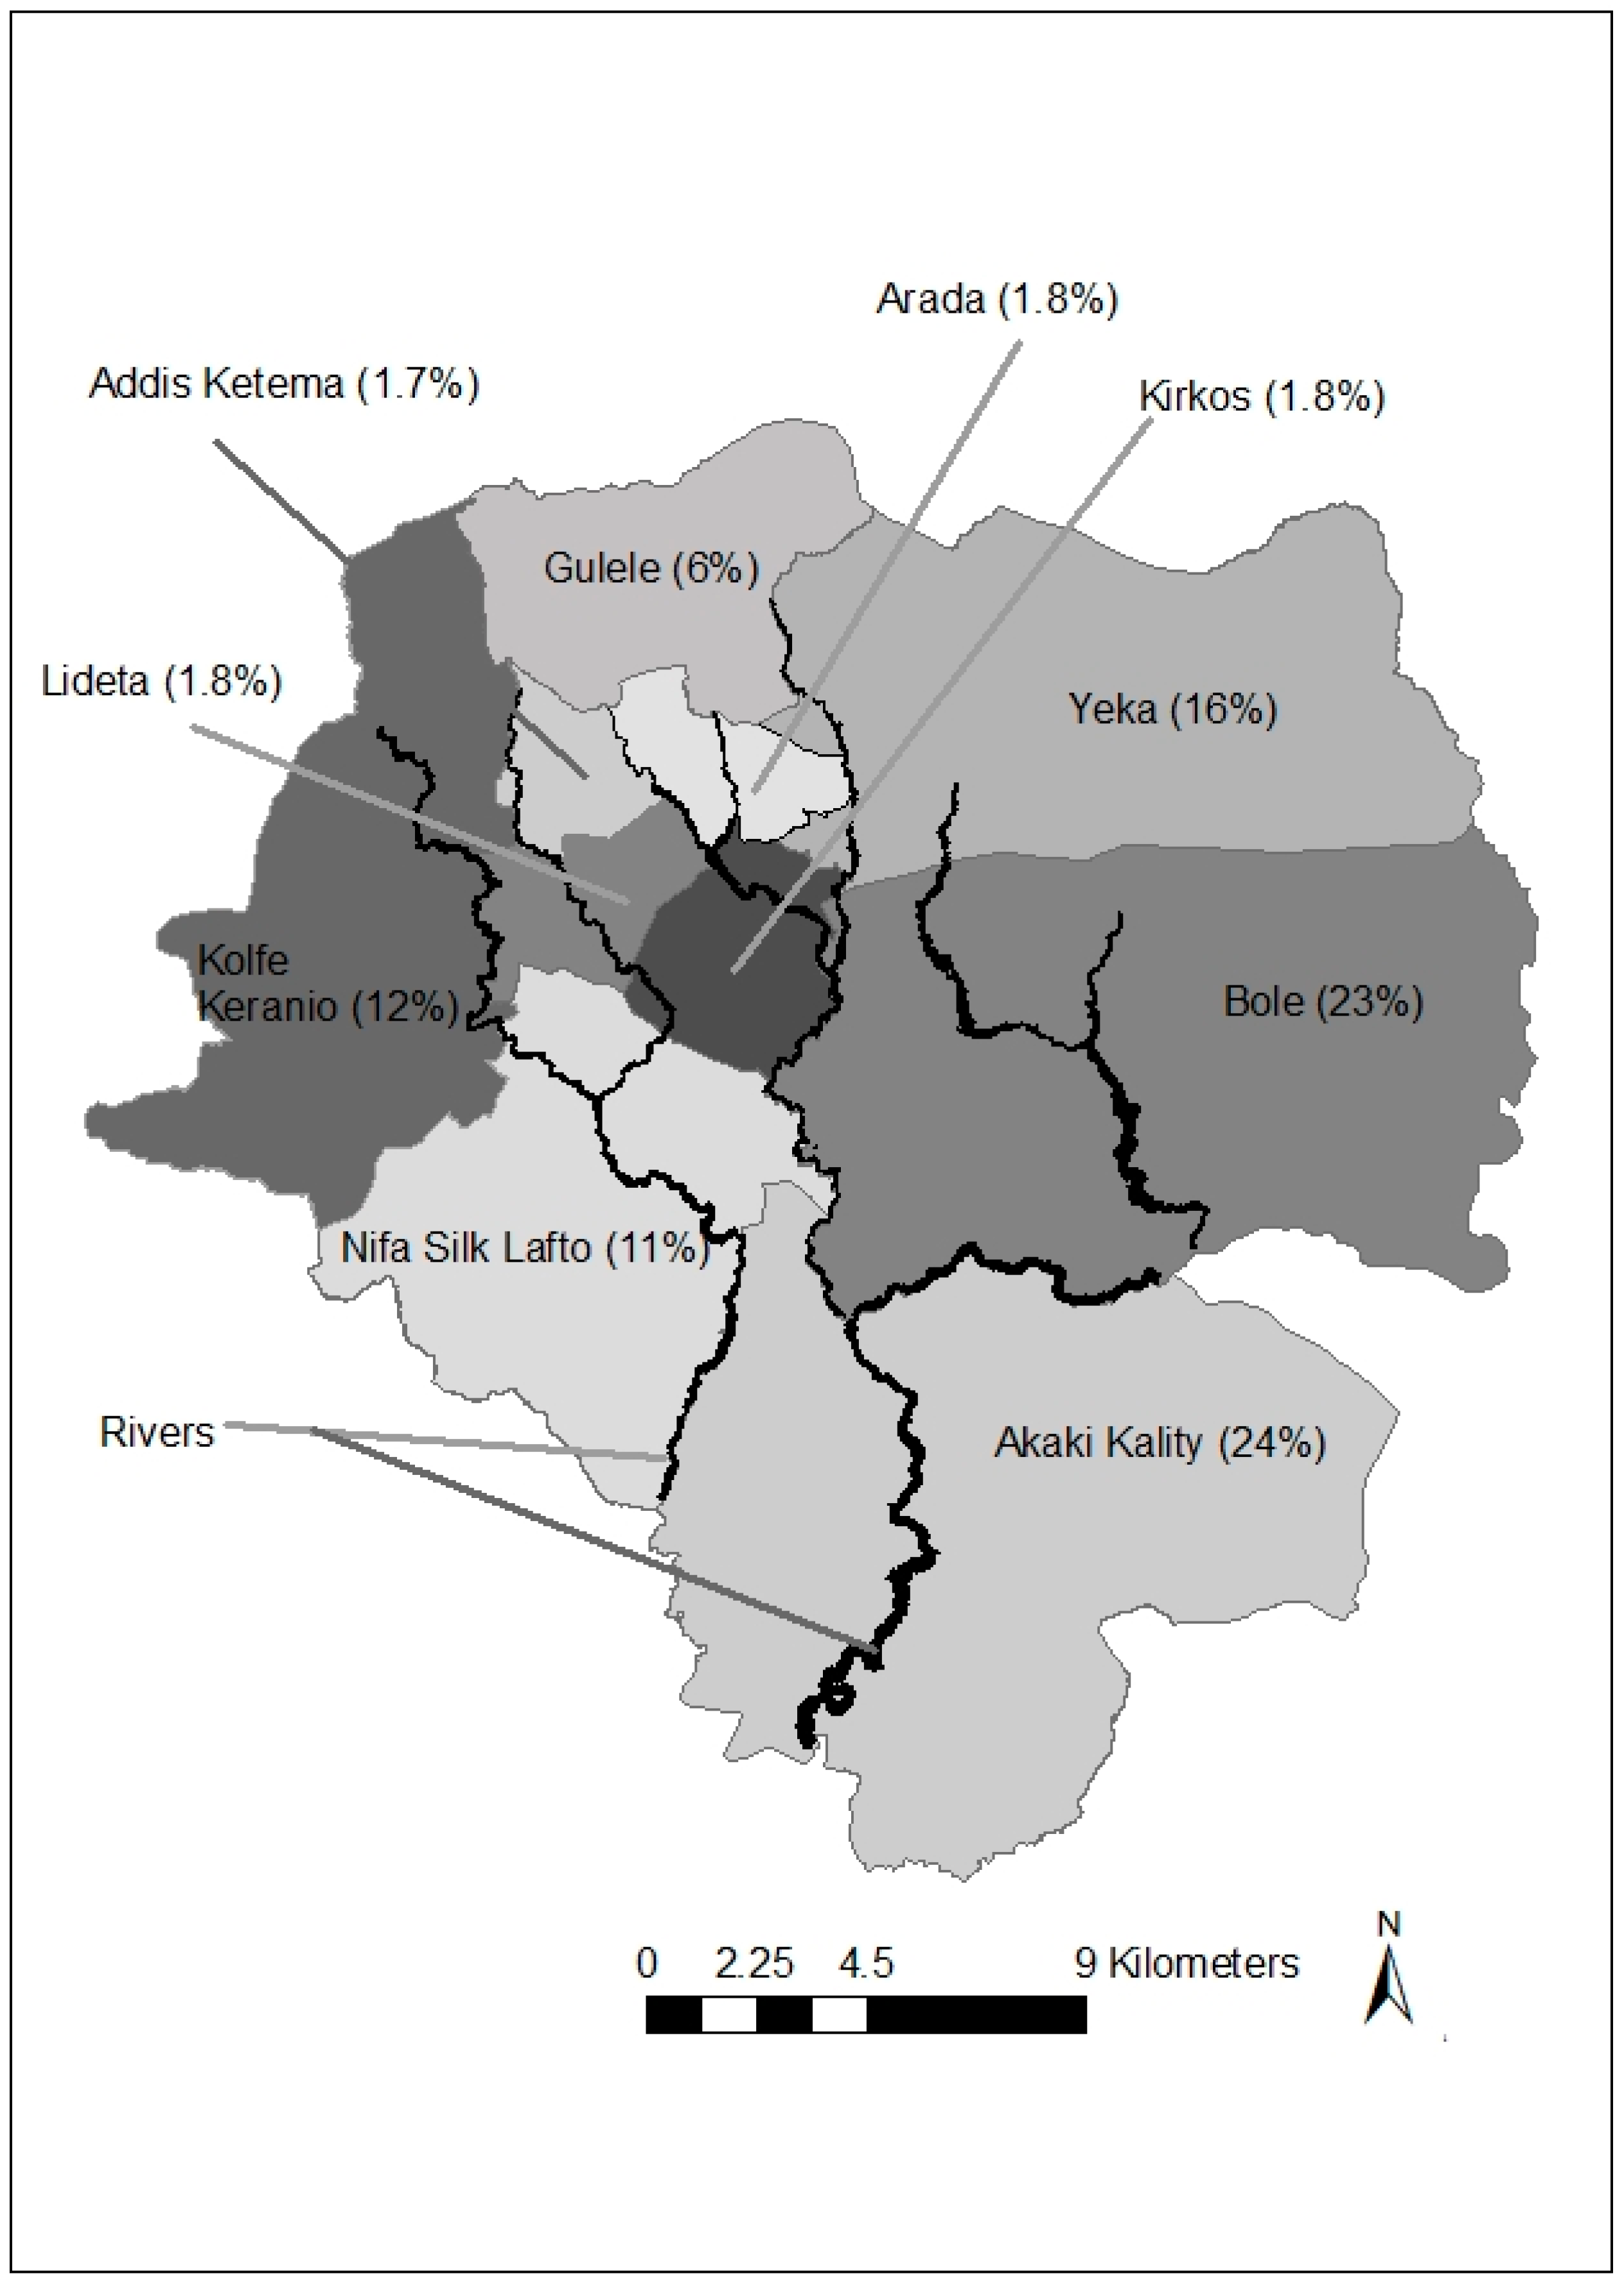
Currently, Addis Ababa is divided into ten administrative sub-cities (
Figure 2). Four central sub-cities comprise the oldest portions of the city. The four central sub-cities of Addis Ketema, Arada, Kirkos, and Lideta occupy only 8% of the city’s total area (5200 ha
2). Six significantly larger sub-cities surround these central sub-cities. The outlying sub-cities of Akaki Kitaly, Bole, Kolfe Keranio, Gulele, Nifas Silk Lafto, and Yeka collectively equal 92% of the total area (46,800 ha
2). Separating the four central sub-cities from the six surrounding sub-cities highlights changes between the older and newer parts of the city. In Addis Ababa, urban planning and land development are the responsibilities of the City Administration. Twenty-five percent of the city’s budget is spent preparing and servicing land for development. Cirolia and Berriford [
16] compared the drivers of development in three African capital cities; Addis Ababa, Ethiopia, Nairobi, Kenya, and Harare, Zimbabwe. They concluded that unlike in Nairobi and Harare, government efforts lead development in Addis Ababa and there has been relatively little private development. In contrast with Nairobi and Harare, [
16] infrastructure in Addis Ababa follows the planning agenda and leads investment.
1.3. Public Housing Development
To address poverty and the lack of affordable housing nationwide, the federal government initiated a large-scale public housing program, called the Integrated Housing Development Programme (IHDP), in 2005 [
8]. Unlike earlier efforts to incentivize private development of low-income housing, IHDP is a public effort using money from either the federal treasury or borrowed by the government from the state bank. The initial goals of this housing program were to construct 400,000 units countrywide, create 200,000 construction jobs (thus decreasing unemployment rates), instigate 10,000 micro-enterprises, and enhance the construction industry with the development of skilled labors and material suppliers.
The IHDP, and the Growth and Transformation Plans I & II that followed in 2009 and 2016, respectively, have focused on increasing the supply of owner-occupied housing for low and middle-income residents. These units are locally referred to as ‘condominium’ housing. Interested low-income residents enter a lottery and, if selected, they have the ability to secure a unit with a 10 or 20% down payment based on income. Successful applicants pay only for the construction costs of their unit and the government provides the land. Throughout the country, approximately 245,000 units have been constructed. In Addis Ababa, approximately 175,000 units in multistory condominiums have been completed in over 100 sites throughout the city [
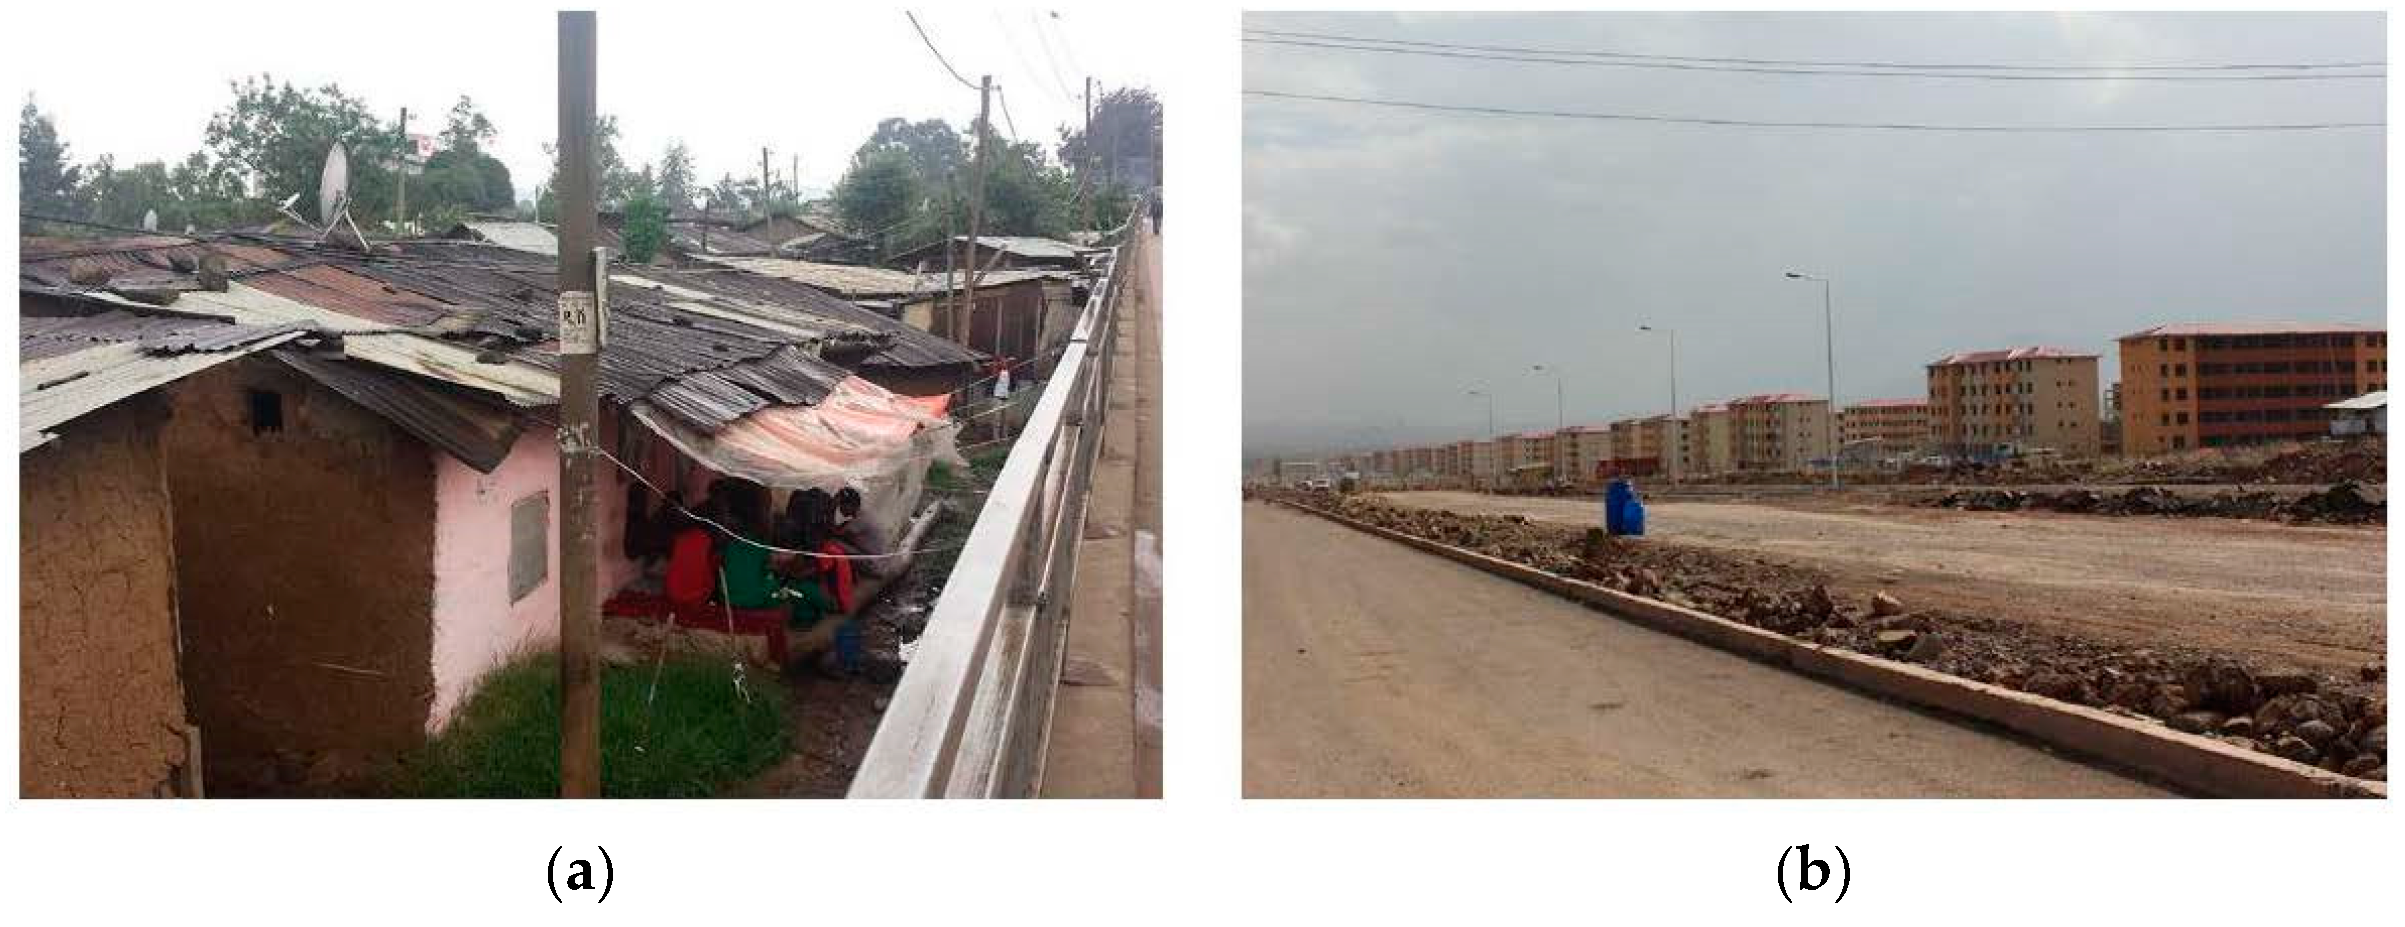
13]. An additional 132,000 housing units are currently under construction (
Figure 3). The program has produced 370,000 jobs, thus surpassing its original employment goal of 200,000 [
13].
As a result of this ‘pro-poverty’ housing program, daily life for many residents has changed [
13]. One of the positive changes has been the opportunity for hundreds of thousands of residents to own their own home. Unlike many social welfare programs, this effort addresses short-term housing needs for low and middle-income families while building long-term equity. Another positive change has been the use of ‘modern’ private kitchens. This has meant shifting from cooking with wood or charcoal toward electricity. This has reduced human scavenging in forested areas and improved indoor air quality.
Some changes from the public housing program have been negative. Many of the new multistory condominium developments are located far from the central business district and lack nearby employment centers. In a survey of 323 households living in the new condominium housing, 57% reported that they could not generate income in their new settlement area. Eighty-two percent of respondents identified the loss of social networks as a result of relocation [
8]. These outlying locations of the condominiums impose significant transportation costs and add lengthy commuting times to many residents’ daily schedules. Additionally, rising construction costs over the program’s duration have meant some of the city’s poorest residents can no longer afford units. Keller and Mukudi-Omwami [
13] noted that approximately 70% of the units are rented out by the owners who remain living elsewhere. While some use their condominium as a source of income, others must rent their units to make the mortgage payments and avoid foreclosure [
8].
These public housing programs have not been the only source of new housing in Addis Ababa and the number of private residential developments has increased from 2006 to 2016. However, private contractors and real estate companies must lease land from the government. In residential areas, private investors bid for 99 year leases often costing $2260 USD per meter2. As a result of the high land costs, housing developed by the private-sector largely serves the wealthiest residents and Ethiopian diaspora.
The landscape of Addis Ababa, Ethiopia, is rapidly changing do to population and economic growth as well as significant public housing investment. While research on the social and economic impacts of the housing program is beginning to emerge [
8], less is known about the city’s spatial urban transition. Therefore, our research is an effort to address this gap, provide baseline data for future land use comparisons, and to answer the following questions:
How has the spatial distribution of land uses changed between 2006 and 2016?
How has the spatial distribution and types of residential housing changed between 2006 and 2016?
Has the city’s density, measured citywide and at the sub-city level, increased or decreased between 2006 and 2016?
2. Materials and Methods
This research is based on the analysis of two ortho-rectified, high resolution aerial photographs of Addis Ababa, Ethiopia, from 2006 and 2016. We hand-digitized all areas of the city that measured 1 hectare or greater in size using Geographical Information Systems (GISs). The authors who hand-digitized the maps lived in Addis Ababa and were able to visit areas of confusion during this extensive process. We mapped 13 primary land cover types and 44 detailed categories. These categories included (1) agriculture (field crops and vegetables), (2) vegetation (plantation, mixed forest, riverine, grassland, and scrubland), (3) transportation (major roads, airports, rail, light rail, bus terminal, and light rail terminals), (4) manufacturing and storage (manufacturing, storage and distribution centers, garages, and mixed manufacturing and storage), (5) administration (offices, palaces, and embassies), (6) community services (education, medical, religion, and cultural centers), (7) recreation and conservation (parks, stadiums and festival sites, and botanical gardens), (8) retail and business (formal shopping, open markets, hotel, and mixed businesses), (9) utilities and infrastructure (energy production and distribution, refuse disposal and landfill, water storage and treatment, cemeteries, fire and emergency stations, and slaughterhouse), (10) special uses (police and defense), (11) minerals and gravel pits, (12) bare land, (13) residential (condominium housing 4 or more floors, informal mud/wood housing, formal single family housing, and formal low-rise/mixed use).
Calculating overall density and residential density by sub-city required population data. For the 2006 conditions, we used population data from the 2007 Ethiopian Census. However, no formal census has been conducted since that date. Therefore, we used sub-city population projections for 2017 that were prepared by the Ethiopian Statistical Agency in 2013 [
17].
To ensure the accuracy of our hand-digitizing, in summer 2016, we traveled to over 200 points randomly selected along the city’s north-south and east-west axes. At each point, we collected the latitude and longitude coordinates and took photographs of the existing conditions in each of the four directions. These points were then compared with the 2016 digitized land use map to ensure accuracy. Inaccuracies were corrected based on our field observations. An earlier publication compared the 2006 and 2011 land uses and provides a lengthier description of our methods [
18].
3. Results
3.1. Urban Expansion
In 2006, the ‘built’ portion of Addis Ababa was 24,942 ha or 48% of the area within the city’s municipal boundary (we included transitional bare land and mineral and gravel pits as ‘built’ areas but excluded areas of agriculture and vegetation). By 2016, the ‘built’ portion of the city had expanded by 10,108 ha to 35,050 ha (67% of the area within the city’s boundaries). The annual rate of expansion during this decade was 1.9%. Based on the 2007 census and 2017 population projections, the population increased by an estimated 714,000 people. Between 2006 and 2016, every additional person increased the urban area by 0.014 ha.
3.2. Land Use Changes
In the four central sub-cities of Addis Ketema, Arada, Kirkos, and Lideta, the largest changes were gains in retail and business (353 ha), manufacturing and storage (147 ha), and bare land (20 ha) and losses in residential (405 ha) and community services (36 ha). In general, these changes are expected as retail and business operations push out residential housing and community services (
Table 1).
In the six surrounding sub-cities, agricultural areas (8362 ha) and vegetation (1753 ha) were converted to residential housing (3520 ha), manufacturing and storage (1784 ha), mineral and gravel pits (1575 ha) and retail and business (154 ha). The significant increase in mineral extraction reflects the demands of road and housing construction. However, many of these extraction sites are degrading nearby waterways. While vegetation decreased, a botanical garden was established near the city’s northern boundary and this increased the area of recreation and conservation land by 773 ha.
3.3. Residential Housing Types and Locations
In 2006, 17,008 ha (33%) of the city’s land area was categorized as residential. In 2016, this increased to 20,122 ha (39%). In 2006, 51% and 31% of the land in the central and surrounding sub-cities were occupied by housing, respectively (
Table 2). By 2016, housing in the central sub-cities had decreased to 43% and housing in the surrounding sub-cities had increased to 38%. In the central sub-cities, the greatest decreases were in informal housing (from 1990 ha to 1540 ha) and low-rise/mixed use development (602 ha to 294 ha). In the surrounding sub-cities, the area of new condominiums increased notably from 186 ha to 2155 ha and the area of informal housing decreased from 7647 ha to 6181 ha. The southern sub-city of Akaki Kality has the greatest increase in new condominium housing.
The dramatic increase in single family housing was an unexpected finding. In the surrounding sub-cities, the area of single family housing increased from 757 ha to 4652 ha in one decade with the majority of these structures built in the western sub-cities of Kolfe Keranio and Nifa Silk Lafto.
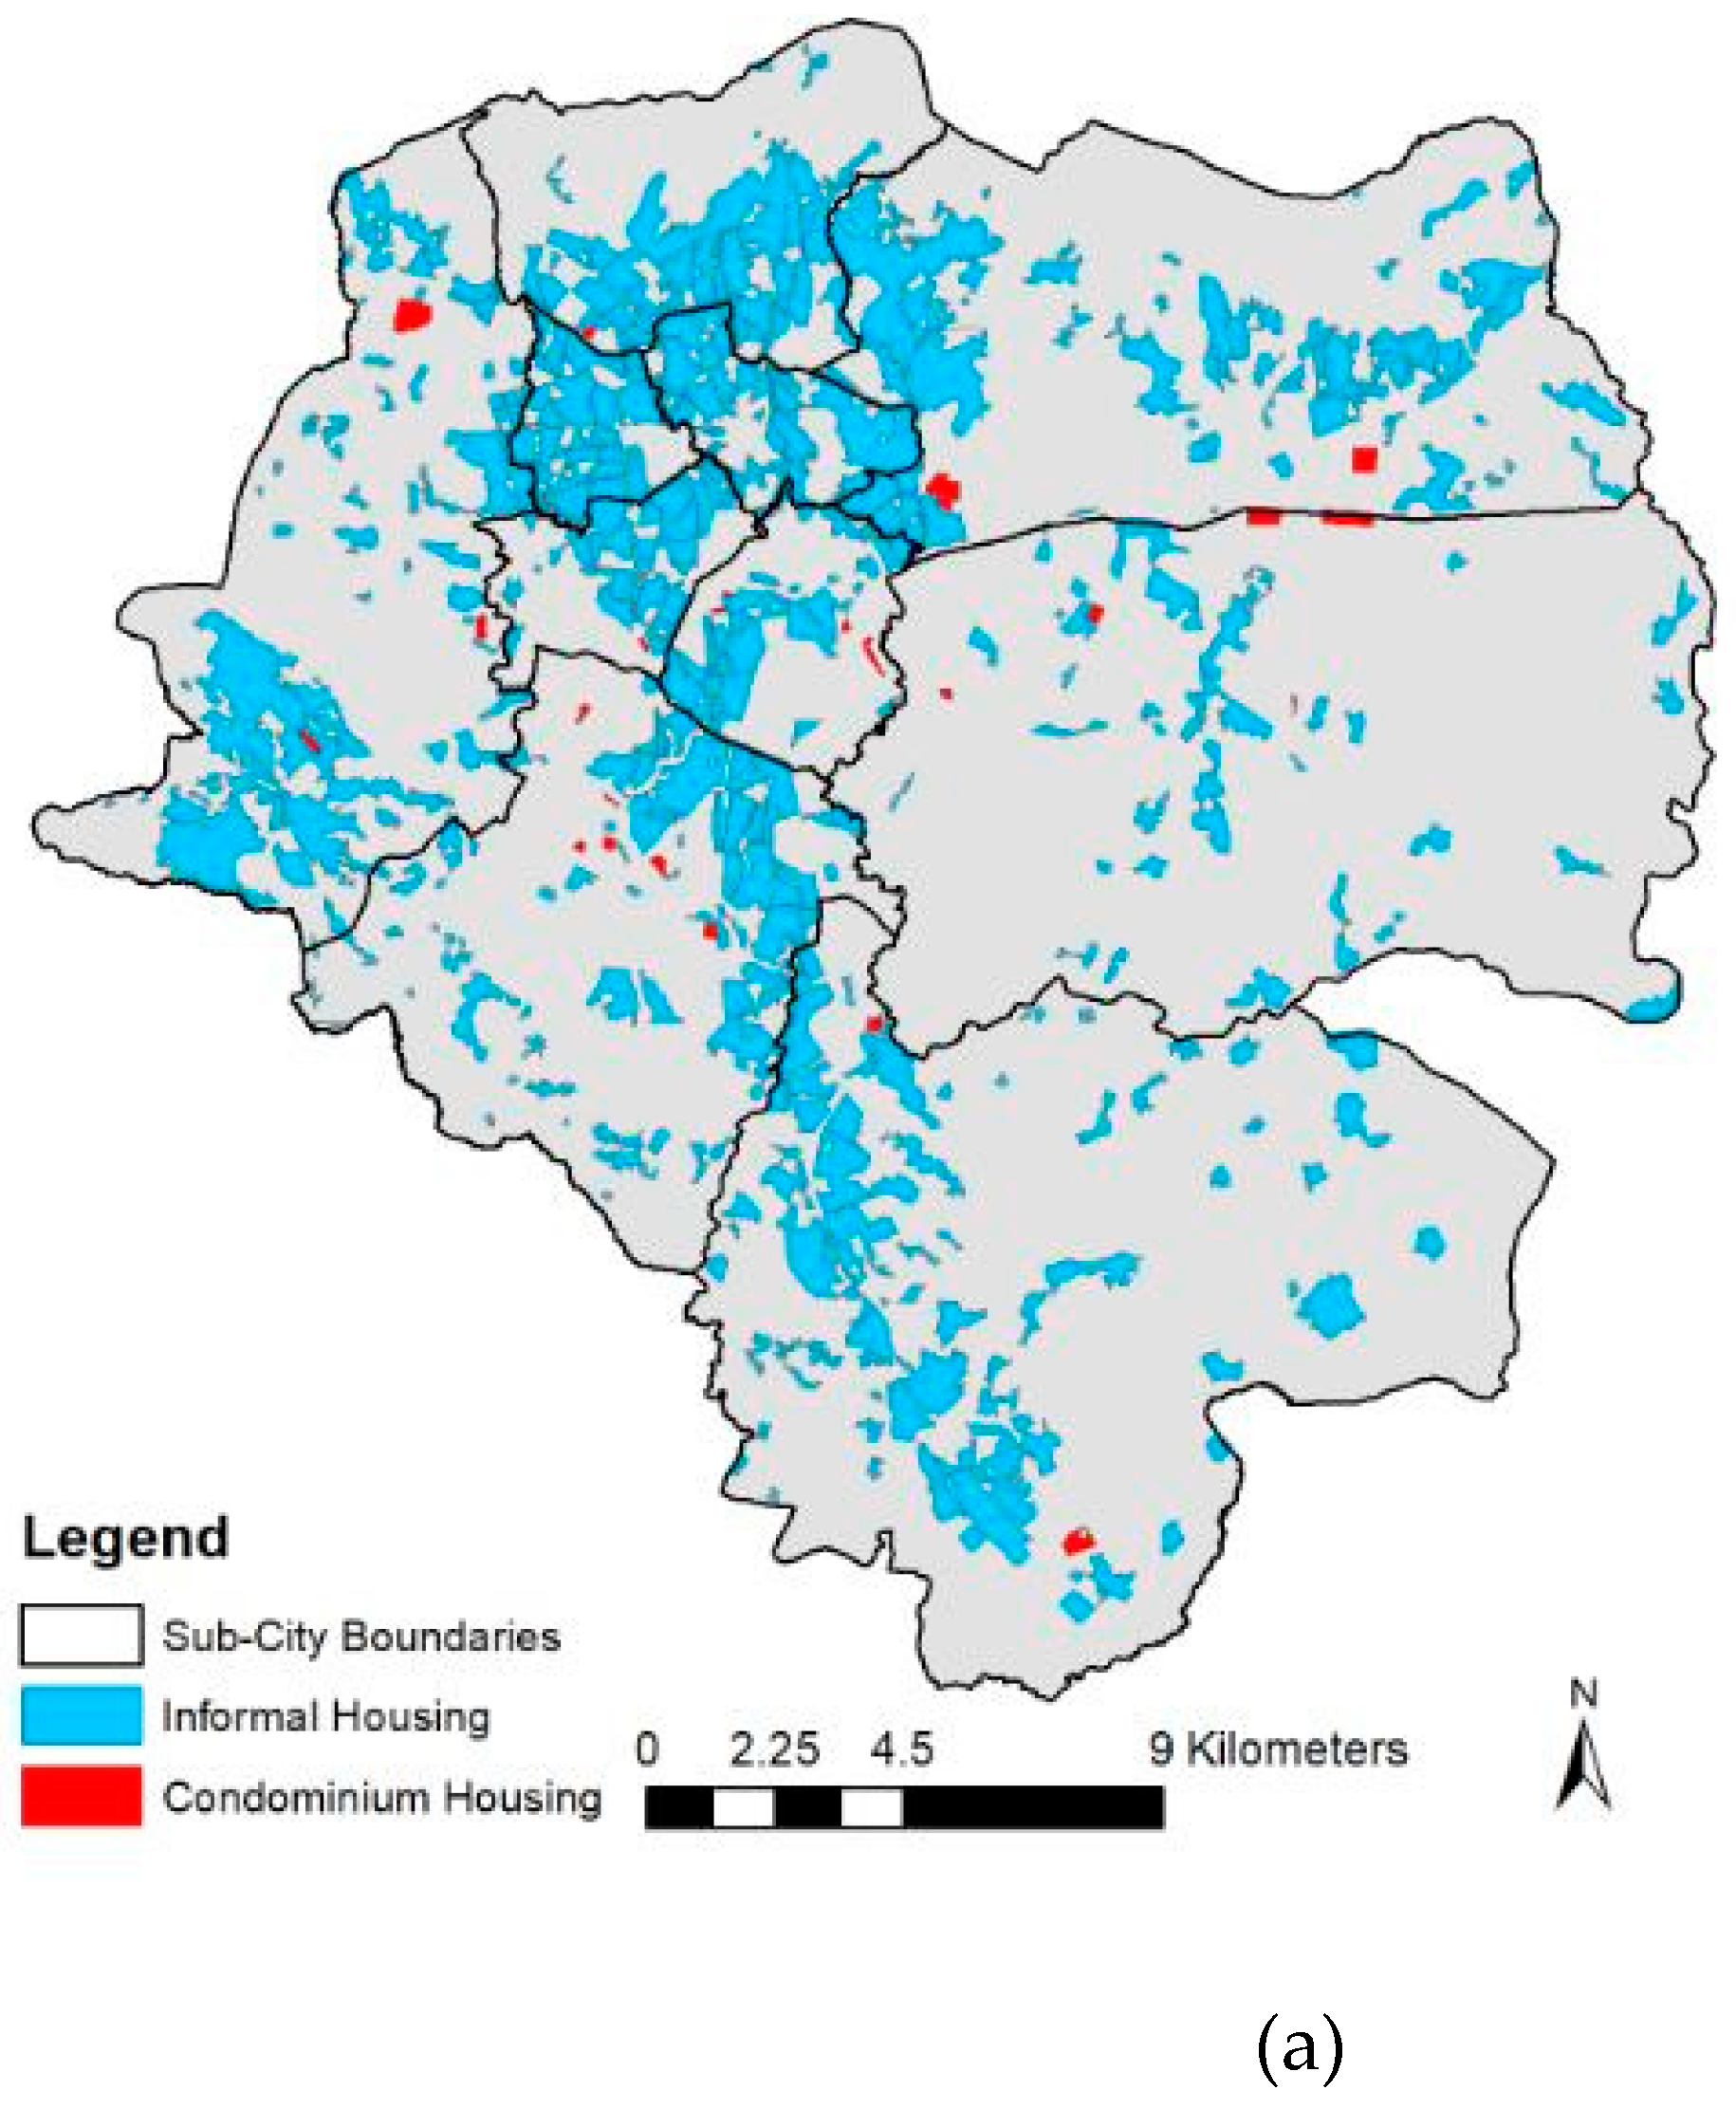
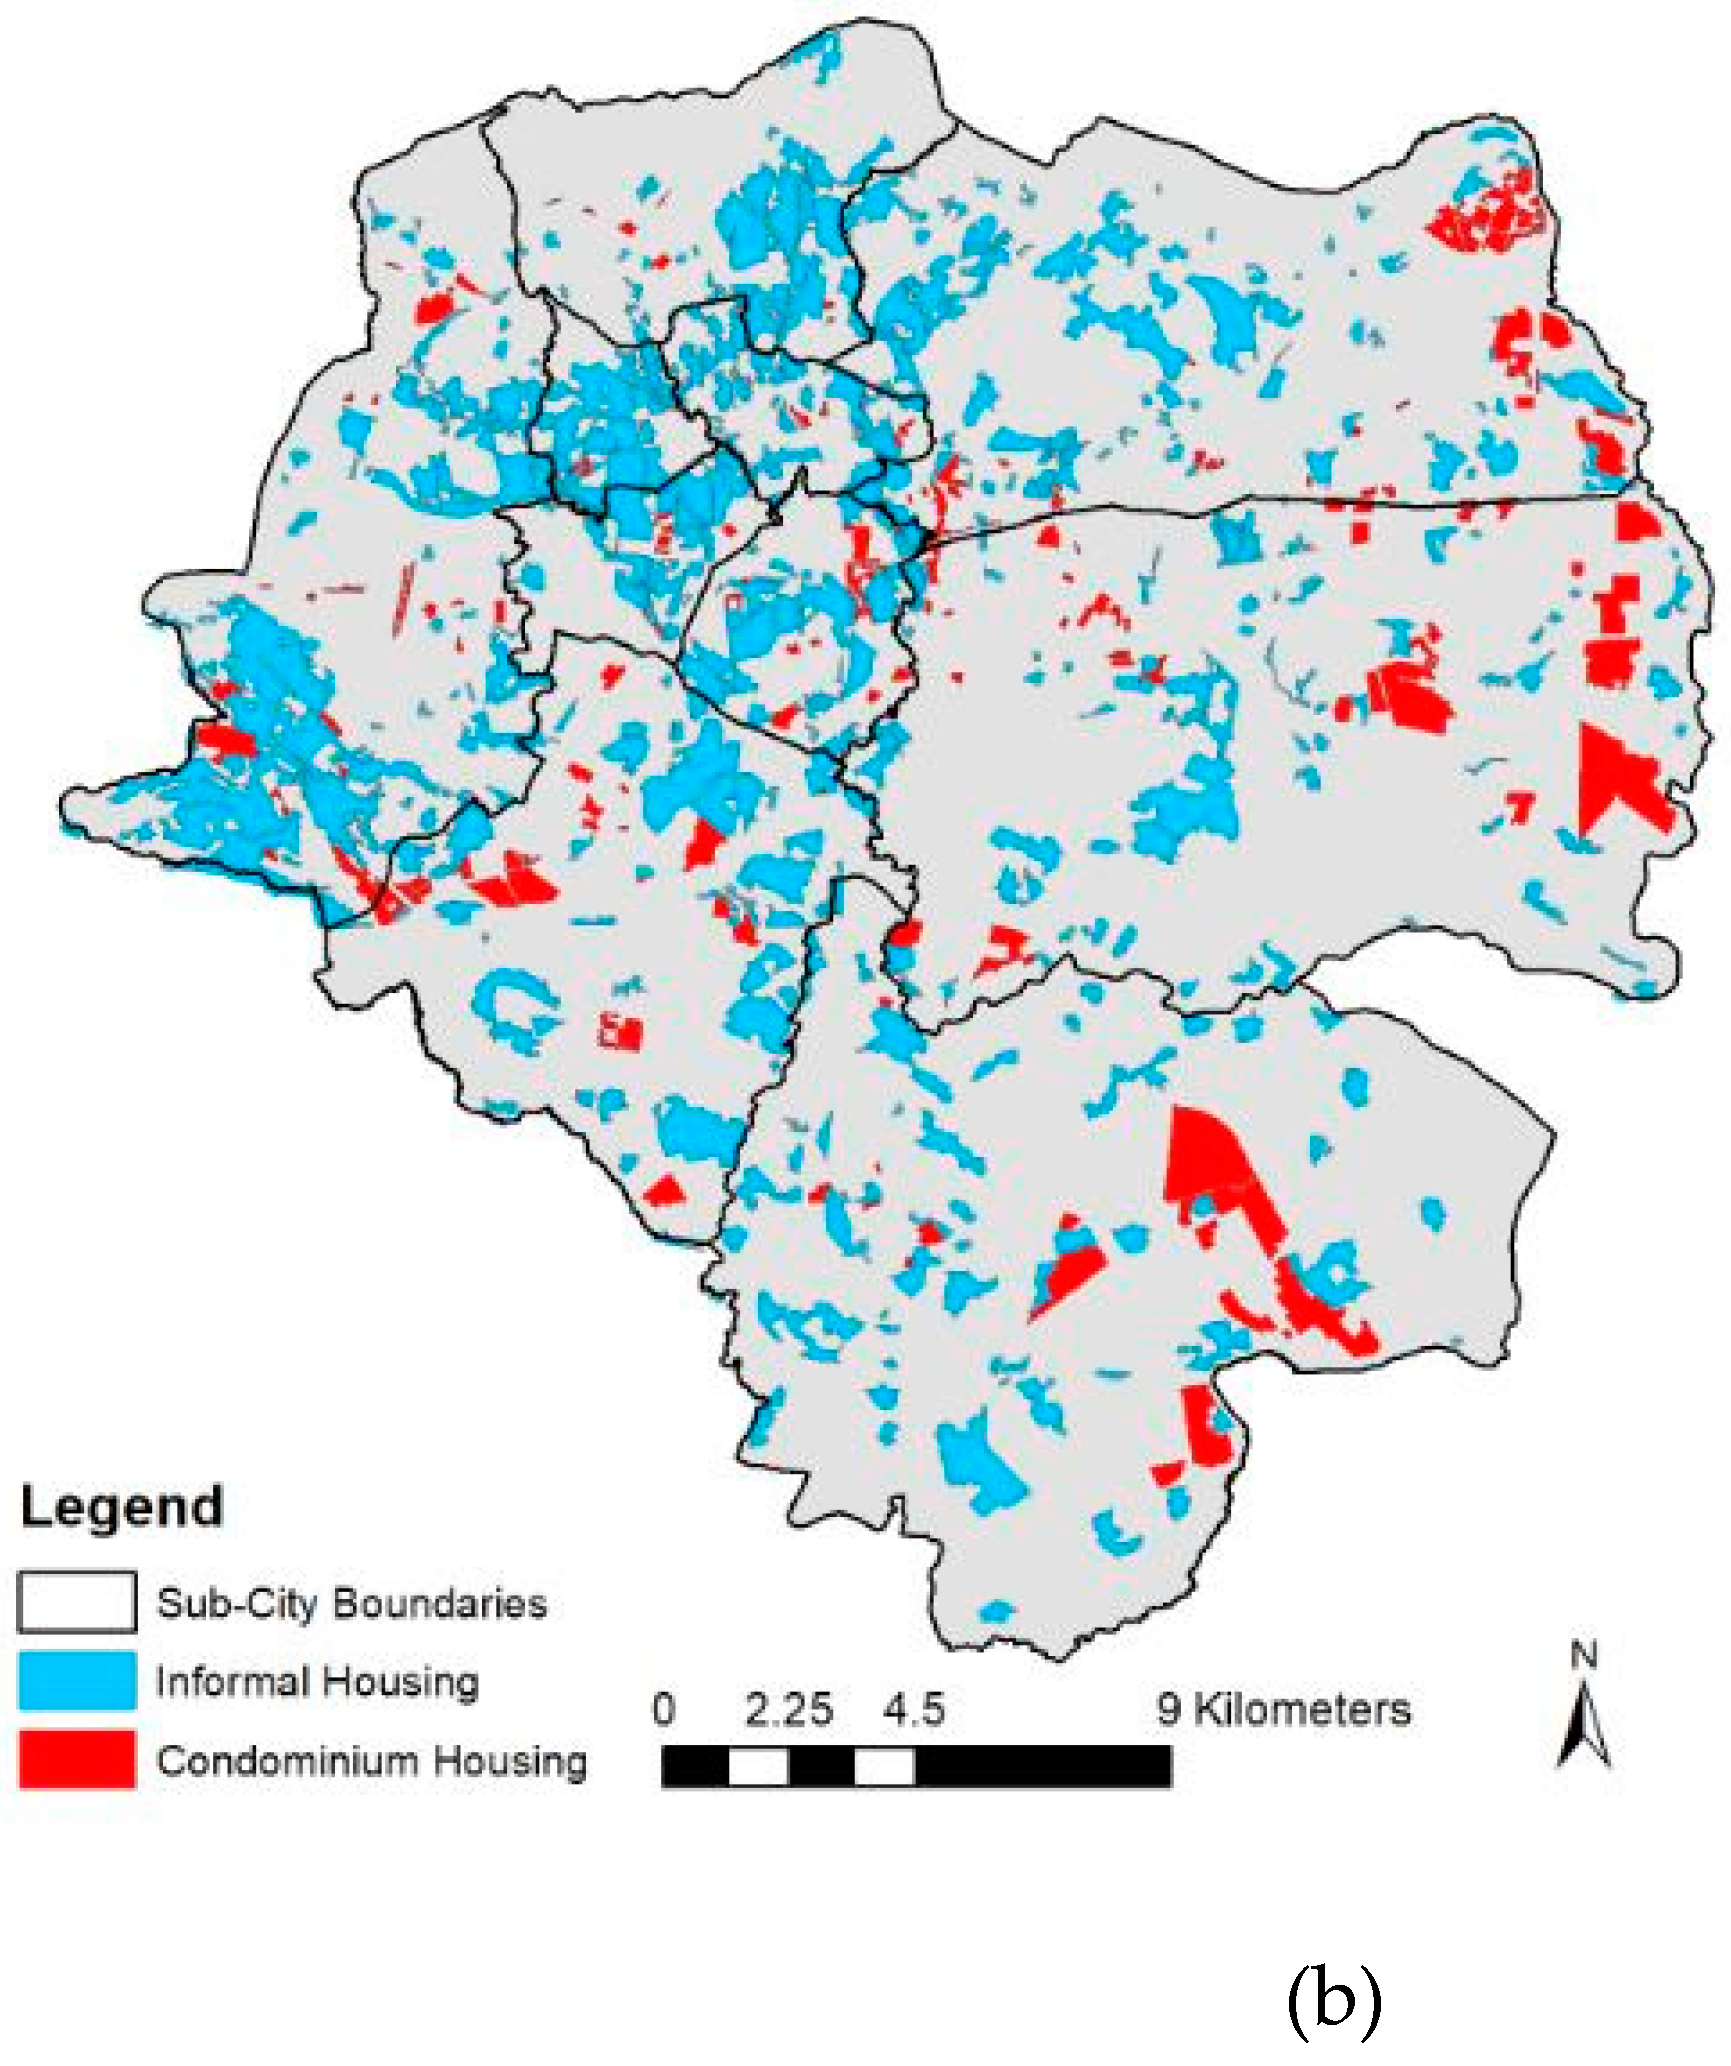
Figure 4a,b illustrate the changes in the presence of informal housing and condominium housing city-wide. In 2006, informal housing was clustered in the central city and south along the Little Akaki River. However, by 2016, the area of informal housing (blue) decreased and it was dispersed throughout the city. In 2006, there was very little condominium housing (red). By 2016, the area of condominium housing has increased to occupy 11% of the city with the largest concentrations toward the city’s south (Akaki Kality) and eastern boundaries (Yeka and Bole).
3.4. Change in the Residential Housing Types in 2006 (a) and 2016 (b)
The mixture of housing types has changed significantly between 2006 and 2016. Of the total area of housing in 2006, informal housing comprised 57%, low-rise/mixed development (<4 floors) comprised 37%, single family homes comprised 5% and condominium housing (4 floors or greater) comprised only 1%. Of the total area of housing in 2016, informal housing declined to 38%, low-rise/mixed development (<4 floors) declined to 26%, single family homes increased to 25%, and condominium housing (4 floors or greater) increased to 11%.
3.5. Changes in Overall and Residential Density
In 2006, the overall density (built area/people) of Addis Ababa, Ethiopia, equaled 109 people per hectare. In 2016, the overall density of Addis Ababa, Ethiopia, equaled 98 people per hectare. Therefore, the overall density of the city decreased between 2006 and 2016.
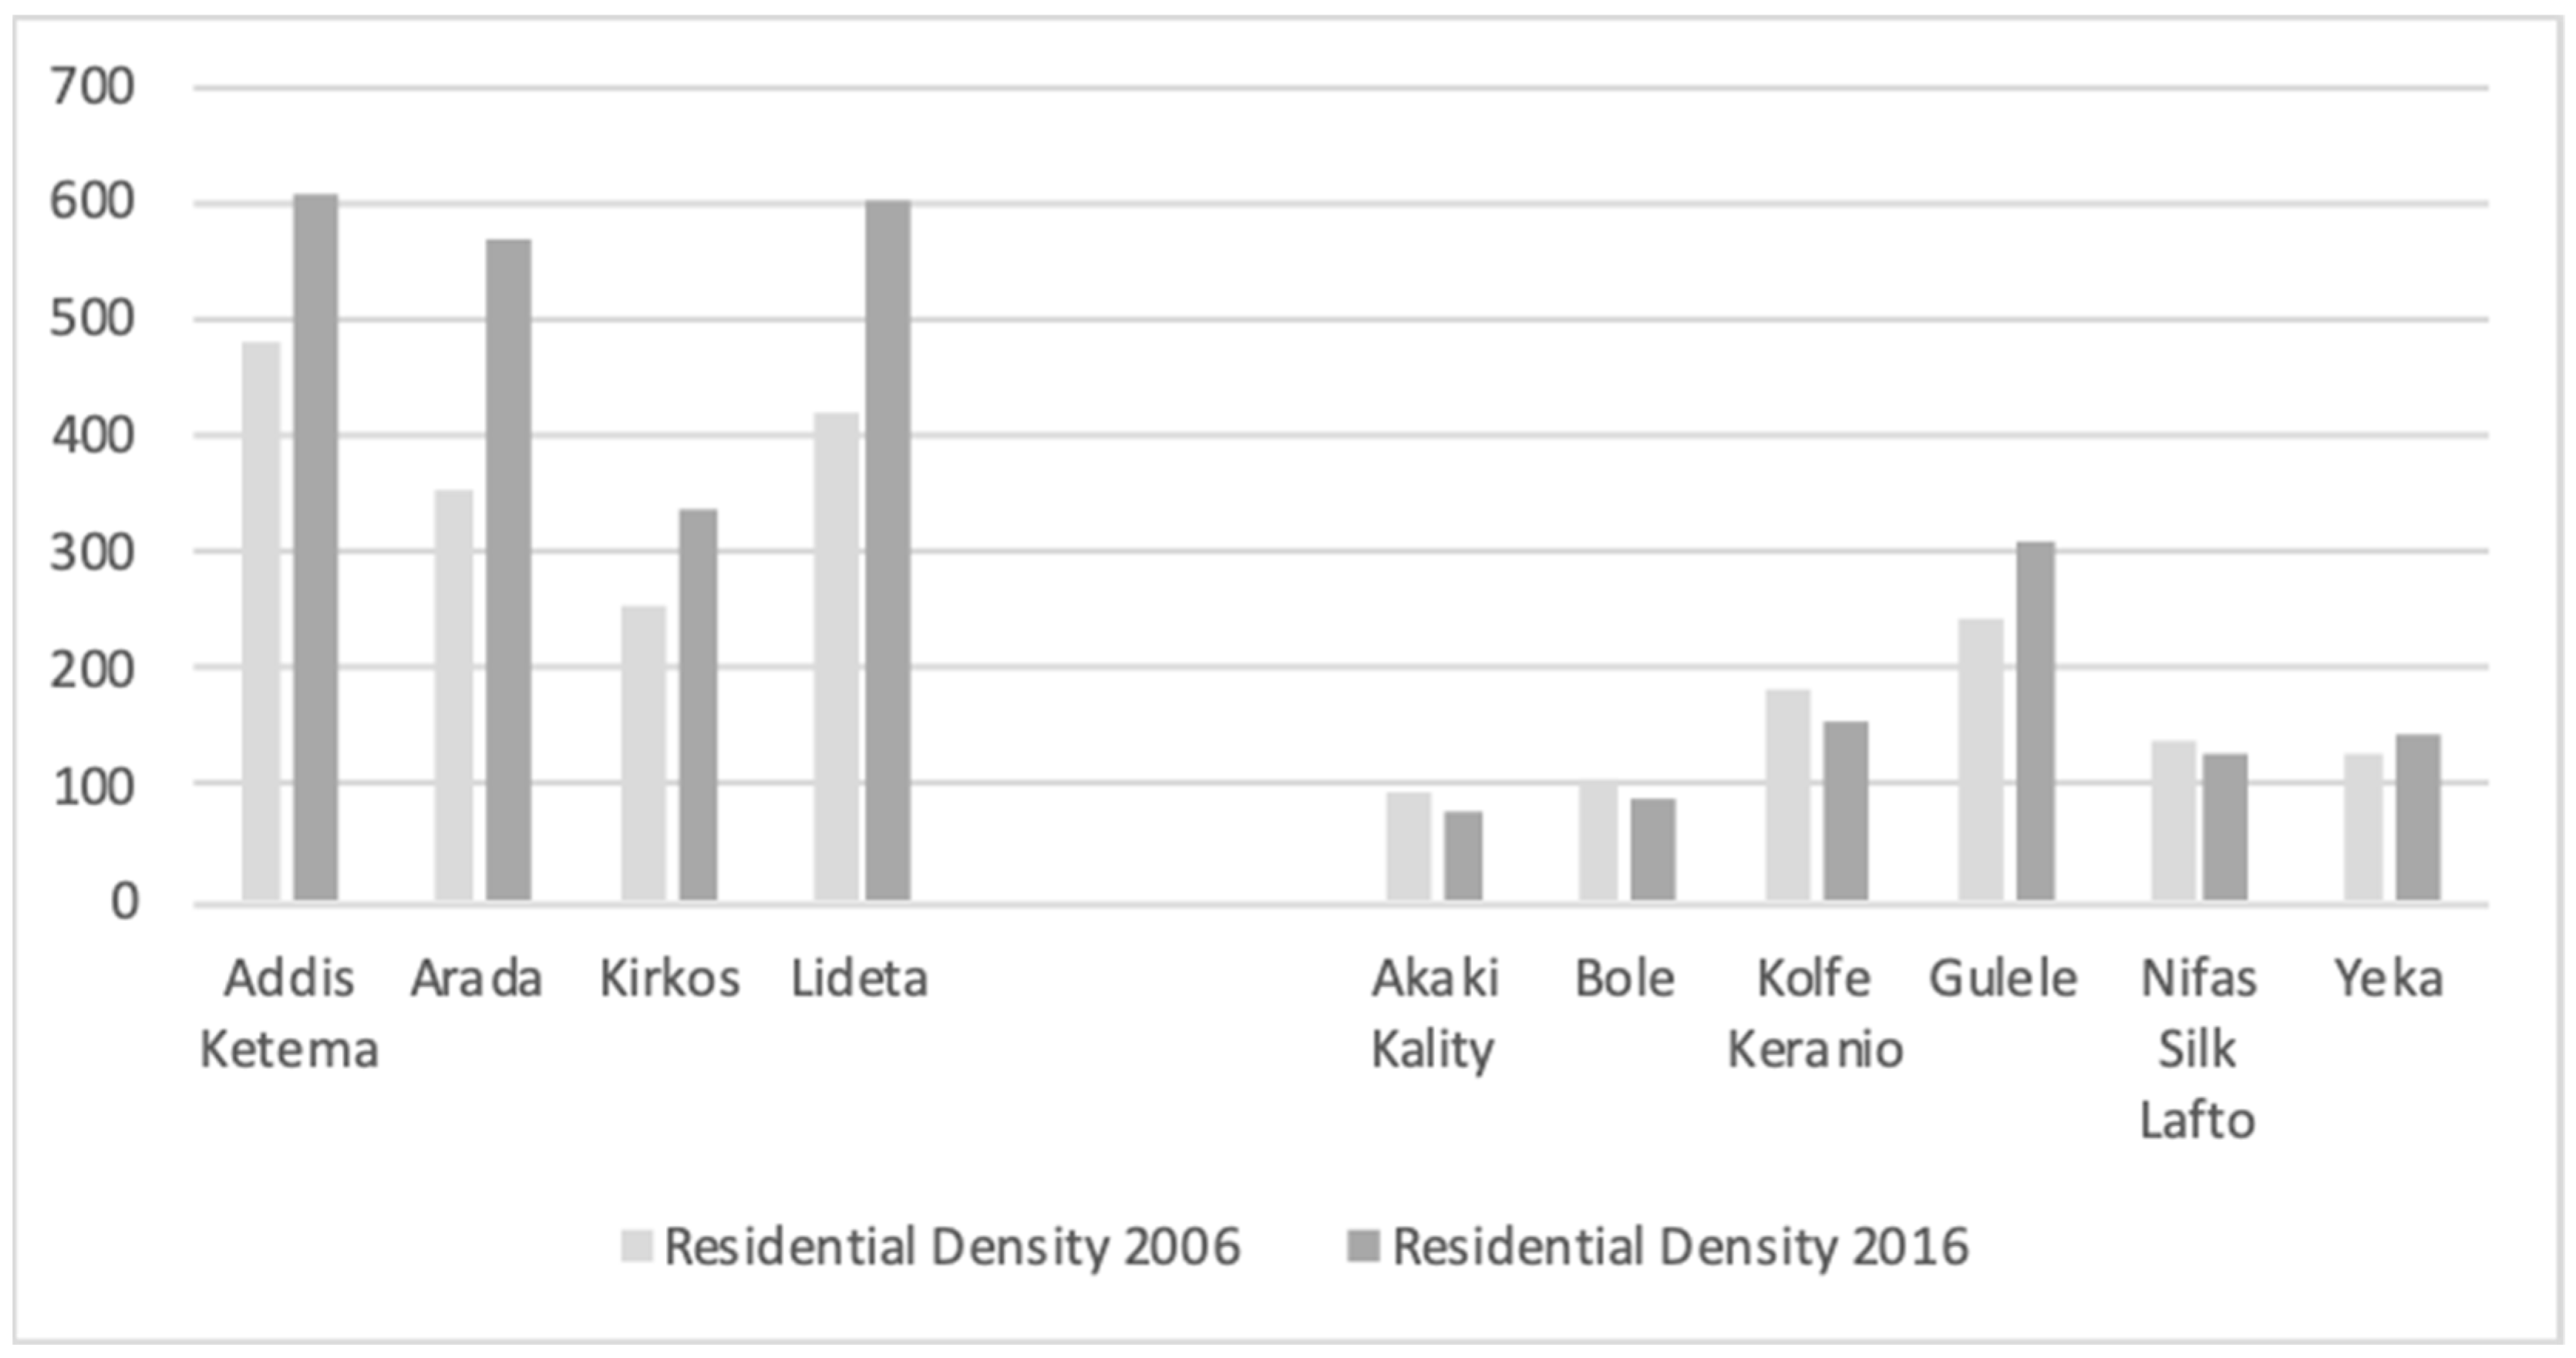
However, the residential density values communicate different findings. In 2006, the residential density of Addis Ababa, Ethiopia, equaled 170 people per hectare. In 2016, the residential density of Addis Ababa, Ethiopia, equaled 201 people per hectare. Therefore, this more accurate evaluation of density indicates that density of the city increased between 2006 and 2016. However, it is interesting to note how residential density varies throughout the sub-cities and has increased in the central sub-cities.
Figure 5 illustrates that residential density has significantly increased within the central sub-cities while slightly increasing in surrounding sub-cities of Gulele and Yeka and decreasing in the other four surrounding sub-cities.
4. Discussion
The lack of affordable housing is a problem in cities throughout the world. In many Sub-Saharan, cities urban poverty, rapid population growth, and inappropriate (or inadequate) institutional arrangements complicate the challenge [
6]. Therefore, programs designed to expand affordable housing for low and middle-income residents and constructed in Sub-Saharan cities provide useful social, economic, and spatial insights. Addis Ababa, Ethiopia’s public housing program is notable in its scale and public (versus private) approach. Public land tenure and strong planning efforts are important reasons for the program’s impact. The country’s recent economic growth complicates the attribution of simple cause and effect relationships between the new public housing and the city’s evolving urban form. It is also important to state that while we believe the public housing program has had a net positive impact, we are not naïve to the social and economic costs that have left/leave some residents worse off. The true impacts of the public housing development program on the residents will not be known for some time.
Based on our research we conclude that between 2006 and 2016, per capita land consumption in Addis Ababa, Ethiopia, did not increase. This finding contradicts the general pattern of increase in cities in less developed countries [
3]. For every new resident, the city only increased by 140 m
2. Between 2006 and 2016, the built area of Addis Ababa increased from 24,942 ha to 35,050 ha. This represents rapid urban expansion of approximately 2% per year.
The city’s overall density (built area/person) decreased between 2006 and 2016 from 109 people/ha to 98 people/ha. This finding aligns with trends in other Sub-Saharan cities [
3]. Addis Ababa’s overall density of 98 people/ha is lower than the 121. 5 people/ha average for the 16 Sub-Saharan African cities included in the UN-Habitat study of urban expansion. However, comparing overall density with Addis Ababa’s residential density communicates a different story. In 2006, there were 170 people/ha of residential area and this increased in 2016 to 201 people/ha. Therefore, residential housing is not the cause of the city’s declining overall density.
One limitation of our approach was the measurement of land uses by area. This allowed us to quantify the spatial land use changes but not to measure the change in housing units. Informal housing has decreased from 58% to 38% of the total residential area. The majority of the city’s housing supply has shifted from informal to formal between 2006 and 2016. In 2006, informal housing was largely clustered in the central sub-cities and along the Little Akaki River. Urban renewal efforts in the central sub-cites have removed much of this informal housing and by 2016, the remaining informal housing in Addis Ababa was widely dispersed throughout the city. One unexpected land use change is the increase in manufacturing and storage in the central city (147 ha). The increasing presence of manufacturing and storage within the central business district will challenge the city’s efforts to enhance its tourist appeal and improve environmental quality [
10].
In reviewing the overall land use changes across the city, we note that there was a very small increase in the area dedicated to transportation infrastructure. Prosperity for some residents has meant a significant increase in car ownership but the increase in road infrastructure and public transportation alternatives has not been commensurate with the city’s growth. Traffic congestion has increasingly become a major obstacle for commuting in the city. People now travel longer between their home and work place because most of the residential units are located at the peripheral edges of the surrounding sub-cities and business remains concentrated in the central sub-cities. It is important to note that during this decade, the second light-rail system in a Sub-Saharan city was opened in Addis Ababa. However, in our experience, demand regularly exceeds capacity of the light-rail cars during the week days.
Another city-wide land use statistic of note is the relative lack of recreation and conservation areas. The city’s recent focus on economic and residential development has neglected important amenities. Increased efforts are now needed to rebalance open space opportunities for residents and increase natural areas that provide important ecosystem services, such as flood control. The new botanical garden is now open to the public and it has become an extremely popular place for residents. The recently established River and Riverside Development Office of the City Administration has proposed a pilot riverine zone rehabilitation project along the Kebena River [
15]. The City’s new master plan sets an ambitious goal of providing 5 m
2 of open space per person by 2028.
Interestingly, the percent of residential land occupied by single family housing has significantly increased from 5% to 25% in the ten-year period and is largely clustered on the city’s western side. This dramatic increase reflects the rise in economic prosperity for many residents and is not related to the government’s housing efforts.
Despite public and private housing development, there continues to be a massive shortage of housing in Addis Ababa. Housing construction and property management are currently seen as the safest and most reliable businesses in the city. This has created many employment opportunities. For some households, renting all (and therefore doubling up with family) or a portion of their private home is their sole source of income.
While the new high-rise condominiums constructed by the public housing development program only occupied 11% of the city’s 2016 residential land, they house a large proportion of the city’s residents and many developments are still under construction. The majority of these public housing developments are located on the city’s eastern and southern edges, far from the city center. The City’s new master plan acknowledges the need to establish a poly-nuclear urban form that strengthens nodes of commercial and retail development within residential areas independent from the city center [
14]. Although the city has undertaken a laudable effort in the development of public housing, the long-term viability of these areas is dependent on building the necessary transportation, water, and electricity infrastructure, creating or directing the establishment of employment opportunities, and expanding community services and amenities. The State of Addis Ababa 2017 [
8], a publication jointly authored by the City Administration and UN-Habitat personnel, states that the housing program is at a turning point and it must expand beyond its one-size-fits-all approach. They call for increasing rental options, encouraging house upgrading and housing cooperatives, and expanding affordable housing finance opportunities.
Parnell [
19] notes that the Sustainability Development Goal for cities (goal 11) and Africa’s own 2060 vision statement both ‘embrace a bigger role for local government on the continent’ and acknowledges that, ‘government is back in fashion.’ Parnell identifies Ethiopia, Angola, Rwanda, and South Africa as countries leading this shift and Addis Ababa’s public housing development program is an example of a public program reshaping that city’s urban form.


