Article

Towards a Tool for Early Detection and Estimation of Forest Cuttings by Remotely Sensed Data

1
Research Center for Forestry and Wood, Consiglio per la Ricerca in Agricoltura e L’Analisi dell’Economia Agraria (CREA), Viale Santa Margherita 80, 52100 Arezzo, Italy
2
Research Center for Engineering and Agro-Food Processing, Consiglio per la Ricerca in Agricoltura e l’Analisi dell’Economia agraria (CREA), Via della Pascolare, 00015 Monterotondo (RM), Italy
*
Author to whom correspondence should be addressed.
Submission received: 12 March 2019 / Revised: 1 April 2019 / Accepted: 2 April 2019 / Published: 3 April 2019

Abstract

:
Knowing the extent and frequency of forest cuttings over large areas is crucial for forest inventories and monitoring. Remote sensing has amply proved its ability to detect land cover changes, particularly in forested areas. Among various strategies, those focusing on mapping using classification approaches of remotely sensed time series are the most frequently used. The main limit of such approaches stems from the difficulty in perfectly and unambiguously classifying each pixel, especially over wide areas. The same procedure is of course simpler if performed over a single pixel. An automated method for identifying forest cuttings over a predefined network of sampling points (IUTI) using multitemporal Sentinel 2 imagery is described. The method employs normalized difference vegetation index (NDVI) growth trajectories to identify the presence of disturbances caused by forest cuttings using a large set of points (i.e., 1580 “forest” points). We applied the method using a total of 51 S2 images extracted from the Google Earth Engine over two years (2016 and 2017) in an area of about 70 km2 in Tuscany, central Italy.

1. Introduction

Updated and reliable information on factors that affect forest ecosystem dynamics is required to support forest management strategies and is particularly important in landscapes subject to considerable human impact.
Since the launch of Landsat 1 in 1972, the first satellite specifically designed to study and monitor Planet Earth, spaceborne images have become ever more suitable for environmental monitoring. Wide coverage, rapid updating, and spatiotemporal synchronization are some of the most important features of remotely sensed images [1]. In addition, the policy on providing free access to high-resolution satellite data archives (mainly Landsat and Copernicus) coupled with computational capabilities of platforms, such as Google Earth Engine (GEE) [2], open up new frontiers in change detection approaches [3,4].
Evaluation of significant abrupt land cover changes (e.g., forest cuttings) with remote sensing data is usually performed using bitemporal mapping approaches, i.e., by comparing, pixel by pixel, the classification results obtained from two coregistered images taken at different times. Examples of traditional algorithms used to solve this issue are maximum likelihood, support vector machine classification, classification and regression trees, and random forests [5]. The main operational drawback with such approaches is that when two standalone image classification processes are carried out, errors from both are summed, resulting in cumulative errors that reduce the change detection accuracy [6]. Such errors are unacceptable, especially if the products serve as reference in decision-making over wide areas.
In addition to remote sensing, information on land use, land use change, and forestry (LULUCF) can also be obtained using statistical approaches [7]. In Italy, a land use inventory based on a point sampling statistic design was established in 1990 (IUTI: Italian Land Use Inventory [8]). This database consists of more than 1,200,000 points covering the entire national territory. IUTI represents a key instrument for the National Registry of forest carbon sinks but its update, based on visual interpretation of very high-resolution images, is both time-consuming and costly.
Therefore, quantifying the area of different land cover classes and/or of their changes by remote sensing-derived information or by inventories can be viewed as the same objective addressed by different methodologies. However, the integration of both approaches may enhance support for land monitoring programs [9,10], especially for specific natural (e.g., fires) or artificial (e.g., cuttings) forest disturbances.
In this paper we present a method for the automatic detection of cuttings in forest areas. To do so, we analyzed and compared the temporal variation with the normalized difference vegetation index (NDVI) time series (two years: 2016 and 2017) obtained from Sentinel-2 data. The Google Earth Engine (GEE) platform was used to facilitate analysis in such a wide spatial context.

2. Materials and Methods

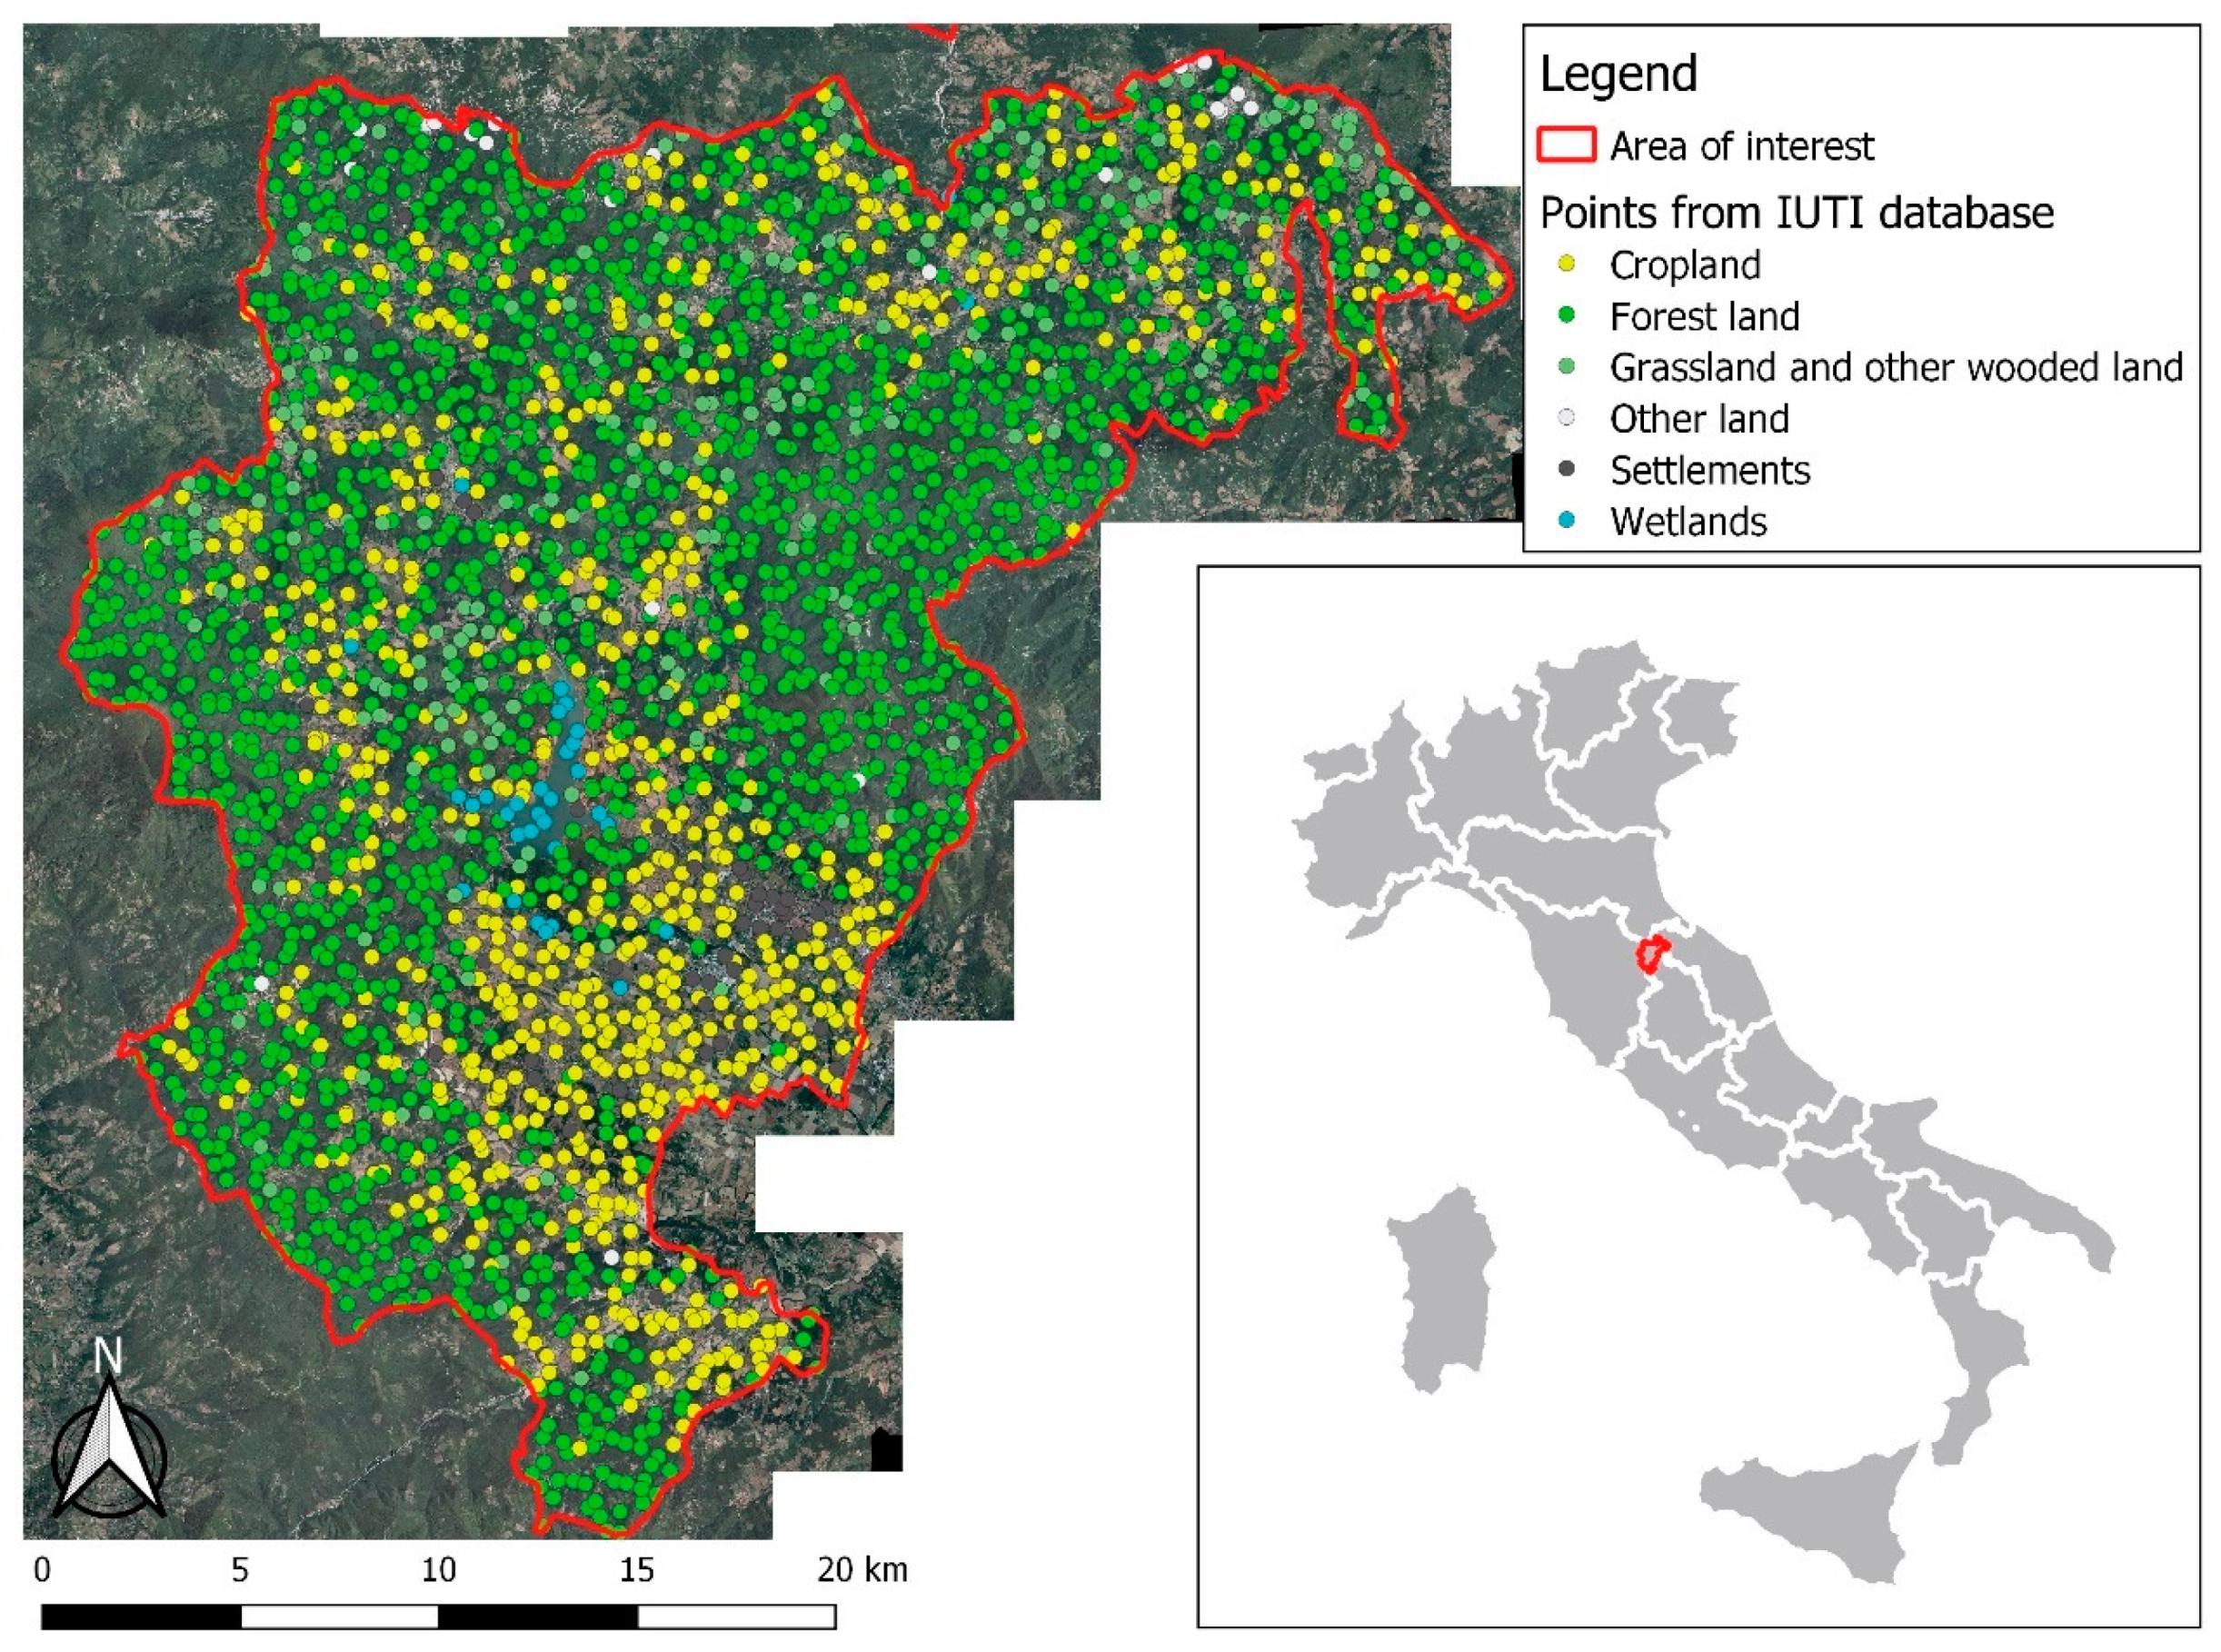
2.1. Study Area and Inventory Data

Seven municipalities in the Upper Tiber Valley, a public authority managing an area of 67 km2 with a high proportion of forested areas (more than 60%) located in eastern Tuscany (Central Italy), represent the area of interest (AOI) (Figure 1).
Land cover classes of 2693 points extracted from the IUTI dataset were updated by visual interpretation of digital orthophotos at 20-cm spatial resolution covering the entire AOI and collected during the summer (from mid-July to the end of August) of 2015, 2016, and 2017. FAO FRA 2000 [11] defines “forest” as land with a tree canopy cover of more than 10 percent and areas of more than 0.5 ha nd, determined both by the presence of trees and the absence of other predominant land uses. Adopting this definition, a total of 1580 points were assigned to “forest” land use, for validation purposes (i.e., to confirm whether or not the forest was actually cut) visited in situ during the winter (from October 2016 to February 2017) and used as reference in the next steps of the analysis. The forest types found in the study area, according to the European classification [12], are Apennine-Corsican montane beech forests (Fagus sylvatica L.), Thermophilous deciduous forests dominated by chestnut (Castanea Sativa Mill.), and Turkey oak, Hungarian oak, and Sessile oak forest (i.e., Quercus cerris L., Quercus frainetto Ten., and Quercus petraea (Mattuschka) Liebl.).

2.2. Remote Sensing Data

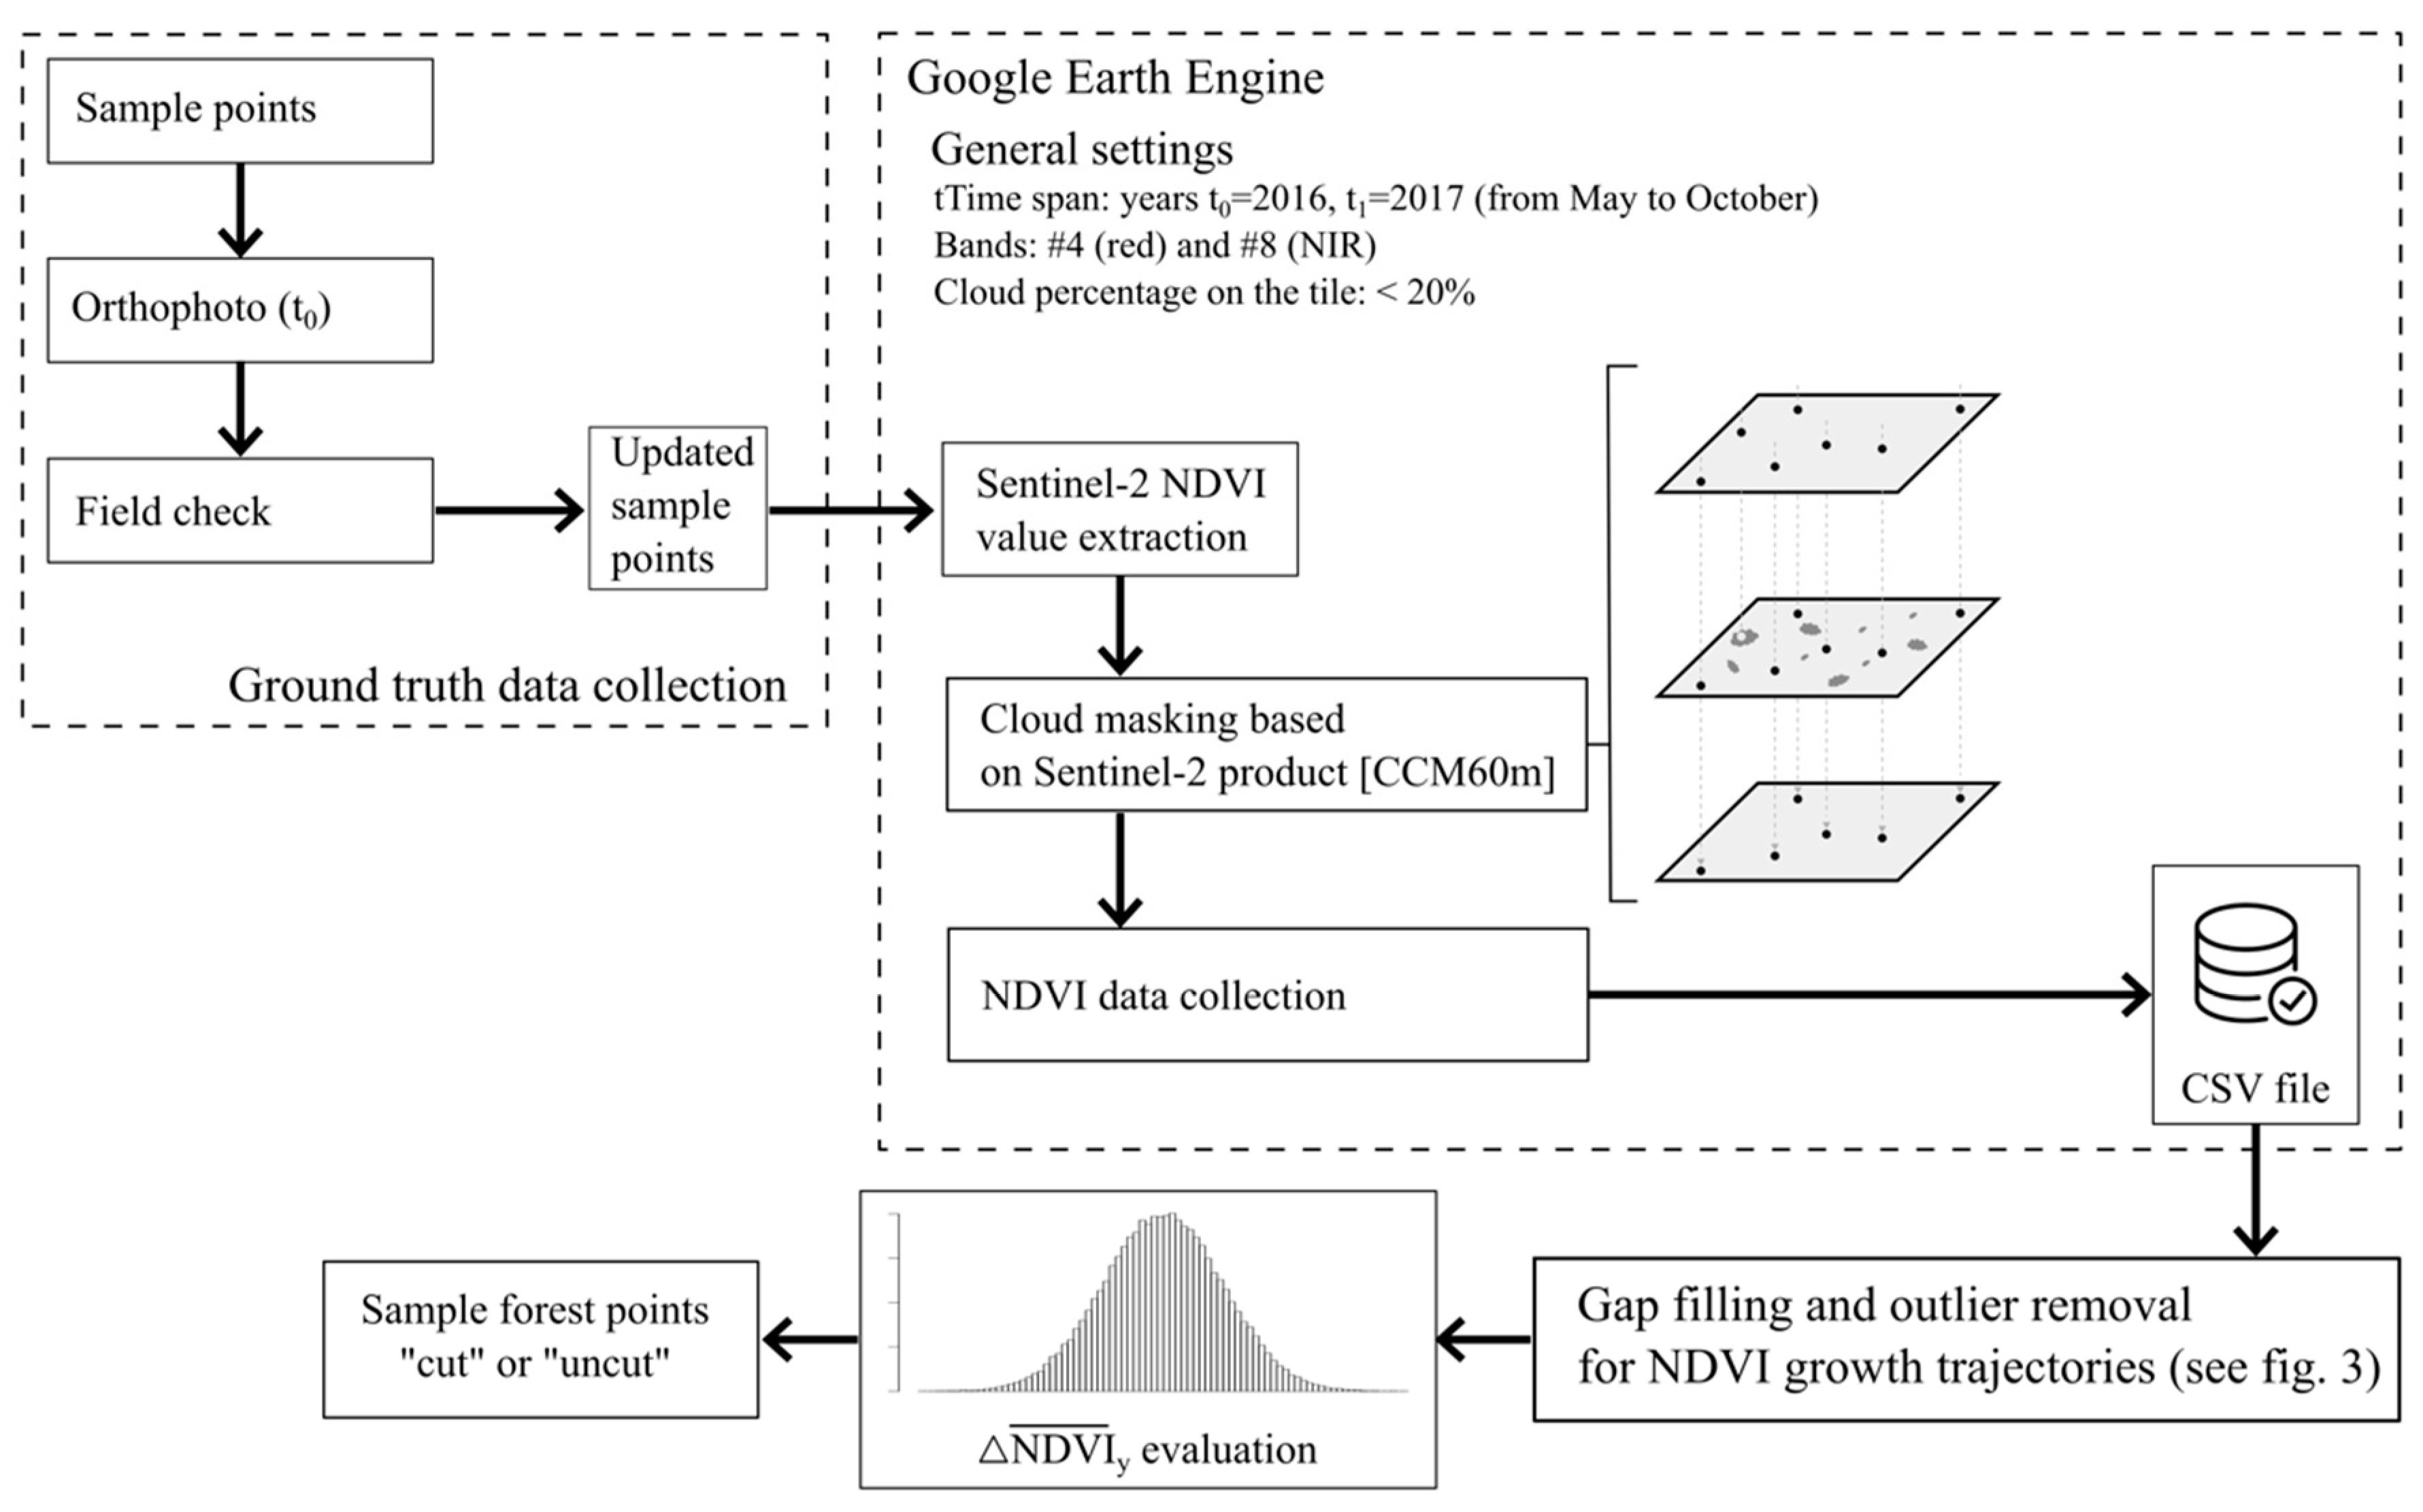
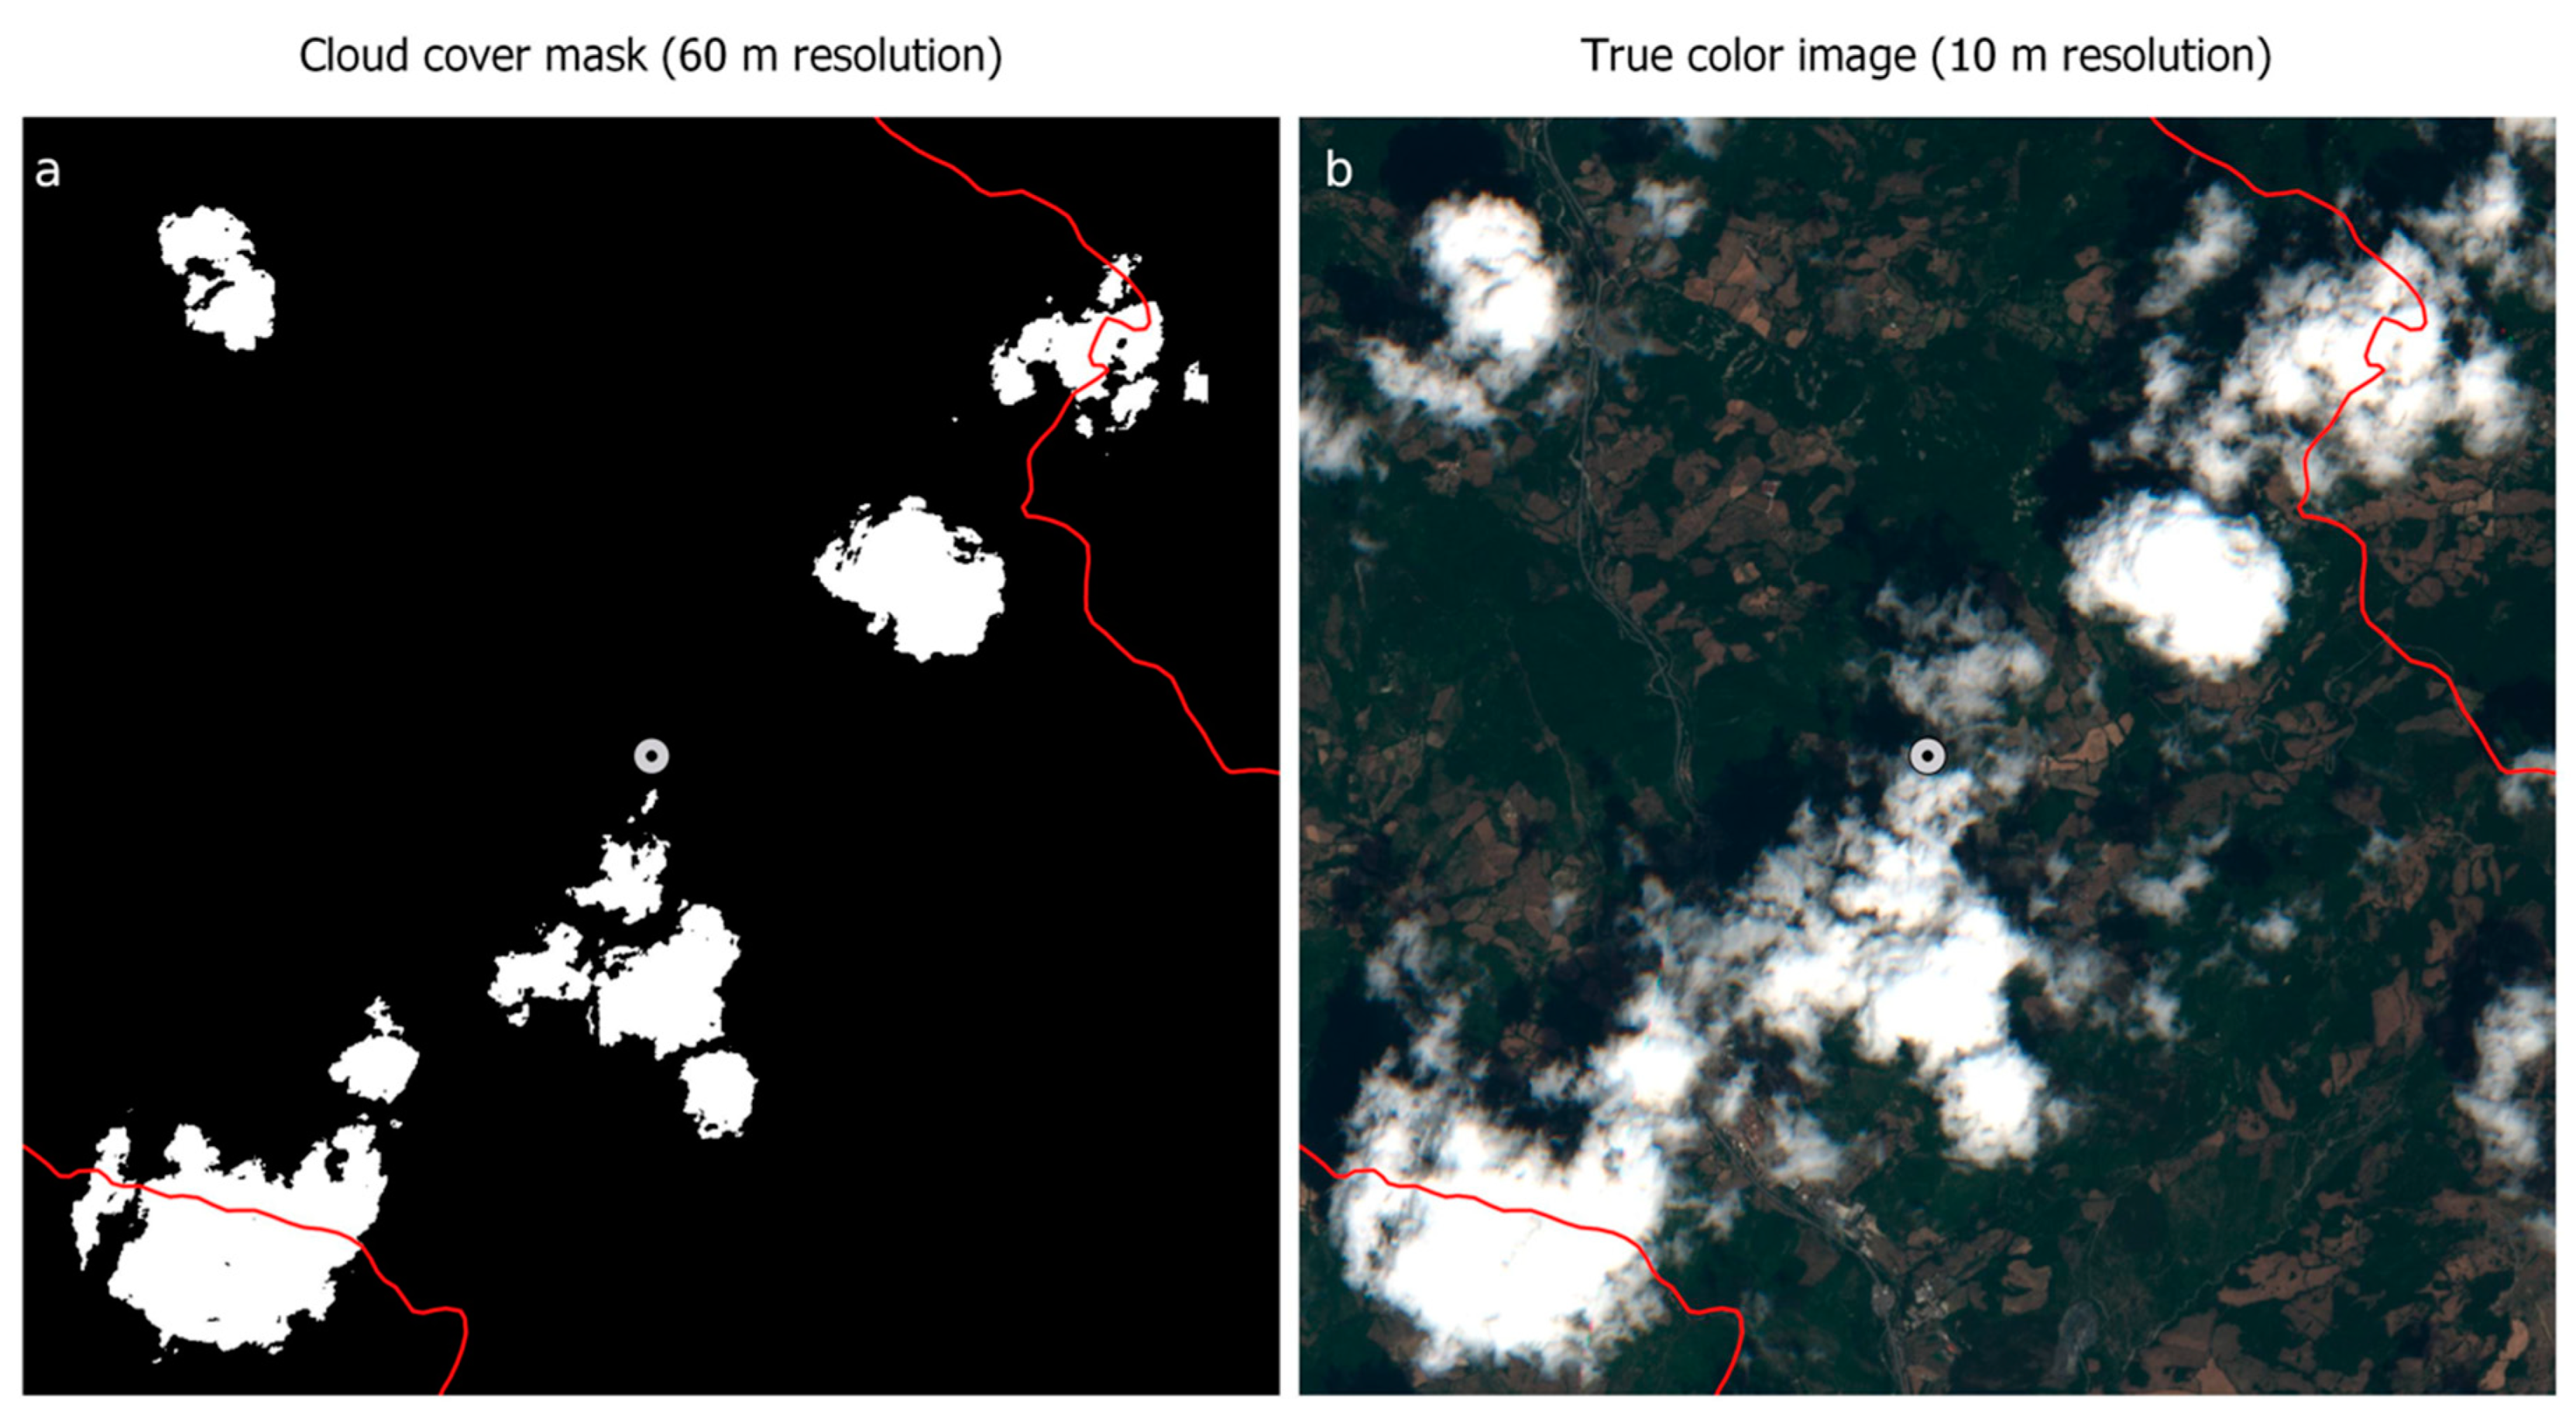
Data Collection and Pre-Processing

The Copernicus Sentinel-2 (S2) program started in June 2015 with the launch of the first satellite (Sentinel-2A) and achieved in 2017 its targeted average revisit time of five days with the second (Sentinel-2B). The S2 program was specifically conceived for vegetation sensing purposes and offers innovative features for environmental remote sensing by combining high spatial resolution, wide coverage and a quick revisit time. S2 satellites carry a multispectral sensor with 13 bands, from 0.443 to 2.190 μm. The visible R, G, B, and the near infrared bands are available at a 10-m spatial resolution, highly suitable for application in vegetation canopies. Four red-edge bands at 20-m spatial resolution are also available and are particularly suited to chlorophyll content analysis and to parameterizing ecophysiological large scale models.
The high spatial and time resolutions of the S2 satellite offer unprecedented opportunities for fine discrimination of land cover classes and their changes [13,14], and despite their relatively small number of acquisition bands, multispectral sensors like MSI mounted on the S2 platform have proved to be adequate to discriminate broad land cover classes (e.g., forests, water, crops, and urban areas [15]).
The normalized difference vegetation index (NDVI) derived from the satellite’s sensors is frequently used to characterize the annual greenness changes in forest land areas and to describe forest vegetation phenology, e.g., in Maselli et al. [16] and Bascietto et al. [17]). In this experiment, NDVI-S2 measures derived from the red (band 4) and near-infrared (NIR, band 8) level 1C reflectance bands were used to detect changes in forest areas affected by forest cuttings in the following equation.
NDVI = NIR red NIR + red
NDVI values acquired during the vegetative seasons (from May to October) for the years 2016 and 2017 were collected using the Google Earth Engine (GEE) platform, an integrated cloud computing platform for remote sensing and geographic information processing [2]. It integrates massive satellite- and ground-based observations and provides basic calculation functions for raster data and vector data. The GEE development environment allows access to a data catalogue (a large repository of publicly available geospatial datasets, including Sentinel-2) that can be accessed for analysis using a library of operators provided by the Earth Engine API [2].
For this experiment, a specific GEE code was developed that considers only S2 tiles with cloud cover lower than 20% of tile area. As output, the code produces a downloadable comma separated value (CSV) file, where the rows are the sampled points and the columns the NDVI values at a specific date.
In addition to reflectance data, the S2 Level 1 C product also includes a cloud cover mask layer with 60-m spatial resolution (CCM-60m). During the NDVI extraction process in GEE, points falling on the CCM-60m layer were masked and set as Not Available (Figure 2). As a result, some values were missing and gaps in the NDVI growth trajectory were produced (Figure 3A). The next steps of the analysis (gap-filling and pixel classification based on NDVI growth trajectories) were performed in R software [18].
The gap in the NDVI growth trajectory was filled by a linear interpolation between the available values around the gap itself (Figure 3B). Due to the coarser spatial resolution of CCM-60m than the obtained NDVI map (10-m), some cloudy points may still go undetected, and their NDVI values exported from GEE as “noncloudy” points (Figure 4). To overcome this issue, we calculated and set the annual-NDVI-median as threshold (Figure 3C): each NDVI value which, year by year, is below the threshold was considered an outlier, removed from the yearly-NDVI growth trajectory, and recalculated following the same procedure described above (linear interpolation, Figure 3D). As a final step, the obtained trajectories were refined using a local regression (Figure 3E) and NDVI values were estimated at regular intervals (3 days).

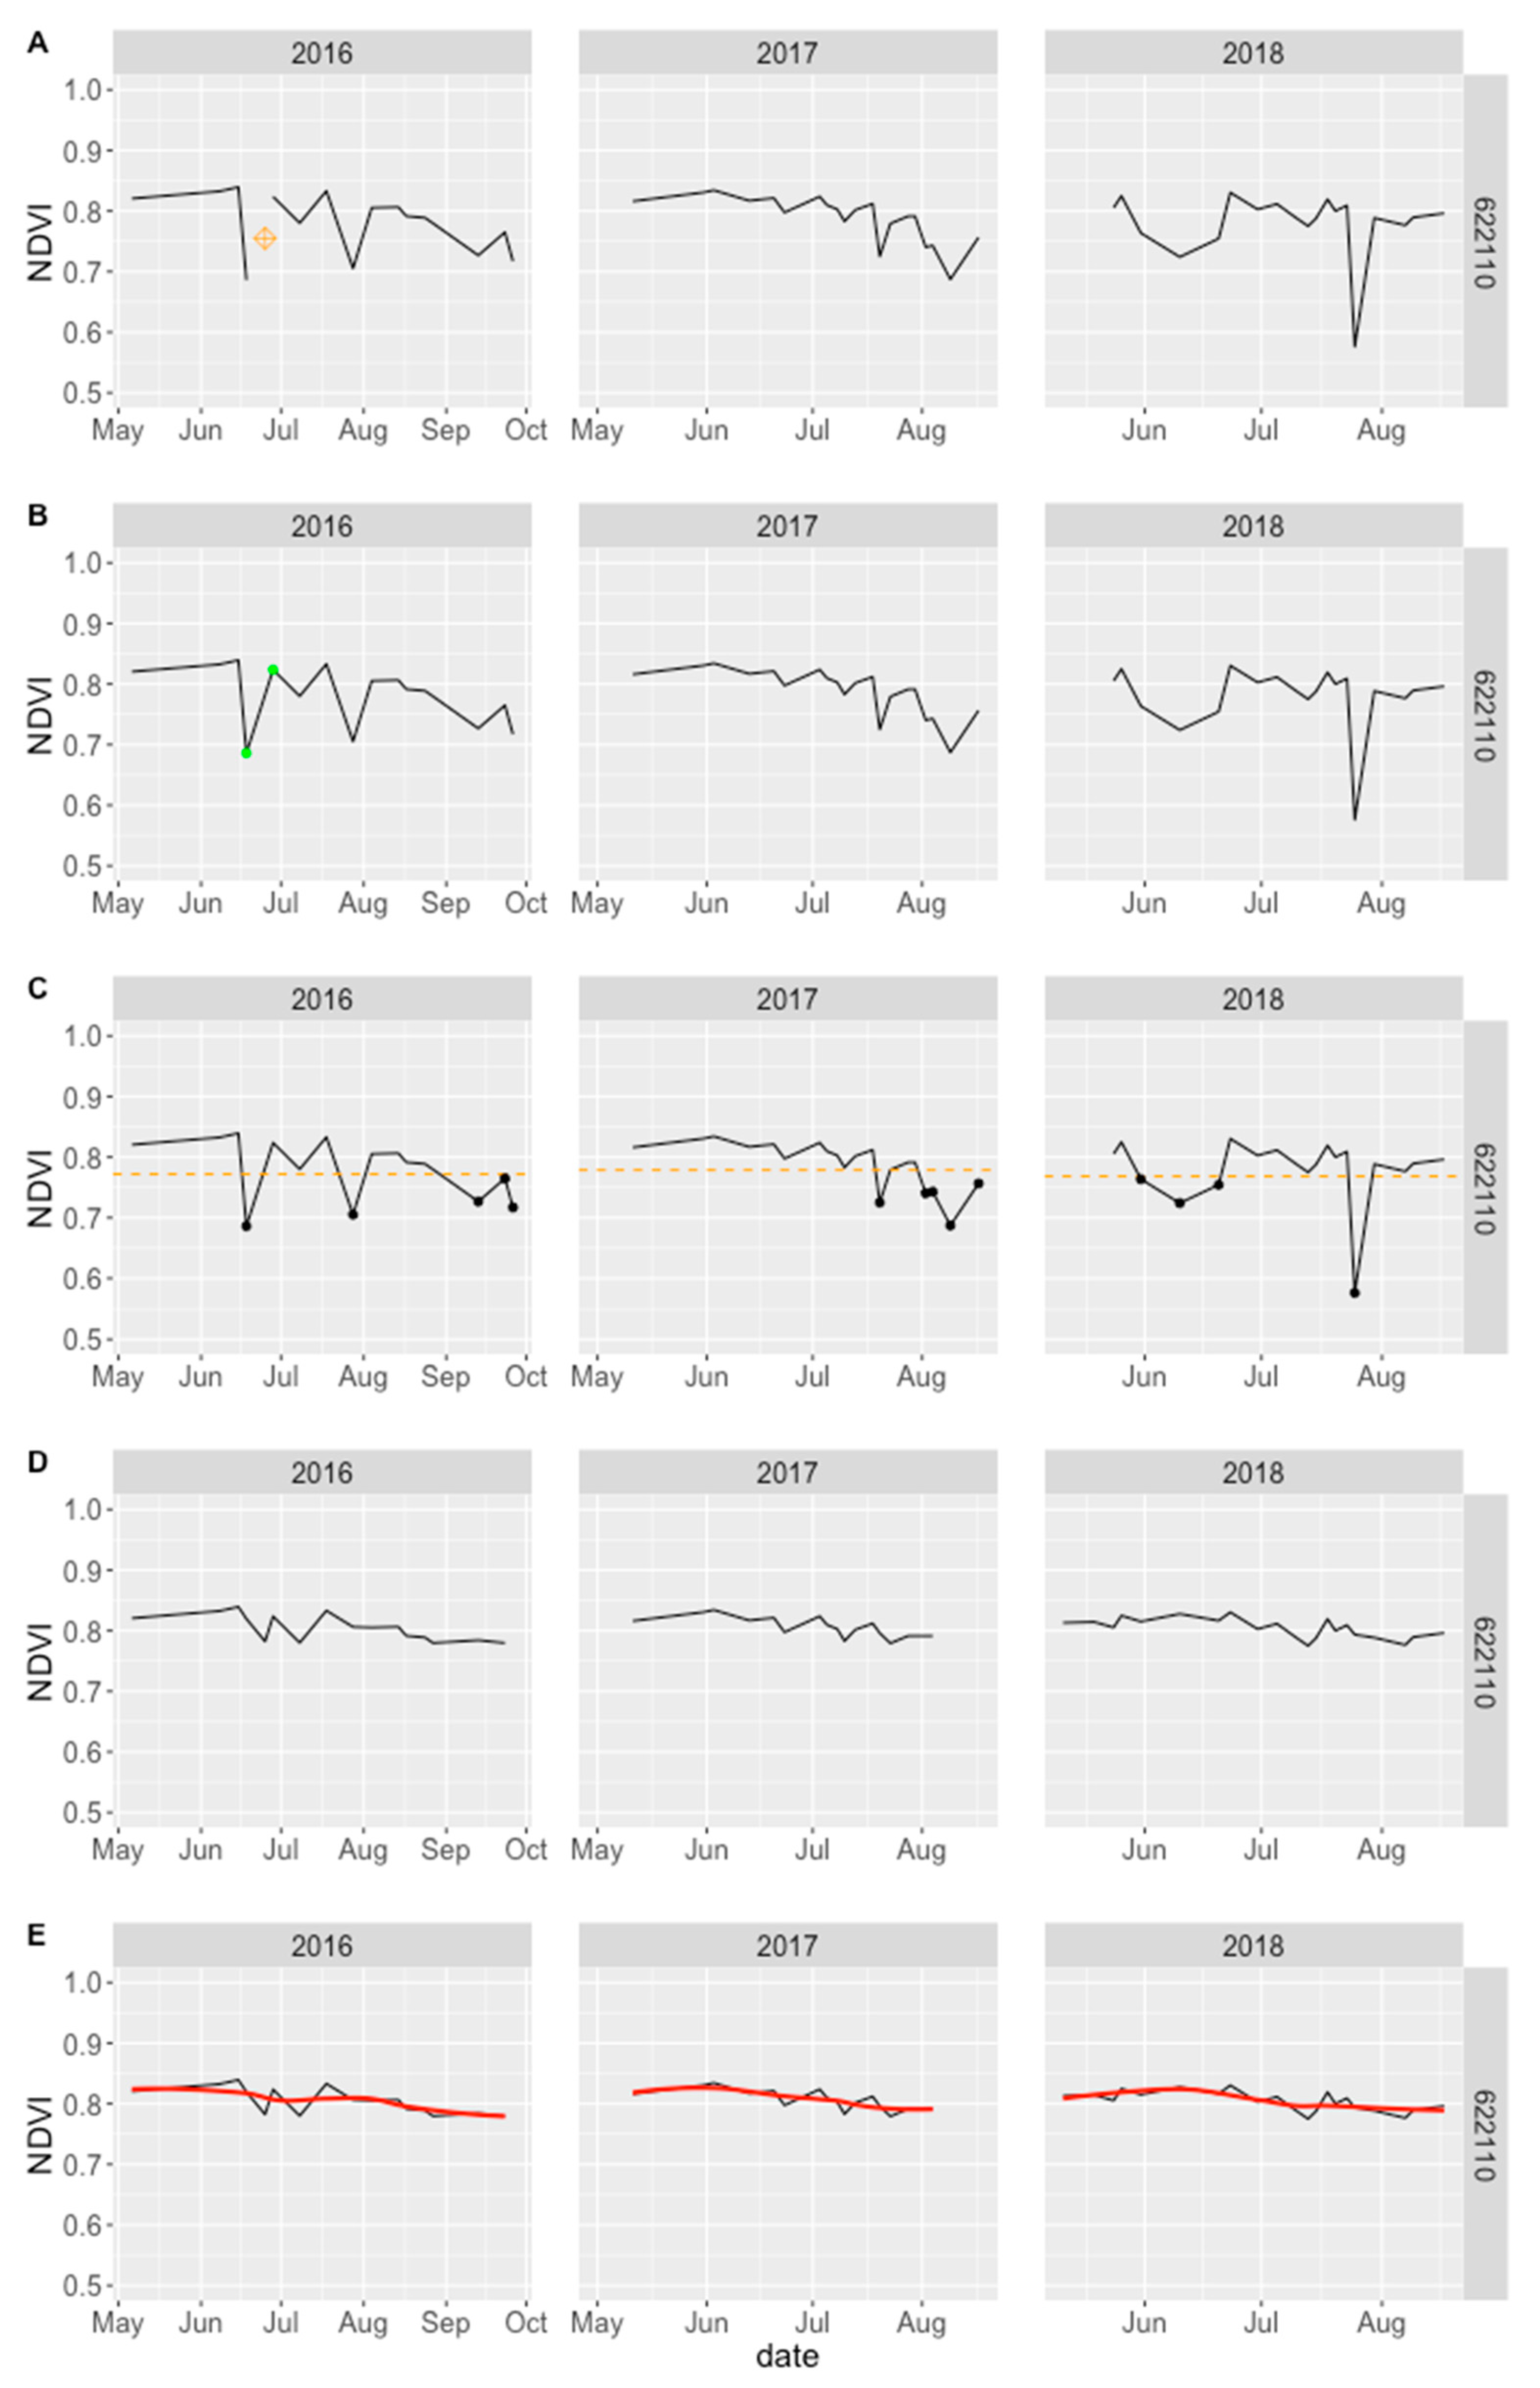
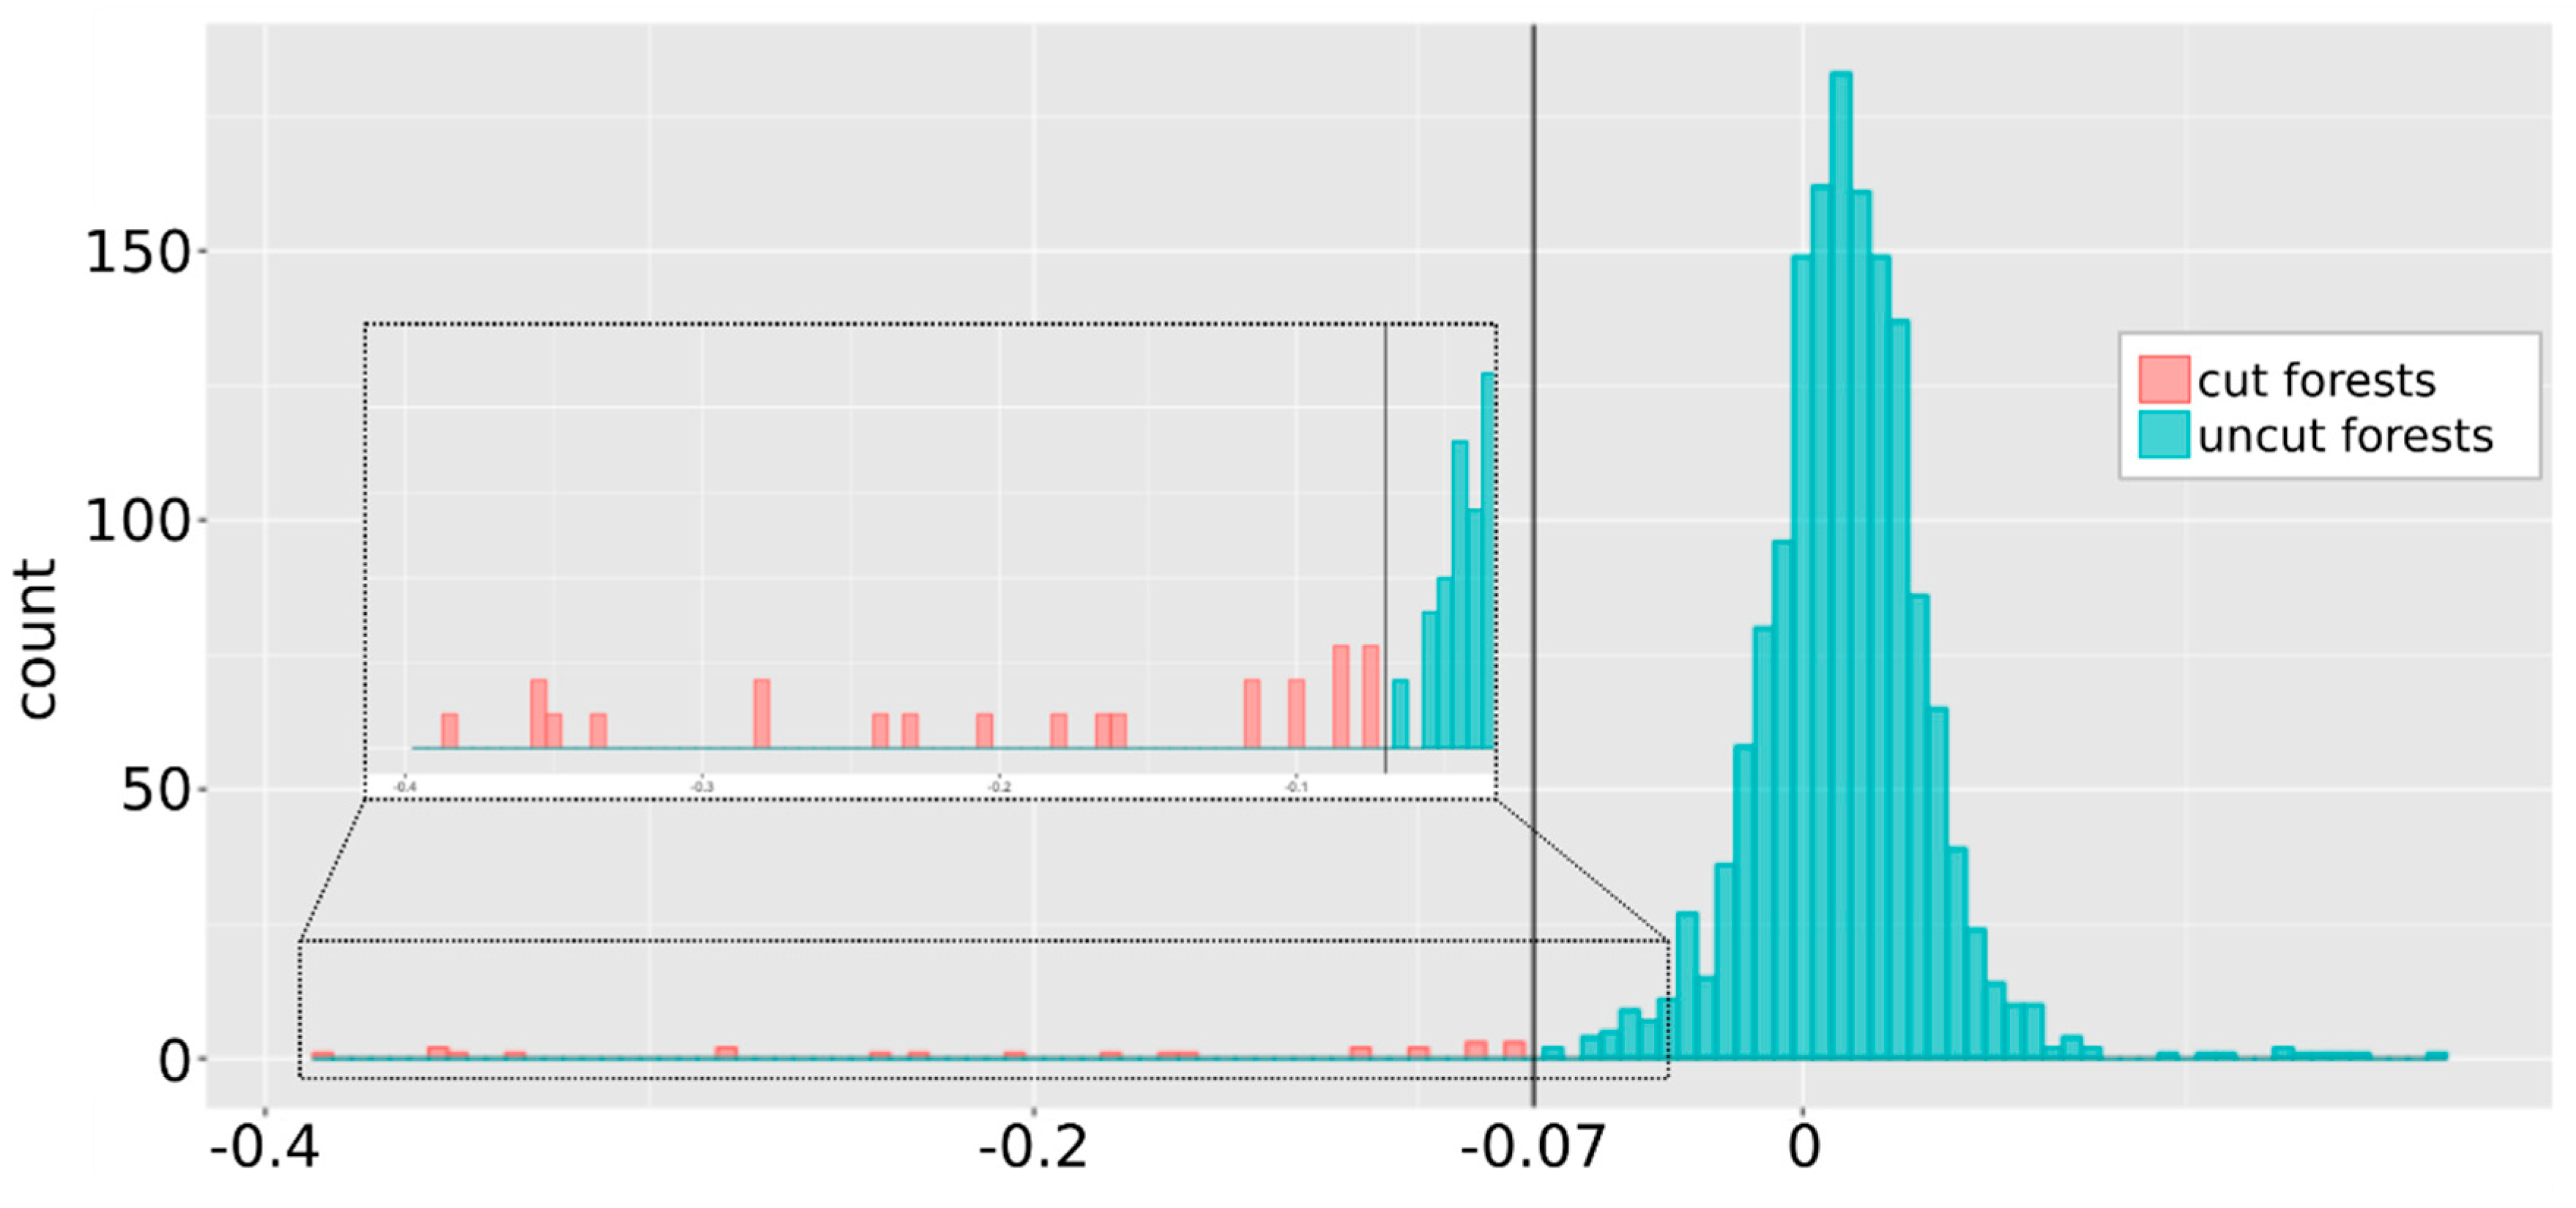
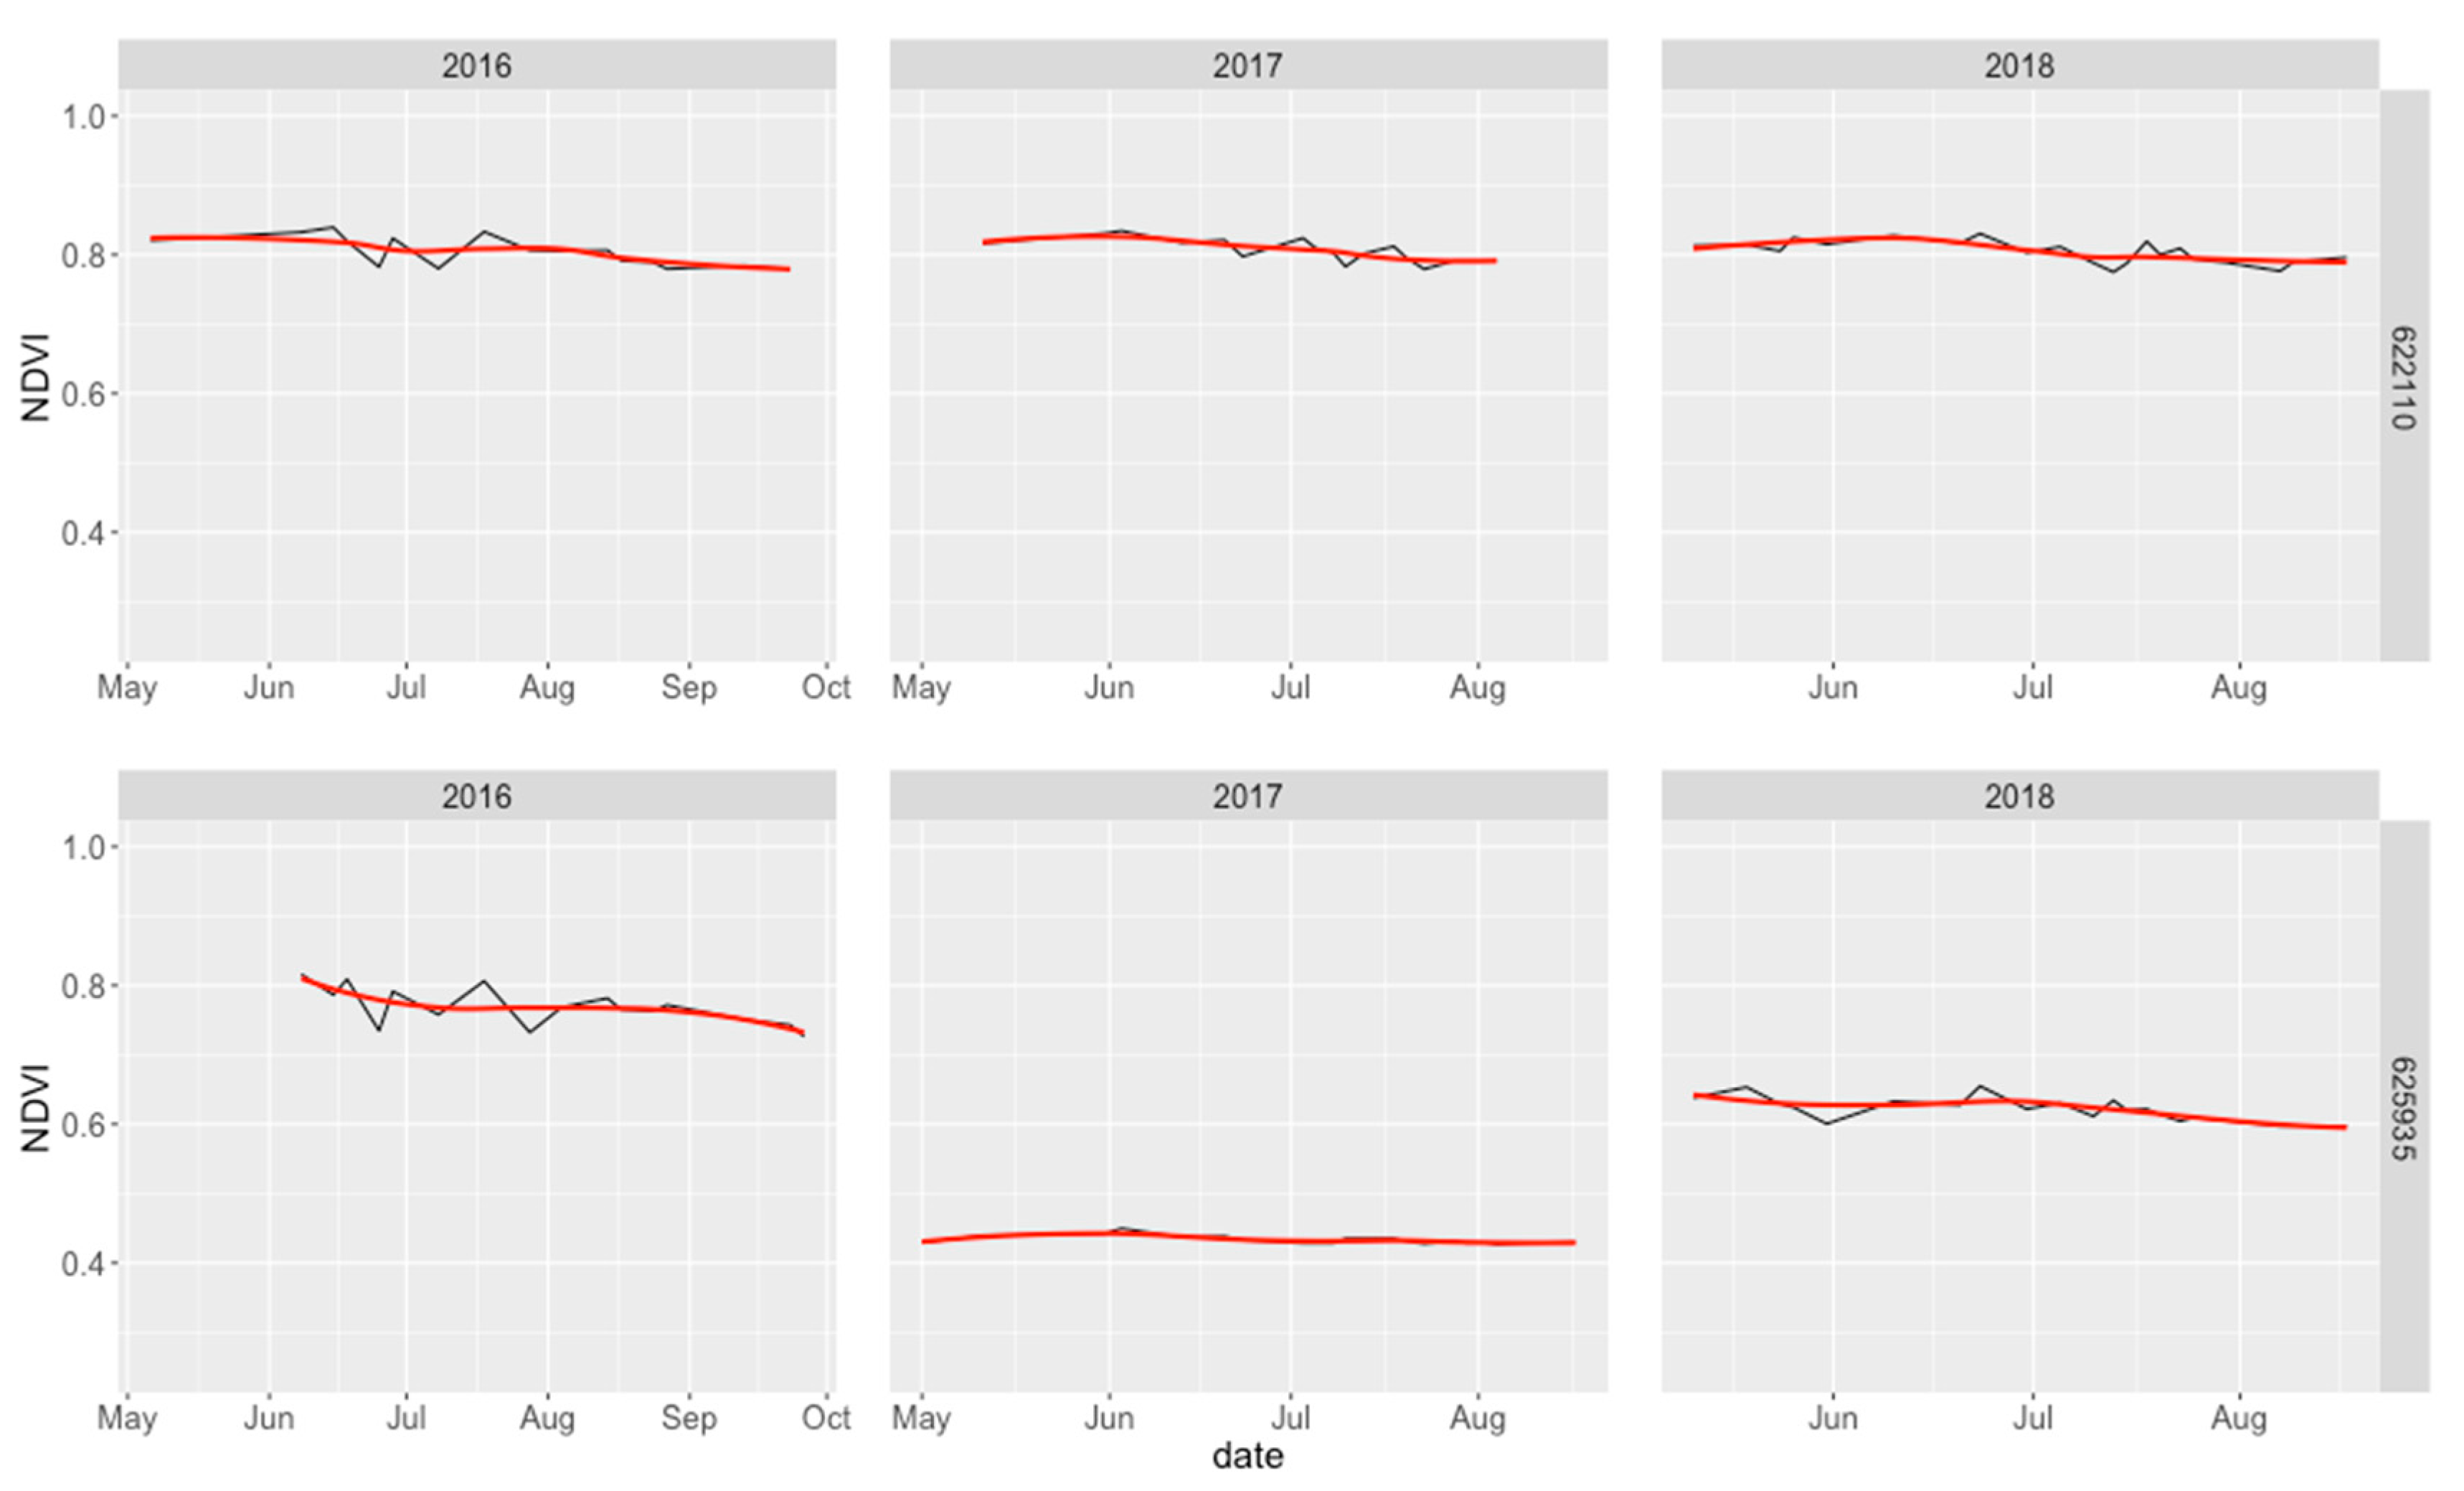
2.3. Identification of Forest Cuttings and Qualitative Assessment

In Mediterranean areas, forest cuttings are mostly carried out during autumn and winter, when trees are dormant. Tree removal entails a significant decline in red reflectance values that persists for a few years afterwards. Thus, in the aftermath of a forest cutting, the yearly seasonal NDVI growth trajectory of the regeneration vegetation is very narrow ranged. Therefore, forest sample points affected by forest cuttings can be simply distinguished from undisturbed points by computing the difference in mean NDVI values on a yearly basis ( Δ N D ^ V I y ), calculated as an indicator of the seasonal trend of the NDVI trajectory for each sample point. The performance of the adopted method was defined by comparison with data obtained from visual interpretation and field surveys (see Section 2.1).
After this step, the IUTI points on which the forest was detected as cut in winter 2016–2017 were used to estimate the spatial extent of forest cuttings with a tessellation stratified sampling (TSS) approach (for details on this approach, please see Section 2.4).

2.4. Forest Surface Area Estimates

Let U be the population of all the N forests in the delineated study area A (with surface area equal to |A|). Superimpose a region of regular shape, say Q⊃A, of size |Q|, consisting of R nonoverlapping regular polygons Q1,…, QR of equal shape and size, and such that Qi ∩ A for all i = 1,…,R. The estimate of the total area of the population units coincides with a Monte Carlo integration, the population is constituted by all the points p∈Q, and the interest variable is defined in each point, i.e.,
y ( p ) = { 1 i f   p A 0 i f   p Q A
Therefore, the parameter to estimate is
| A | = A y ( p ) dp
which can be estimated by means of tessellation stratified sampling (TSS).
According to TSS [19,20], a point is randomly chosen within each of the R polygons Q1,…,QR and the value of the interest variable (in this case whether or not the forest is cut or not) is recorded at all sample points, and R ( A ) denotes the number of sampling points falling in A . The estimator of |A| is then given by
| A | ^ = | Q | R ( A ) R
In this experiment, the area of interest was covered by a grid of 2693 tiles, each of which was 25 ha. When the number of “cut forest points” (Nfc) is detected over the AOI, the surface area of forest cuttings (Sfc) can be easily estimated, applying Equation. 4 as the product Sfc = Nfc∙25 ha.
The estimator of its variance is given by
V ^ 2 ( | A | ^ ) = | Q | 2 R 1 p A ( 1 p A )
where
p A = R ( A ) R
while | A | ^ ± 1.96 V ^ ( | A | ^ ) provides a confidence interval with nominal coverage equal to 95%.
Finally, to evaluate estimate accuracy, we used the percentage of relative standard error (RSE%):
RSE % = 100 · V ^ / A ^

3. Results

A threshold value of −0.07 for Δ NDVI ¯ y separates the sampling plots between cut forests and uncut forests with an overall accuracy of 100% (Figure 5). In the period of 2016 to 2017, a total of 23 points were detected as cut forests, corresponding to an area of 575 ha (RSE% of 20.7%) and to 1.5% of forest land in AOI. Figure 6 depicts the spatial and temporal variability of two sampling plots (cut and uncut) at the end of the procedure. The NDVI values of managed forests before cutting were found to be high (usually higher than 0.75) while, after cutting, they decreased to values ranging between 0.35 and 0.55.
At the end of the process, fifty-one S2 tiles were handled over the selected region of interest in the five months considered, 21 in 2016, and 30 in 2017. The increased number of tiles available from 2016 to 2017 was partly due to a high degree of cloudiness in 2016 (the GEE code discards tiles with an overall cloudiness higher than 20%), but mainly to the launch of Sentinel-2B in the first quarter of 2017.

4. Discussion

A critical challenge in land cover mapping by remote sensing time series is the lack of spatial continuity due to cloud cover [21]. However, the increasing interest in remote sensing NDVI time series data as an important tool for monitoring terrestrial vegetation status at large spatial scales, hence for forest management, has stimulated the development of several methods for noise reduction and the detection of abrupt changes in forested areas [22,23]. In addition, as pointed out elsewhere [24], the performance of the L1C cloud mask is low in critical environmental conditions and practical precautions are suggested, particularly for cirrus clouds. Hence, with optical remote sensing products a gap-filling procedure is strongly recommended in order to obtain consistent products and harmonized time series.
The gap-filling procedure which we developed and applied in this experiment—based on the assumption that for short periods (~15 days) the spectral variability can be considered negligible—reconstructs, with good accuracy, the missing data due to cloud cover. This is probably due to (i) the high temporal resolution of S2 data, i.e., up to five days of revisiting time, which yields scarce probability of cloudiness in the same point for more than two or three consecutive dates and (ii) the specific environmental conditions of the AOI, namely managed deciduous forests. In such a specific context, a small variation of one indicator ( Δ N D ^ VI y = 0.07 ) was enough to detect sampling points affected by forest cuttings (Figure 5). Under more heterogeneous environmental conditions, refined algorithms (e.g., classification and regression trees [25] or random forest algorithms [26]) can be required to split sampling points into different forest disturbance groups (e.g., cuttings, fires, or storms).
In its final step, the proposed procedure smoothes the temporal trajectories of NDVI values. This is not recommended for abrupt change detection within the same year [22]. However, considering that in Mediterranean areas forest cuttings are usually performed in winter, the smoothing approach can be considered useful.
The results on a harvested forest area in 2016–2017 obtained by using the approach presented herein (i.e., 575 ha) are similar to those published by the “Report on Tuscan forests—2016” (in Italian) which reported a yearly average of about 500 ha year−1 for the period 2013–2015.
Yearly forest loss spatial data derived from a time series analysis of Landsat program images (Global Forest Watch project, GFW) is also available for the AOI of this study [27]. Version 1.6, available for consultation on the World Wide Web, covers the years from 2000 to 2018. We found that GFW underestimated the forest loss area for 2017 in the AOI by a factor of 4x when compared to results from this paper (147 ha vs. 575 ha, respectively), recording an average of 120 ha y−1 for the period 2001–2018.
From the operational perspective, the GEE code performed NDVI value extraction in less than four hours. By contrast, standard procedures (i.e., download of the same 51 S2 products and processing them using computational workstations) would have required significant computing power and time (more than 50 hours) for processing and large storage capacity. The procedure can be refined for the estimation of other disturbances affecting forest growth such as fires, storms, or droughts. Land use change NDVI trajectories comparable to forest harvest are shared by land use changes to young orchard plantations (olive, fruit, hazelnut, and walnut), where repeated weeding leads to invariant low NDVI values over the growing season. Hazelnut production, in particular, is rapidly expanding in Italy both in terms of fruit production and land use change [28]. This rapid expansion is radically transforming the rural landscape of a few Italian districts in Piedmont [23] and Lazio. The GEE procedure which we developed has the potential to detect land use change to new orchard plantations, needed to support policy makers in evaluating rural policies for valuable crops (e.g., the EU’s Common Agricultural Policy) and their effects on landscape, production, and society [29].

5. Conclusions

The workflow we presented demonstrates the efficiency of a point sampling approach combined with frequent acquisition of remotely sensed images for detection and estimation of forest disturbances. Particularly over large areas, updated data accessible for validation as reference data are scarce, and some authors have raised concerns about the operational use of remotely sensed land cover products for policy and decision-making [30]. For detection of LULUCF, an approach based on sampling points leads to better results when compared with maps obtained from classification of remotely sensed images over polygons.
The present study assessed the land use change at a subset of sampling points identified by the Italian Land Use Inventory (IUTI) in order to estimate the proportion of forest land use change in a specific area of interest. Sentinel-2 spatial resolution (100-m2 per pixel) enables land use change detection at very fine spatial detail, such that the boundaries of harvested forest areas can be easily identified and mapped.
Future activities will include the deployment of the presented workflow on a dedicated web-based spatial decision support system platform in order to enhance benefits for a broader community and support policy makers.

Author Contributions

Conceptualization and Methodology N.P.; Formal Analysis N.P. and M.B.; Writing—Original Draft Preparation, Review and Editing, N.P. and M.B.

Funding

This research received no external funding.

Conflicts of Interest

The authors declare no conflicts of interest.

References

  1. Han, G.; Chen, J.; He, C.; Li, S.; Wu, H.; Liao, A.; Peng, S. A web-based system for supporting global land cover data production. ISPRS J. Photogramm. Remote Sens. 2015, 103, 66–80. [Google Scholar] [CrossRef]
  2. Gorelik, N.; Hancher, M.; Dixon, M.; Ilyushchenk, S.; Thau, D.; Moore, R. Google Earth Engine: Planetary-scale geospatial analysis for everyone. Remote Sens. Environ. 2017, 202, 18–27. [Google Scholar] [CrossRef]
  3. Chastain, R.; Housman, I.; Goldstein, J.; Finco, M.; Tenneson, K. Empirical cross sensor comparison of Sentinel-2A and 2B MSI, Landsat-8 OLI, and Landsat-7 ETM+ top of atmosphere spectral characteristics over the conterminous United States. Remote Sens. Environ. 2019, 221, 274–285. [Google Scholar] [CrossRef]
  4. Zhu, Z. Change detection using Landsat time-series: A review of frequencies, preprocessing, algorithms, and applications. ISPRS J. Photogramm. Remote Sens. 2019, 130, 370–384. [Google Scholar] [CrossRef]
  5. Puletti, N.; Camarretta, N.; Corona, P. Evaluating EO1-Hyperion capability for mapping conifer and broadleaved forests. Eur. J. Remote Sens. 2016, 49, 157–169. [Google Scholar] [CrossRef]
  6. Hu, Y.; Dong, Y.; Batunacun. An automatic approach for land-change detection and land updates based on integrated NDVI timing analysis and the CVAPS method with GEE support. ISPRS J. Photogramm. Remote Sens. 2018, 146, 347–359. [Google Scholar] [CrossRef]
  7. Chirici, C.; Winter, S.; McRoberts, R.E. (Eds.) National Forest Inventories: Contributions to Forest Biodiversity Assessments; Managing Forest Ecosystems; Springer: Dordrecht, The Netherlands, 2011; Volume 20, p. 206. [Google Scholar]
  8. Corona, P.; Chirici, G.; Marchetti, M. Forest ecosystem inventory and monitoring as a framework for terrestrial natural renewable resource survey programmes. Plant Biosyst. 2002, 136, 69–82. [Google Scholar] [CrossRef]
  9. Stehman, S.V. Model-assisted estimation as a unifying framework for estimating the area of land cover and land-cover change from remote sensing. Remote Sens. Environ. 2009, 113, 2455–2462. [Google Scholar] [CrossRef]
  10. Close, O.; Benjamin, B.; Petit, S.; Fripiat, X.; Hallot, E. Use of Sentinel-2 and LUCAS Database for the Inventory of Land Use, Land Use Change, and Forestry in Wallonia, Belgium. Land 2018, 7, 154. [Google Scholar] [CrossRef]
  11. FAO. Global Forest Resources Assessment 2000; Main Report; FAO Forestry Paper: Rome, Italy, 2001. [Google Scholar]
  12. Barbati, A.; Marchetti, M.; Chirici, G.; Corona, P. European forest types and forest Europe SFM indicators: Tools for monitoring progress on forest biodiversity conservation. For. Ecol. Manag. 2014, 321, 145–157. [Google Scholar] [CrossRef]
  13. Laurin, G.V.; Balling, J.; Corona, P.; Mattioli, W.; Papale, D.; Puletti, N.; Rizzo, M.; Truckenbrodt, J.; Urban, M. Above-ground biomass prediction by Sentinel-1 multitemporal data in central Italy with integration of ALOS2 and Sentinel-2 data. J. Appl. Remote Sens. 2018, 12, 1–18. [Google Scholar] [CrossRef]
  14. Mura, M.; Bottalico, F.; Giannetti, F.; Bertani, R.; Giannini, R.; Mancini, M.; Orlandini, S.; Travaglini, D.; Chirici, G. Exploiting the capabilities of the Sentinel-2 multi spectral instrument for predicting growing stock volume in forest ecosystems. Int. J. Appl. Earth Obs. Geoinf. 2018, 66, 126–134. [Google Scholar] [CrossRef]
  15. Puletti, N.; Chianucci, F.; Castaldi, C. Use of Sentinel-2 for forest classification in Mediterranean environments. Ann. Silvic. Res. 2018, 42, 32–38. [Google Scholar] [CrossRef]
  16. Maselli, F.; Moriondo, M.; Chiesi, M.; Chirici, G.; Puletti, N.; Barbati, A.; Corona, P. Evaluating the effects of environmental changes on the gross primary production of Italian forests. Remote Sens. 2009, 1, 1108–1124. [Google Scholar] [CrossRef]
  17. Bascietto, M.; Bajocco, S.; Mazzenga, F.; Matteucci, G. Assessing spring frost effects on beech forests in Central Apennines from remotely-sensed data. Agric. For. Meteorol. 2018, 248, 240–250. [Google Scholar] [CrossRef]
  18. R Core Team. R: A Language and Environment for Statistical Computing; R Foundation for Statistical Computing: Vienna, Austria, 2018; Available online: https://www.R-project.org/ (accessed on 1 November 2018).
  19. Corona, P.; Barbati, A.; Tomao, A.; Bertani, R.; Valentini, R.; Marchetti, M.; Fattorini, L.; Perugini, L. Land use inventory as framework for environmental accounting: An application in Italy. iForest 2012, 5, 204–209. [Google Scholar] [CrossRef]
  20. Fattorini, L.; Marcheselli, M.; Pisani, C. Two-phase estimation of coverages with second-phase corrections. Environmetrics 2004, 15, 357–368. [Google Scholar] [CrossRef]
  21. Kovalskyy, V.; Roy, D.P. The global availability of Landsat 5 TM and Landsat 7 ETM + land surface observations and implications for global 30 m Landsat data product generation. Remote Sens. Environ. 2013, 130, 280–293. [Google Scholar] [CrossRef]
  22. Vuolo, F.; Ng, W.T.; Atzberger, C. Smoothing and gap-filling of high resolution multi-spectral time series: Example of Landsat data. Int. J. Appl. Earth Obs. Geoinf. 2017, 57, 202–213. [Google Scholar] [CrossRef]
  23. Verbesselt, J.; Hyndman, R.; Newnham, G.; Culvenor, D. Detecting trend and seasonal changes in satellite image time series. Remote Sens. Environ. 2010, 114, 106–115. [Google Scholar] [CrossRef]
  24. Coluzzi, R.; Imbrenda, V.; Lanfredi, M.; Simoniello, T. A first assessment of the Sentinel-2 Level 1-C cloud mask product to support informed surface analyses. Remote Sens. Environ. 2018, 217, 426–443. [Google Scholar] [CrossRef]
  25. Breiman, L. Classification and Regression Trees; Routledge: Abingdon, UK, 2017. [Google Scholar]
  26. Breiman, L. Random Forests. Mach. Learn. 2001, 45, 5–32. [Google Scholar] [CrossRef]
  27. Hansen, M.C.; Potapov, P.V.; Moore, R.; Hancher, M.; Turubanova, S.A.; Tyukavina, A.; Thau, D.; Stehman, S.V.; Goetz, S.J.; Loveland, T.R.; et al. High-resolution global maps of 21st-century forest cover change. Science 2013, 342, 850–853. [Google Scholar] [CrossRef] [PubMed]
  28. ISTAT. Agricoltura e zootecnia, Superficie (ettari) e produzione (quintali): Nocciole, mandorle, pistacchi, fichi. 2018. Available online: http://agri.istat.it/jsp/dawinci.jsp?q=plC190000010000022100&an=2018&ig=1&ct=270&id=15A|21A|30A (accessed on 1 March 2019).
  29. Godone, D.; Garbarino, M.; Sibona, E.; Garnero, G.; Godone, F. Progressive fragmentation of a traditional Mediterranean landscape by hazelnut plantations: The impact of CAP over time in the Langhe region (NW Italy). Land Use Policy 2014, 36, 259–266. [Google Scholar] [CrossRef]
  30. Foody, G.M. Assessing the accuracy of land cover change with imperfect ground reference data. Remote Sens. Environ. 2010, 114, 2271–2285. [Google Scholar] [CrossRef]
Figure 1. Study area of Municipal Union of Upper Tiber Valley in Tuscany and the reference points acquired from the IUTI database. The background is a true color digital aerial orthophoto of 2016 (20-cm resolution).
Land 08 00058 g001
Figure 2. Schematic workflow of the Google Earth Engine (GEE) code. For each considered date, a specific cloud cover mask layer is applied. The workflow yields a comma separated value (CSV) file, which in turn is used as input for further analysis in R (see Figure 3).
Land 08 00058 g002
Figure 3. (A) Normalized difference vegetation index (NDVI) growth trajectories for sampling points with ID #622110, a mature forest without cuts during the observed period (2016–2017). The break in the 2016-line (the point in orange) is an NDVI value falling in a cloud and then masked by the CCM-60m layer. (B) The gaps in the NDVI growth trajectory were filled by linear interpolation averaging the previous and subsequent values to a gap (green points). (C) Specific threshold defined for each year (median NDVI value); black dots represent NDVI values lower than the threshold, considered as covered by clouds in the procedure (see Figure 4). (D) The final result of the gap filling procedure. (E) Estimation of NDVI values by regular intervals using a local regression (smoothed red line).
Land 08 00058 g003
Figure 4. An example of false-positive masked values (the same as the green point on the left in Figure 3B). The point in the center of each subimage is not masked by CCM-60m (on the left) but is covered by clouds, as visible in the true color image on the right.
Land 08 00058 g004
Figure 5. Frequency distribution of Δ N D ^ VI y for the 1580 forest points. The vertical black line is the Δ N D ^ VI y value that separates cut and uncut forests in the period of 2016 to 2017. The box highlights the distribution of plots where forest cutting occurred.
Land 08 00058 g005
Figure 6. Comparison of the results in an uncut forest (point #622110, upper row) and a cut forest (point #629535, lower row). In 2017, the mean NDVI value decreases by about 0.35 because of clear-cut. In 2018 the herbaceous vegetation reaches upper values of NDVI, but lower than those in 2016.
Land 08 00058 g006

