Article

Influence of Landscape Pattern Changes on Runoff and Sediment in the Dali River Watershed on the Loess Plateau of China

1
Shaanxi Key Laboratory of Earth Surface System and Environmental Carrying Capacity, College of Urban and Environmental Sciences, Northwest University, Xi’an 710127, China
2
Department of Sediment Research, China Institute of Water Resources and Hydropower Research (IWHR), State key Laboratory of Simulation and Regulation of Water Cycle in River Basin, Beijing 100038, China
*
Author to whom correspondence should be addressed.
Land 2019, 8(12), 180; https://doi.org/10.3390/land8120180
Submission received: 6 November 2019 / Revised: 20 November 2019 / Accepted: 23 November 2019 / Published: 24 November 2019
(This article belongs to the Special Issue Soil Erosion Processes and Rates in Arid and Semiarid Ecosystems)

Abstract

:
The large-scale Grain for Green project on the Loess Plateau of China significantly changes the regional landscape pattern, which has a profound impact on runoff and sediment process. The relationship between landscape pattern and runoff and sediment in the Dali River watershed is established. Cropland and grassland areas in the watershed show a downward trend, whereas the woodland and building land increases continuously. The Number of Patches (NP), Patch Density (PD) and Landscape Diversity (SHDI), Landscape Division Index (DIVISION) increase significantly. The Largest Patch Index (LPI) and Landscape Shape Index (LSI) show overall change in the rising and falling rule. The Contagion Index (CONTAG) and Cohesion Index (COHESION) first increase, then decrease. A decreasing trend is shown by runoff and sediment. The annual runoff in 2010 was 29.76% less than in 1960, and the annual sediment load was 84.87% less. NP, PD, COHESION, DIVISION and SHDI have a significant negative correlation with runoff and sediment, and CONTAG and runoff sediment are positively related. This study could provide theoretical support for guiding watershed land use and landscape planning to effectively reduce runoff and sediment transport.

1. Introduction

The ecological environment of the Loess Plateau of China is fragile. Affected by natural factors such as broken terrain, loose soil, and concentrated rainfall in summer, soil erosion is serious in this region [1]. In recent years, the frequent human activities, overgrazing, excessive reclamation, deforestation, and other human factors have been intensifying the regional ecological environment deterioration, resulting in the soil erosion area on the Loess Plateau region expanding year by year [2]. The Yellow River transported about 0.1–0.2 billion tons of sediment annually since 2010 [3,4]. Serious soil erosion on the Loess Plateau not only affects the ecological security of the Yellow River, but also restricts the sustainable development of regional social economy for a long time [5].
Since the 1980s, the Chinese government has successively developed a series of water and soil conservation measures, including vegetation recovery, terracing, and check dam constructions [6]. Especially, the implementation of the Grain for Green project starting in 1999 plays an important role in controlling the slope soil erosion and improves the regional ecological environment [7,8]. Vegetation restoration on the Loess Plateau is a key factor for driving land use and land cover change [9]. The large-scale artificial afforestation has improved the regional surface vegetation coverage remarkably [10]. Vegetation plays an important role in reducing soil erosion through water retention and soil fixation [11]. The increase of vegetation coverage can intercept rainfall, increase surface infiltration, and reduce surface runoff [12].
The change of watershed land use and land cover is also the direct drive of landscape pattern evolution [13]. Landscape patterns are the embodiment of the heterogeneity of patch space of different types, and also represent the way and state of land use. The interaction between landscape spatial pattern change and ecological process is one of the core contents of landscape ecology research [14]. The study of landscape patterns and runoff and sediment processes can provide a basis for optimization, regulation, and watershed management of landscape patterns. The change of mosaic characteristics of landscape components in space can change the hydrological structure and erosion system, thus affecting the interception ability of the landscape to reduce both the runoff and the sediment transport [15]. Based on the regression analysis of a conventional landscape index and soil erosion, it is concluded that the decrease of grassland patch size and the increase of patch boundary lead to the decrease of erosion [16]. From the perspective of landscape spatial configuration and type composition change, it is possible to reveal the impact of human activities on runoff and sediment processes through studying the landscape change and runoff and sediment process response [17]. The change of land use type has a great influence on runoff process and the increase of forestland reduces the runoff during flood season [18,19]. The vegetation restoration project has significantly changed the pattern of the underlying surface, and the change of watershed landscape pattern has a significant impact on runoff and sediment export [20].
Studies on runoff and sediment on the Loess Plateau region have received extensive attention, which mainly focuses on the impact of slope vegetation restoration, land preparation, and other projects on hydrologic processes [5,12]. In arid and semi-arid areas, the unreasonable landscape pattern configuration will cause a series of negative effects on the ecological environment. The analysis of the influence of land use changes on runoff and sediment transport processes from the perspective of watershed landscape pattern change, connects the natural environment and human activities. Therefore, it is necessary to fully understand the relationship between the evolution of watershed landscape pattern and soil erosion. The Dali River watershed is located in the hilly and gully Loess region. The annual sediment delivery from Dali River watershed to Yellow River is 7.22 million t. Therefore, this watershed was selected to (1) analyze the spatial-temporal evolution of watershed land use and landscape pattern from 1980 to 2010; (2) search sensitive landscape index factors and establish their relationship with runoff and sediment; and (3) provide theoretical support for guiding watershed land use planning.

2. Materials and Methods

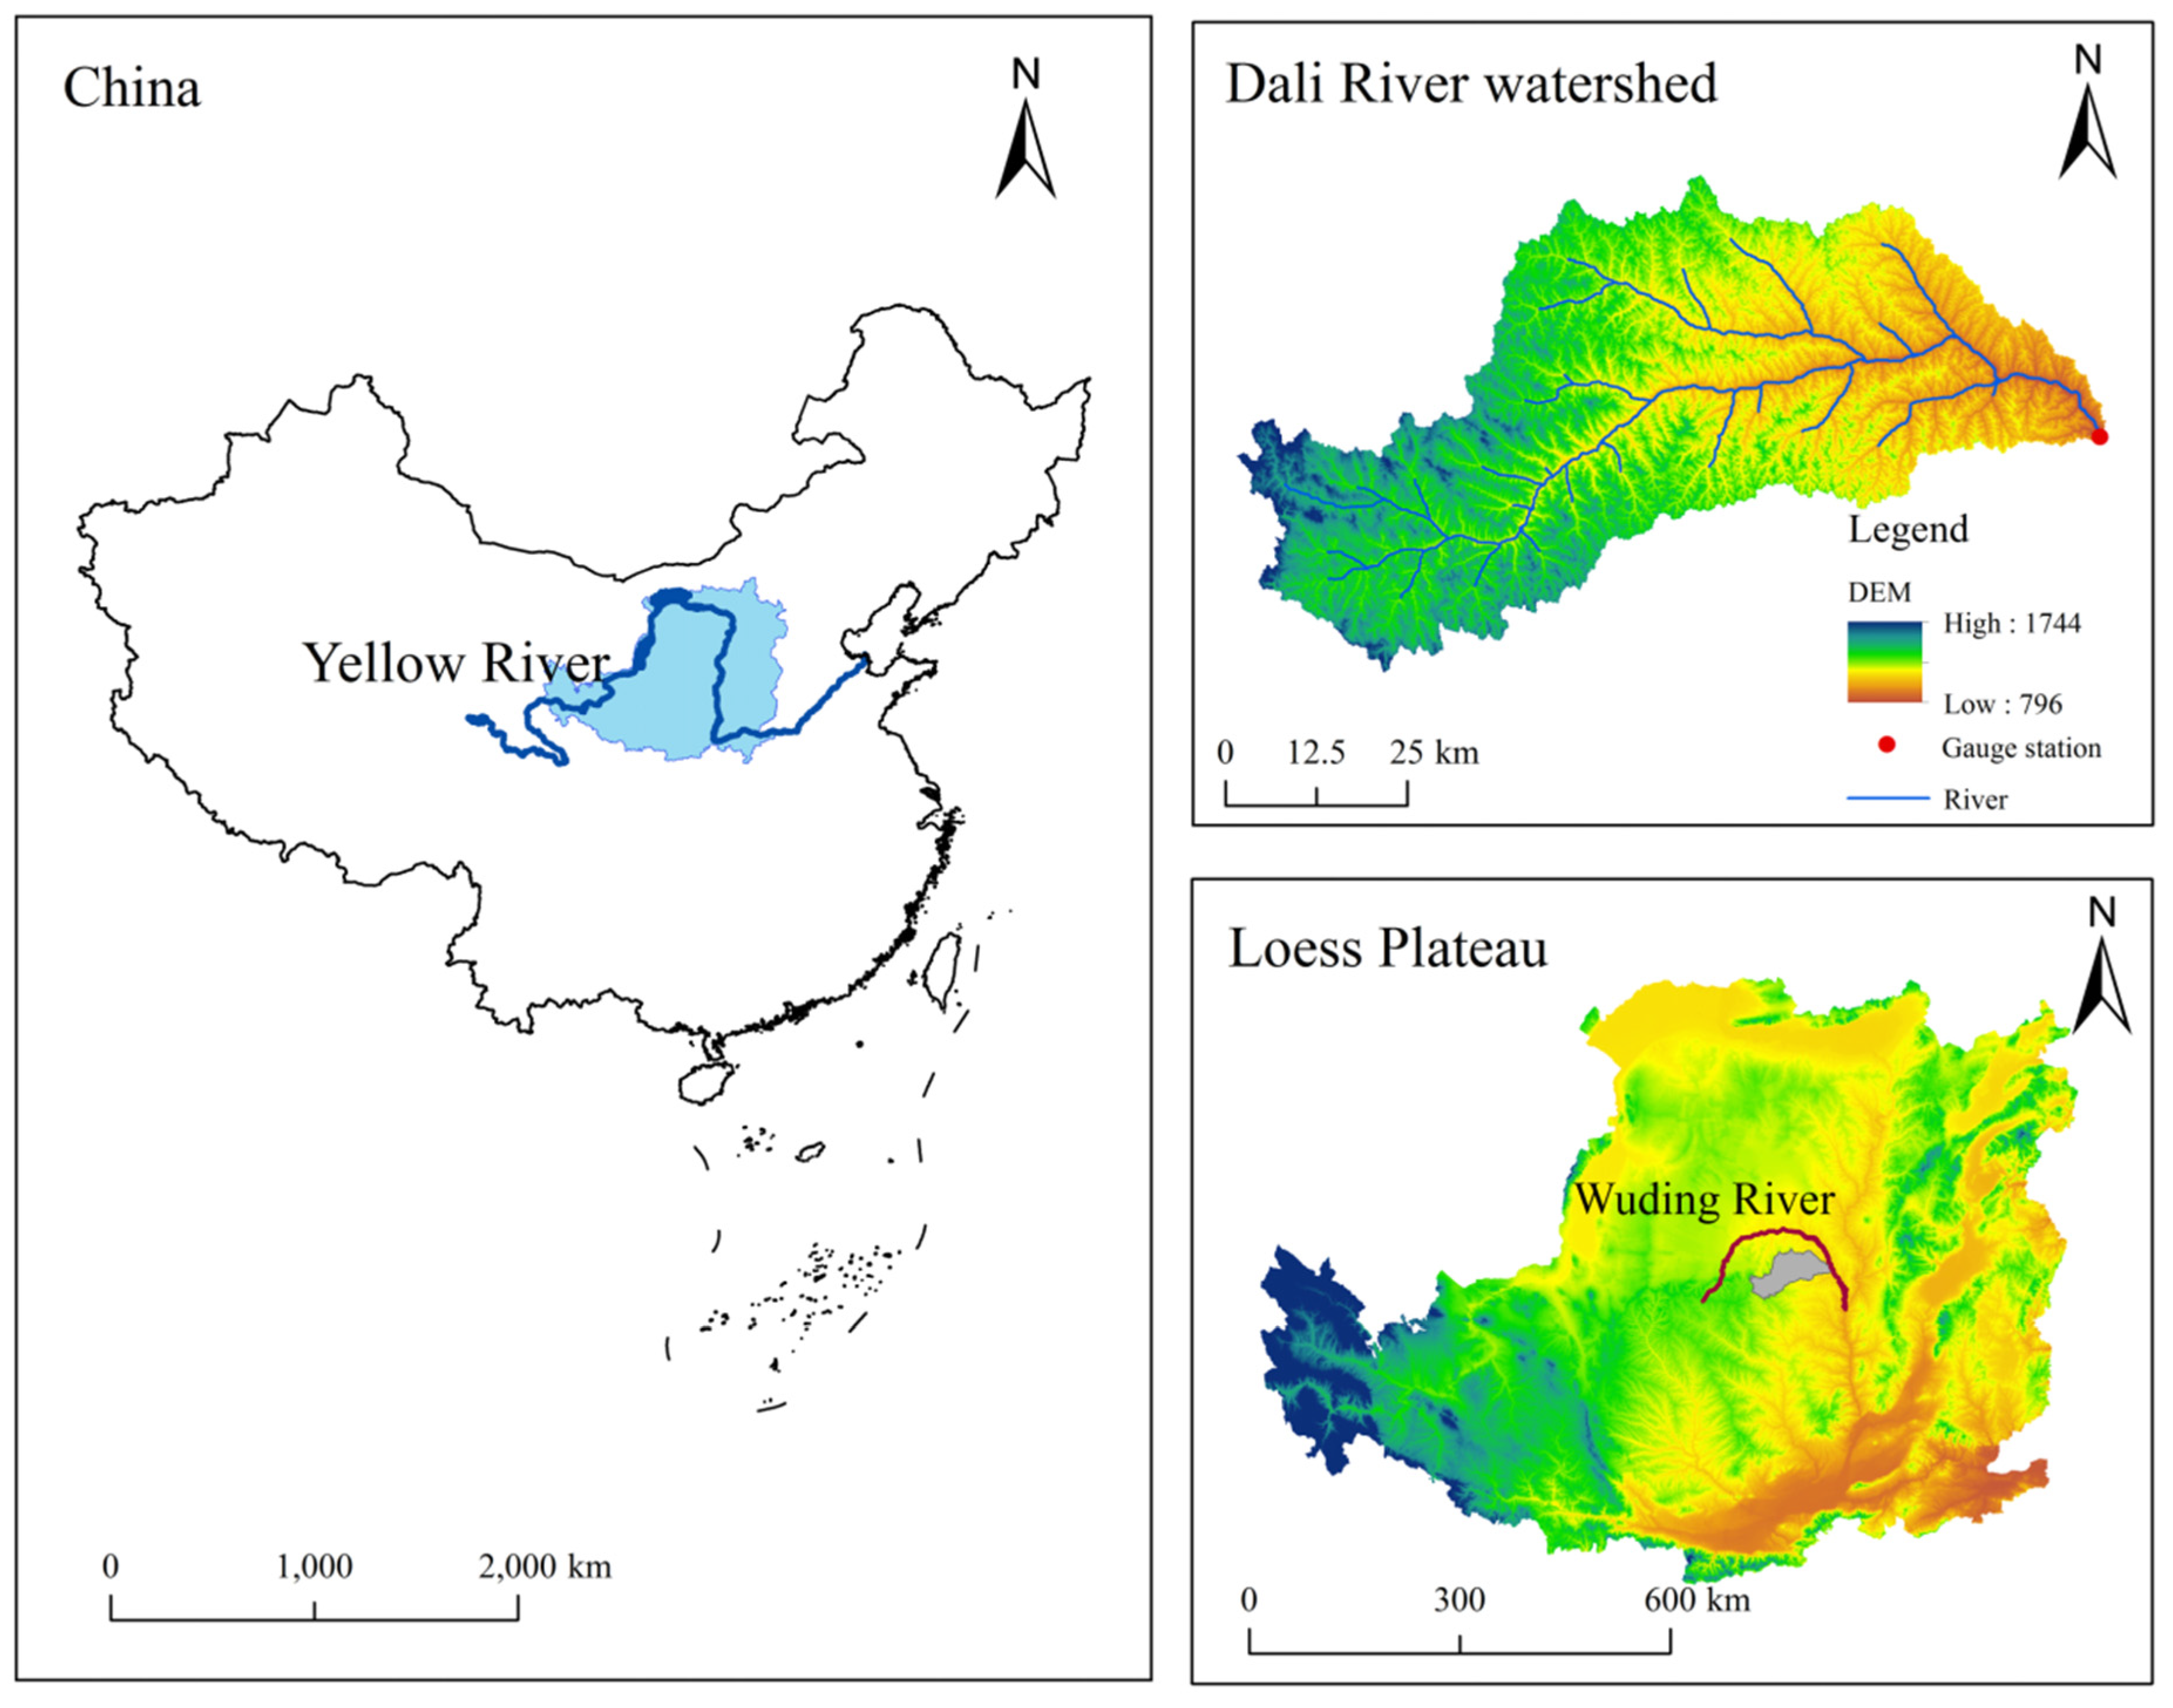
2.1. Description of the Study Area

The Dali River watershed (109°14′–110°13′ N and 37°30′–37°56′ E) is located in the middle of the Yellow River which is the second longest river in China and the 5th longest in the world (Figure 1). The Dali River is the largest tributary of Wuding River, with a total length of 159.9 km. It originates from Qiaogouwan, Jingbian County, Shaanxi province, runs through Hengshan, Zichang, Zizhou, and Mizhi counties, and flows into Wuding River in Suide County. The overall terrain is high in the west and low in the east. The elevation is between 796 m and 1744 m. The soil type is mainly loessial soil, which has a weak cohesion [21]. The region belongs to the semi-arid continental monsoon climate in the warm temperate zone, with an average annual precipitation of about 420 mm. The precipitation is mainly concentrated in summer. The rainfall lasts for a short period of time and is of great intensity, often in the form of heavy rain.

2.2. The Data Collected

This study uses Chinese 1:100000 land use data (seven maps of 1980, 1985, 1990, 1995, 2000, 2005, and 2010), from Resources and Environment Science Data Center of Chinese Academy of Sciences (http://www.resdc.cn). The data using Landsat TM remote sensing image is obtained by experts with visual interpretation, and the interpretation accuracy is above 95% after the field investigation [22]. The runoff and sediment data of Dali River from 1960 to 2010 is obtained from monitoring values of gauging station located at the outlet of the watershed.

2.3. Data Analysis

ArcGIS 9.5 software is used to analyze spatio-temporal changes of different land use types. This study adopts the first-level classification of land use, and the land use types in the study area include cropland, forestland, grassland, building, and water. The spatial pattern parameters of watershed landscape are extracted with FRAGSTAT 3.3 software and relevant landscape indexes are calculated. According to the FRAGSTAT 3.3 Operation Manual, the landscape index can be divided into three different metrics: (1) patch metrics: reflecting the structural characteristics of patches in the landscape; (2) class metrics: reflecting the structural characteristics of different landscape types; (3) landscape metrics: reflecting the overall structural characteristics. Landscape pattern indexes can quantitatively indicate landscape pattern information such as the structural composition and the spatial configuration [23]. For the quantitative evaluation of land use and landscape pattern changes, eight landscape pattern indexes are selected (Table 1): Number of Patches (NP), Patch Density (PD), Largest Patch Index (LPI), Landscape Shape Index (LSI), Contagion Index (CONTAG), Cohesion Index (COHESION), Landscape Division Index (DIVISION), and Shannon’s Diversity Index (SHDI). These indexes are sensitive to changes of the landscape structure and spatial configuration, and can also influence the runoff and sediment discharge process [13].
The Pearson correlation method is used to analyze the relationship between the landscape pattern index, the runoff, and the sediment. A linear regression method is adopted to determine the quantitative relationship of interdependence among variables, in which the independent variable is runoff or sediment amount, and the dependent variable is the landscape pattern index. The Pearson correlation and linear regression analysis are conducted under SPSS16.0 software.

3. Results

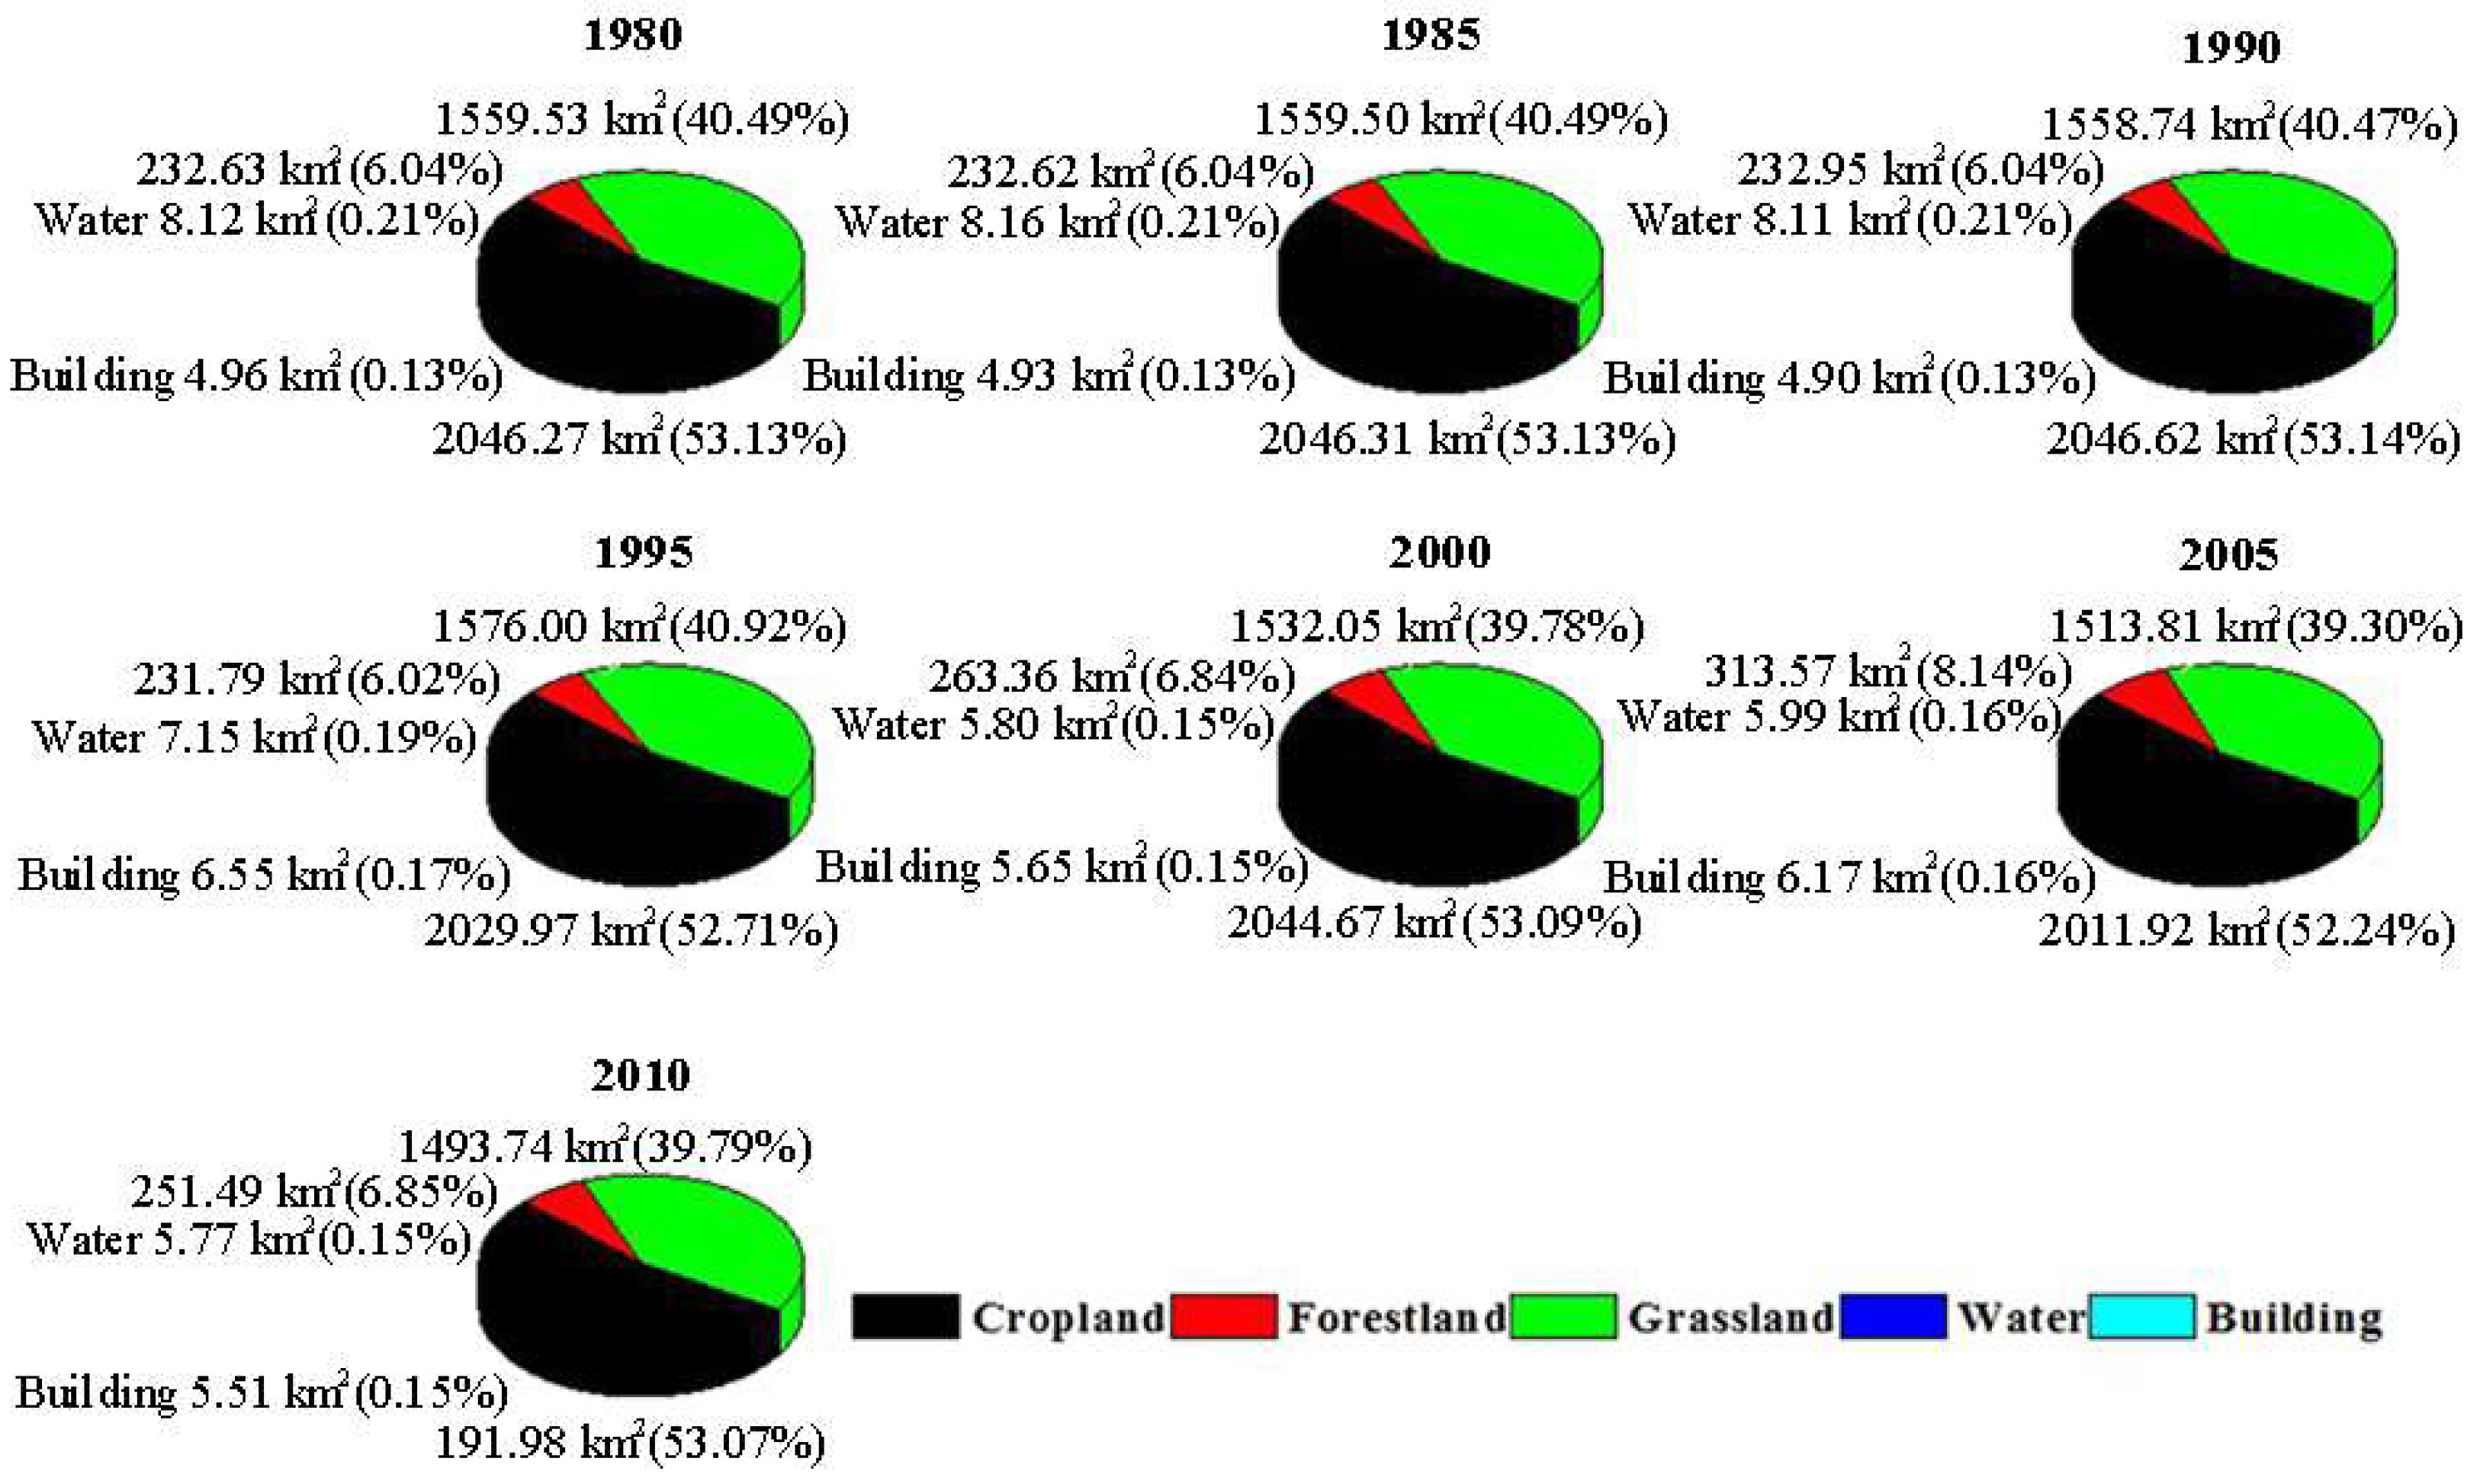
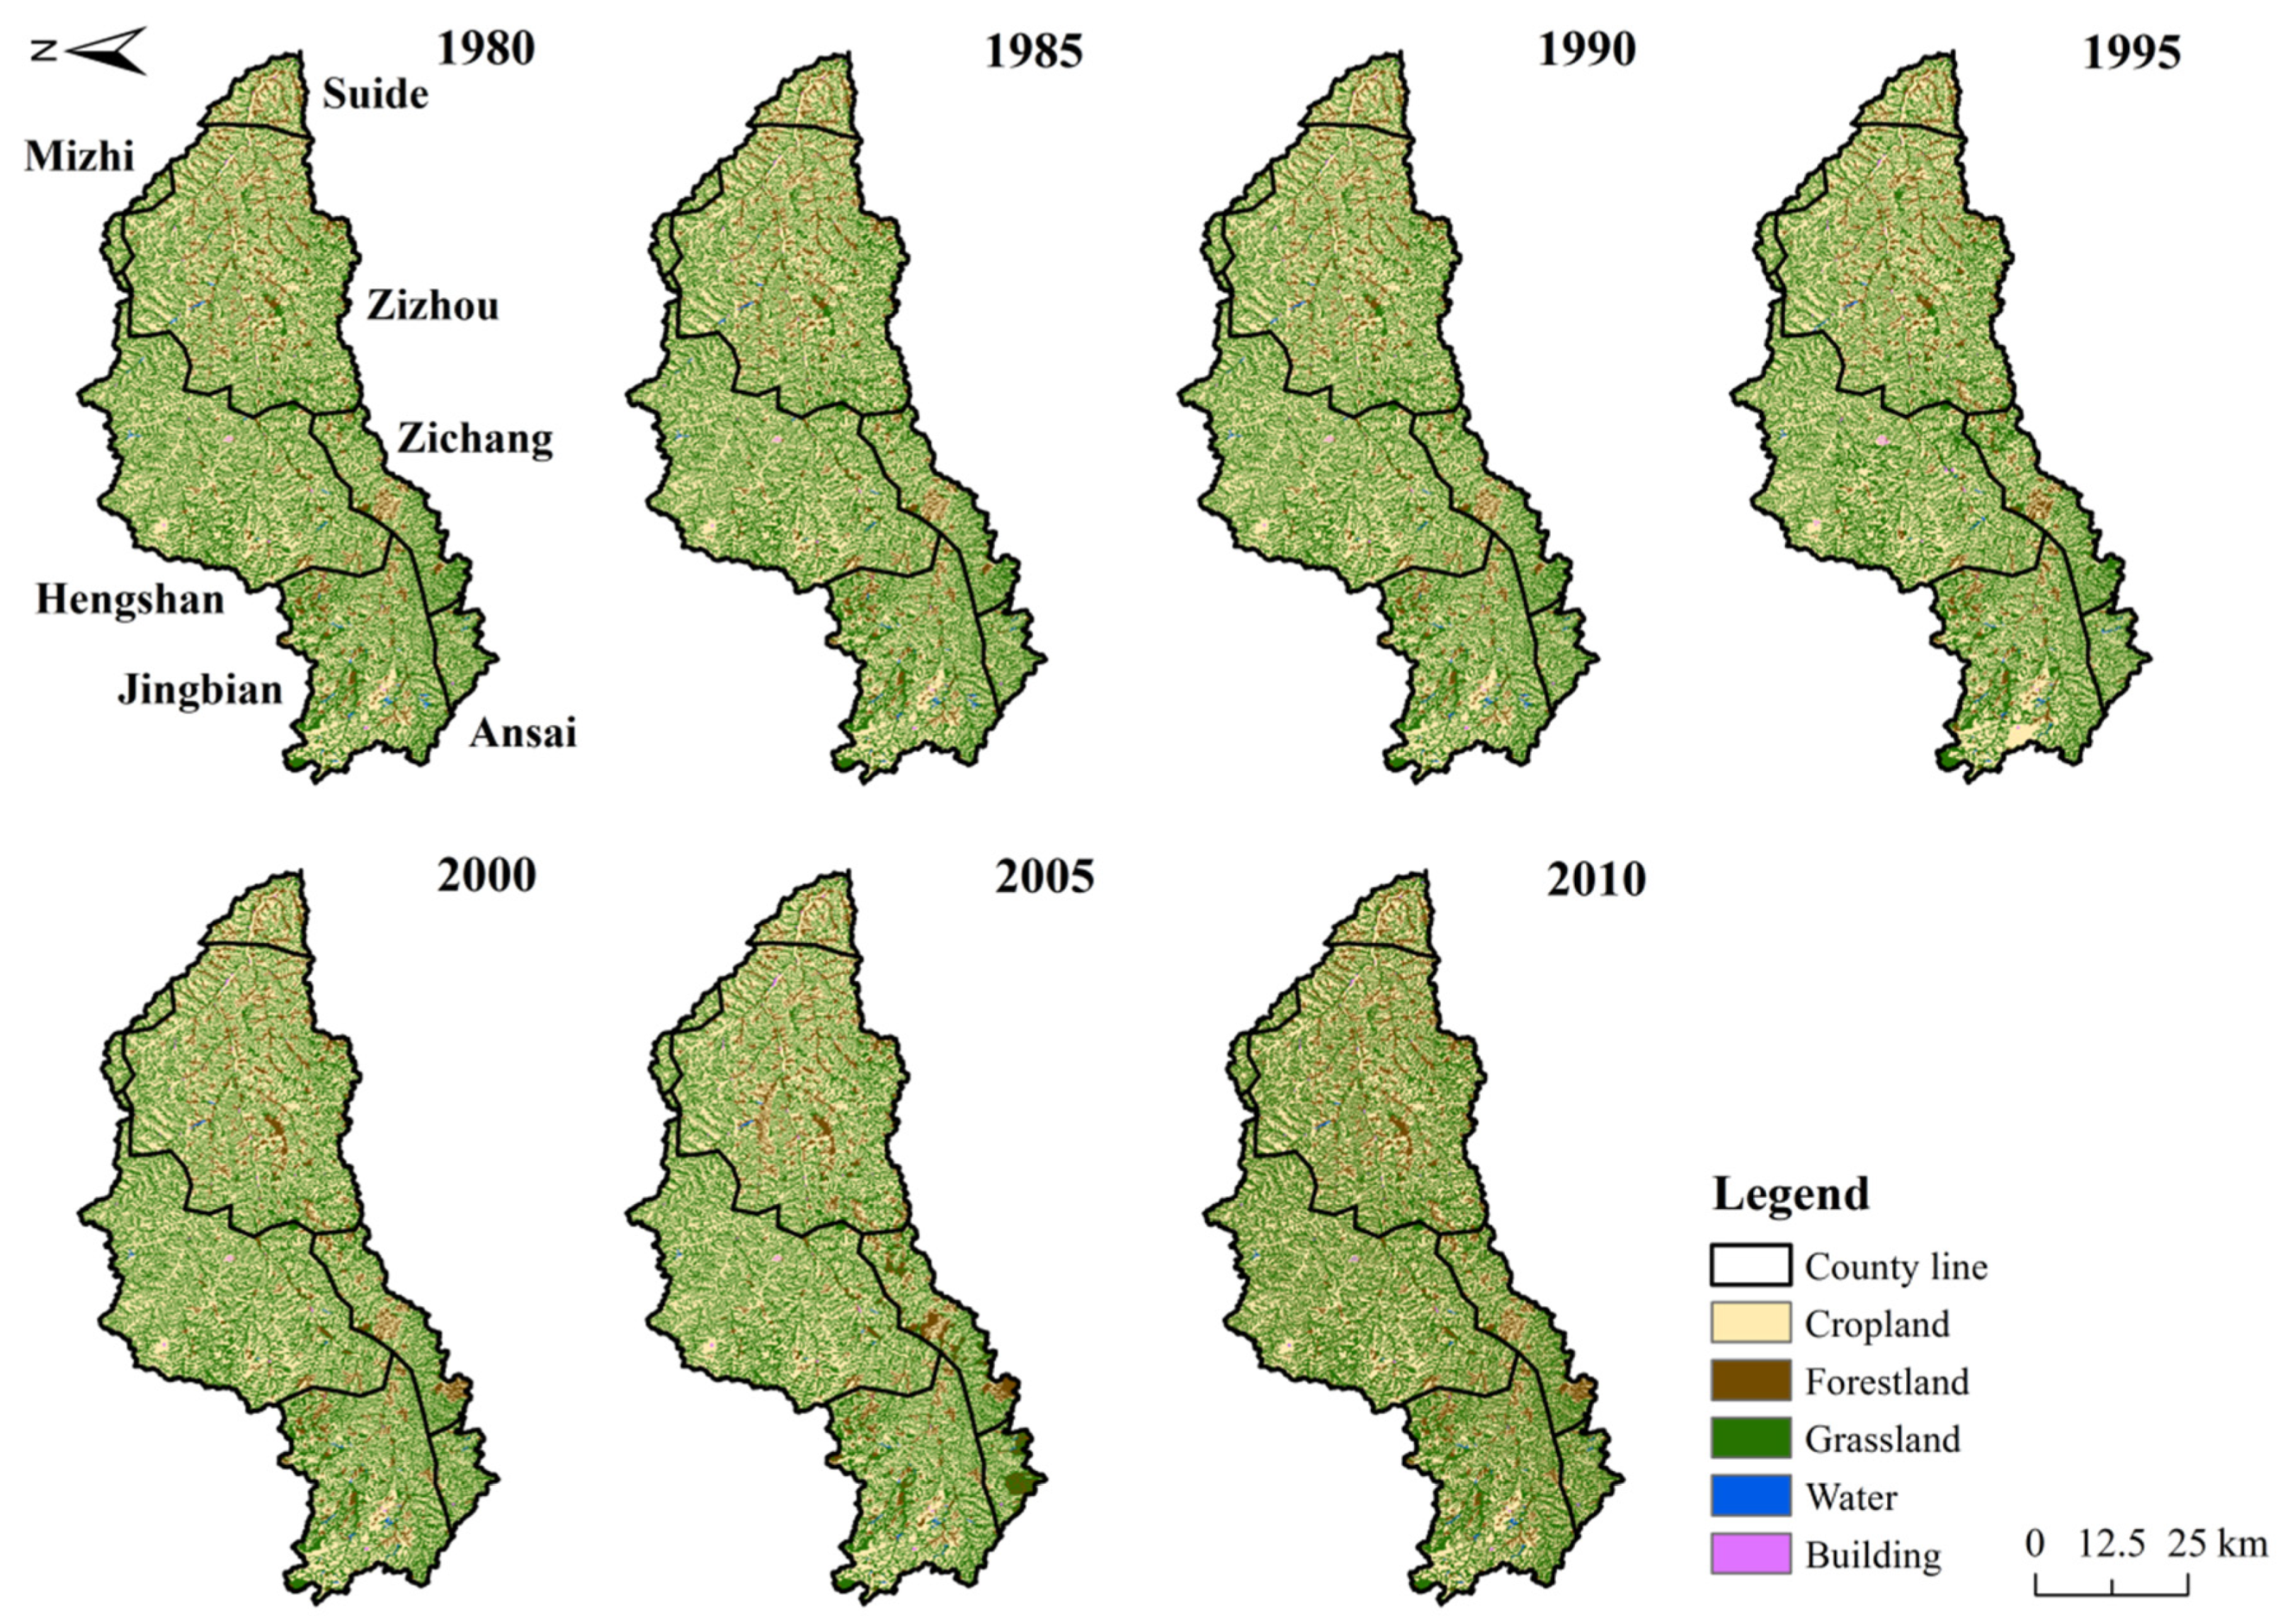
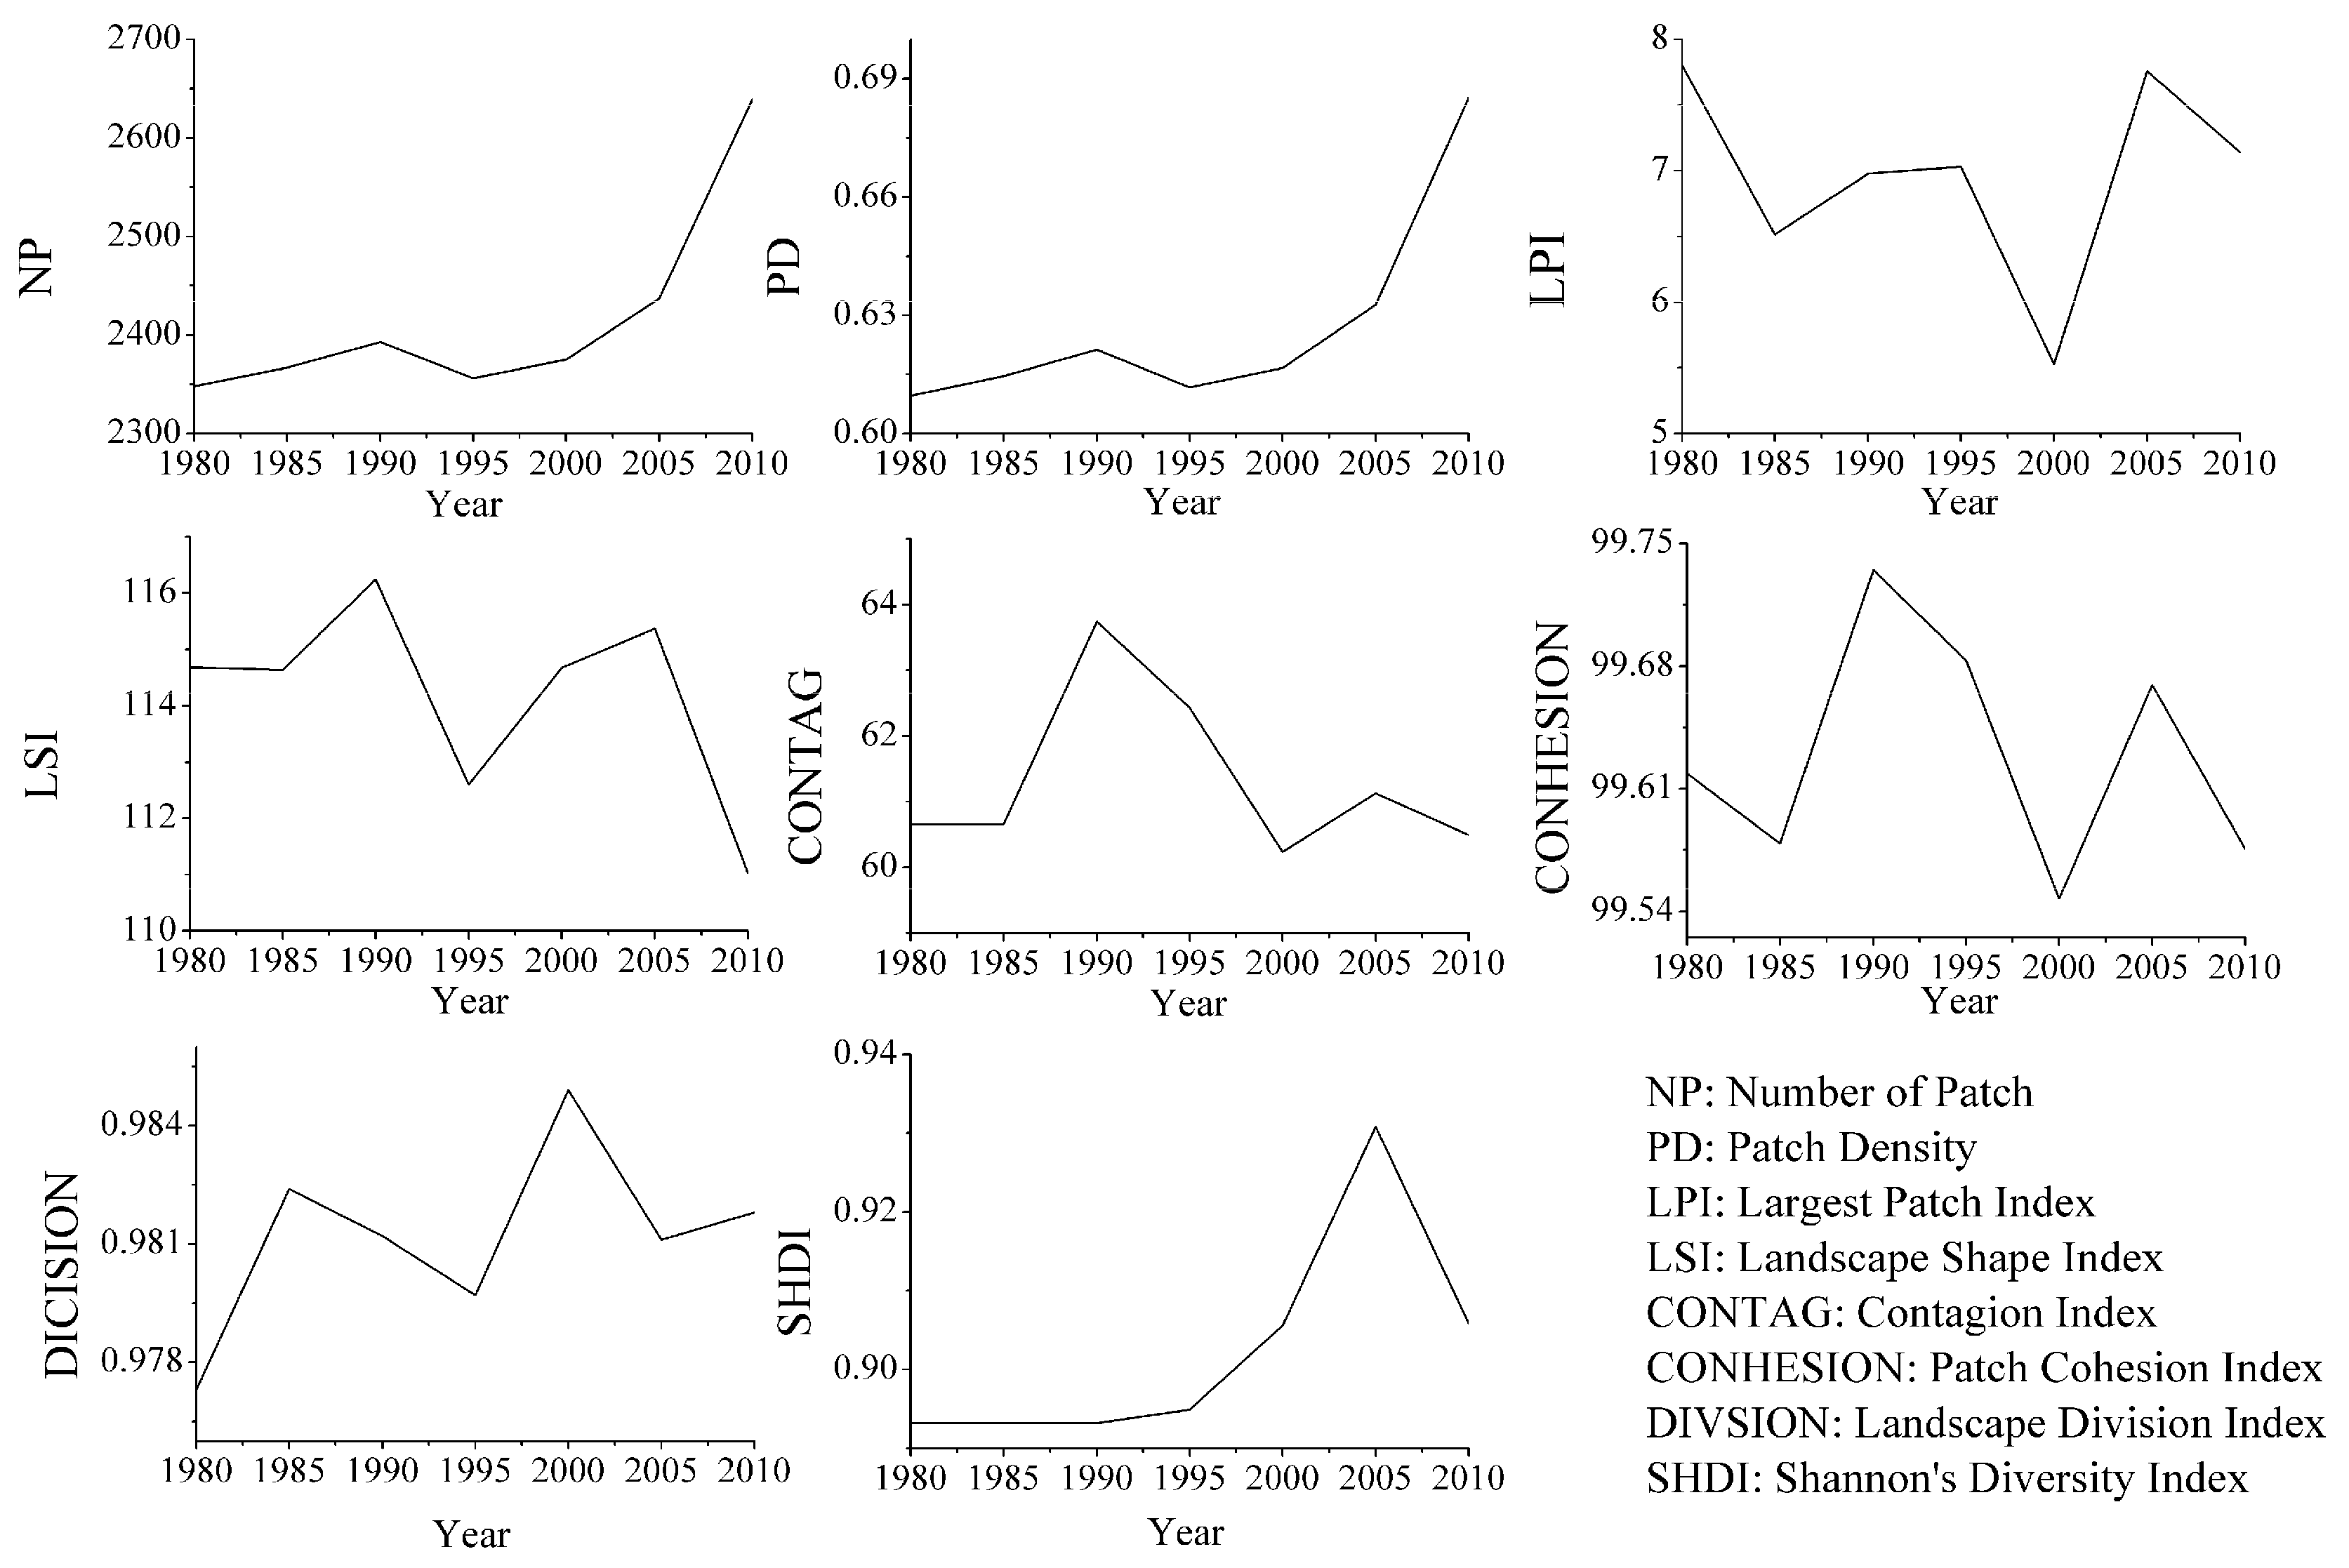
3.1. Changes of Land Uses and Landscape Pattern of the Watershed

The Dali River watershed has a controlled area of 3851.52 km2, and cropland and grassland are the main land use types (Figure 2). In 2010, the cropland area accounted for 53.07%, and the grassland area accounted for 39.79% (Figure 3). Forestland is an important land use type in the region, accounting for 6.85% of the area, and 0.15% of proportion the water area and construction land area. From 1980 to 2010, the area of cropland shows a trend of fluctuation and decline. In 1990, the cropland area was the largest, reaching 2046.62 km2, and it was smallest in 2005, only 2011.92 km2. During the 30 years, 6.70% of the cropland is converted to grassland (the grassland converted from cultivated land was evenly distributed in the watershed), and 0.93% of the cropland is converted to forestland (forestland converted from cropland was mainly in the western part of the watershed). The Grassland area shows a gradually declining trend, which is mainly related to the conversion of grassland into woodland. In particular, the policy of returning farmland to forest was carried out on the Loess Plateau in 1999. The areas of cropland and grassland decreased significantly, while the area of forestland increased significantly. The area of buildings in the watershed shows a trend of gradual growth, which is mainly due to the acceleration of urbanization with the development of economy, and the buildings mainly increased in the vicinity of cities (such as Zichang county, Zizhou county, Mizhi county and Suide county). The water area decreased year by year, from 8.12 km2 in 1980 to 5.80 km2 in 2010, a decrease of 28.57% in 30 years.
Landscape pattern metrics can quantitatively describe the change of landscape pattern, and the correlation between the pattern and the ecological process can be established by a using relevant landscape index [24]. During the six periods from 1980 to 2010, NP and PD in the Dali River watershed show an increasing trend year by year. NP increased from 2348 in 1980 to 2639 in 2010, and PD also increased from 0.609 in 1980 to 0.685 in 2010 (Figure 3). Especially after 2000, the inter-annual changes of NP and PD are more drastic, which is consistent with the implementation of returning cropland to forestland. A large number of cropland is converted into forestland, and more small patches appeared, increasing the number and density of patches in the watershed. SHDI in the watershed increased by 4.2% in 30 years, indicating that the proportion of each patch type in the watershed was more balanced (Figure 4). LPI and LSI generally show the change rule of decreasing first and then increasing. In 2000, these indexes decreased sharply, indicating that the degree of landscape fragmentation in the study area was intensified. CONTAG and COHESION increase first and then decrease, in 2000 to a minimum. DIVISION shows a trend of rising and fluctuation, indicating that landscape connectivity between the internal advantage patch decline and resistance of material and energy transfer processes in the system increase. In recent years (2005–2010), under the influence of human activities, LPI, LSI, CONTAG, COHESION, and SHDI in river basin presented a downward trend, leading to the development of regular and decentralized landscape types.

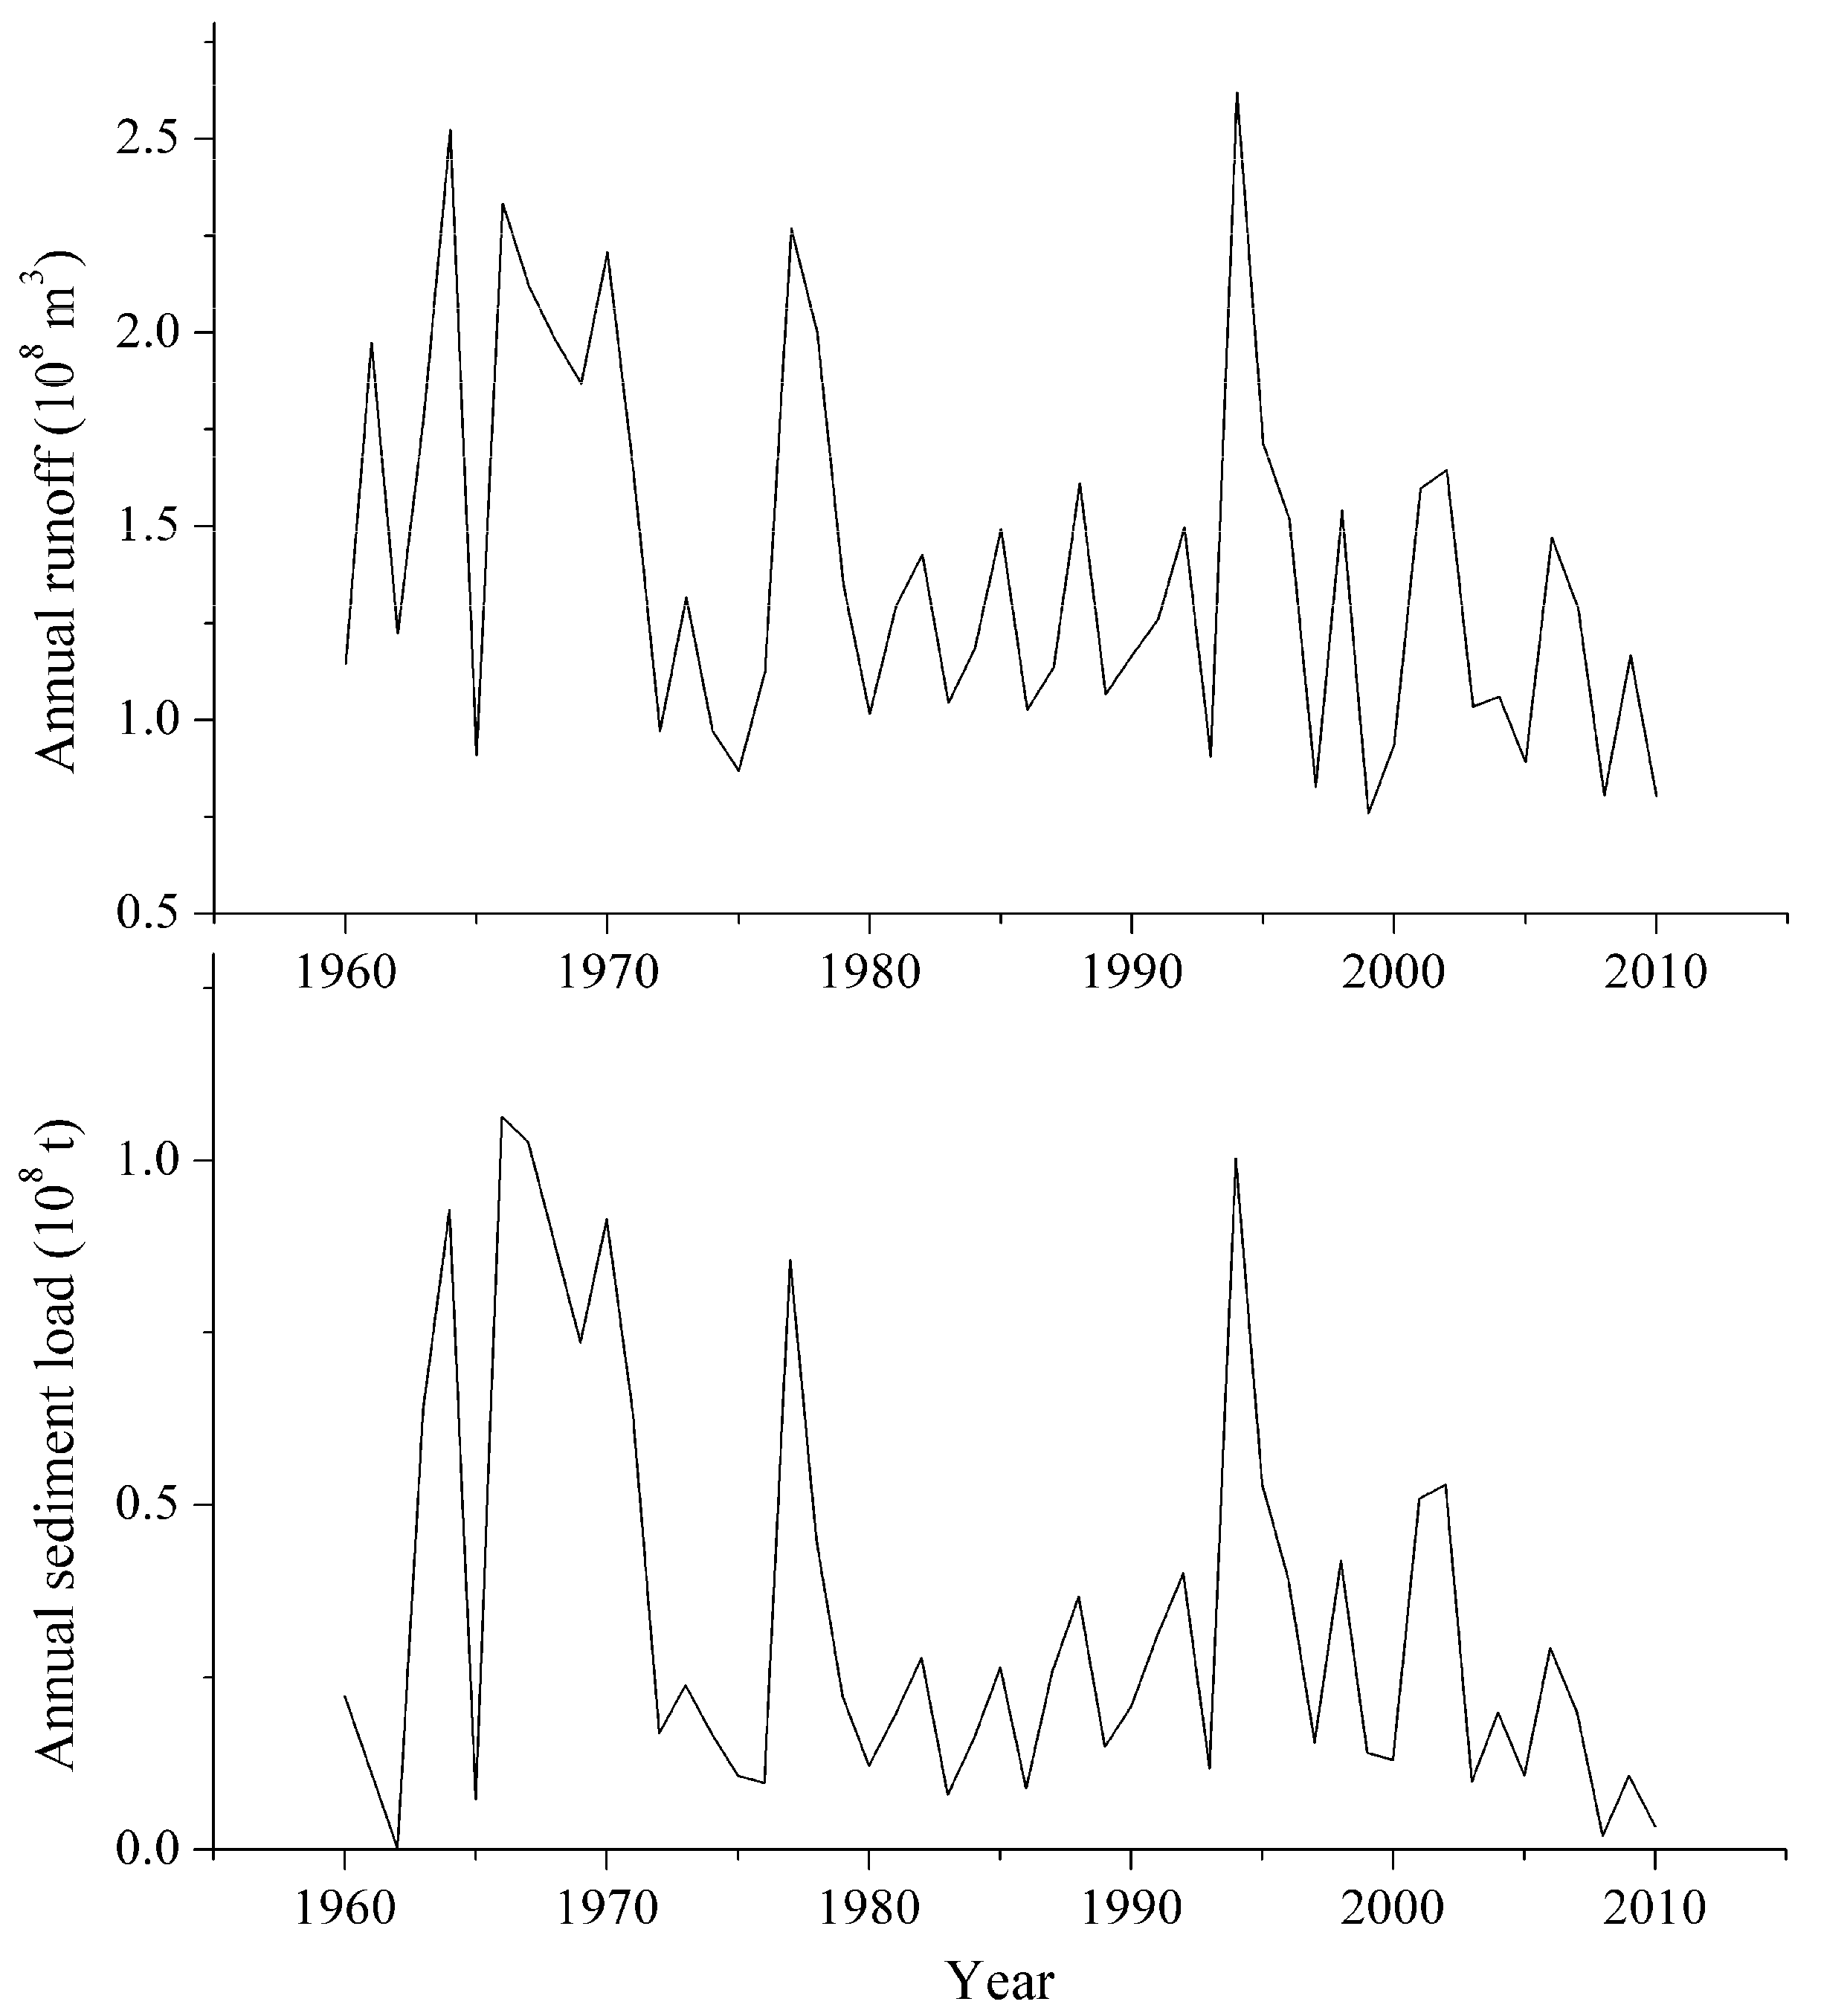
3.2. Changes of Runoff and Sediment in the Watershed

From the 1960s to 2010, the annual runoff and sediment transport in the watershed showed a trend of decreasing fluctuation, and the peak of runoff and the sediment load corresponded well (Figure 5). In 2010, the runoff in Dali River watershed was 8.04 × 10⁷ m3, which was 29.76% less than in 1960, and the annual runoff decreased by 681,500 m3. By 2010, the sediment load in Dali River watershed was 3.30 × 10⁶ t, which was 84.87% less than in 1960, and the annual sediment reduction reached 377,800 t.
Through correlation analysis, a power relationship between annual runoff and annual sediment transport in Dali River watershed is shown (sediment amount = 0.127 × Runoff2.49), and the correlation is significant (P < 0.01), with a correlation coefficient of 0.925 (Figure 6). The results are similar to the relationship between runoff and sediment in the other main tributaries of the Yellow River on the Loess Plateau in recent years. The annual runoff in the Dali River watershed in the 1980s and 1990s decreased by 30.2% and 21.8% respectively compared with that in the 1960s, while the sediment transport decreased by 65.9% and 36.9%, respectively. Since 1986, the measured runoff and sediment transport of the Yellow River have decreased significantly.

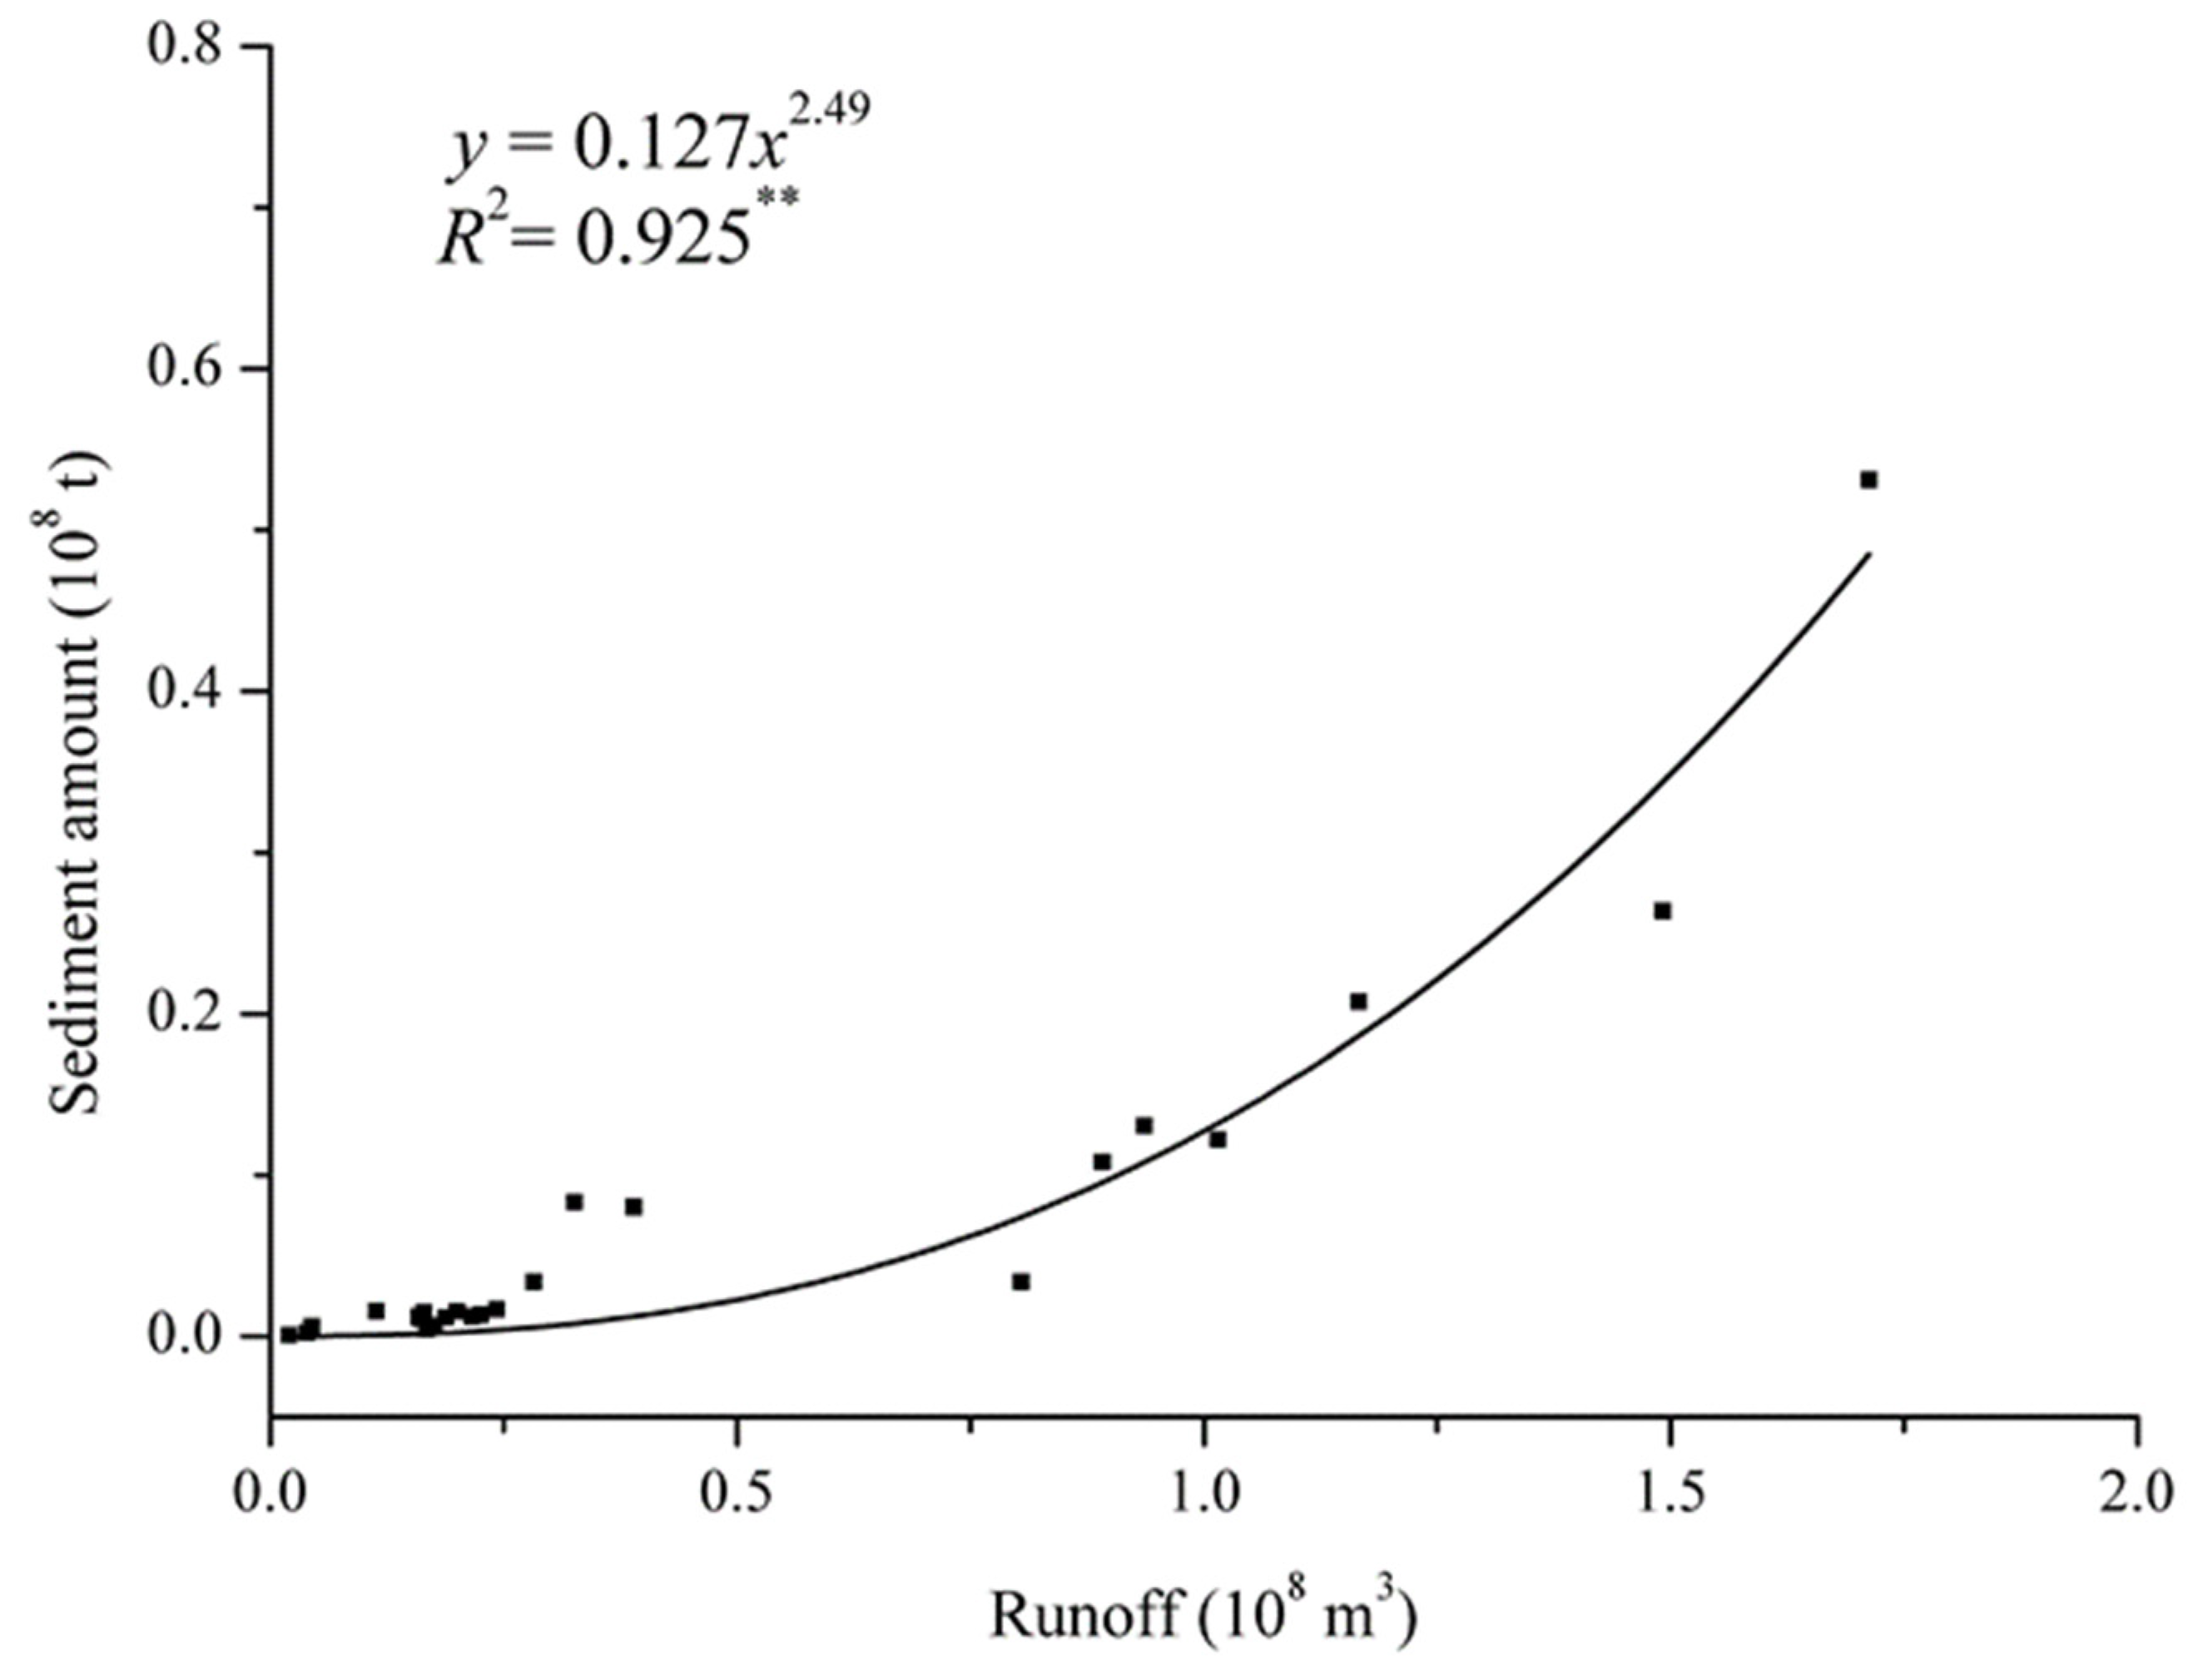
3.3. The Response Relationship Between Landscape Pattern Change and Runoff and Sediment

The landscape pattern index comprehensively reflects the spatial characteristics of the landscape. In this study, the Pearson correlation analysis and regression analysis are used to further study the impact of landscape pattern on runoff and sediment. It is found that NP, PD, LPI, LSI, COHESION, DIVISION, and SHDI have a negative correlation relationship with runoff and sediment transport, CONTAG presents a positive correlation with runoff and sediment (Table 2). PD, NP, SHDI, CONTAG, COHESION and DIVISION are closely related to runoff, with the correlation coefficient of −0.56, −0.55, −0.55, 0.42, −0.30, and −0.19, respectively, and the correlations are significant (P < 0.05). The correlation of PD, NP, SHDI, CONTAG, COHESION, DIVISION, and sediment are −0.53, −0.54, −0.43, −0.50, −0.41, and −0.20, respectively, and the correlations are significant (P < 0.05). The correlations between LPI and LSI with runoff and sediment are low and not significant (P > 0.05). The results of regression analysis and correlation analysis are similar, and NP, PD, CONTAG, COHESION, DIVISION, and SHDI have closer relations with runoff and sediment. The decision coefficient of NP, PD, CONTAG, COHESION, DIVISION and SHDI and the runoff are 0.489, 0.171, 0.422, 0.304, 0.186 and 0.555, respectively, and P values are less than 0.05. The decision coefficient of NP, PD, CONTAG, COHESION, DIVISION, SHDI, and sediment are 0.591, 0.536, 0.498, 0.407, 0.202, and 0.431, respectively, and P values are less than 0.05 (Table 3). Returning cropland to forest increases the number and density of patches in the watershed, which in turn increases the landscape’s ability to resist erosion. COHESION indicates the degree of spatial connection of adjacent plaque. As the dominant patch, the extensive distribution of woodland will reduce the connection degree of the erosion patch, thus reducing runoff and sediment. SHDI depends on the uniformity of the distribution of various types of patch, and the increase of this index reflects the enhancement of landscape heterogeneity, thus affecting runoff and sediment transport. The increase of DIVISION will strengthen the division of forestland and grassland on the landscape of erosion source of arable land, thus significantly reducing runoff and sediment. CONTAG is positively correlated with runoff and sediment, with the determination coefficients of 0.422 and 0.498, respectively. CONTAG reflects the aggregation degree of patch in the landscape. If a few large patches are dominant in the landscape and highly connected, the value is relatively large, indicating that the erosion chain action caused by large area concentration and distribution of erosion patch should be avoided in the process of soil erosion control.

4. Discussion

Land use and land cover on the Loess Plateau have gone through great changes in the last 30 years, especially in the influence of the policy of large-scale projects such as the Grain for Green [3]. The cropland in the Dali River watershed shows a declining trend, and the forestland obviously increased. With the development of urbanization, the building area increased gradually, showing that human activities and related ecological restoration measures play a vital role in the underlying surface change. Landscape pattern refers to the spatial distribution and combination of landscape elements, reflecting the change of land use under human influence [13]. The landscape pattern reflects the spatial heterogeneity of different patches. In order to find the potential meaningful order or rule from the seemingly disordered patch mosaic landscape, quantitative analysis can be conducted on the number, size, shape, spatial position, and relevant spatial characteristics of patches in the landscape by adopting landscape indexes and spatial statistics methods [25]. In this study, through calculating the landscape pattern index, it is found that the project of Grain for Green within the watershed has a significant impact on the spatial configuration of the landscape. The number and density of patches in the watershed increase significantly. Affected by human activities, national policy adjustment, and other factors, the land use type in the watershed is undergoing significant changes, especially the conversion of a large number of arable land into woodland, affecting the spatial mosaic structure of the landscape pattern, and further influencing the occurrence and development of ecological processes [26].
The interrelation between pattern and process is one of the core issues in landscape ecology research, and it is also the frontier area of current geography, ecology, soil, and water conservation research and other areas [27,28]. The landscape pattern is the result of the comprehensive action of human activities and natural evolution. The spatial distribution of landscape patterns can profoundly affect and change the ecological process [29]. Different landscape types affect the erosion process by changing the surface characteristics. Different surface landscape coverage has different effects on rainfall interception, absorption, and infiltration, directly affecting the runoff coefficient and sediment transport modulus [30]. The spatial configuration of different landscape types can significantly affect the process of runoff and sediment in the watershed. Under the influence of returning farmland to forest, a large number of connected erosion patches within the basin lead to the increase of patch density, landscape fragmentation degree, and landscape diversity [31]. The landscape connectivity decreases and thus directly affects the runoff erosion, sediment yield and sediment transport process of hydrological units in the watershed [32]. The NP, PD, DIVISION, COHESION, and SHDI index show significant negative correlations with runoff and sediment in the watershed. The results obtained in the study are similar to those obtained by others [33,34]. The enrichment of land use types, the intensification of fragmentation, and the weakened connectivity of erosion patches have an obvious interception effect on runoff and sediment. Therefore, in the process of soil and water loss control in the basin, it is necessary to avoid the concentration and continuous distribution of landscape with high sediment yield intensity (such as sloping farmland). Studies have shown that the forestland–grassland–farmland along the slope is a good landscape structure, which is conducive to reducing runoff erosion and achieving the effect of soil and water conservation [35].
The spatial configuration of the landscape pattern plays a critical role in determining the hydrological process. Regression analysis shows that NP, PD, LPI, LSI, COHESION, DIVISION, and SHDI have a negative response relationship with runoff and sediment, and CONTAG has a positive response relationship with runoff and sediment. The result of the regression analysis is consistent with the Pearson correlation analysis. These landscape pattern metrics are sensitive to landscape structure changes. These selected effective metrics can be used to indicate runoff and sediment discharge process. However, the determination coefficient (R2) of both landscape index and regression analysis is less than 0.6. There are many factors such as climate change [36], topographic parameters [37], and vegetation coverage [38], which are not considered, leading to the low regression coefficient of the landscape index and runoff and sediment. The weakness of this study is seldom considered the physical mechanism of the hydrological process. In future studies, a more comprehensive landscape pattern index can be designed to incorporate factors such as terrain, vegetation, and precipitation, so as to comprehensively reflect the spatial changes of landscape patterns and better couple with runoff and sediment. In addition, the regression analysis results of this study can serve as a reference of landscape index screening, the regression coefficient of runoff and NP, CONTAG, COHESION, DIVISION, and SHDI is higher, the regression coefficient of sediment and NP, PD, CONTAG, COHESION, DIVISION and SHDI is higher, which can better indicate the relationship between landscape pattern and runoff and sediment.

5. Conclusions

The large-scale conversion of farmland to forests on the Loess Plateau has a profound impact on the regional land use/land cover pattern. From 1980 to 2010, the area of cropland in Dali River watershed decreased by 134.29 km2, and 7.63% of cropland was converted into grassland and forestland. The change of land use type within the watershed significantly changes the distribution of landscape pattern. In the past 30 years, NP and PD in the Dali River watershed increased 291 and 0.076, respectively. SHDI in the watershed increased by 4.2% in 30 years. DIVISION was fluctuating and increasing. LPI and LSI decreased firstly and then increased, while CONTAG and COHESION showed opposite trends. The change of landscape pattern index indicates that due to the increasing influence of human activities on the watershed, landscape types tend to develop in the direction of uniform distribution of dominant patches and high aggregation. The landscape pattern has a profound impact on runoff and sediment generation and transport process. NP, PD, COHESION, and SHDI had a significant negative correlation with runoff (the correlation coefficients are −0.55, −0.56, −0.30, and −0.55, respectively). Similarly, NP, PD, COHESION, and SHDI are closely related to sediment, with the correlation coefficients of −0.54, −0.53, −0.41, and −0.43, respectively. Returning cropland to forest increases the number of woodland patches, leading to the increase of watershed landscape heterogeneity. Meanwhile, the extensive distribution of woodland landscape strengthens the segmentation of cultivated land and improves the blocking effect of landscape on runoff and sediment. The landscape contagion index is positively correlated with runoff and sediment, reflecting the concentrated distribution of dominant patches. In the process of soil and water conservation and treatment, the concentrated and contiguous layout of erosion patches should be avoided. In a word, after years of ecological construction in Dali River watershed, the regional soil erosion was significantly improved. In the process of soil erosion prevention and control in the future, it is necessary to further optimize the spatial configuration of landscape pattern, increase the density of forest and grass, avoid the concentrated distribution of landscape with high sediment yield intensity, and improve the diversity of landscape, so as to effectively block runoff and sediment transport.

Author Contributions

Conceptualization, Y.Y. and Y.Z.; Data curation, Z.B.; Formal analysis, Z.B. and X.Z.; Funding acquisition, Y.Z.; Investigation, Z.B. and X.Z.; Writing—original draft, Y.Z.; Writing—review & editing, Z.B. and X.Z. and Y.Y.

Funding

This research was funded by the National Natural Science Foundation of China (Grant No. 41601017), Young Talent fund of University Association for Science and Technology in Shaanxi, China (Grant No. 20190702), and Yang Yu received the young elite scientist sponsorship program by China Association for Science and Technology (2017 to 2019).

Acknowledgments

The authors would like to thank Lei Shi of The Rocket Force Characteristic Medical Center for investigation and Shutong Yang of Xi’an University of Technology for data gathering.

Conflicts of Interest

The authors declare no conflict of interest.

References

  1. Yu, Y.; Wei, W.; Chen, L.; Feng, T.; Daryanto, S. Quantifying the effects of precipitation, vegetation, and land preparation techniques on runoff and soil erosion in a Loess watershed of China. Sci. Total Environ. 2019, 652, 755–764. [Google Scholar] [CrossRef] [PubMed]
  2. Shi, P.; Zhang, Y.; Ren, Z.; Yu, Y.; Li, P.; Gong, J. Land-use changes and check dams reducing runoff and sediment yield on the Loess Plateau of China. Sci. Total Environ. 2019, 664, 984–994. [Google Scholar] [CrossRef] [PubMed]
  3. Fu, B.; Wang, S.; Liu, Y.; Liu, J.; Liang, W.; Miao, C. Hydrogeomorphic ecosystem responses to natural and anthropogenic changes in the Loess Plateau of China. Annu. Rev. Earth Planet. Sci. 2017, 45, 223–243. [Google Scholar] [CrossRef]
  4. Chen, Y.; Wang, K.; Lin, Y.; Shi, W.; Song, Y.; He, X. Balancing green and grain trade. Nat. Geosci. 2015, 8, 739. [Google Scholar] [CrossRef]
  5. Zhao, G.; Mu, X.; Wen, Z.; Wang, F.; Gao, F. Soil erosion, conservation, and eco-environment changes in the Loess Plateau, China. Land Degrad. Dev. 2013, 24, 333–343. [Google Scholar] [CrossRef]
  6. Yu, Y.; Wei, W.; Chen, L.; Feng, T.; Daryanto, S.; Wang, L. Land preparation and vegetation type jointly determine soil conditions after long-term land stabilization measures in a typical hilly catchment, Loess Plateau of China. J. Soils Sediments 2017, 17, 144–156. [Google Scholar] [CrossRef]
  7. Shi, P.; Zhang, Y.; Zhang, Y.; Yu, Y.; Li, P.; Li, Z.; Xiao, L.; Xu, G.; Zhu, T. Land-use types and slope topography affect the soil labile carbon fractions in the Loess hilly-gully area of Shaanxi, China. Arch. Agron. Soil Sci. 2019. [Google Scholar] [CrossRef]
  8. Yu, Y.; Wei, W.; Chen, L.; Jia, F.; Yang, L.; Zhang, H.; Feng, T. Responses of vertical soil moisture to rainfall pulses and land uses in a typical loess hilly area, China. Solid Earth 2015, 6, 595–608. [Google Scholar] [CrossRef]
  9. Shi, P.; Qin, Y.; Liu, Q.; Zhu, T.; Li, Z.; Li, P.; Ren, Z.; Liu, Y.; Wang, F. Soil respiration and response of carbon source changes to vegetation restoration in the Loess Plateau, China. Sci. Total Environ. 2019. [Google Scholar] [CrossRef]
  10. Cao, Z.; Li, Y.; Liu, Y.; Chen, Y.; Wang, Y. When and where did the Loess Plateau turn “green”? Analysis of the tendency and breakpoints of the normalized difference vegetation index. Land Degrad. Dev. 2018, 29, 162–175. [Google Scholar] [CrossRef]
  11. Feng, X.; Sun, G.; Fu, B.; Su, C.; Liu, Y.; Lamparski, H. Regional effects of vegetation restoration on water yield across the Loess Plateau, China. Hydrol. Earth Syst. Sci. 2012, 16, 2617–2628. [Google Scholar] [CrossRef]
  12. Feng, X.; Fu, B.; Piao, S.; Wang, S.; Ciais, P.; Zeng, Z.; Lü, Y.; Zeng, Y.; Li, Y.; Jiang, X.; et al. Revegetation in China’s Loess Plateau is approaching sustainable water resource limits. Nat. Clim. Chang. 2016, 6, 1019–1022. [Google Scholar] [CrossRef]
  13. Shi, P.; Zhang, Y.; Li, Z.; Li, P.; Xu, G. Influence of land use and land cover patterns on seasonal water quality at multi-spatial scales. Catena 2017, 151, 182–190. [Google Scholar] [CrossRef]
  14. Chen, L.; Sun, R.; Lu, Y. A conceptual model for a process-oriented landscape pattern analysis. Sci. China Earth Sci. 2019. [Google Scholar] [CrossRef]
  15. Guerra, C.A.; Metzger, M.J.; Maes, J.; Pinto-Correia, T. Policy impacts on regulating ecosystem services: Looking at the implications of 60 years of landscape change on soil erosion prevention in a Mediterranean silvo-pastoral system. Landsc. Ecol. 2016, 31, 271–290. [Google Scholar] [CrossRef]
  16. Ouyang, W.; Skidmore, A.K.; Hao, F.H.; Wang, T. Soil erosion dynamics response to landscape pattern. Sci. Total Environ. 2010, 408, 1358–1366. [Google Scholar] [CrossRef]
  17. Bakker, M.M.; Govers, G.; van Doorn, A.; Quetier, F.; Chouvardas, D.; Rounsevell, M. The response of soil erosion and sediment export to land-use change in four areas of Europe: The importance of landscape pattern. Geomorphology 2008, 98, 213–226. [Google Scholar] [CrossRef]
  18. Shi, P.; Zhang, Y.; Song, J.; Li, P.; Wang, Y.; Zhang, X.; Li, Z.; Bi, Z.; Zhang, X.; Qin, Y.; et al. Response of nitrogen pollution in surface water to land use and social-economic factors in the Weihe River watershed, northwest China. Sustain. Cities Soc. 2019, 50, 101658. [Google Scholar] [CrossRef]
  19. Sun, R.; Cheng, X.; Chen, L. A precipitation-weighted landscape structure model to predict potential pollution contributions at watershed scales. Landsc. Ecol. 2018, 33, 1603–1616. [Google Scholar] [CrossRef]
  20. Imeson, A.C.; Prinsen, H.A.M. Vegetation patterns as biological indicators for identifying runoff and sediment source and sink areas for semi-arid landscapes in Spain. Agric. Ecosyst. Environ. 2004, 104, 333–342. [Google Scholar] [CrossRef]
  21. Shi, P.; Zhang, Y.; Li, P.; Li, Z.; Yu, K.; Ren, Z.; Xu, G.; Cheng, S.; Wang, F.; Ma, Y. Distribution of soil organic carbon impacted by land-use changes in a hilly watershed of the Loess Plateau, China. Sci. Total Environ. 2019, 652, 505–512. [Google Scholar] [CrossRef] [PubMed]
  22. Yan, C.Z.; Wang, T.; Han, Z.W.; Qie, Y.F. Surveying sandy deserts and desertified lands in north-western China by remote sensing. Int. J. Remote Sens. 2007, 28, 3603–3618. [Google Scholar] [CrossRef]
  23. Bailey, D.; Billeter, R.; Aviron, S.; Schweiger, O.; Herzog, F. The influence of thematic resolution on metric selection for biodiversity monitoring in agricultural landscapes. Landsc. Ecol. 2007, 22, 461–473. [Google Scholar] [CrossRef]
  24. Harbin, L.; Wu, J.G. Use and misuse of landscape indices. Landsc. Ecol. 2004, 19, 389–399. [Google Scholar]
  25. Wei, W.; Chen, L.; Zhang, H.; Chen, J. Effect of rainfall variation and landscape change on runoff and sediment yield from a loess hilly catchment in China. Environ. Earth Sci. 2015, 73, 1005–1016. [Google Scholar] [CrossRef]
  26. Chen, H.; Marter-Kenyon, J.; López-Carr, D.; Liang, X. Land cover and landscape changes in Shaanxi Province during China’s Grain for Green Program (2000–2010). Environ. Monit. Assess. 2015, 187, 644. [Google Scholar] [CrossRef]
  27. Wu, J.; Hobbs, R. Key issues and research priorities in landscape ecology: An idiosyncratic synthesis. Landsc. Ecol. 2002, 17, 355–365. [Google Scholar] [CrossRef]
  28. Shi, Z.; Ai, L.; Li, X.; Huang, X.; Wu, G.; Liao, W. Partial least-squares regression for linking land-cover patterns to soil erosion and sediment yield in watersheds. J. Hydrol. 2013, 498, 165–176. [Google Scholar] [CrossRef]
  29. Fu, B.; Liang, D.; Lu, N. Landscape ecology: Coupling of pattern, process, and scale. Chinese Geogr. Sci. 2011, 21, 385. [Google Scholar] [CrossRef]
  30. Yang, M.; Li, X.; Hu, Y.; He, X. Assessing effects of landscape pattern on sediment yield using sediment delivery distributed model and a landscape indicator. Ecol. Indic. 2012, 22, 38–52. [Google Scholar] [CrossRef]
  31. Zhang, S.; Fan, W.; Li, Y.; Yi, Y. The influence of changes in land use and landscape patterns on soil erosion in a watershed. Sci. Total Environ. 2017, 574, 34–45. [Google Scholar] [CrossRef] [PubMed]
  32. Marchamalo, M.; Hooke, J.M.; Sandercock, P.J. Flow and sediment connectivity in semi-arid landscapes in SE Spain: Patterns and controls. Land Degrad. Dev. 2016, 27, 1032–1044. [Google Scholar] [CrossRef]
  33. Yang, Y.; Li, Z.; Li, P.; Ren, Z.; Gao, H.; Wang, T.; Xu, G.; Yu, K.; Shi, P.; Tang, S. Variations in runoff and sediment in watersheds in loess regions with different geomorphologies and their response to landscape patterns. Environ. Earth Sci. 2017, 76, 517. [Google Scholar] [CrossRef]
  34. Zhou, Z.; Li, J. The correlation analysis on the landscape pattern index and hydrological processes in the Yanhe watershed, China. J. Hydrol. 2015, 524, 417–426. [Google Scholar] [CrossRef]
  35. Fu, B.; Wang, Y.; Lu, Y.; He, C.; Chen, L.; Song, C. The effects of land-use combinations on soil erosion: A case study in the Loess Plateau of China. Prog. Phys. Geogr. 2009, 33, 793–804. [Google Scholar] [CrossRef]
  36. Zhang, X.; Nearing, M.A. Impact of climate change on soil erosion, runoff, and wheat productivity in central Oklahoma. Catena 2005, 61, 185–195. [Google Scholar] [CrossRef]
  37. Sun, W.; Shao, Q.; Liu, J.; Zhai, J. Assessing the effects of land use and topography on soil erosion on the Loess Plateau in China. Catena 2014, 121, 151–163. [Google Scholar] [CrossRef]
  38. Zhou, P.; Luukkanen, O.; Tokola, T.; Nieminen, J. Effect of vegetation cover on soil erosion in a mountainous watershed. Catena 2008, 75, 319–325. [Google Scholar] [CrossRef]
Figure 1. The location of Dali River watershed (gray area) on the Loess Plateau.
Land 08 00180 g001
Figure 2. The land uses of Dali River watershed in 1980, 1985, 1990, 1995, 2000, 2005, and 2010.
Land 08 00180 g002
Figure 3. The percentages of different land use types of Dali River watershed in 1980, 1985, 1990, 1995, 2000, 2005, and 2010.
Land 08 00180 g003
Figure 4. The landscape pattern metrics of Dali River watershed in 1980, 1985, 1990, 1995, 2000, 2005 and, 2010.
Land 08 00180 g004
Figure 5. The runoff and sediment in the Dali River from 1960 to 2010.
Land 08 00180 g005
Figure 6. The relationship between runoff and sediment. x is the runoff and y is the sediment amount. R2 is the correlation coefficient. ** means the correlation was significant at the 0.01 level.
Land 08 00180 g006
Table 1. Descriptions of landscape pattern metrics.
Landscape Pattern MetricsAbbreviationDescription
Number of PatchNPThe number of the patch
Patch DensityPDPatch Density is the number of corresponding patches divided by the total landscape area
Largest Patch IndexLPIThe area of the largest patch of the corresponding patch type divided by the total landscape area
Landscape Shape IndexLSIThe area of the largest patch of the corresponding patch type divided by the total landscape area
Contagion IndexCONTAGExtent to which patch types are aggregated or clumped as a percentage of the maximum possible
Patch Cohesion IndexCONHESIONThe physical connectedness of the corresponding patch type, which is an area-weighted mean perimeter-area ratio
Landscape Division IndexDIVSIONReflect the degree of fragmentation of the landscape
Shannon’s Diversity IndexSHDIThe number of different patch types and the proportional area distribution among patch types
Table 2. The relationship between runoff and sediment with landscape pattern metrics.
NPPDLPILSICONTAGCOHESIONDIVISIONSHDI
Runoff−0.55 **−0.56 **−0.12−0.020.42 **−0.30 *−0.19 *−0.55 **
Sediment−0.54 **−0.53 **−0.10−0.080.50 **−0.41 **−0.20 *−0.43 **
* Significant at 0.05 level, ** Significant at 0.01 level.
Table 3. Regression analysis of runoff and sediment with landscape pattern metrics.
Dependent VariablesIndependent VariablesLandscape Pattern MetricsRegression R2P
Runoffx1NPy = −48.326x1 + 2.9080.4890.007
x2PDy = −7.048x2 + 0.5670.1710.052
x3LPIy = −0.051x3 + 1.5030.0140.114
x4LSIy = −0.005x4 + 1.6790.0250.205
x5CONTAGy = 0.111x5-5.6630.4220.008
x6COHESIONy = −1.503x6-148.6190.3040.013
x7DIVISIONy = −26.743x7 + 27.3850.1860.036
x8SHDIy = −13.596x8 + 13.4140.5550.006
Sedimentx1NPy = −20.241x1 + 1.4350.5910.005
x2PDy = −3.298x2 + 2.2680.5360.006
x3LPIy = −0.02x3 + 0.3410.0970.184
x4LSIy = −0.007x4 + 1.0260.0780.147
x5CONTAGy = 0.064x5 − 3.6960.4980.007
x6COHESION = −0.975x6 − 96.9890.4070.008
x7DIVISIONy = −14.073x7 + 14.0080.2020.033
x8SHDI y = −5.115x8 + 4.8150.4310.008

