Abstract
Companies and governmental agencies are increasingly seeking ways to explore emerging trends and issues that have the potential to shape up their future operational environments. This paper exploits text mining techniques for investigating future signals of the land administration sector. After a careful review of previous literature on the detection of future signals through text mining, we propose the use of topic models to enhance the interpretation of future signals. Findings of the study highlight the large spectrum of issues related to land interests and their recording, as nineteen future signal topics ranging from climate change mitigation and the use of satellite imagery for data collection to flexible standardization and participatory land consolidations are identified. Our analysis also shows that distinguishing weak signals from latent, well-known, and strong signals is challenging when using a predominantly automated process. Overall, this study summarizes the current discourses of the land administration domain and gives an indication of which topics are gaining momentum at present.
1. Introduction
Providing tools to support land tenure, land value, land use planning, and land development [], land administration is fundamental for a nation’s economic and social development, e.g., []. Beyond dispute, the meaning and role of land in society and to people have changed through time []. The changing people-to-land relationship has led to matching changes in the function of cadastral systems—the core building block of a land administration system []—as the historical development of cadastral systems demonstrates []. Therefore, for the cadastral systems to be addressing the right kind of needs in the future as well, it is essential to pay attention to emerging issues and drivers of change [,].
Horizon scanning is one way to increase the understanding of future challenges and opportunities. Horizon scanning, in general, has two functions. The alerting function assists decision-makers in anticipating emerging issues earlier and with higher precision, whereas the creative function activates the creation of new emerging issues []. Futurologists often use terms such as weak signals, emerging issues, wild cards, trends, and megatrends in connection with horizon scanning. The terminology might be confusing since there are many definitions for these terms, as well as a critique towards others’ definitions. Sometimes it might be easier to approach the definitions from a negative point of view: we can define what a concept is not or how it differs from another concept []. Besides the terminology, the methods of horizon scanning have also been a matter of debate. Some scholars support the use of participatory methods like interviews, Delphi questionnaires, or workshops, while others prefer relying on non-participatory and (semi-)automated methods such as search engines and text mining [,]. Ultimately, as Amanatidou et al. [] point out, the selection of a scanning method is subject to contextual and content issues.
Regardless of the chosen method for signal detection, it is worthwhile to pay attention to future signals other than megatrends as well. If the visionary work depends solely on megatrends, there is a high risk that the future is perceived too unanimously []. Further, perceiving the past, present, and future environment of a specific domain helps to limit the anticipation work to relevant issues. As the amount of textual data is continuously increasing, exploring the possibilities of text mining techniques becomes more and more topical in this context as well. Automated methods for trend or signal detection have been utilized, for instance, in the context of solar cells [], school bullying [], and artificial intelligence []. The diverse application contexts highlight the wide usability of text mining techniques—the only prerequisite is the availability of a large (and well-organized) textual data of the topic of interest.
Therefore, the aim of this study is to identify future signals of the land administration domain by using text mining tools. Additionally, the study aims to test adding a semantic element to a text mining-based future signal detection process, so that groups of terms instead of individual terms are identified as future signals to reduce the ambiguity and abstraction of signal interpretation. We use abstracts of scientific articles as a study material and showcase that through a semi-automated signal detection process, many plausible future signal topics can be identified. The topics range from technology-oriented to environmental and social topics. Hence, the findings of the study emphasize how land administration and its core, the cadastral system, should be understood in a holistic manner, not just as a system of registers.
This article from now on is organized as follows. Section 2 elaborates on the concept of future signals, first from a theoretical perspective and then from a text mining perspective. Section 3 presents overview of the research process, the text mining tools used in the analysis, as well as a summary of the data collection. Section 4 presents the results of the text mining exercise. Finally, Section 5 discusses the findings, and in Section 6, some concluding remarks are made.
2. Future Signal Detection
In this section, we review the literature on future signals. The focus lies on weak signals because, theoretically, other future signal types can be understood through it—either the signal is even weaker than a weak signal (a latent signal), or the weak signal has intensified into a well-known or a strong signal. Section 2.2. continues with a review of how the future signal detection has been approached in text mining applications.
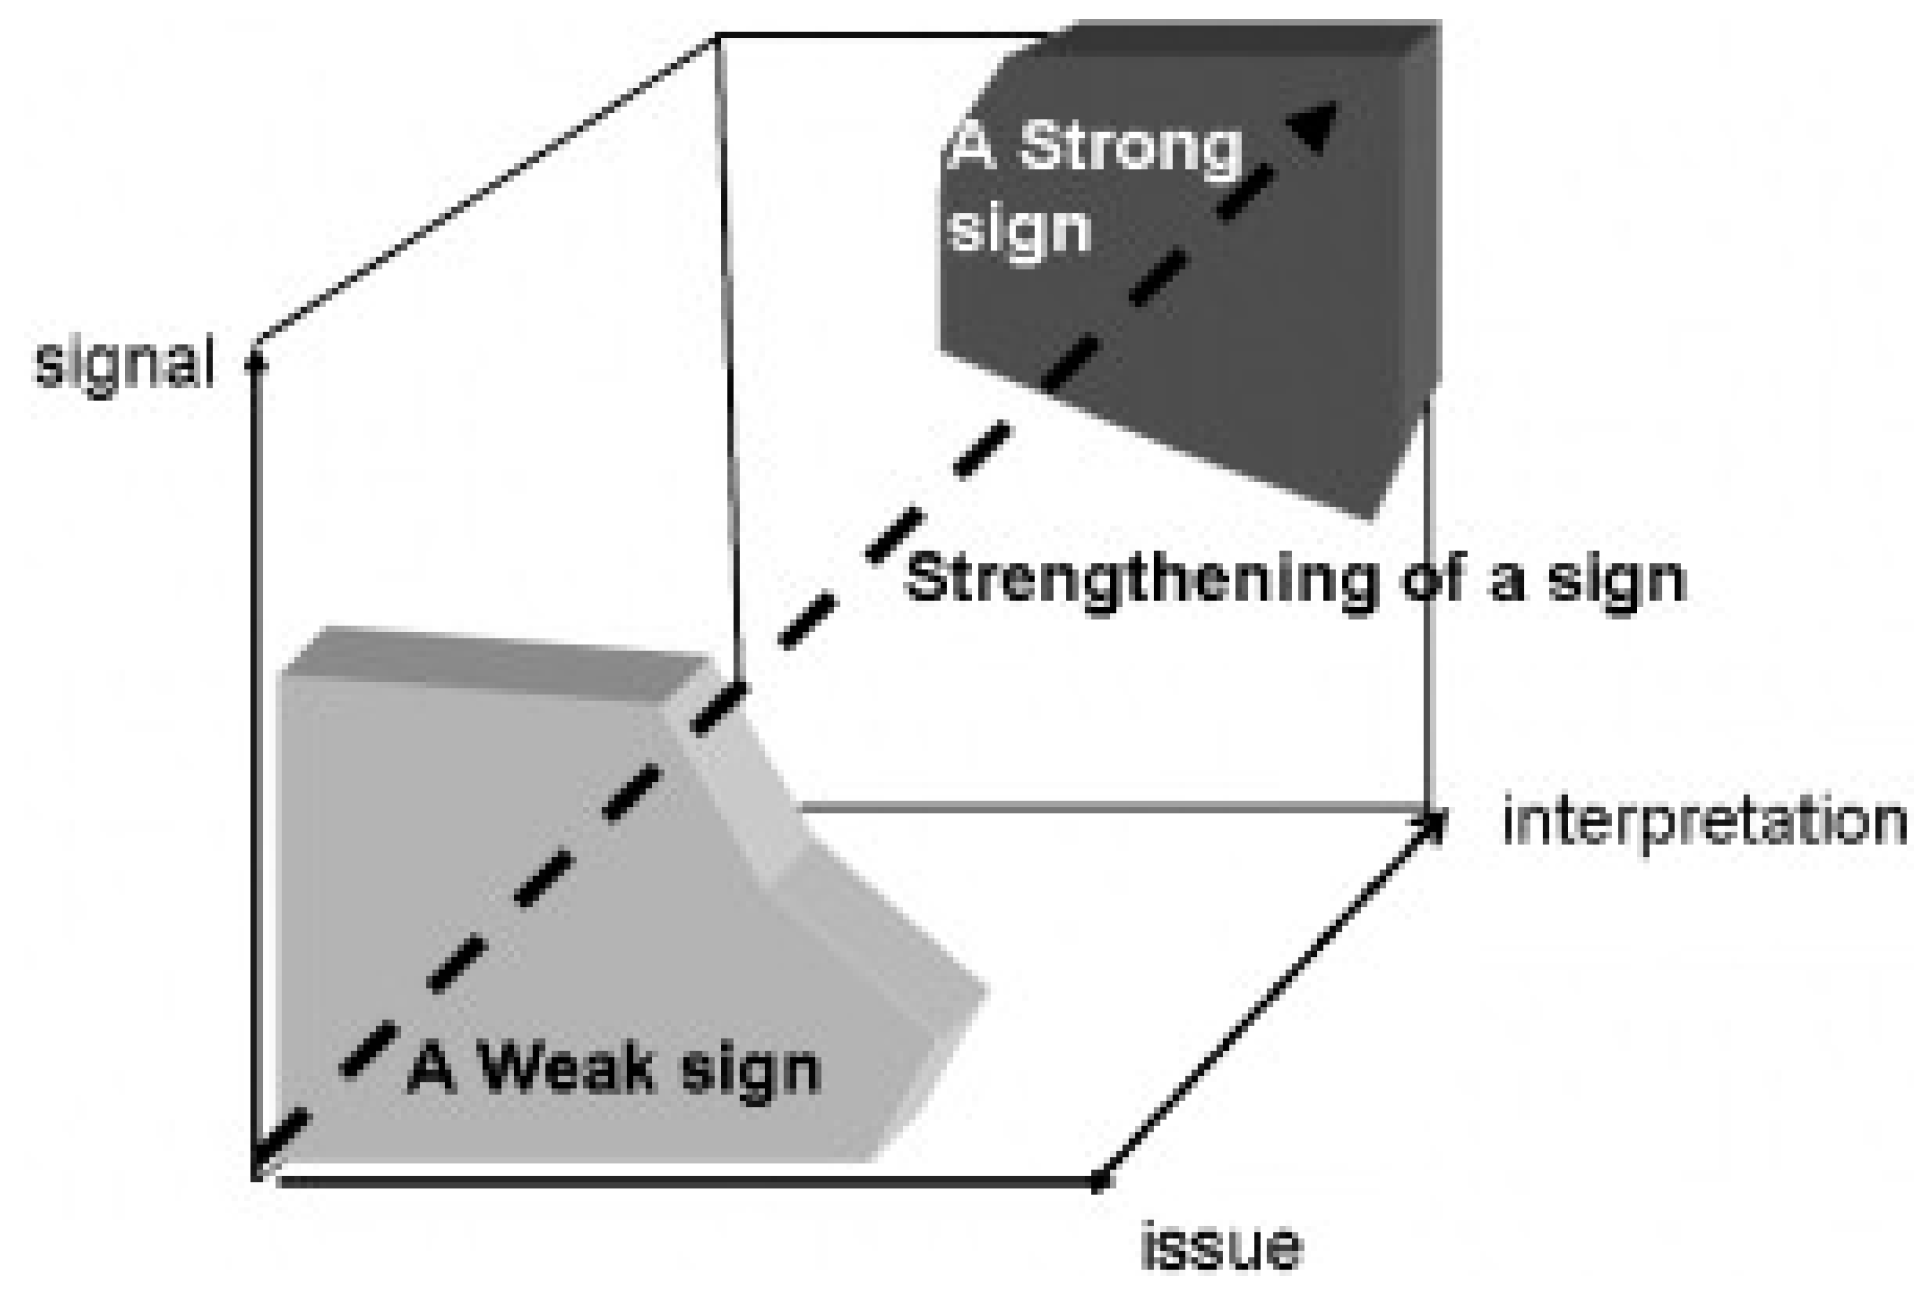
2.1. Weak Signals in Futures Studies
First, we elaborate the concept of weak signal more closely—what are its characteristics and relations to other future issues such as trends. Also, other issues such as wild cards are briefly discussed. The terminology used is broad; thus, we should define how to approach weak signals in this article. We use the definitions of Hiltunen (2010), although there are various futurologists discussing the definitions []. According to her, weak signals are the first signs of new, emerging issues but with significantly low visibility. It is important to emphasize that weak signals are not visions but represent existing issues.
The literature recognizes several other definitions for weak signals, of which the earliest one was introduced by Ansoff in the 1970s []. The difficulty with the weak signals is that there is a variety of definitions for the concept, and there are debates going on within the future studies whether a weak signal is a concept of its own or is it a synonym for emerging issues or early warning sign []. In previous literature, weak signals and wild cards are sometimes used as synonyms [,]. Kuosa (2005) identifies weak signals to be among the vaguest signs of future development, which can be either totally surprising or giving some hint of future change []. Kuusi et al. (2000) identify weak signals as an early warning of a change []. The signal strengthens when combined with other signals. This interpretation of the behavior of weak signals is in line with Kuosa (2005), who characterizes weak signals to be parts of a jigsaw puzzle building a holistic view on future changes []. Petersen et al. (2009) define weak signals as an indicator of the emergence of a wild card [].
The characteristics of weak signals can be approached from six aspects []. These aspects describe weak signals as phenomena of transition, the duration of a weak signal, its objectivity and subjectivity, various ways of interpretations of the same signal by the observer, strengthening of the signal, and issues related to the receiver and analyst of the signal. What is important to notice, also emphasized by Kuusi et al. (2000) is that a weak signal does not need the interpreter to exist; it is a phenomenon itself []. However, as Hiltunen (2008) shows, interpreter and interpretation are of great importance in the signification process of the future signal []. Next, we will discuss this signification process.
The three dimensions of future signs, or weak signals, are object, interpretant, and representamen. Hiltunen (2008) describes the dimensions in the case of weak signals to be signal (representamen), issue (object), and interpretation, as illustrated in Figure 1 []. Also, in this representation, the dual nature with object and interpretation is present. The dimensions can be presented in a 3-dimensional space where the dimensions are on the axis. A signal strengthens and eventually becomes a strong sign, as it draws away from the origin. Kuusi and Hiltunen (2007) discuss the dynamics of the future sign—i.e., its growth from a weak to strong sign—more thoroughly, where they identify the signification process of a weak signal. This signification process is heavily related to the interpretation; thus, interpreter—turning exosign into endosign, leading to mental models and secondary exosigns as well. However, the possibility for a weak sign to develop into a strong or meaningful future sign requires that the exosign is visible enough to be observed. []
Figure 1.
The three dimensions of future signs in 3-dimensional space (Hiltunen 2008).
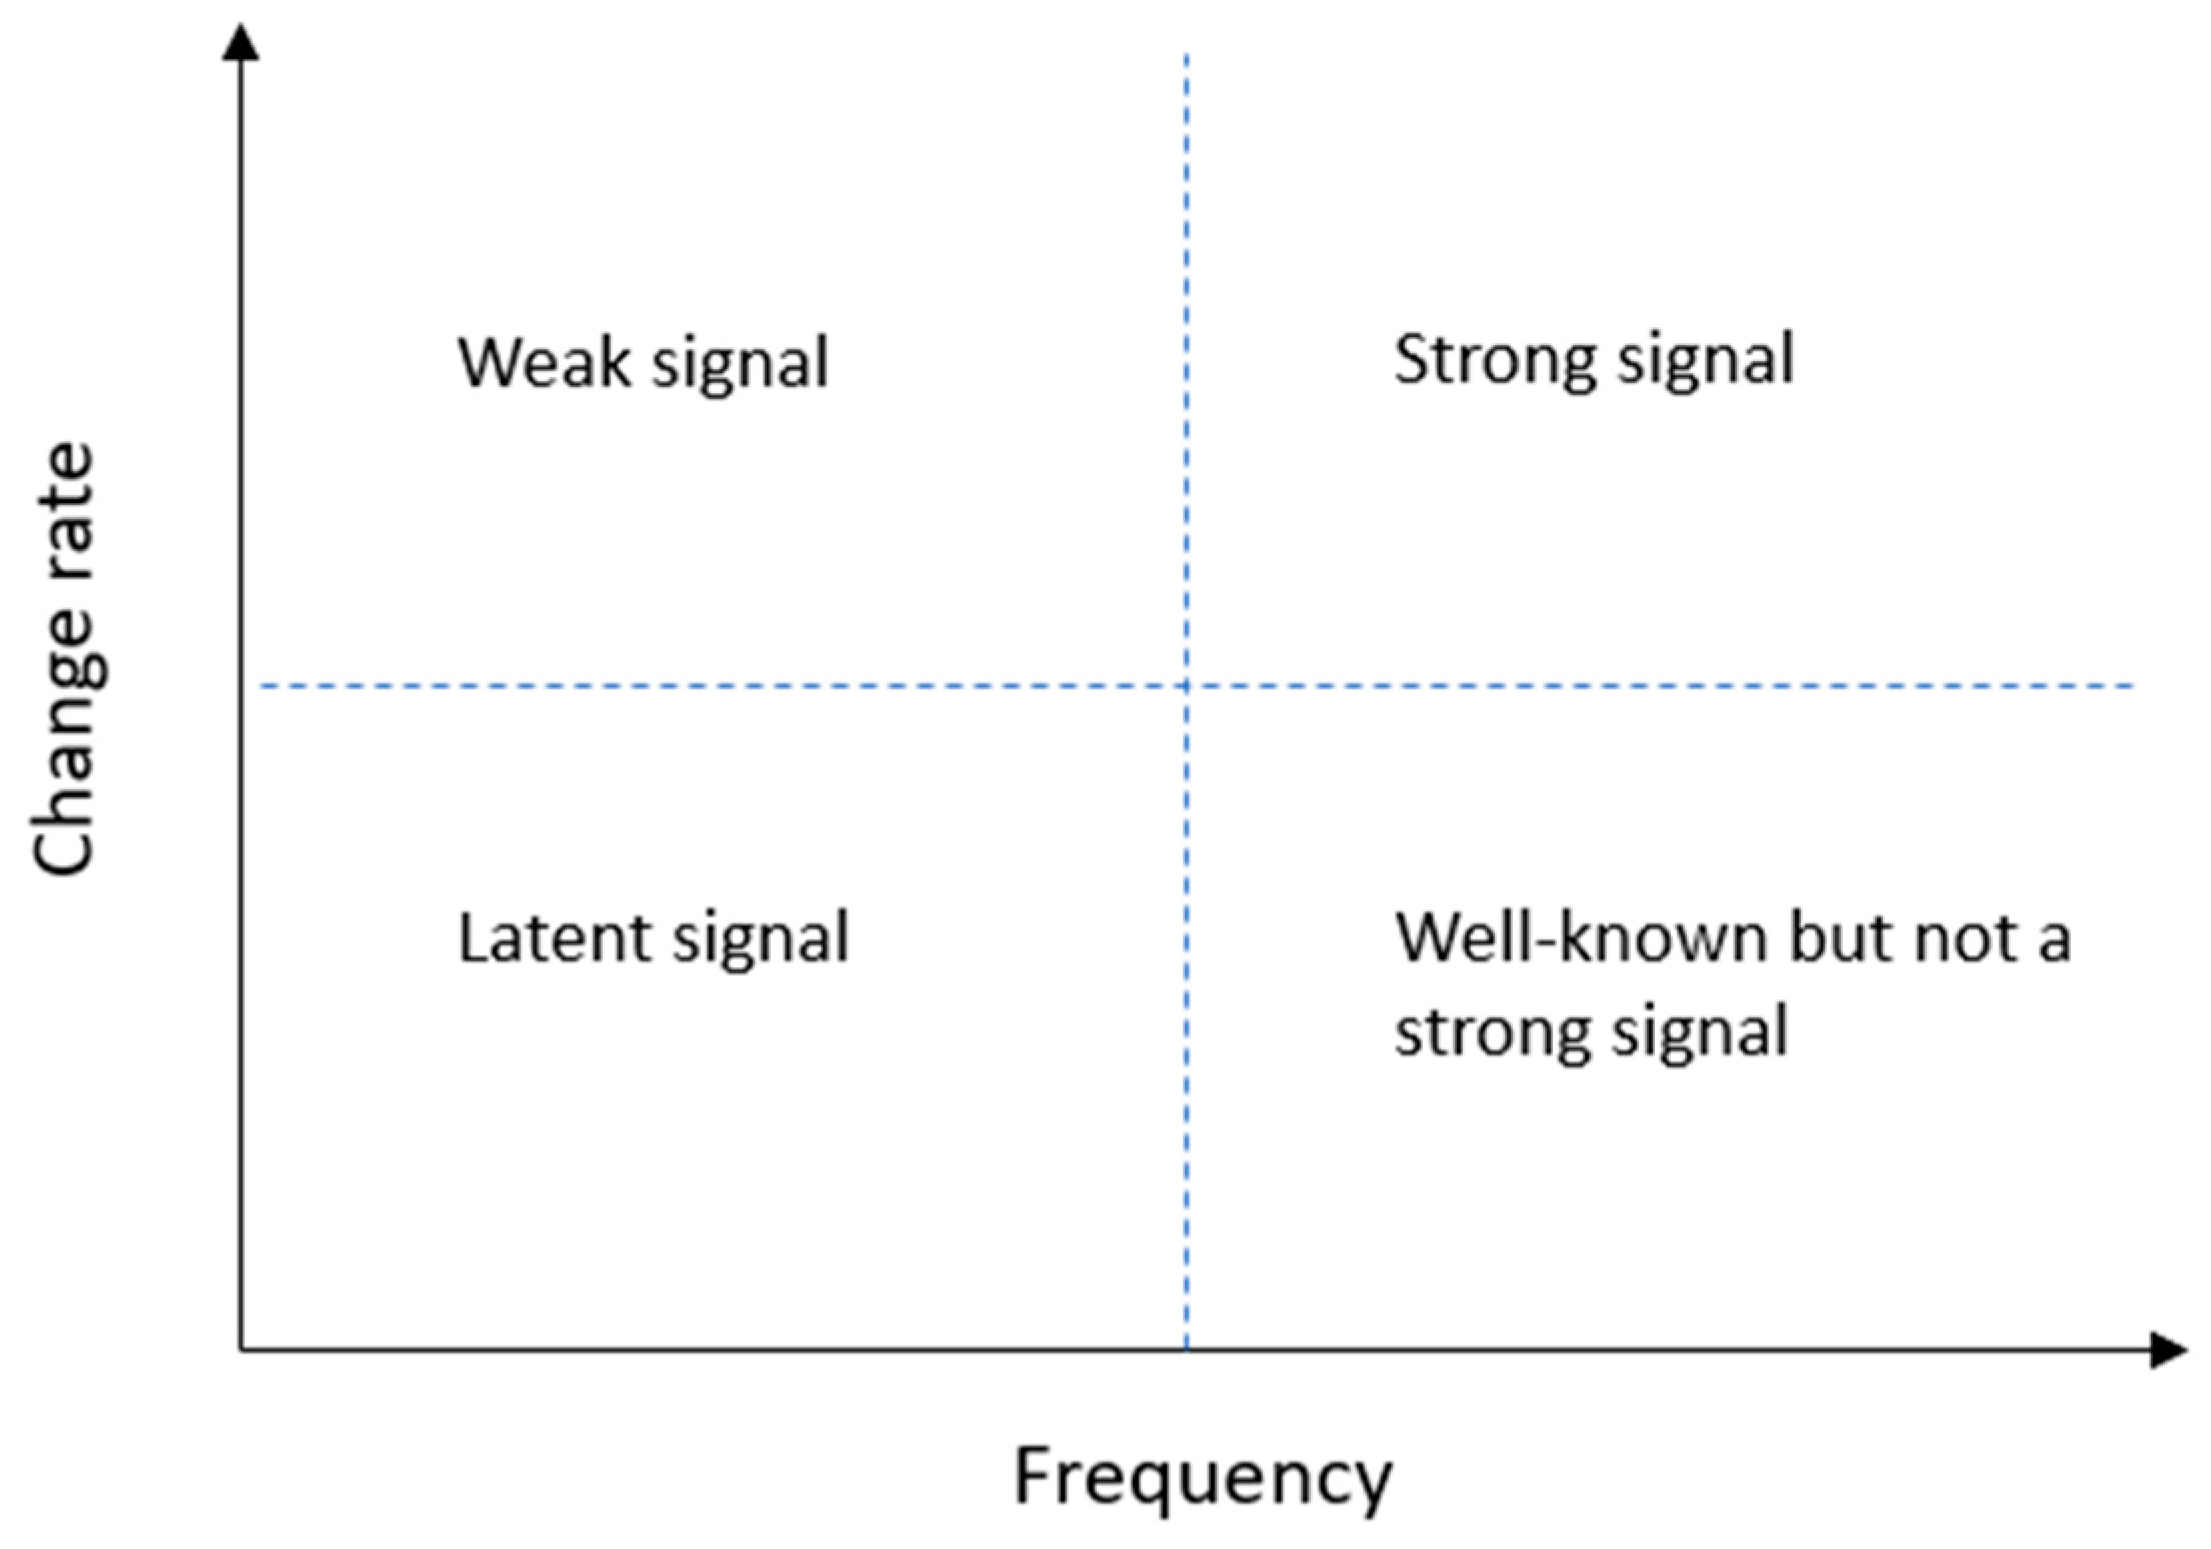
2.2. Future Signals in Text Mining Applications
The small but growing literature that focuses on identifying trends and signals with text mining tools [,,] has exploited the term occurrence frequency in documents as a way to measure the changes and strength of the future signals. Yoon (2012) has proposed two indicators for distinguishing the signal and issue dimensions of future signs (Figure 1): (1) Degree of visibility (DoV) that measures the degree of the frequency of a defined keyword1 in a set of documents is presented as a proxy for signal, and (2) degree of diffusion (DoD) that measures the document frequency of each keyword in relation to the total number of documents as a proxy for issue []. Both indicators put more weight on recent occurrences through a time-weight coefficient. The mathematics behind the indicator scores is explained in more detail in Section 3.2.2. Yoon (2012) has further suggested that when the DoV and DoD indicator scores are mapped together with the average frequency counts (average term frequency and average document frequency, respectively); as a result, a keyword emergence map (KEM) and a keyword issue map (KIM) can be formed, and these maps can be used for detecting future signals from a collection of documents.
Both KEM and KIM aim to help in identifying four kinds of signals: (1) latent signals, (2) weak signals (3) well-known but not strong signals, and (4) strong signals (see Figure 2). The signals are defined as the following. The latent signals are words with low frequency and change rates. In the second quadrant, we have the weak signals, words with a low frequency but a higher rate of change, which suggest that their relevance may increase in the future. The well-known but not strong signals refer to words with higher than average frequencies but low change rates. Finally, a strong signal (also defined as a trend in some instances) is a word with both a high frequency and a change rate.
Figure 2.
Future signal types as presented in [].
Drawing this kind of information out of a textual data set is relatively straightforward, but how to interpret (the third dimension in Hiltunen’s framework) the emerging issues and signals is more problematic. As Lee and Park (2018) point out, the approach suggested by Yoon (2012) contains ambiguity in this regard because the two keyword maps (KEM and KIM) unavoidably differ from each other, and their comparison and integration are a subjective task []. Further, as a result, is a list of keywords without any context given, where a certain (high) level of abstractness is present. For instance, some words have multiple meanings, and they are falsely grouped under one keyword. Very specific keywords inflict problems as well, since they may refer to individual events or places, and hence cannot be viewed as future signals.
The above weaknesses were considered by Lee and Park (2018), who proposed including semantic analysis in the future signal detection framework []. With a semantic element, the goal is to find meaning from a group of words instead of individual words to gain a better understanding of the future signals. Focusing on topics instead of individual words is a common practice in text mining applications (see, e.g., []). Topic modeling algorithms are statistical methods that help to discover themes, but also connections between those themes and their change over time from original texts []. Latent topic models, in particular, have gained popularity as a way to examine the co-occurrence of words, and therefore, the thematic structure of a document collection [].
3. Methods and Materials
This section presents the overall workflow, the text mining tools used in the analysis, as well as the data collection and materials.
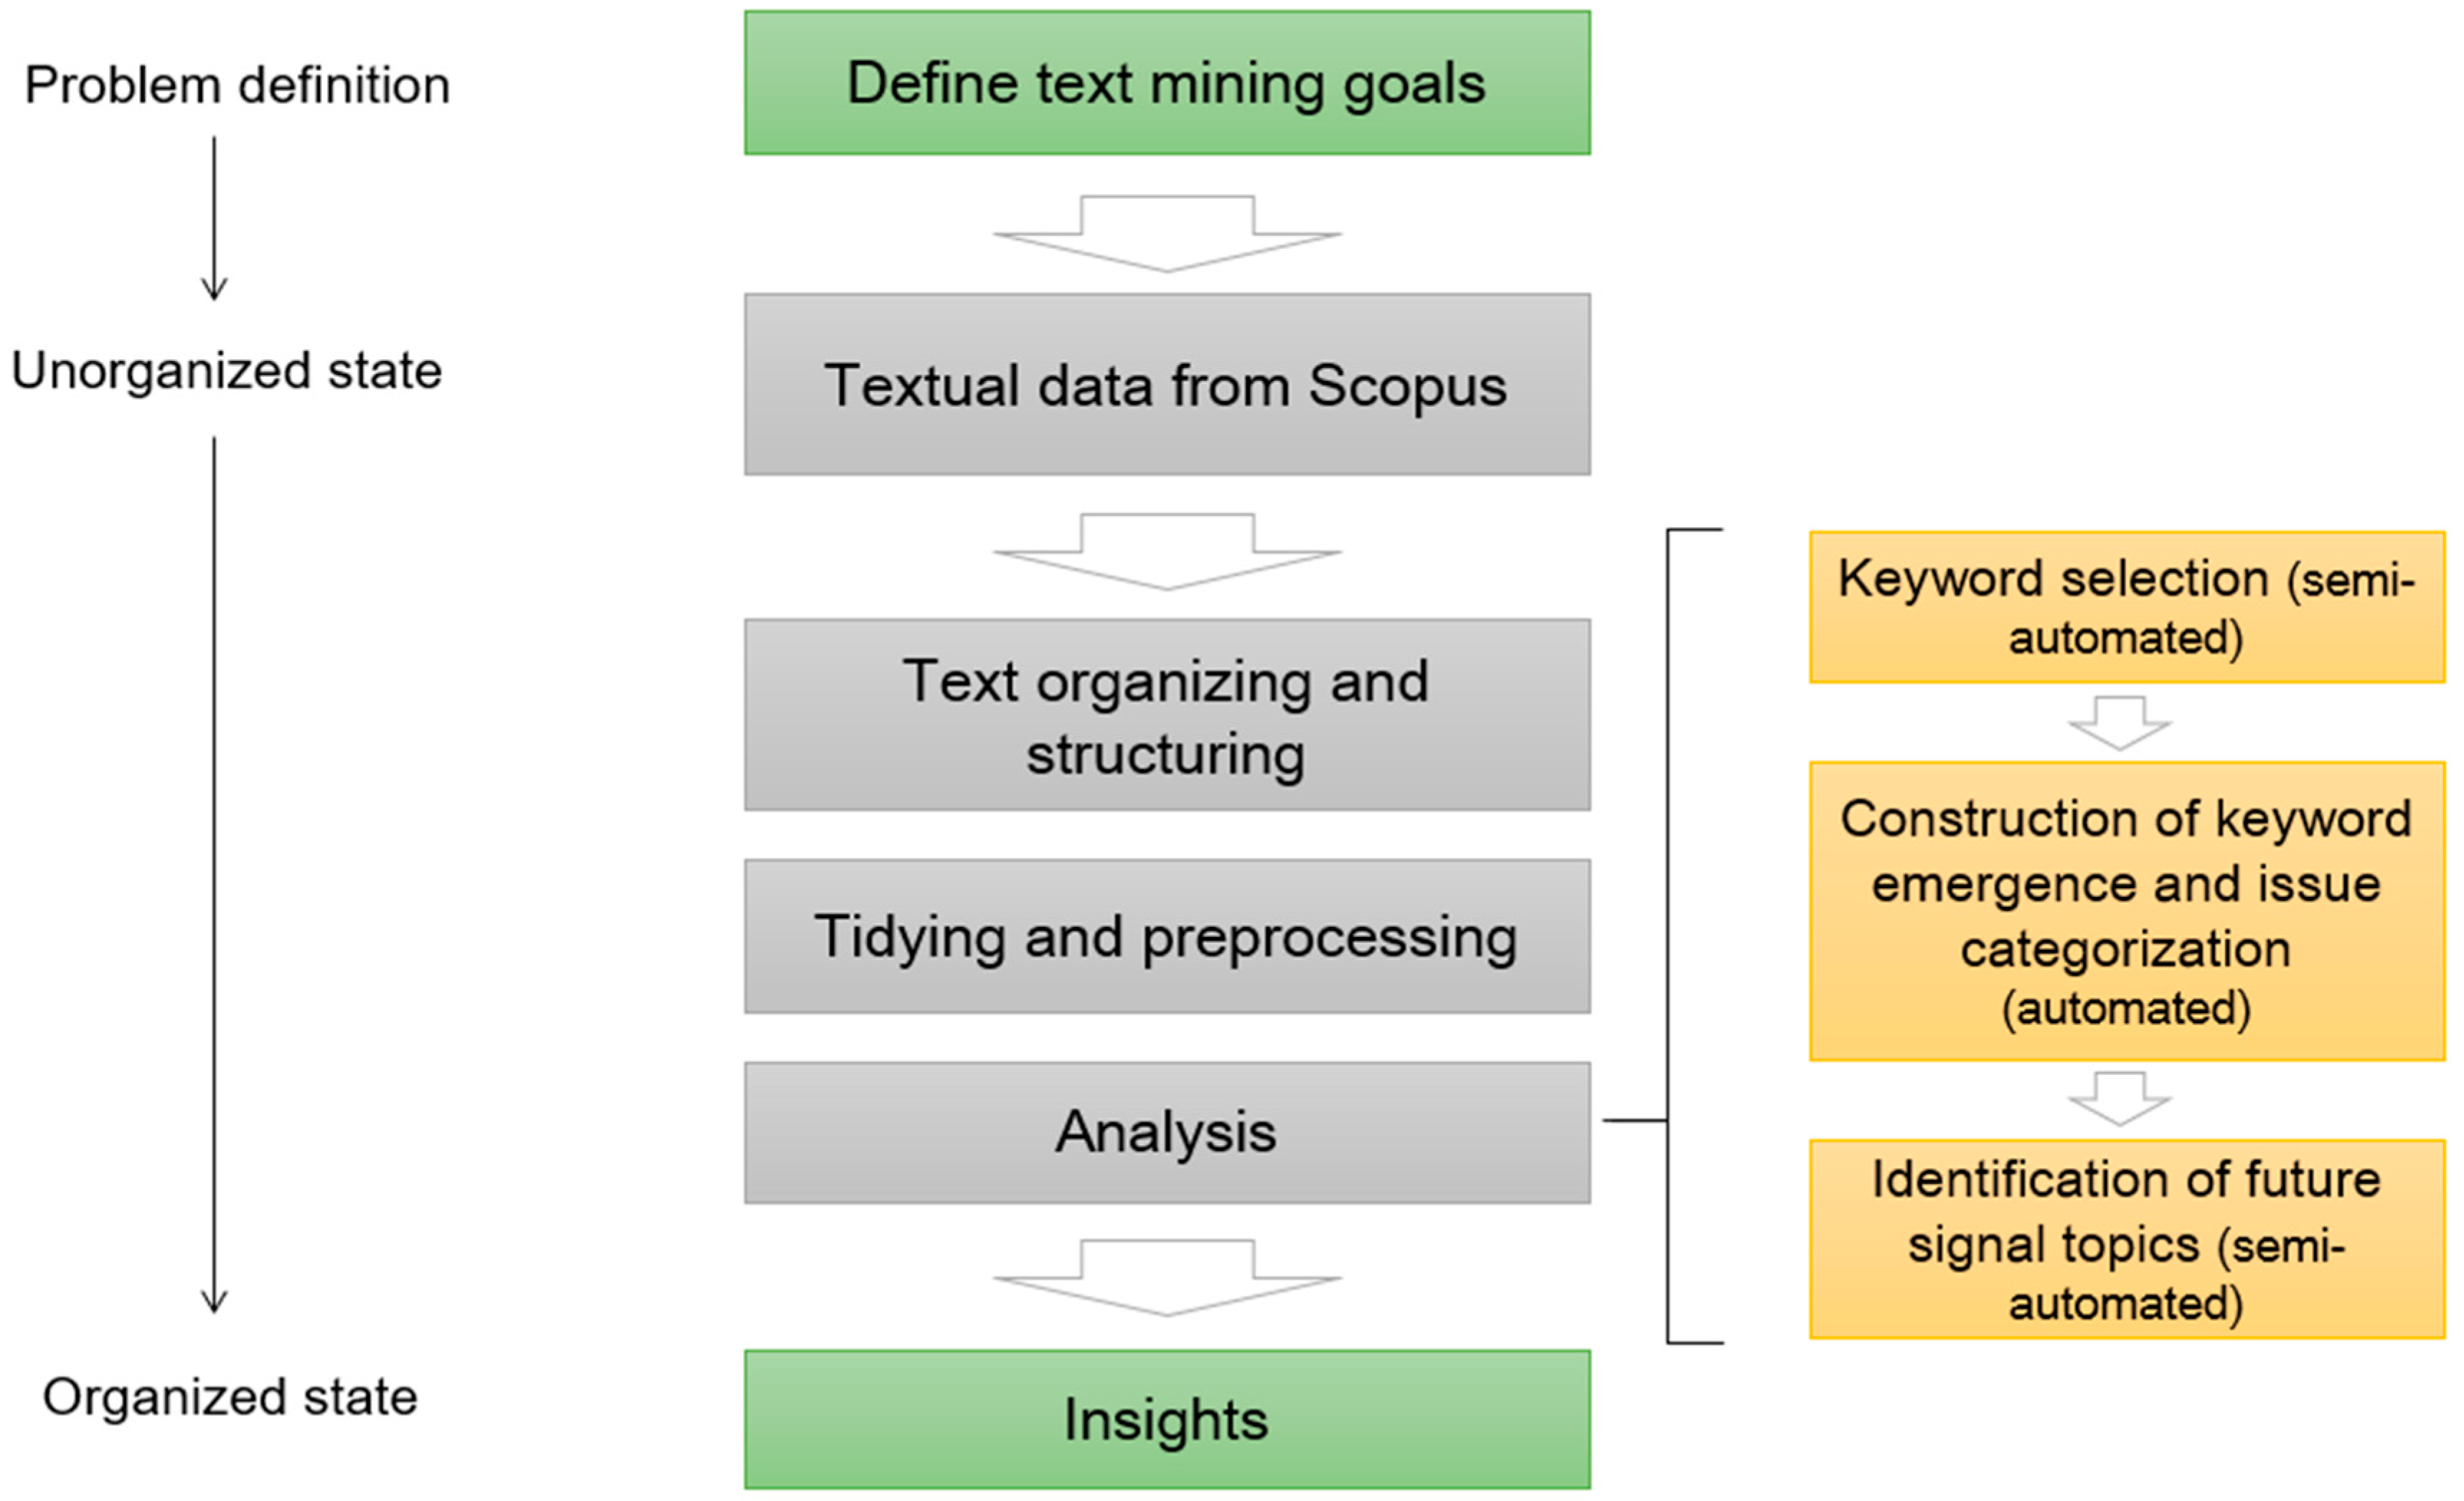
3.1. Overview of the Research Process
Figure 3 presents the research process of this study. The process starts with a problem definition, which, in this case, is the identification of future signals of the land administration domain, after which the text mining exercise is implemented. At this point, it should be stressed that text mining, albeit being a quantitative approach, rarely is a linear and fully automated procedure, but requires actions and revision from the text miner as well []. After all, text mining shares similar features with content analysis as the goal is to extract common themes and topics from a text corpus, and that might require adding and/or deleting categories based on a manual selection. Performing text analysis requires setting up a text mining framework []. Usually, the following four steps should be included. The first step is to import texts into the computing environment. The second step is organizing and structuring the imported texts to access them in a uniform manner. Next, the text corpus requires tidying and preprocessing. This includes removing stopwords, tokenizing texts, and so on. The preprocessed texts must also be transformed into structured formats that make analysis possible. In the fourth step, the analysis can be performed with adequate methods. Finally, after the text analysis part has been completed, the results are formulated into insights.
Figure 3.
The research process summarized.
In this research, the analysis includes three main steps: keyword selection, construction of keyword emergence and issue categorization, and identification of the future signal topics. In the implementation of the first two steps, we follow the previous literature [,,], with few modifications. In the third step, we apply topic modeling for grouping sets of keywords together to make the signals easier to interpret. Hence, the inclusion of topic modeling responds to the ambiguity of future signal interpretation in previous frameworks that has been noted, for instance, by Lee and Park (2018) [].
3.2. Text Mining Tools
Here we present shortly the text mining tools used in the analysis. Based on the review of previous literature (Section 2), the main goals are (1) to identify temporal changes in the term and document frequency, and (2) to study the co-occurrence of terms and group them under plausible topics, and the tools are chosen accordingly. Analyses were conducted using R statistical software.
3.2.1. Term and Document Frequency
The TF-IDF index is a backbone of many text mining exercises. It expresses the importance of a word within a collection of documents by combining the frequency of the word within the document with the frequency of documents where the term occurs (see, e.g., [] for the formula of calculating TF-IDF). Because, in this study, we are using abstracts instead of full-length documents, using the TD-IDF index could be misleading because the frequency of the word within a document gives less information in the case of an abstract. Instead, we simply calculate the overall term frequency within the body of words with the following simple formula:
We are interested to see the frequency of the documents in which the term (x) occurs as well. The document frequency is calculated as a relation of the number of documents where a term occurs and the total number of documents.
3.2.2. Degree of Visibility (DoV) and Degree of Diffusion (DoD)
As explained in Section 2.2, in addition to the frequency of terms, also the temporal aspects, i.e., the change rates of term occurrence are in a key role in the future signal detection. The two change rates DoVij and DoDij have established their position in the related literature. Both DoVij and DoDij are calculated for term i during period j (and the overall score is a sum of periodical values). The first one summarizes how much a term is used over time, while the latter one measures how the spread of a term in the document collection varies over time. The indicators are calculated with following equations, where NN denotes the total number of documents, n the length of the time period, and tw a pre-determined time weight:
Due to the time-weight coefficient, the indicators weight recent appearances of terms heavier than past appearances. This is intuitive in this context, since in the future signal detection, we are not particularly keen on recognizing past patterns and making interpretations based on them. Instead, the aim is to detect the terms that are gaining momentum and, respectively, those that are disappearing from the discourse(s).
3.2.3. Topic Modeling
In this study, a probabilistic topic model, latent Dirichlet allocation (LDA), is used for finding sets of terms that co-occur (topics). LDA has been described to be the simplest topic model []. The intuition behind it is simple: each document in the corpus is a probabilistic mixture of topics, and equally, each topic is a probabilistic mixture of terms. The number of topics is set by the analyst, and LDA does not give topic names as a result. Hence the topic names need to be determined manually, often based on the top topic words [].
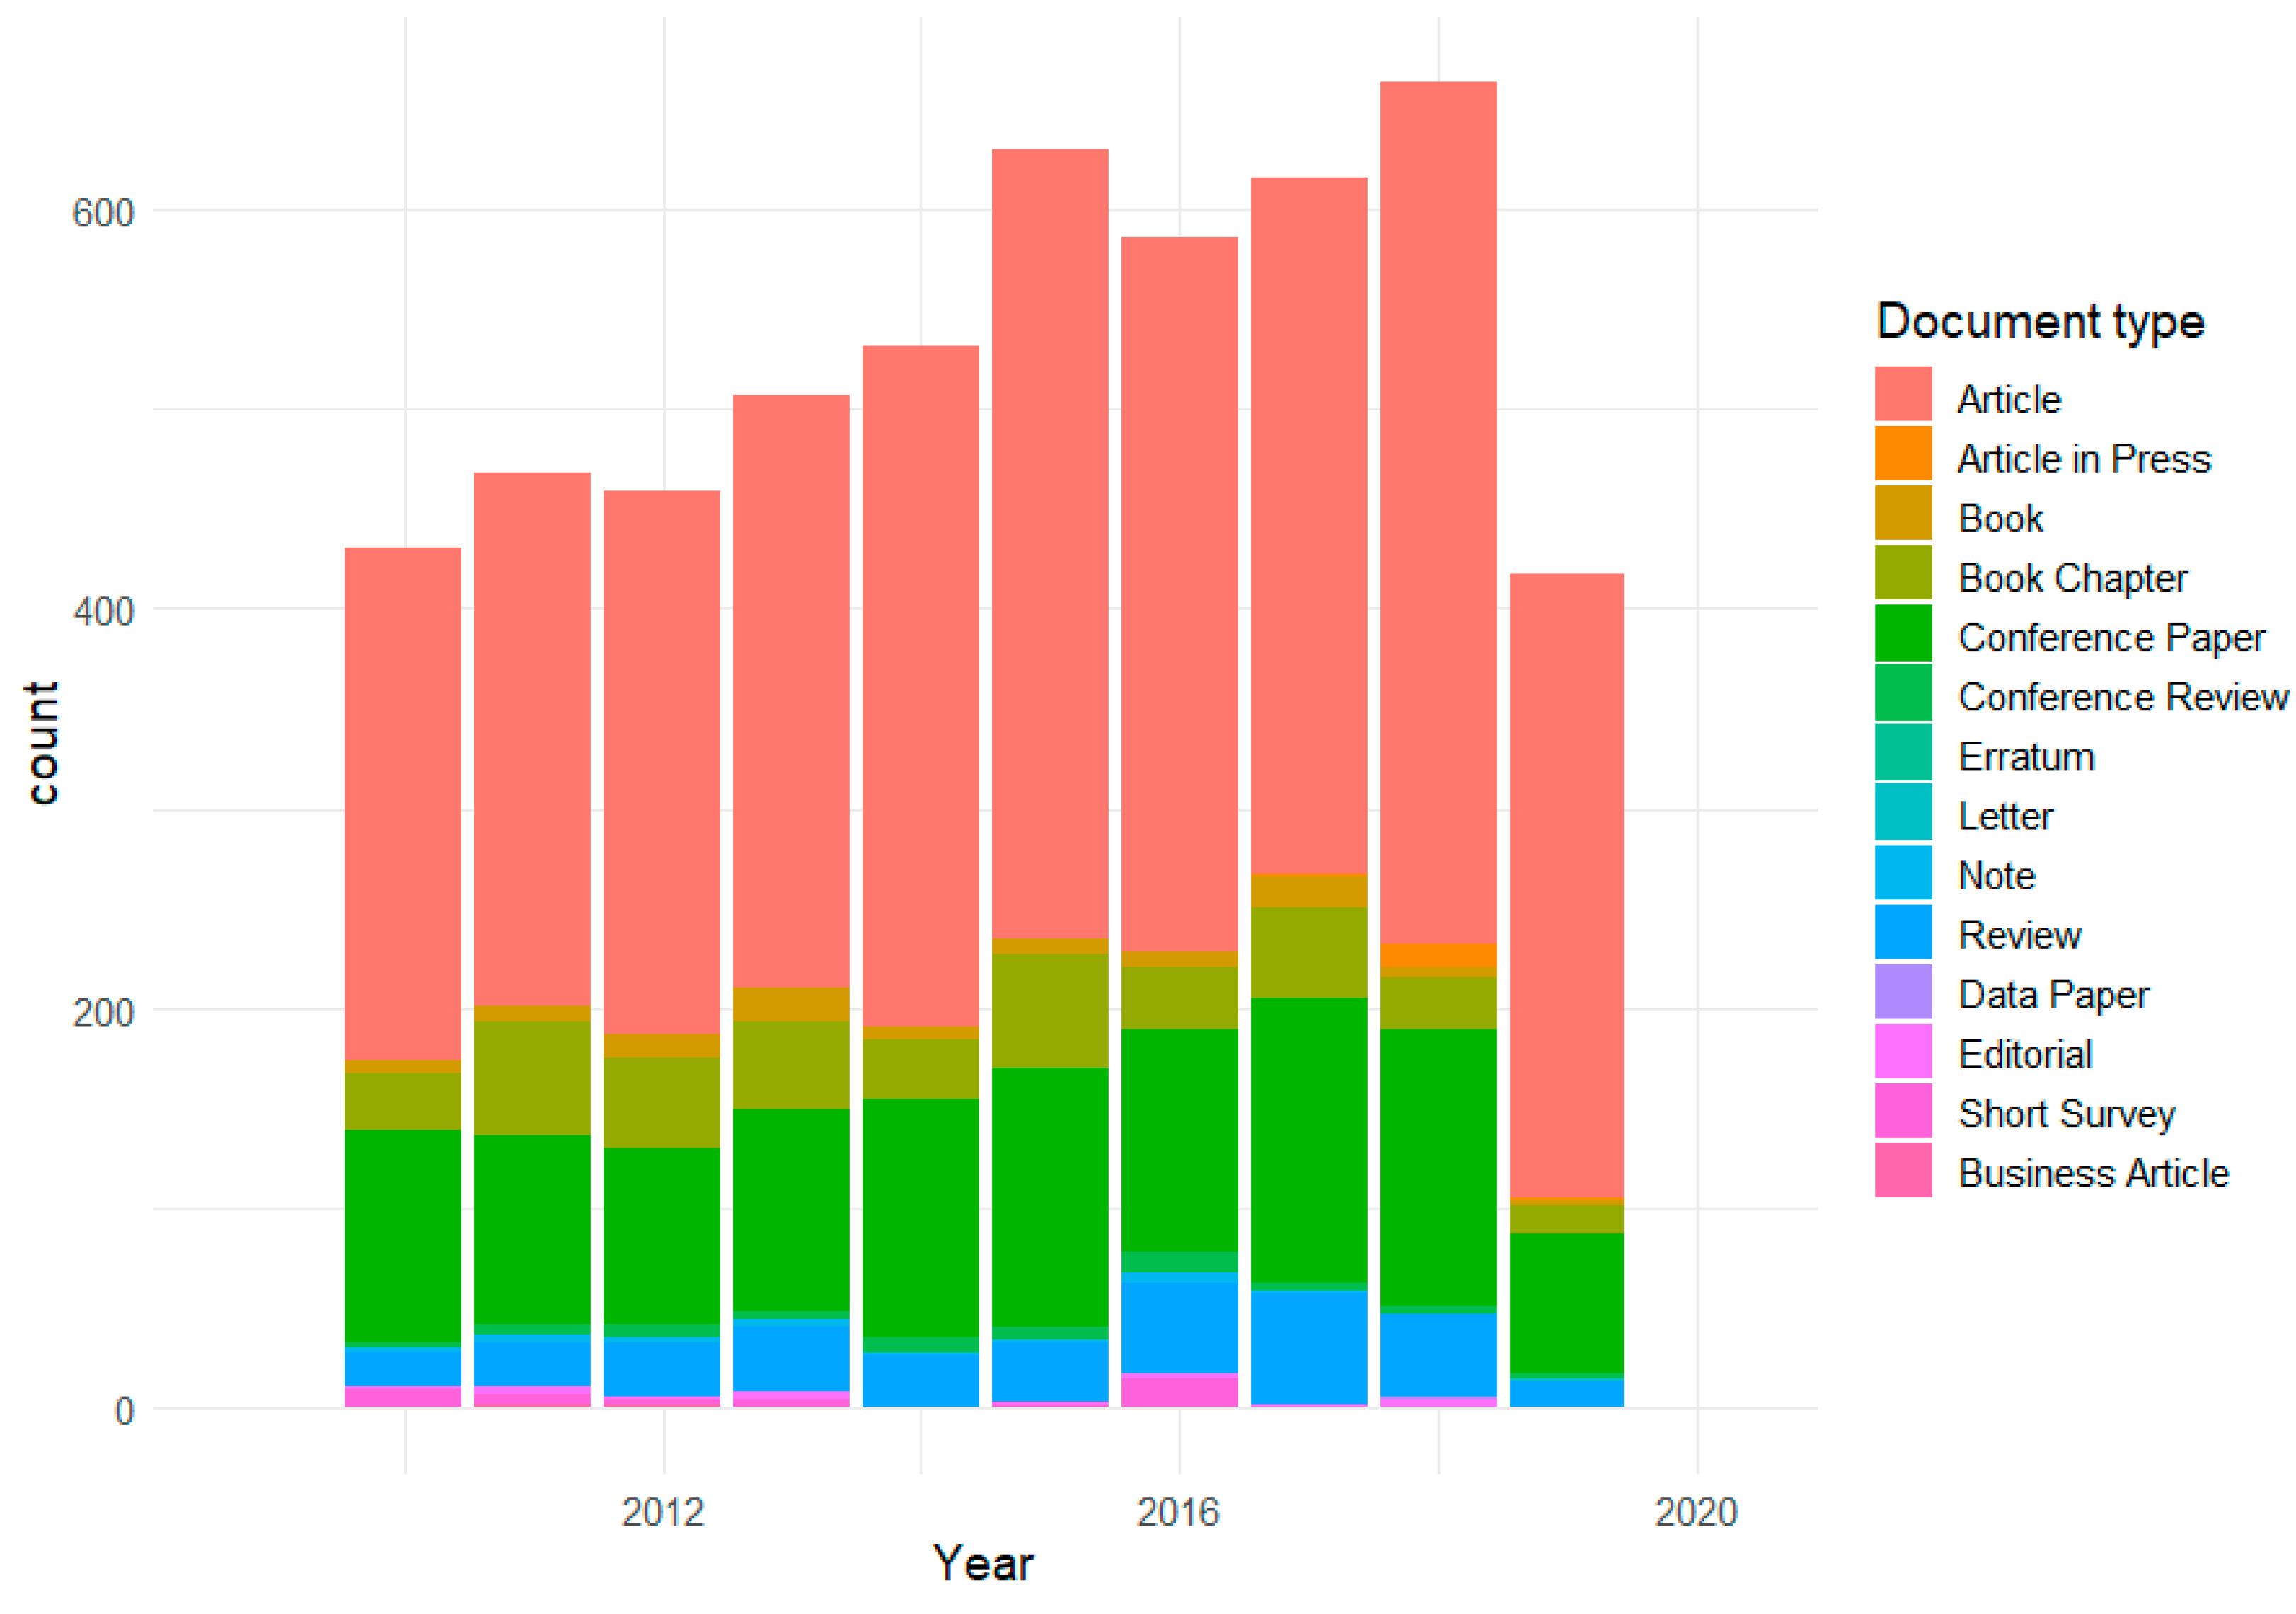
3.3. Data Collection and Materials
We used the Scopus scientific article database as the source for abstracts of scientific papers. Even though full-length papers would contain more information than abstracts, there are many advantages to using abstracts only. First, they should contain the most important and concise keywords, making them a more relevant source for the identification of future signals. Second, having a smaller text corpus makes the analysis much faster. We also expect that the abstracts reflect the content of the full paper without producing too much “noise” to the analysis.
We used “land administration”, “cadastral system”, “cadaster”, and “land administration system” as search keywords, and limited the search to documents published or accepted for publication between 1 January 2010 to 4 October 2019. The total amount of documents that were retrieved from Scopus was 5311. For each document, we were able to identify a title, authors, author keywords, a journal name, a publication year, and an abstract. As can be seen from Figure 4, the number of articles handling land administration issues has increased steadily during the past decade. Figure 4 also shows that research articles are the dominant document type in this data set, followed by conference papers as the second most common type. To further validate the relevance of the collected documents, we examined the author keywords by simply counting their total amount (see Appendix A for a list of thirty most common author keywords). “Cadastre” is the most common author keyword, followed by “GIS” and “land administration”. Also, more specific author keywords such as “remote sensing”, “3D cadaster”, and “LADM” belong to the top of the list. Overall the most popular author keywords are well in line with current discourses within the domain.
Figure 4.
The number of land administration related articles by the year and their document type distribution (data source: Scopus).
Before the analysis, the necessary pre-processing tasks were undertaken, like getting rid of the most generic words. In particular, the list of regular stopwords was completed with following words: "land", "paper", "study", "cadastral", "cadastre", "data", "qualitative", "quantitative", "number", "system", "management", "author", "authors", "publishing", "article", "elsevier", "results", "based", "method", "administration". After the pre-processing tasks, the text corpus included 611672 words.
4. Results
This section presents the results of the text mining exercise. First, we created a list of 635 keywords using a combination of term and document frequency criteria and manual selection. After that, using the DoV and DoD scores and average frequencies, the included terms were categorized under four keyword emergence and issue groups: latent, weak, well-known but not strong, and strong (as in Figure 2). Finally, topic modeling was applied to group keywords under the topics.
4.1. Keyword Selection
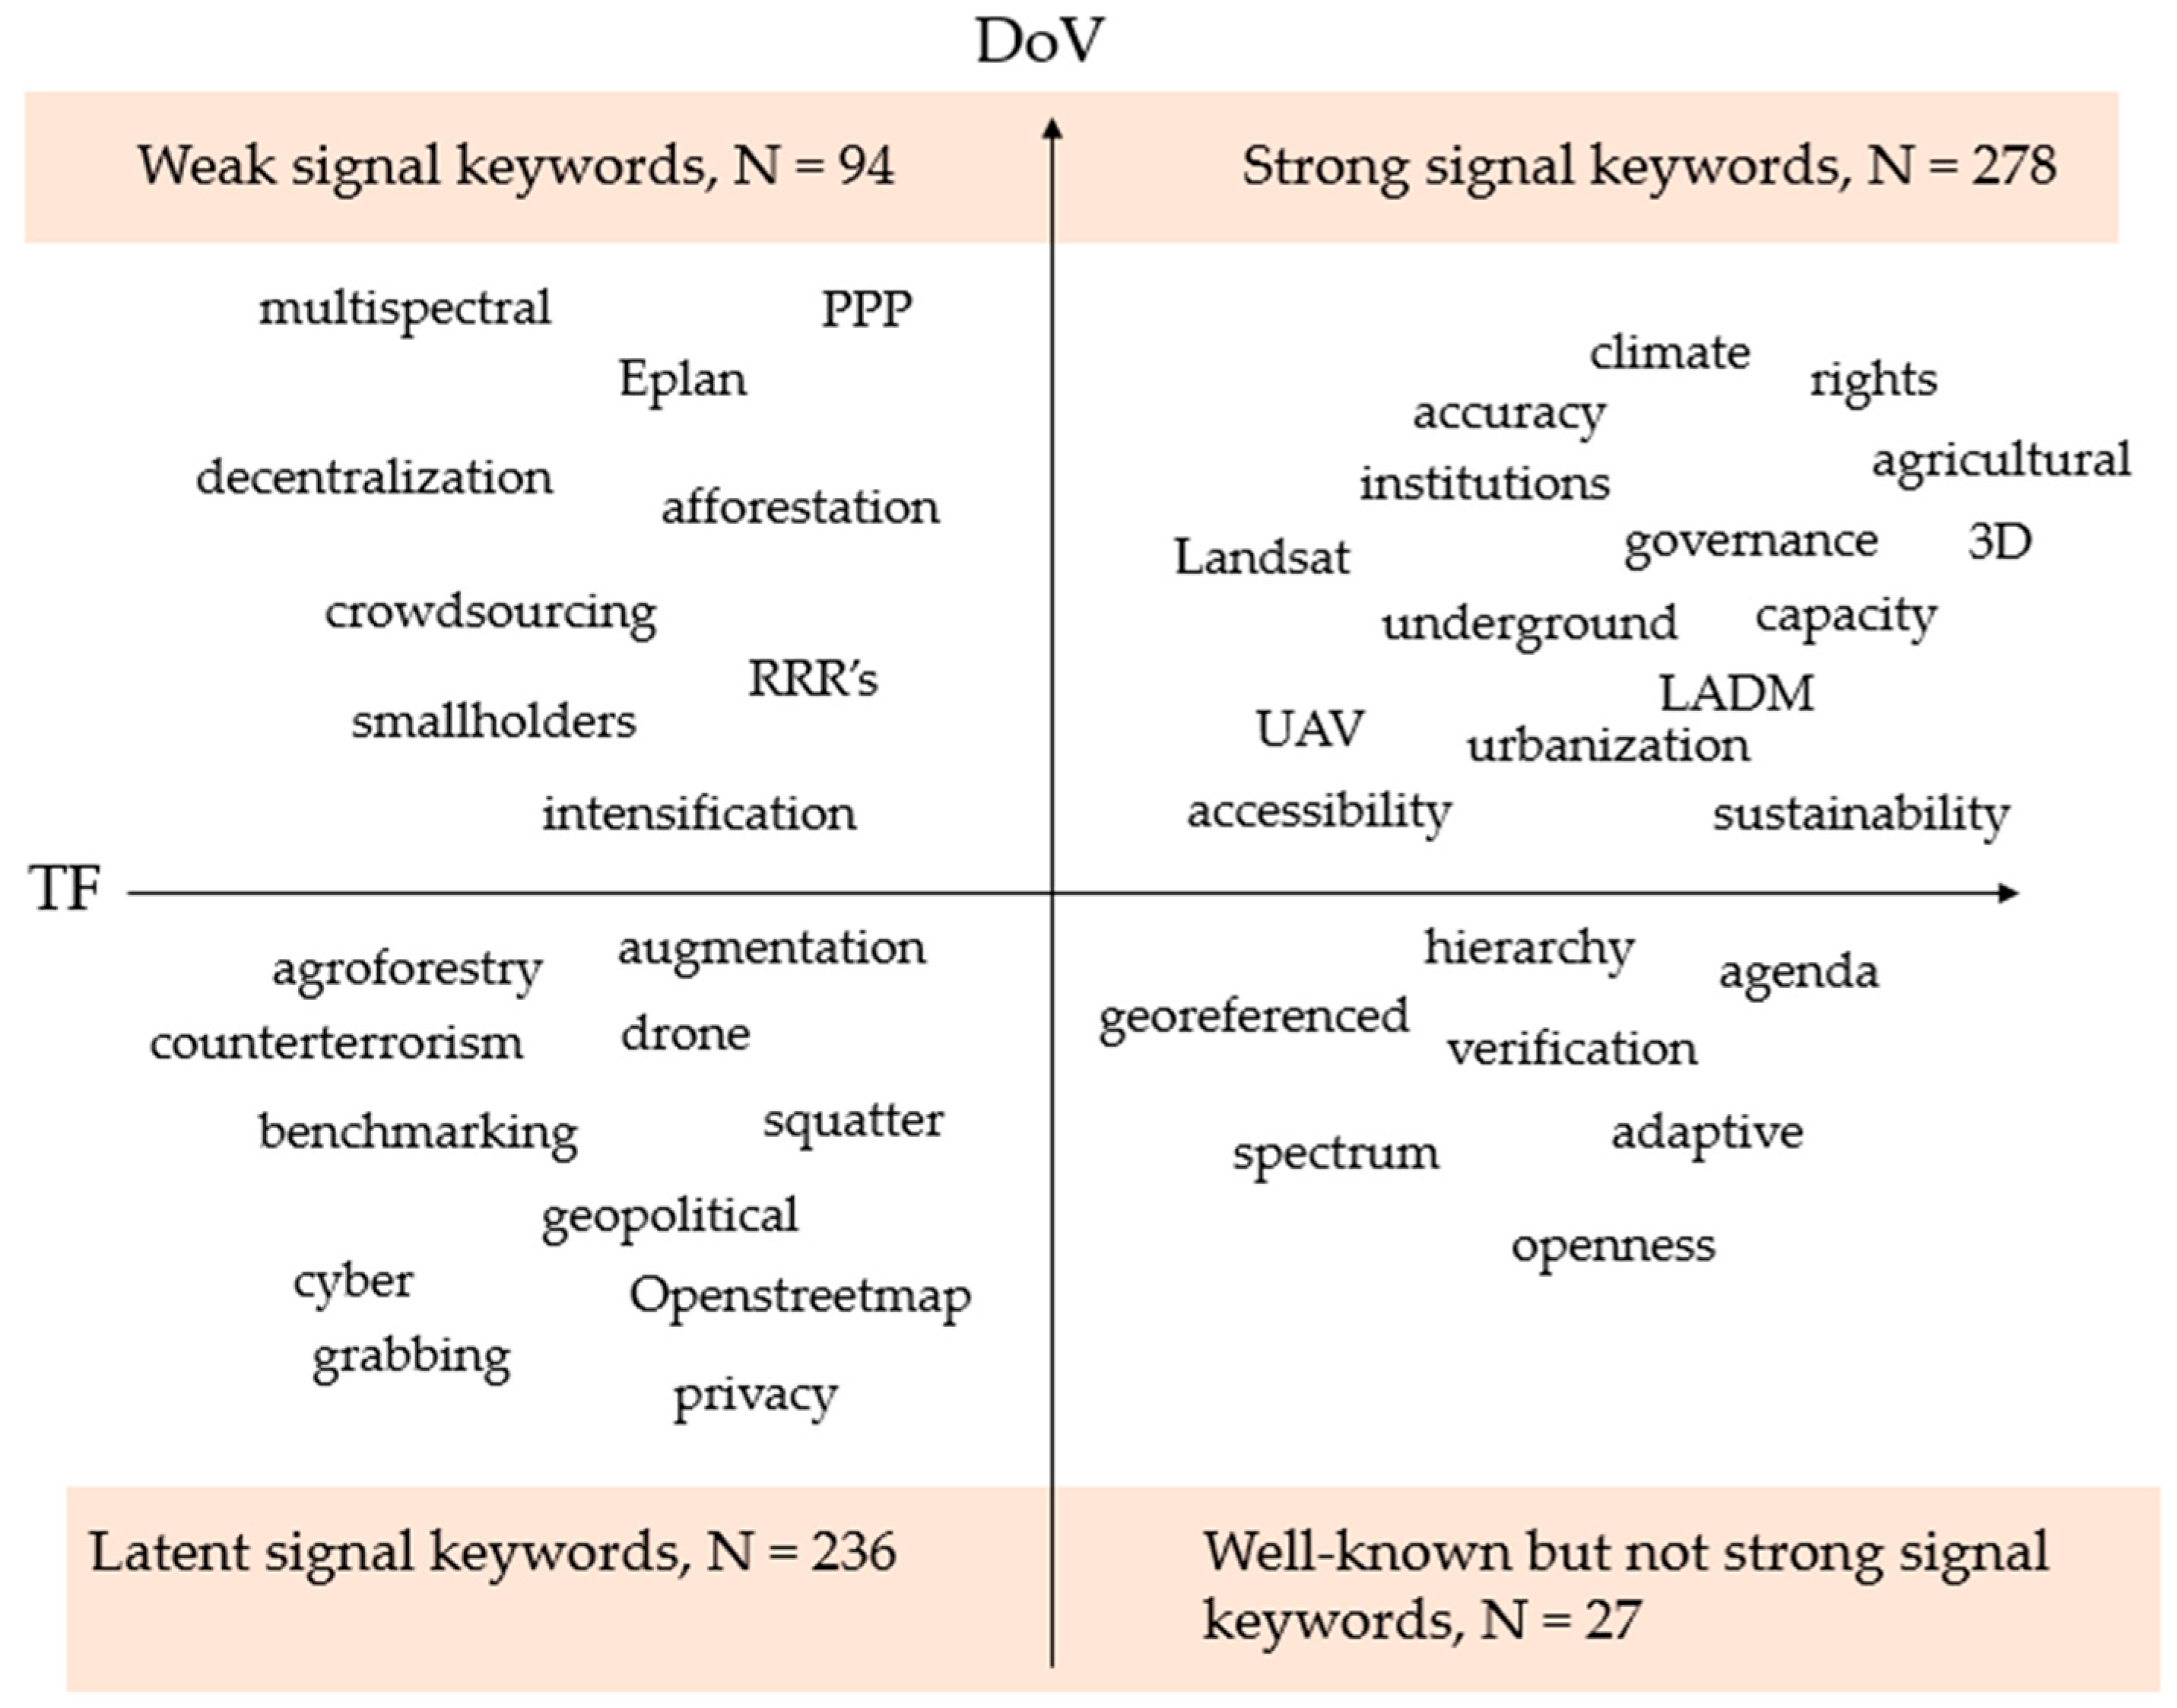
First, the overall term frequency as well as the document frequency was measured for every unique word in the text corpus. Very general terms such as information, development, urban, cities, rights, et cetera occur most frequently in our data set (Table 1). To steer the focus on signals, a list of more specific and land administration relevant keywords needs to be extracted. Previous studies have either chosen to use a pre-determined list of keywords [] or constructed the list manually using their own judgement as to the main criteria for keyword selection []. Here, a combination of automated and manual selection was used. Following filtering criteria was used first: (1) the term must occur at least ten times in the text corpus, and (2) the term must occur in at least five document abstracts. Using these criteria, we are able to cut down the number of unique words from 38,435 to 7708. To finalize the keyword selection, manual selection was used. In the end, 635 keywords were included for further analysis.
Table 1.
Top 20 most common keywords, their total frequencies and DoV and DoD values. Ranking order is based on DoD values.
4.2. Future Signals
Next, the keywords were categorized under the four emergence and issue classes based on their TFx and DFx values and DoV and DoD scores, as proposed by previous studies [,,]. Table 2 summarizes how the keywords divide under the four classes. The first observation is that the keywords do not fall very evenly into the four categories when the average values are used as thresholds for the categorization. Up to 81 percent of the keywords are classified as either strong or latent signal keywords, and the share is even higher in the issue dimension (84%). To get a better perception what type of keywords fall under the different categories, a stylized version of the keyword emergence map was drawn based on the results (Figure 5). A stylized version of the keyword issue map is not reported here since it would be very similar to Figure 5.
Table 2.
Keyword counts and percentages per category.
Figure 5.
A stylized version of keyword emergence map (the figure does not include all keywords, and the placing of words is inexact).
Then, LDA was used for grouping the keywords under twenty-five topics. The number was selected as a result of an iteration process, where two goals in particular had to be weighted: the topic coherence and the occurrence of some more surprising topics. In other words, we wanted to fix the number of topics to a level where the results are still coherent and easy to interpret but also wanted to set the number high enough to produce some latent and/or weak signal topics as well. Therefore, the number of topics used here is not applicable in all contexts and to all corpora. The LDA was conducted for the whole set of keywords since a hypothesis was that the keywords co-occur across categories, and forcing the grouping based on the keyword emergence or issue status would produce artificial results. The topic allocation results were processed followingly: the top 15 most common terms from each topic were reviewed, and their keyword emergence and issue status were checked. After that, the topics were given a name and an interpretation based on a smaller group of keywords. The goal was that the included keywords would form a coherent interpretation. At this stage, some of the topics were merged due to the overlapping of keywords. In the end, nineteen topics were kept (Table 3 and Table 4).
Table 3.
Identified latent and weak signal topics for land administration.
Table 4.
Identified well-known and strong signal topics for land administration.
The final task was to allocate the identified topics under the four signal categories. A simple rule was followed: the category was determined based on in which quadrant most of the most important keywords of the topic lay. Three latent signal topics and one weak signal topic are identified this way (Table 3). The remaining topics, with one exception, are classified as strong signals (Table 4).
The first latent signal topic is called “non-universal enhancement of location measures” and it builds around differential GPS, a system that provides positional corrections to GPS signals. The second latent signal “new data sources for socio-economic variables” also builds on a technology acronym, as NPP (national polar-orbiting partnership), a weather satellite, is the central keyword of the topic. The interpretation of this topic is that weather and climate monitoring data sources are used increasingly outside their core function, for instance, as a proxy for economic activity or migration. The third latent signal topic is called “national security” and consists of keywords such as weapons, treaty, and flux. We read this topic in a way that land is seen as a critical resource from a national security perspective. The only weak signal topic is called “plans in digital form” and it relates to the advances in GIS software and the ability to move from paper documents to digital formats.
One well-known but not a strong signal topic is recognized: participatory land consolidations. Land consolidations are a common land surveying procedure to tackle the issue of land fragmentation, which reflects a high frequency of the related keywords. The change rates of some of the keywords of this topic are moderate though, which distinguishes it from the strong signals. The list of recognized strong signals is significantly longer and the topics range from more technology-oriented ones, such as “3D city models in visualization”, “Advances in photogrammetry and laser scanning”, and “Satellite imagery for data collection” through ecology and environment-related topics like “Climate change mitigation”, “Biodiversity”, and “Water-related threats”, to topics strongly related to the core functions of land administration, such as “Responsive and flexible standardization”, “Customary land rights”, and “Land conflicts”. The interpretations of each topic are explained in Table 4.
5. Discussion
This study confirms what the previous studies have already noted about the interpretation of future signals: it is the challenging part of signal detection. In this study, individual keywords were grouped under topics to ease the interpretation task. In addition to the difficulty of quantifying and automating the interpretation part, it should be kept in mind that future signals, in general, are highly subjective; what might be a surprising signal for one might be an established issue for another person. Hence even with the most carefully conducted signal detection process, we cannot achieve an outcome that is supported by all. Therefore, we are in line with Yoon (2012) who expected that automated methods and expert-based approaches will likely continue to complement each other in signal detection [].
The biggest weakness of the chosen approach is likely the somewhat arbitrary selection of keywords from a large pool of terms. Here we ended up including roughly 10 percent of the terms that appeared more than ten times at least in five documents to the keyword pool based on a manual selection. The alternative, a full automation of this stage, did not seem like a plausible option either—it would be very difficult to determine a selection algorithm for this kind of task. Further, the relatively large share of acronyms within the data set turned out to be both a positive and a negative thing. Positive because acronyms summarize technologies, movements and the like that cannot be detected by analyzing individual terms, and negative because we are not able to verify that they all refer to the same group of words because the acronyms had been determined by the authors. In this study, we read the acronyms according to their most well-known definition, considering them, of course, from a land administration perspective.
Even though some manual merging of the topics was done, we did not want to intervene the outcome of LDA too much. Therefore, some overlapping of the signal topics can be observed, for instance, in the use of satellite imagery and NPP for collecting information about socio-economic variables. The most prominent feature of our findings is the large share of strong signal topics. Reasons for this could lie either in the study approach and the used text mining tools or the mere fact that the discourses of the land administration domain tend to cluster around certain topics. Regardless, we find the identified signal topics highly plausible and versatile, as they vary from climate, biodiversity, and transportation to sensor technologies, land conflicts, and standardization. This just underlines how land is a component that connects to many grand challenges we are facing today, and how land administration functions (land tenure, land value, land development, land use) [], are in a key role in delivering the sustainable development goals (SDG) set for year 2030 [].
Some interesting and less examined topics can be spotted from the group of latent and weak signal topics (Table 3). The strategic role of land in national security, for instance, is not often brought up in the land administration literature. In Finland, for example, starting from January 2020, foreign residents will need permission to buy property—the new legislation has been put in place to protect national security []. In addition, the only topic categorized as a weak signal, plans in digital form, is a topical issue, for instance, in Australia, New Zealand, and Singapore, where cadastral systems are reformed to support digital cadastral data [], or in the Nordic countries, where public agencies strive towards digital land-use planning [].
Lastly, we note that the future signals identified in this study mainly reflect the academic discourse, as we used Scopus database as the source for textual data. Though the volume of scientific output is constantly growing [], we suggest this kind of approach should be further tested with a larger and more comprehensive text corpus. Extending the analysis, for instance, to social network messages such as tweets, could be an interesting follow-up to this study. That being said, we argue that in the field of land administration, the academic and non-academic discourse strongly intertwine, which made the use of scientific sources a reasonable choice in this study. Hiltunen (2008) has suggested as well that academic and scientific journals are among the best sources for detecting weak signals (others being researchers, futurists, colleagues, and reports of research institutes) []. The framework as well could be extended in the future, to cover, for instance, the network aspect of the keywords and future signal topics, as visualizing which terms and topics are connected to each other could enhance the interpretation significantly. Finally, we note that the study applies one topic modeling technique, LDA. Other techniques besides LDA should be explored to increase understanding of the automation of future signal interpretation.
6. Conclusions
In this study, we show by using text mining tools how to explore, organize, and analyze future signals in the context of land administration. The future signal topics were divided under four categories: latent, weak, well-known but not strong, and strong signals. Our findings show that the future signals of the land administration domain vary from natural hazards and sustainable land use to flexible standardization and advances in surveying technology. Thereby, the results of this study stress the importance of addressing the future of land administration from a holistic perspective. The findings also back up the central role of cadastral systems in supporting the achievement of the SDGs [].
In addition to the empirical evidence, this study contributes the future signal detection literature by proposing a semi-automated way to interpret future signals. Namely, this paper demonstrates how adding topic modeling to be a part of a future signal detection framework originally developed by Yoon (2012) [] shows the potential to enhance the quality of the interpretation of the future signals. Overall, using text mining for foresight exercises shows great potential that we expect to increase in the future as the amount of available data increases and the language processing tools develop. Nevertheless, we note that especially weak signal detection calls for approaches that combine both an automated, quantitative view (for reducing human bias in picking up the signals and themes) and a participatory, qualitative view (to ensure a higher presentation of surprising elements).
Author Contributions
Conceptualization, P.K. and K.R.; methodology, P.K.; software, P.K.; validation, P.K. and K.R.; formal analysis, P.K.; investigation, P.K.; data curation, P.K.; writing—original draft preparation, P.K. and K.R.; writing—review and editing, P.K. and K.R.; visualization, P.K.; supervision, K.R.; project administration, K.R.
Funding
This research was funded by National Land Survey of Finland (NLS), Aalto University School of Engineering and the Finnish Ministry of Forestry and Agriculture.
Conflicts of Interest
The authors declare no conflict of interest. The funders had no role in the design of the study; in the collection, analyses, or interpretation of data; in the writing of the manuscript, or in the decision to publish the results.
Appendix A
Table A1.
The most common author keywords in the data set.
Table A1.
The most common author keywords in the data set.
| Author Keyword | N | Author Keyword | N |
|---|---|---|---|
| 1. Cadastre | 201 | 16. Urban planning | 25 |
| 2. GIS | 152 | 17. Land cadastre | 23 |
| 3. Land administration | 110 | 18. Land registry | 23 |
| 4. Land use | 75 | 19. Mapping | 23 |
| 5. Remote sensing | 75 | 20. Agriculture | 23 |
| 6. 3D cadastre | 59 | 21. Landscape | 21 |
| 7. LADM | 43 | 22. Soil moisture | 21 |
| 8. Climate change | 36 | 23. CityGML | 20 |
| 9. Land | 32 | 24. Photogrammetry | 20 |
| 10. Land management | 31 | 25. Geographic information systems | 18 |
| 11. Sustainability | 29 | 26. Database | 17 |
| 12. China | 29 | 27. Land cover | 17 |
| 13. Land consolidation | 27 | 28. Land reform | 17 |
| 14. Property rights | 27 | 29. Real estate | 17 |
| 15. Sustainable development | 26 | 30. Cadastral map | 17 |
References
- Enemark, S. The land management paradigm for sustainable development. In Sustainability and Land Administration Systems; Williamson, I., Enemark, S., Wallace, J., Eds.; Department of Geomatics, University of Melbourne: Melbourne, Australia, 2006. [Google Scholar]
- Feder, G.; Nishio, A. The benefits of land registration and titling: Economic and social perspectives. Land Use Policy 1999, 15, 25–43. [Google Scholar] [CrossRef]
- Williamson, I.; Enemark, S.; Wallace, J.; Rajabifard, A. Land Administration for Sustainable Development; ESRI Press: Redlands, CA, USA, 2010. [Google Scholar]
- Ting, L.; Williamson, I. Cadastral trends: A synthesis. Aust. Surv. 1999, 44, 46–54. [Google Scholar] [CrossRef]
- Zevenbergen, J.; de Vries, W.T.; Bennett, R. Dynamics in Responsible Land Administration; change at five levels. In Proceedings of the FIG Congress 2018, Istanbul, Turkey, 6–11 May 2018. [Google Scholar]
- Krigsholm, P.; Zavialova, S.; Riekkinen, K.; Ståhle, P.; Viitanen, K. Understanding the future of the Finnish cadastral system—A Delphi study. Land Use Policy 2017, 68, 133–140. [Google Scholar] [CrossRef]
- Amanatidou, E.; Butter, M.; Carabias, V.; Könnölä, T.; Leis, M.; Saritas, O.; Schaper-Rinkel, P.; van Rij, V. On concepts and methods in horizon scanning: Lessons from initiating policy dialogues on emerging issues. Sci. Public Policy 2012, 39, 208–221. [Google Scholar] [CrossRef]
- Hiltunen, E. Weak Signals in Organizational Futures Learning. Ph.D. Thesis, Aalto University School of Economics, Espoo, Finland, 2010. [Google Scholar]
- Popper, R. How are foresight methods selected? Foresight 2008, 10, 62–89. [Google Scholar] [CrossRef]
- Popper, R. Foresight methodology. In The Handbook of Technology Foresight: Concepts and Practice; Georghiou, L., Harper, J.C., Keenan, M., Miles, I., Popper, R., Eds.; Edward Elgar: Cheltenham, UK, 2008; pp. 44–88. [Google Scholar]
- Sitra 2019. Heikot Signaalit Tulevaisuuden Avartajina. Available online: https://www.sitra.fi/julkaisut/heikot-signaalit-tulevaisuuden-avartajina/ (accessed on 1 November 2019).
- Yoon, J. Detecting Weak Signals for long-term business opportunities using text mining on Web news. Expert Syst. Appl. 2012, 39, 12543–12550. [Google Scholar] [CrossRef]
- Kim, H.; Han, Y.; Song, J.; Song, T.M. Application of social big data to identify trends of school bullying forms in South Korea. Int. J. Environ. Res. Public Health 2019, 16, 2596. [Google Scholar] [CrossRef]
- Lee, Y.-L.; Park, J.-Y. Identification of future signal based on the quantitative and qualitative text mining: A case study on ethical issues in artificial intelligence. Qual. Quant. 2018, 52, 653. [Google Scholar] [CrossRef]
- Ansoff, H.I. Managing strategic surprise by response to weak signals. Calif. Manag. Rev. 1975, 18, 21–33. [Google Scholar] [CrossRef]
- Mannermaa, M. Tulevaisuuden Hallinta—Skenaariot Strategiatyöskentelyssä; WSOY: Porvoo, Finland, 1999; p. 227. [Google Scholar]
- Hiltunen, E. Was It a Wild Card or Just Our Blindness to Gradual Change? J. Future Stud. 2006, 11, 67–74. [Google Scholar]
- Kuosa, T. Heikko signaali vai merkityksetön kohina: Pattern management—Ontologisesti uusi lähestymistapa heikkojen signaalien tarkasteluun ja tulkintaan. Futura 24 2005, 4, 115–120. [Google Scholar]
- Kuusi, O.; Hiltunen, E.; Linturi, H. Heikot tulevaisuussignaalit—Delfoi tutkimus. Futura 19 2000, 2, 78–92. [Google Scholar]
- Petersen, J.L.; Steinmüller, K.H.; Adeyema, H. Wild Cards. In Futures Research Methodology; Version 3.0.; Glenn, J.C., Gordon, T.J., Eds.; With Support from the Rockefeller Foundation. Millennium Project; CDROM. S. i–108; 2019; p. 1300. [Google Scholar]
- Moijanen, M. Heikot signaalit tulevaisuuden tutkimuksessa. Futura 2003, 4, 38–60. [Google Scholar]
- Hiltunen, E. The future sign and its three dimensions. Futures 2008, 40, 247–260. [Google Scholar] [CrossRef]
- Kuusi, O.; Hiltunen, E. The Signification Process of the Future Sign; FFRC eBook 4/2007; Finland Futures Research Centre, Turku School of Economics: Turku, Finland, 2007; p. 24. [Google Scholar]
- Kim, H.; Ahn, S.-J.; Jung, W.-S. Horizon scanning in policy research database with a probabilistic topic model. Technol. Forecast. Soc. Chang. 2019, 146, 588–594. [Google Scholar] [CrossRef]
- Blei, D.M. Probabilistic topic models. Commun. ACM 2012, 55, 77–84. [Google Scholar] [CrossRef]
- Yu, C.H.; Jannasch-Pennell, A.; DiGangi, S. Compatibility between Text Mining and Qualitative Research in the Perspectives of Grounded Theory, Content Analysis, and Reliability. Qual. Rep. 2011, 16, 730–744. [Google Scholar]
- Welbers, K.; Van Atteveldt, W.; Benoit, K. Text analysis in R. Commun. Methods Meas. 2017, 11, 245–265. [Google Scholar] [CrossRef]
- ISO 19152:2012. Geographic information—Land Administration Domain Model (LADM); The International Organization for Standardization: Geneva, Switzerland, 2012. [Google Scholar]
- UN Sustainable Development Goals. Available online: https://www.un.org/sustainabledevelopment/poverty (accessed on 1 November 2019).
- Yleisradio: Permission Needed for Foreign Residents to Buy Property in Finland from 2020. Available online: https://yle.fi/uutiset/osasto/news/permission_needed_for_foreign_residents_to_buy_property_in_finland_from_2020/11043532 (accessed on 5 November 2019).
- Olfat, H.; Jani, A.; Shojaei, D.; Darvill, A.; Briffa, M.; Rajabifard, A.; Badiee, F. Tackling the challenges of visualizing digital cadastral plans: The Victorian cadastre experience. Land Use Policy 2019, 83, 84–94. [Google Scholar] [CrossRef]
- Hjelmblom, M.; Paasch, J.M.; Paulsson, J.; Edlund, M.; Bökman, F. Towards Automation of the Swedish Property Formation Process: A structural and logical analysis of property subdivision. Nord. J. Surv. Real Estate Res. 2019, 14, 29–63. [Google Scholar]
- Bornmann, L.; Mutz, R. Growth rates of modern science: A bibliometric analysis based on the number of publications and cited references. J. Assoc. Inf. Sci. Technol. 2015, 66, 2215–2222. [Google Scholar] [CrossRef]
- Hiltunen, E. Good sources of weak signals: A global study of where futurists look for weak signals. J. Futures Stud. 2008, 12, 21–44. [Google Scholar]
| 1 | To avoid any confusion, we note that terms “keyword”, “search keyword”, and “author keyword” have specific meanings in this paper. The first one refers to words identified through the analysis, the second one to words used as search parameters in the document retrieval, and the third one to words nominated by the document authors as the best words to describe the content of document. |
© 2019 by the authors. Licensee MDPI, Basel, Switzerland. This article is an open access article distributed under the terms and conditions of the Creative Commons Attribution (CC BY) license (http://creativecommons.org/licenses/by/4.0/).