Welfare Effect Evaluation of Land-Lost Farmers’ Households under Different Livelihood Asset Allocation


Abstract
1. Introduction
1.1. Research Background and Significance
1.2. Aims of the Study
2. Literature Review
2.1. Research Progress on the Welfare Effect of Land-Lost Farmers
2.2. Research Progress on the Measurement Methods of Land-Lost Farmers’ Welfare
2.2.1. Research Progress on the Cloud Model
2.2.2. Research Progress on the AHP-Entropy Weight Method
2.3. Critical Missing Aspects
3. Material and Methods
3.1. Selection of Indicators
3.1.1. Construction of a Quantitative Indicator System for the Livelihood Assets of Land-Lost Farmers’ Household
3.1.2. Construction of Evaluation Index System for the Welfare Effect of Land-Lost Farmers’ Households
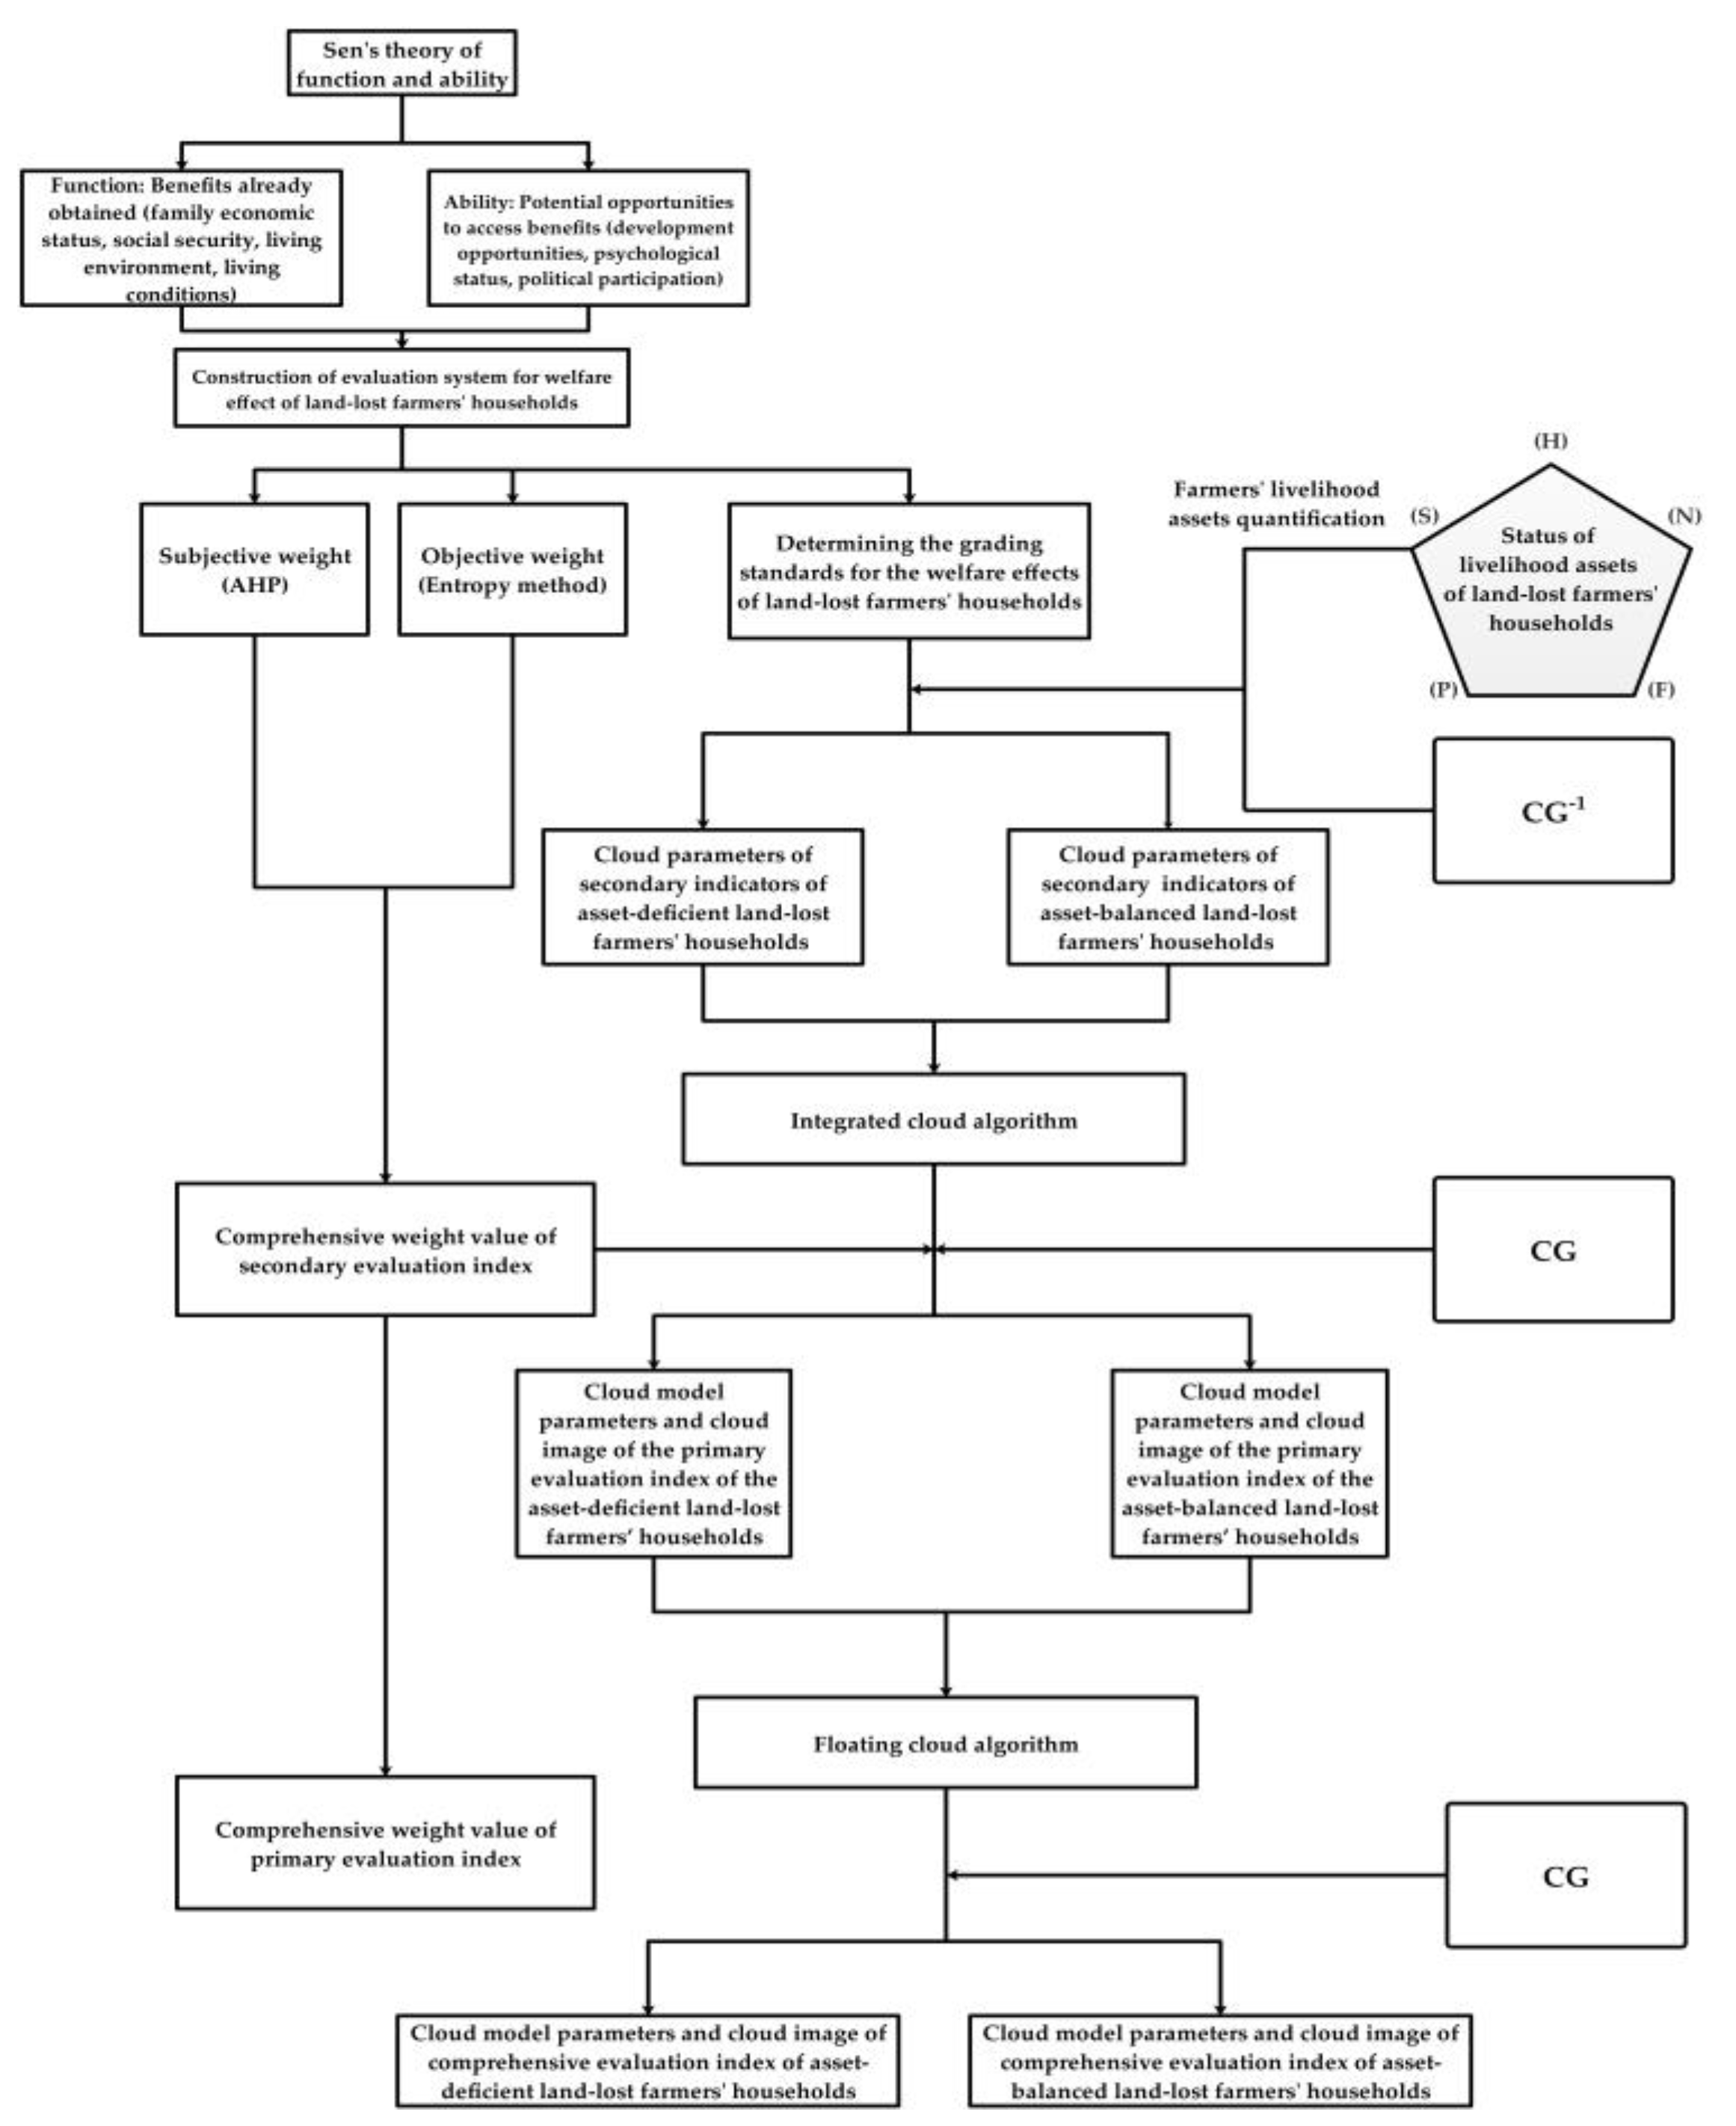
3.2. Empirical Research Methods for the Welfare Effects of Land-Lost Farmers’ Households
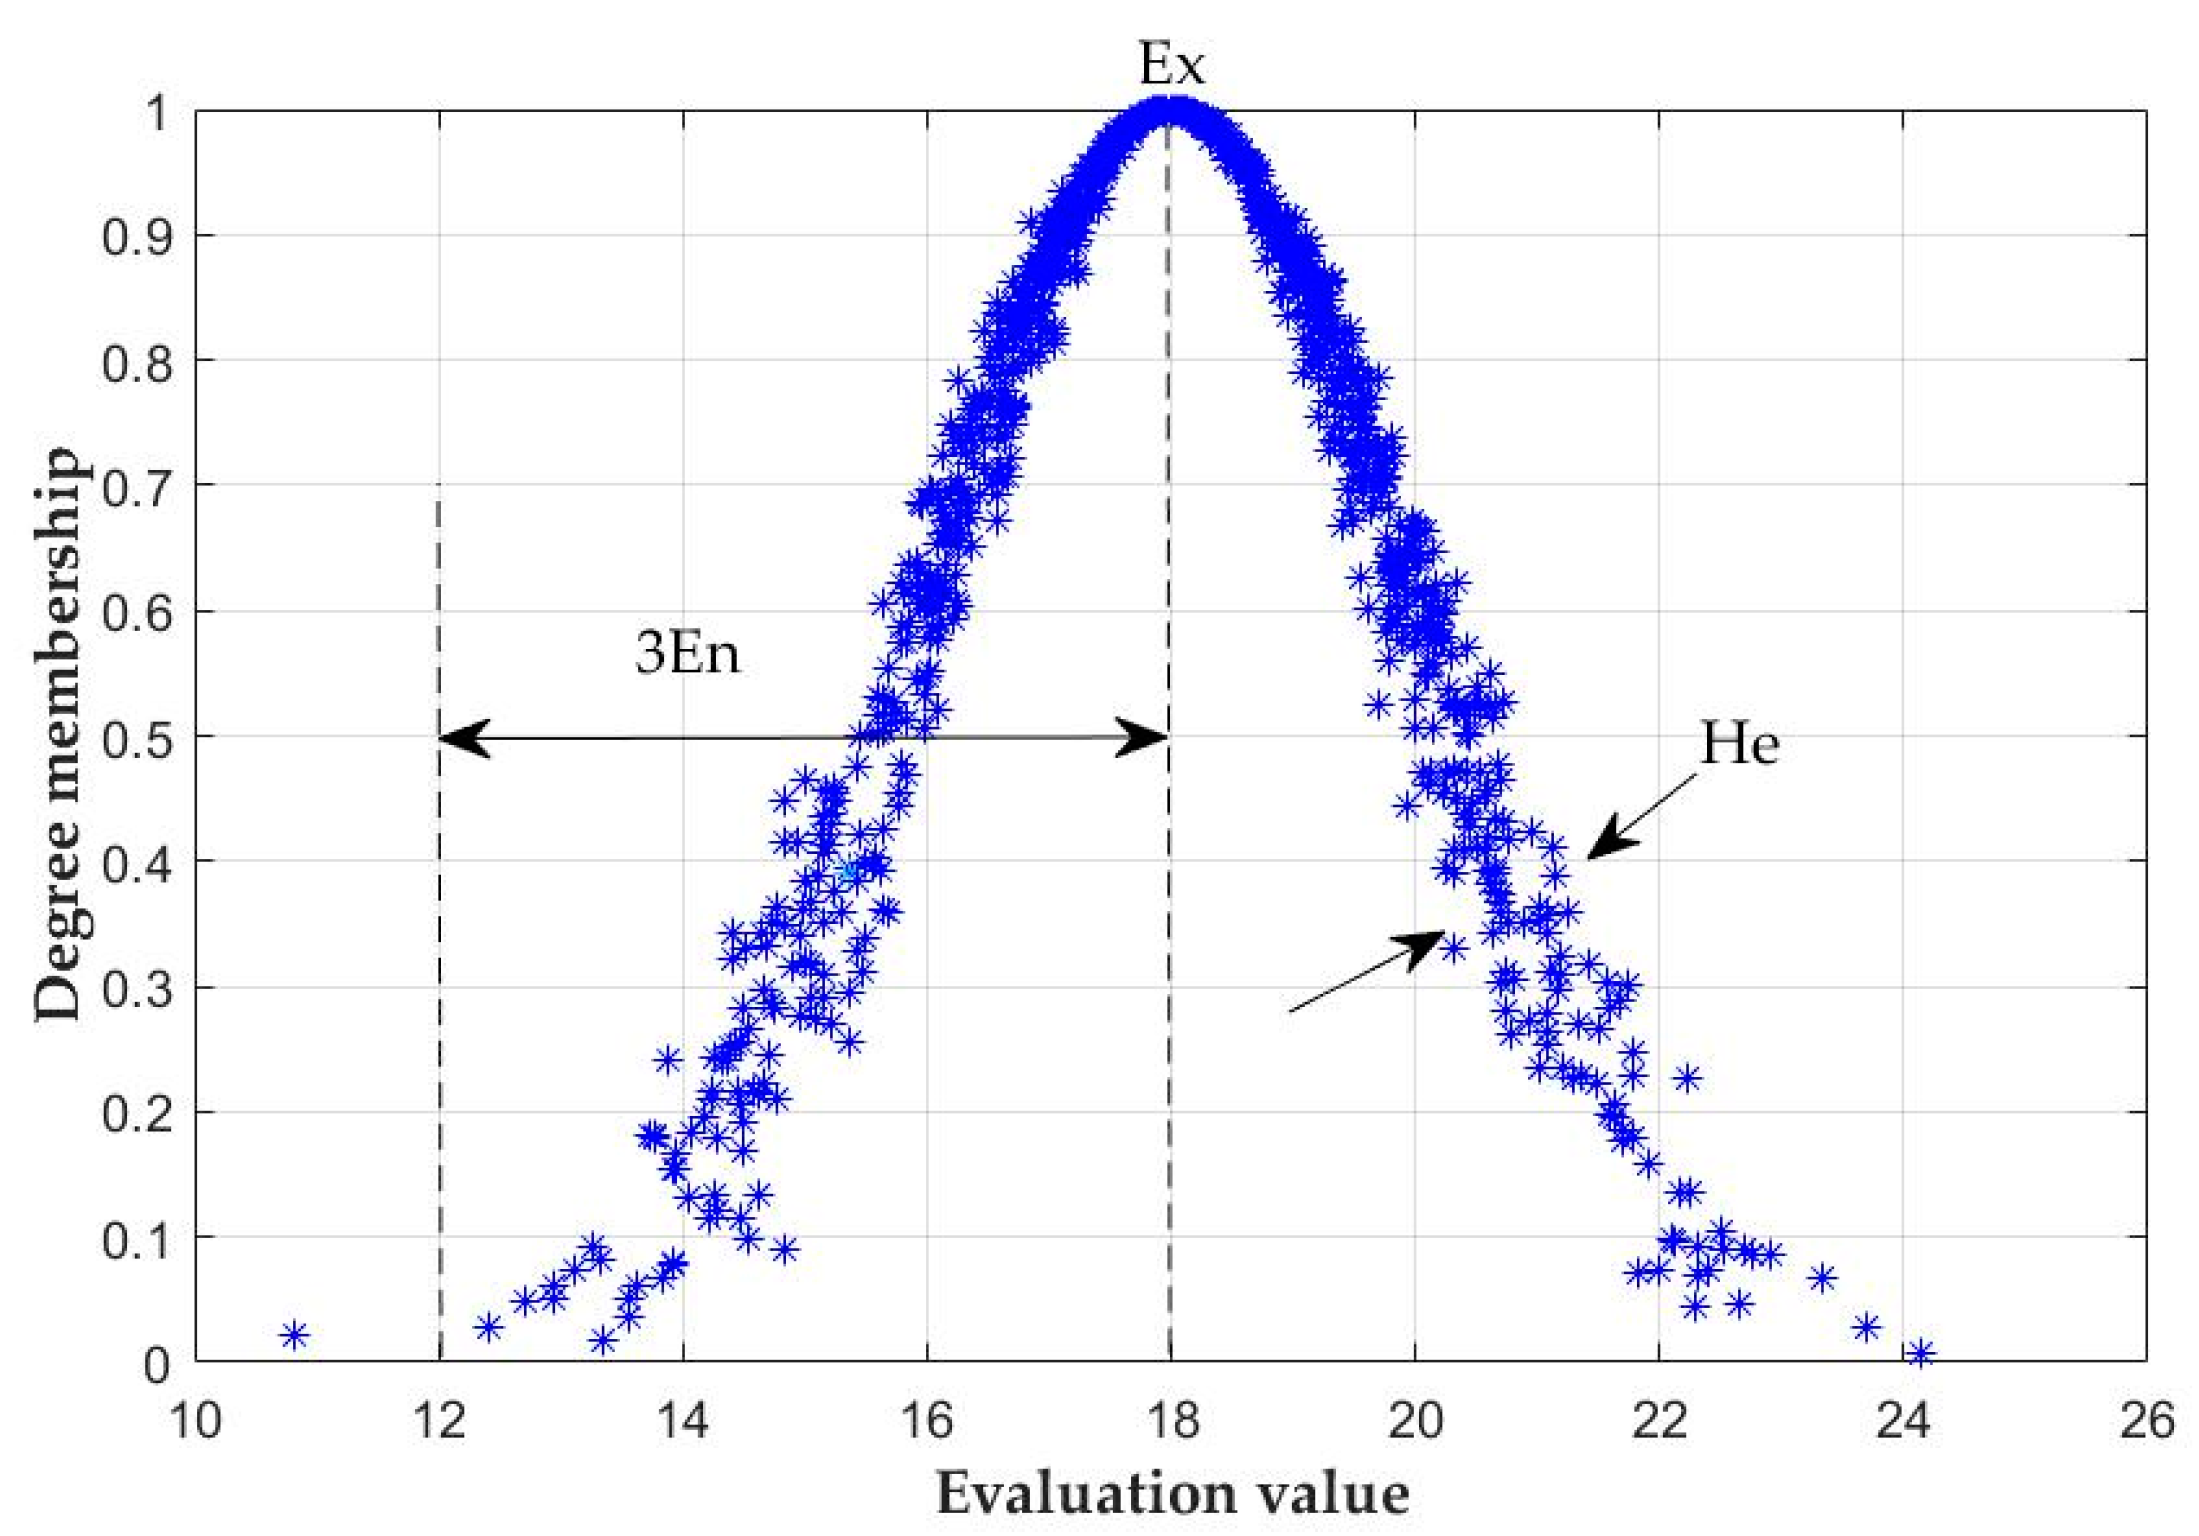
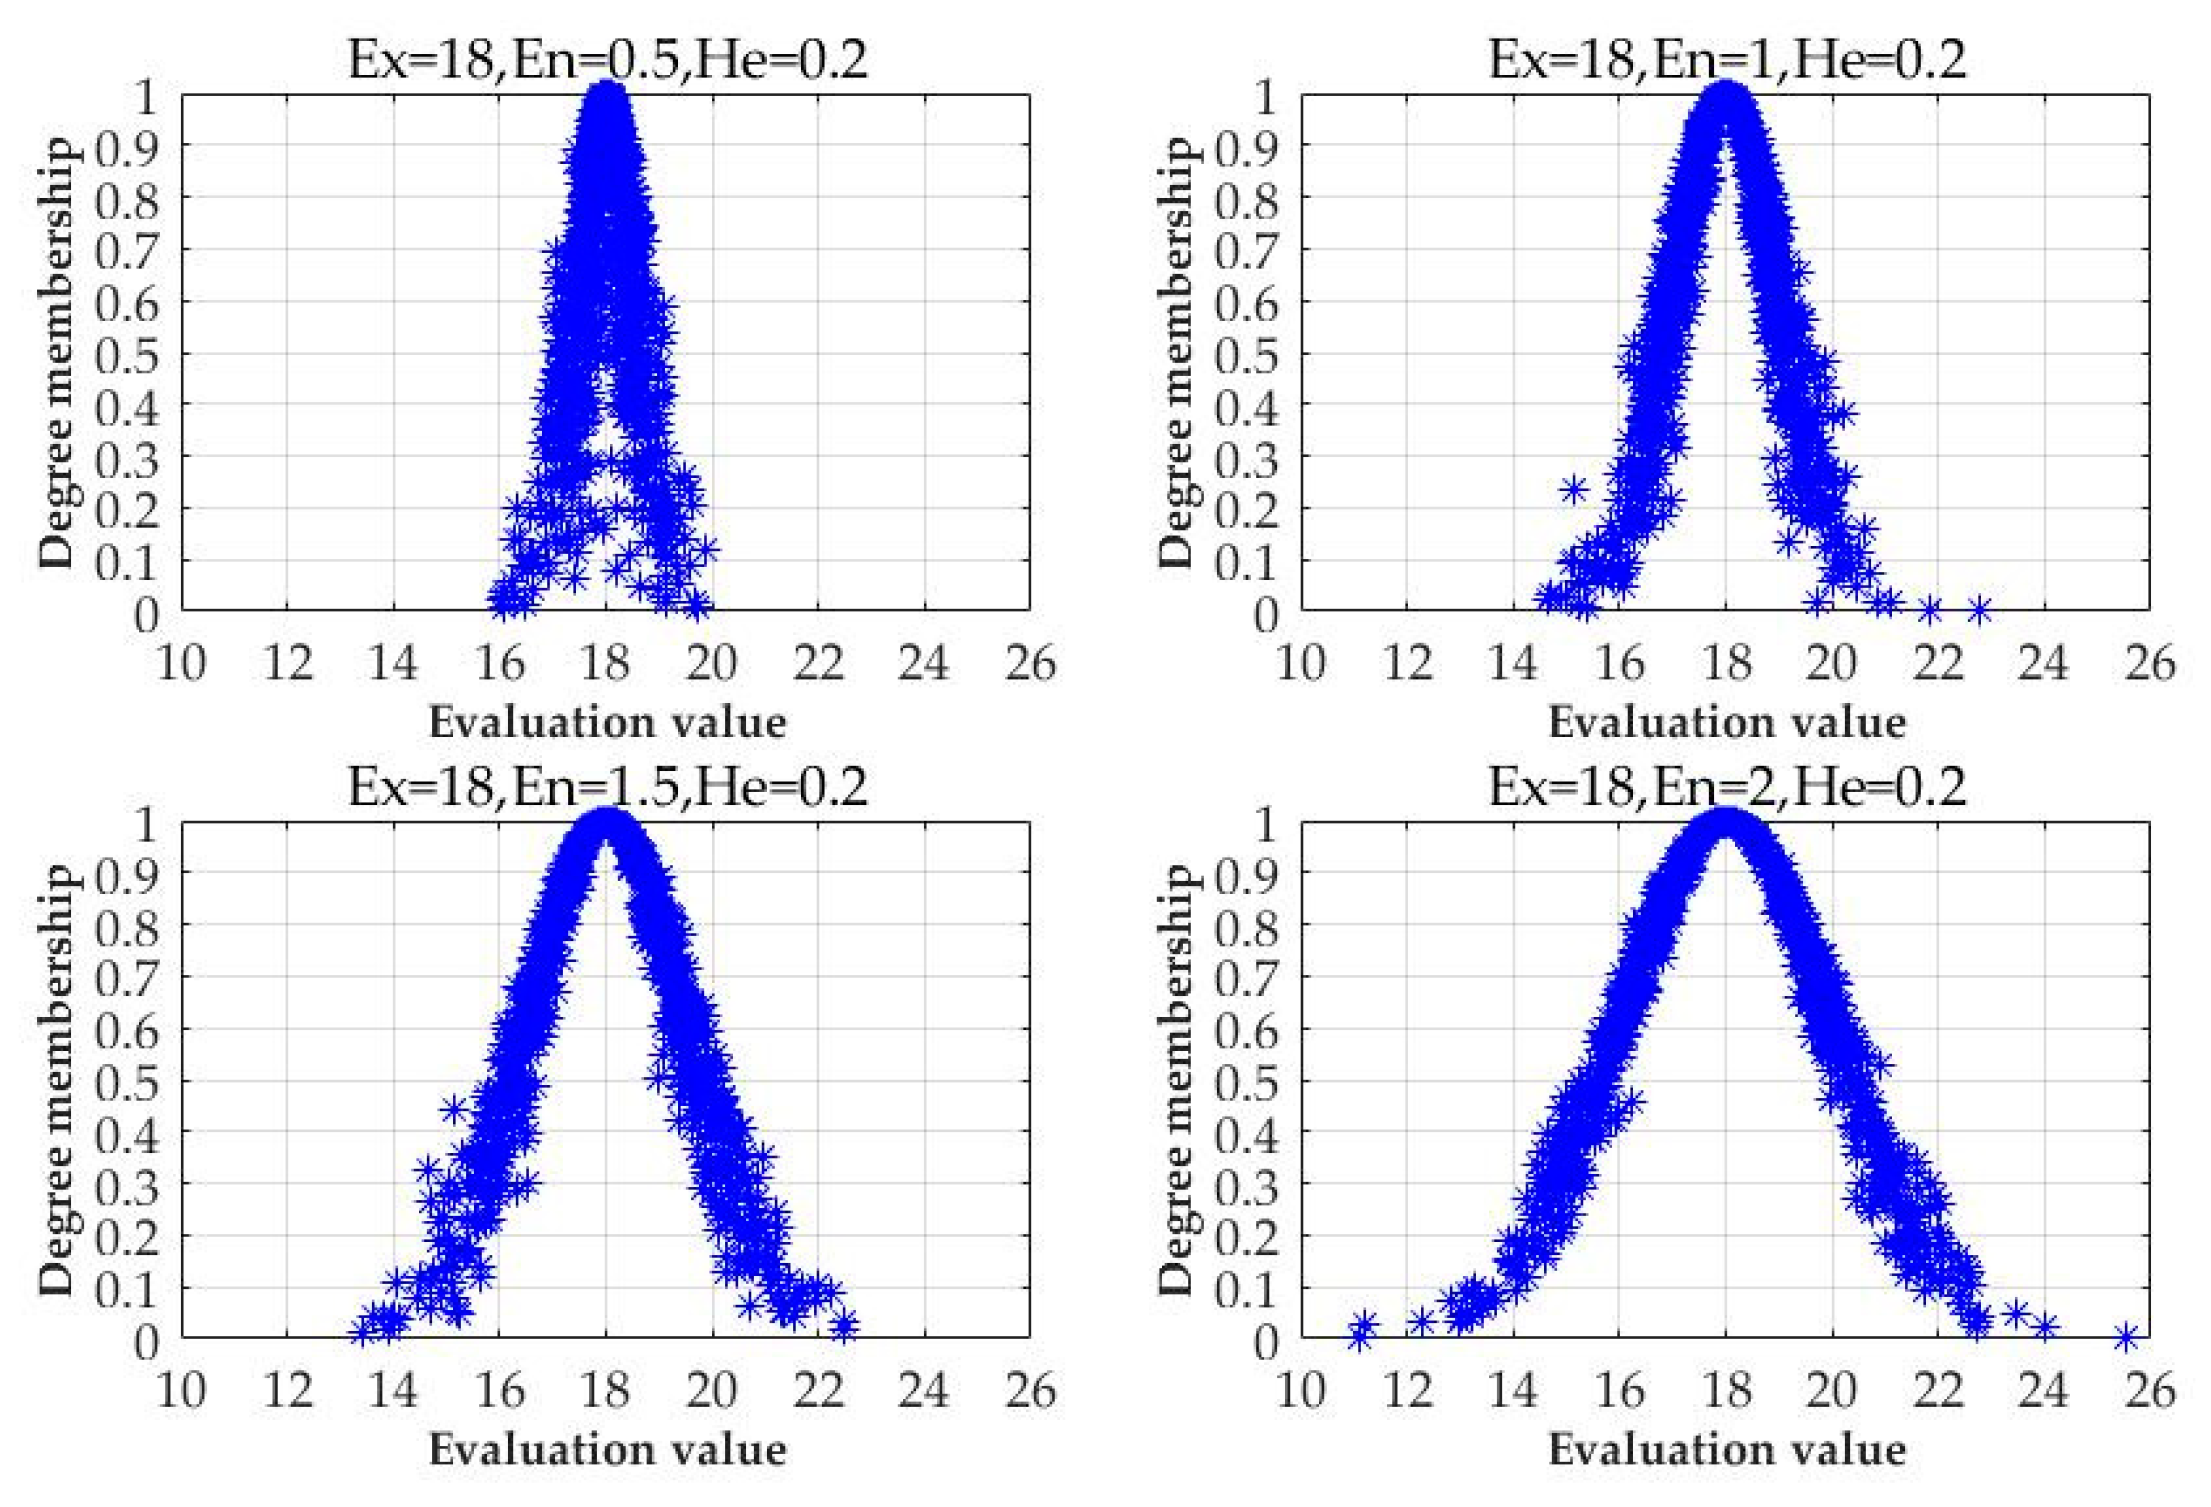
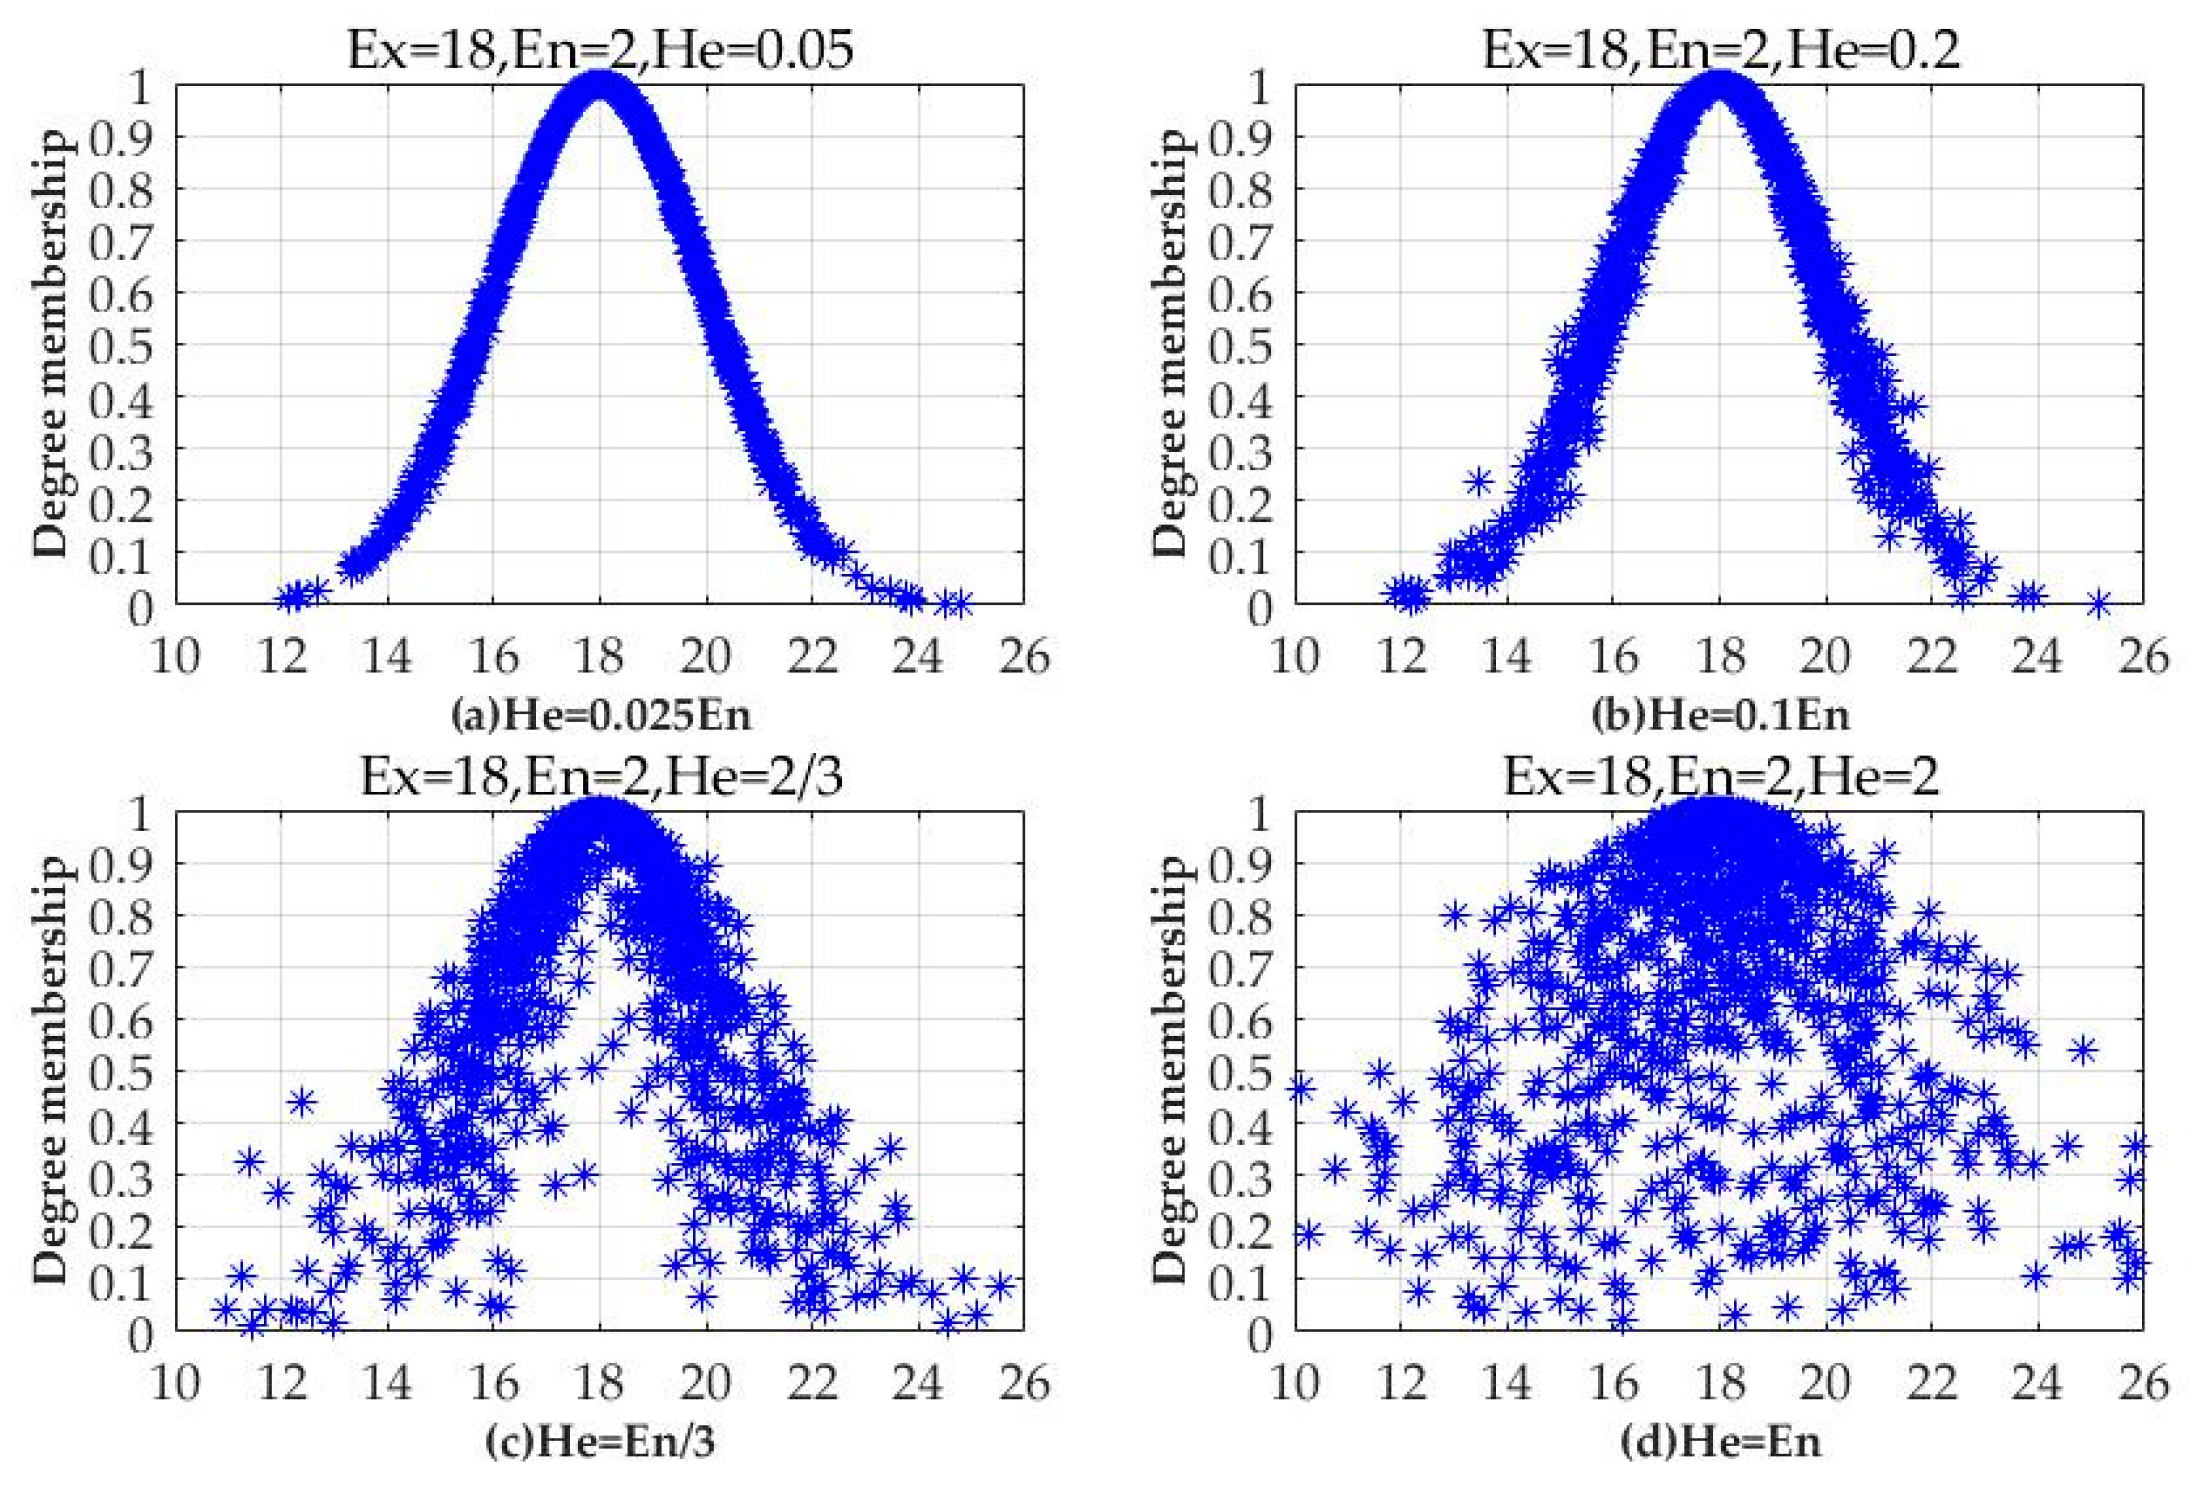
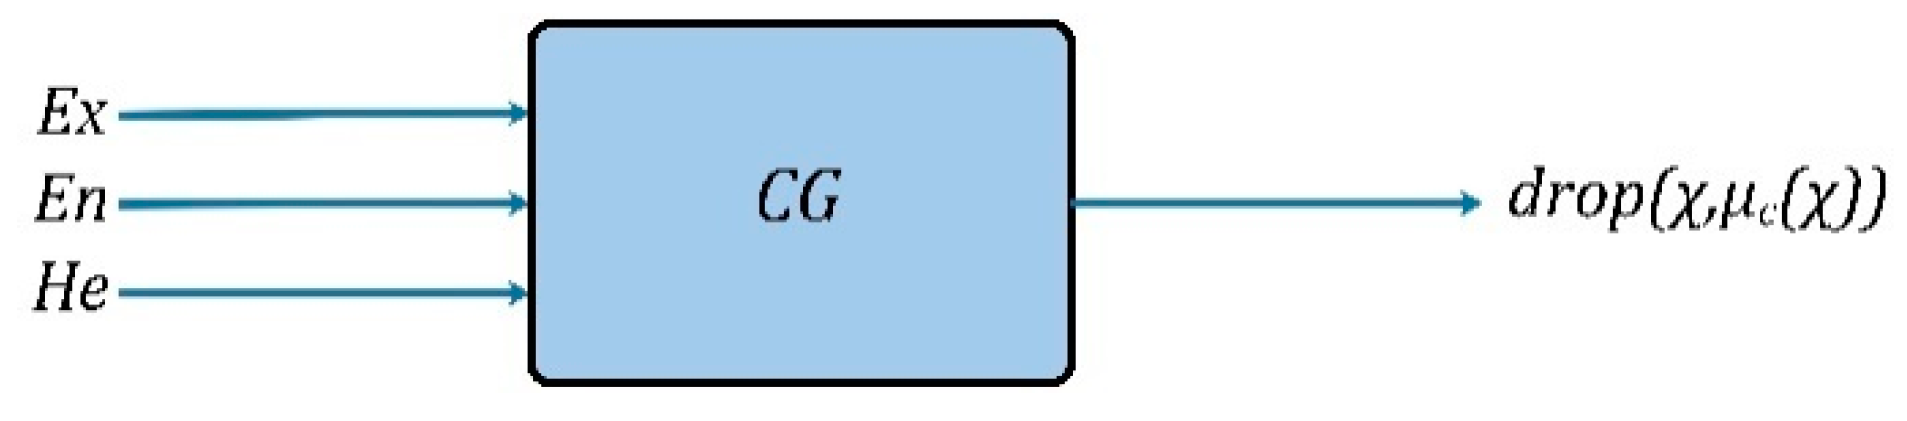
3.2.1. Establishment of the Cloud Model Evaluation Method
3.2.2. Determination of Index Weights Based on the AHP-Entropy Weight Method
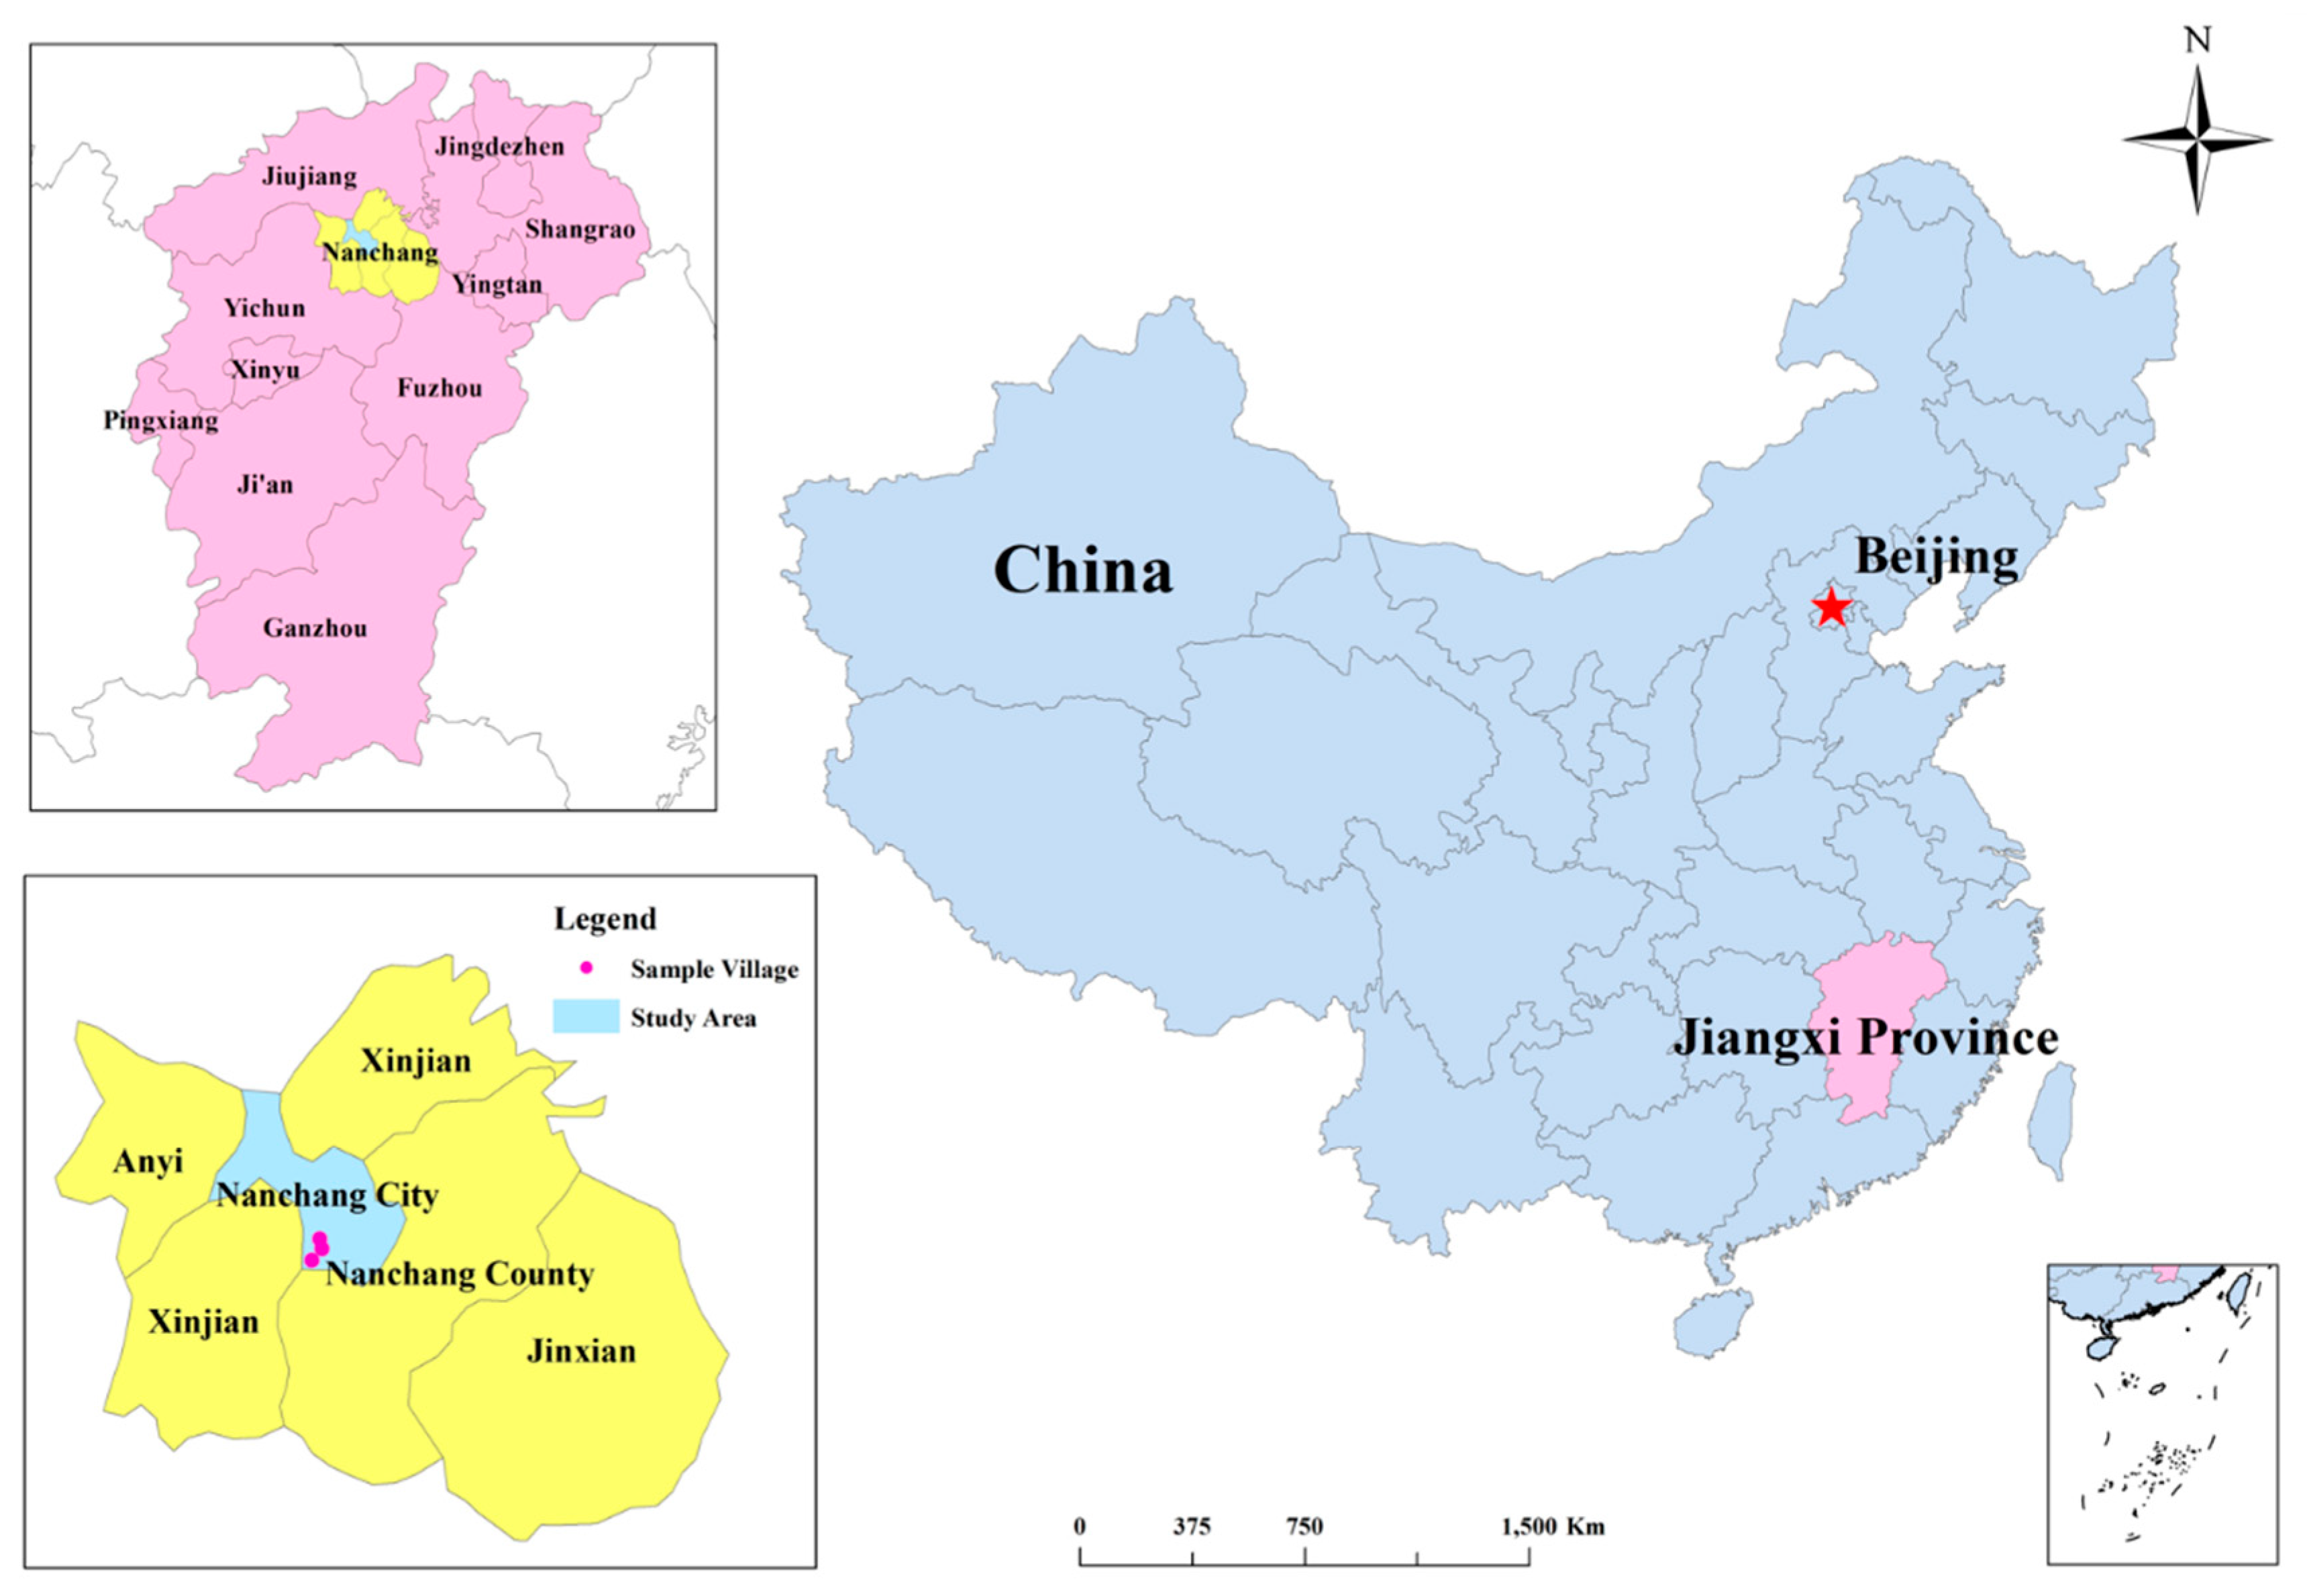
3.3. Research Area and Data Source
4. Results and Analysis
4.1. Operation Process of Welfare Evaluation of Land-Lost Farmers’ Households
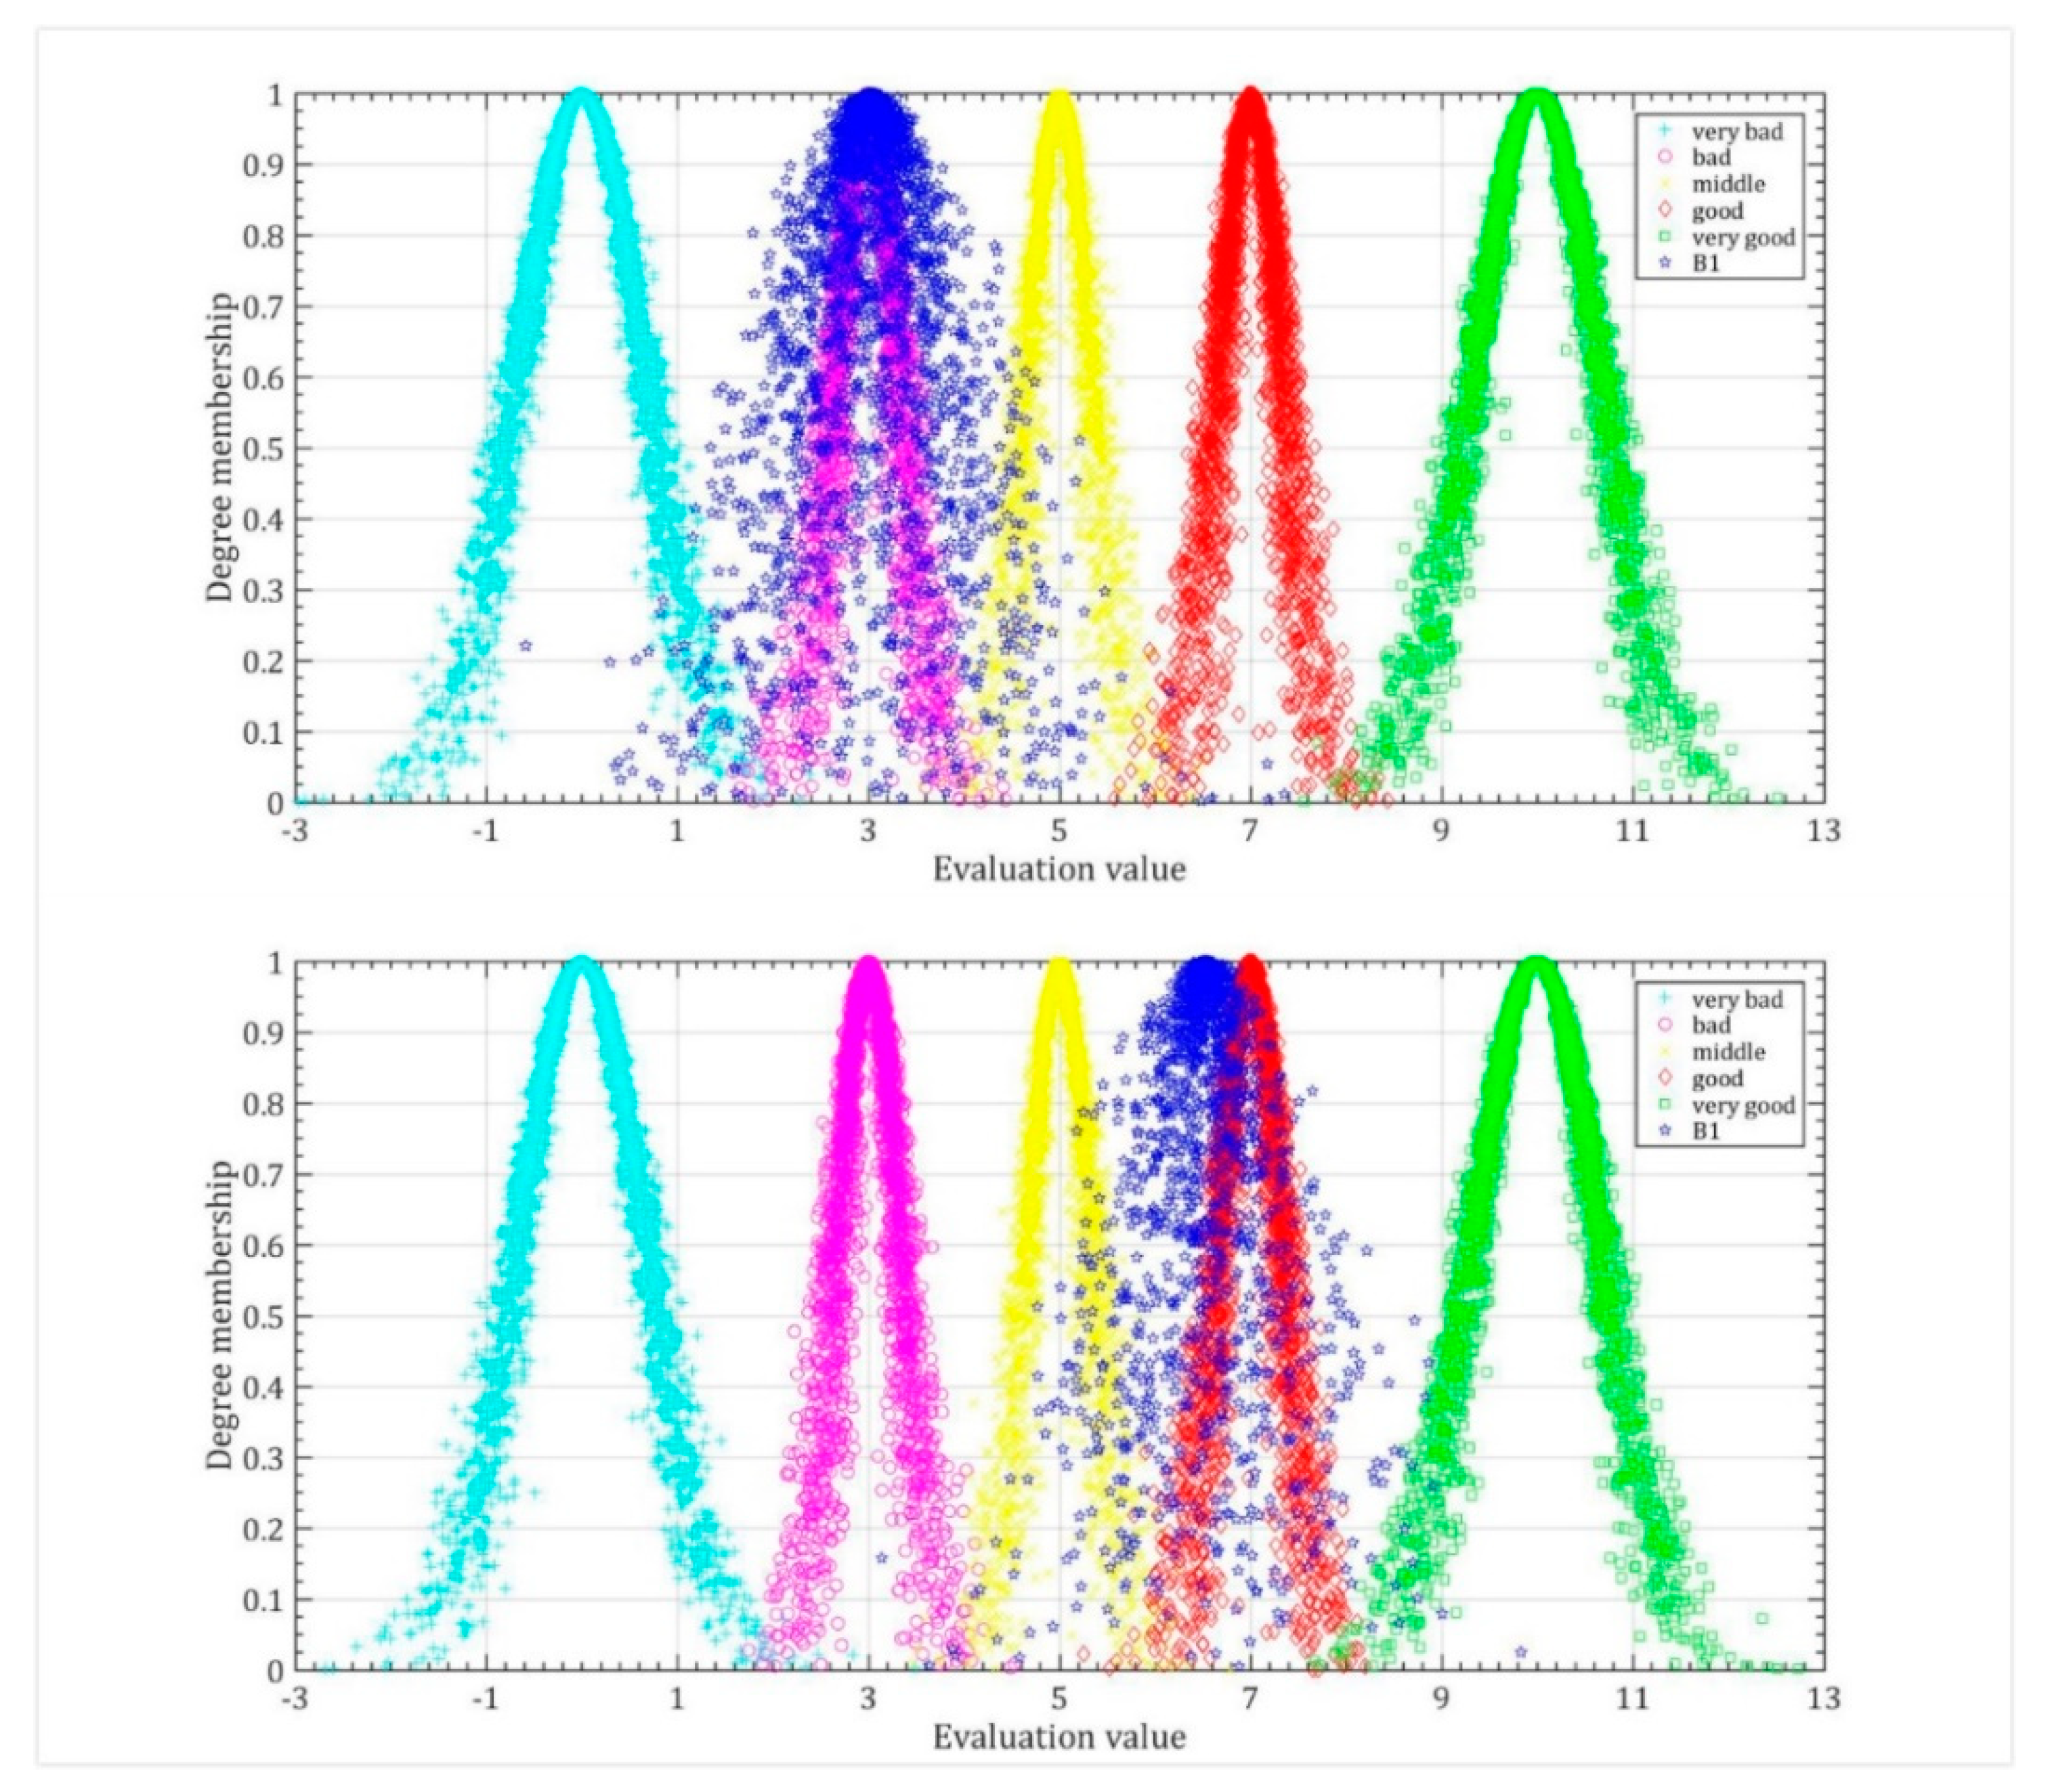
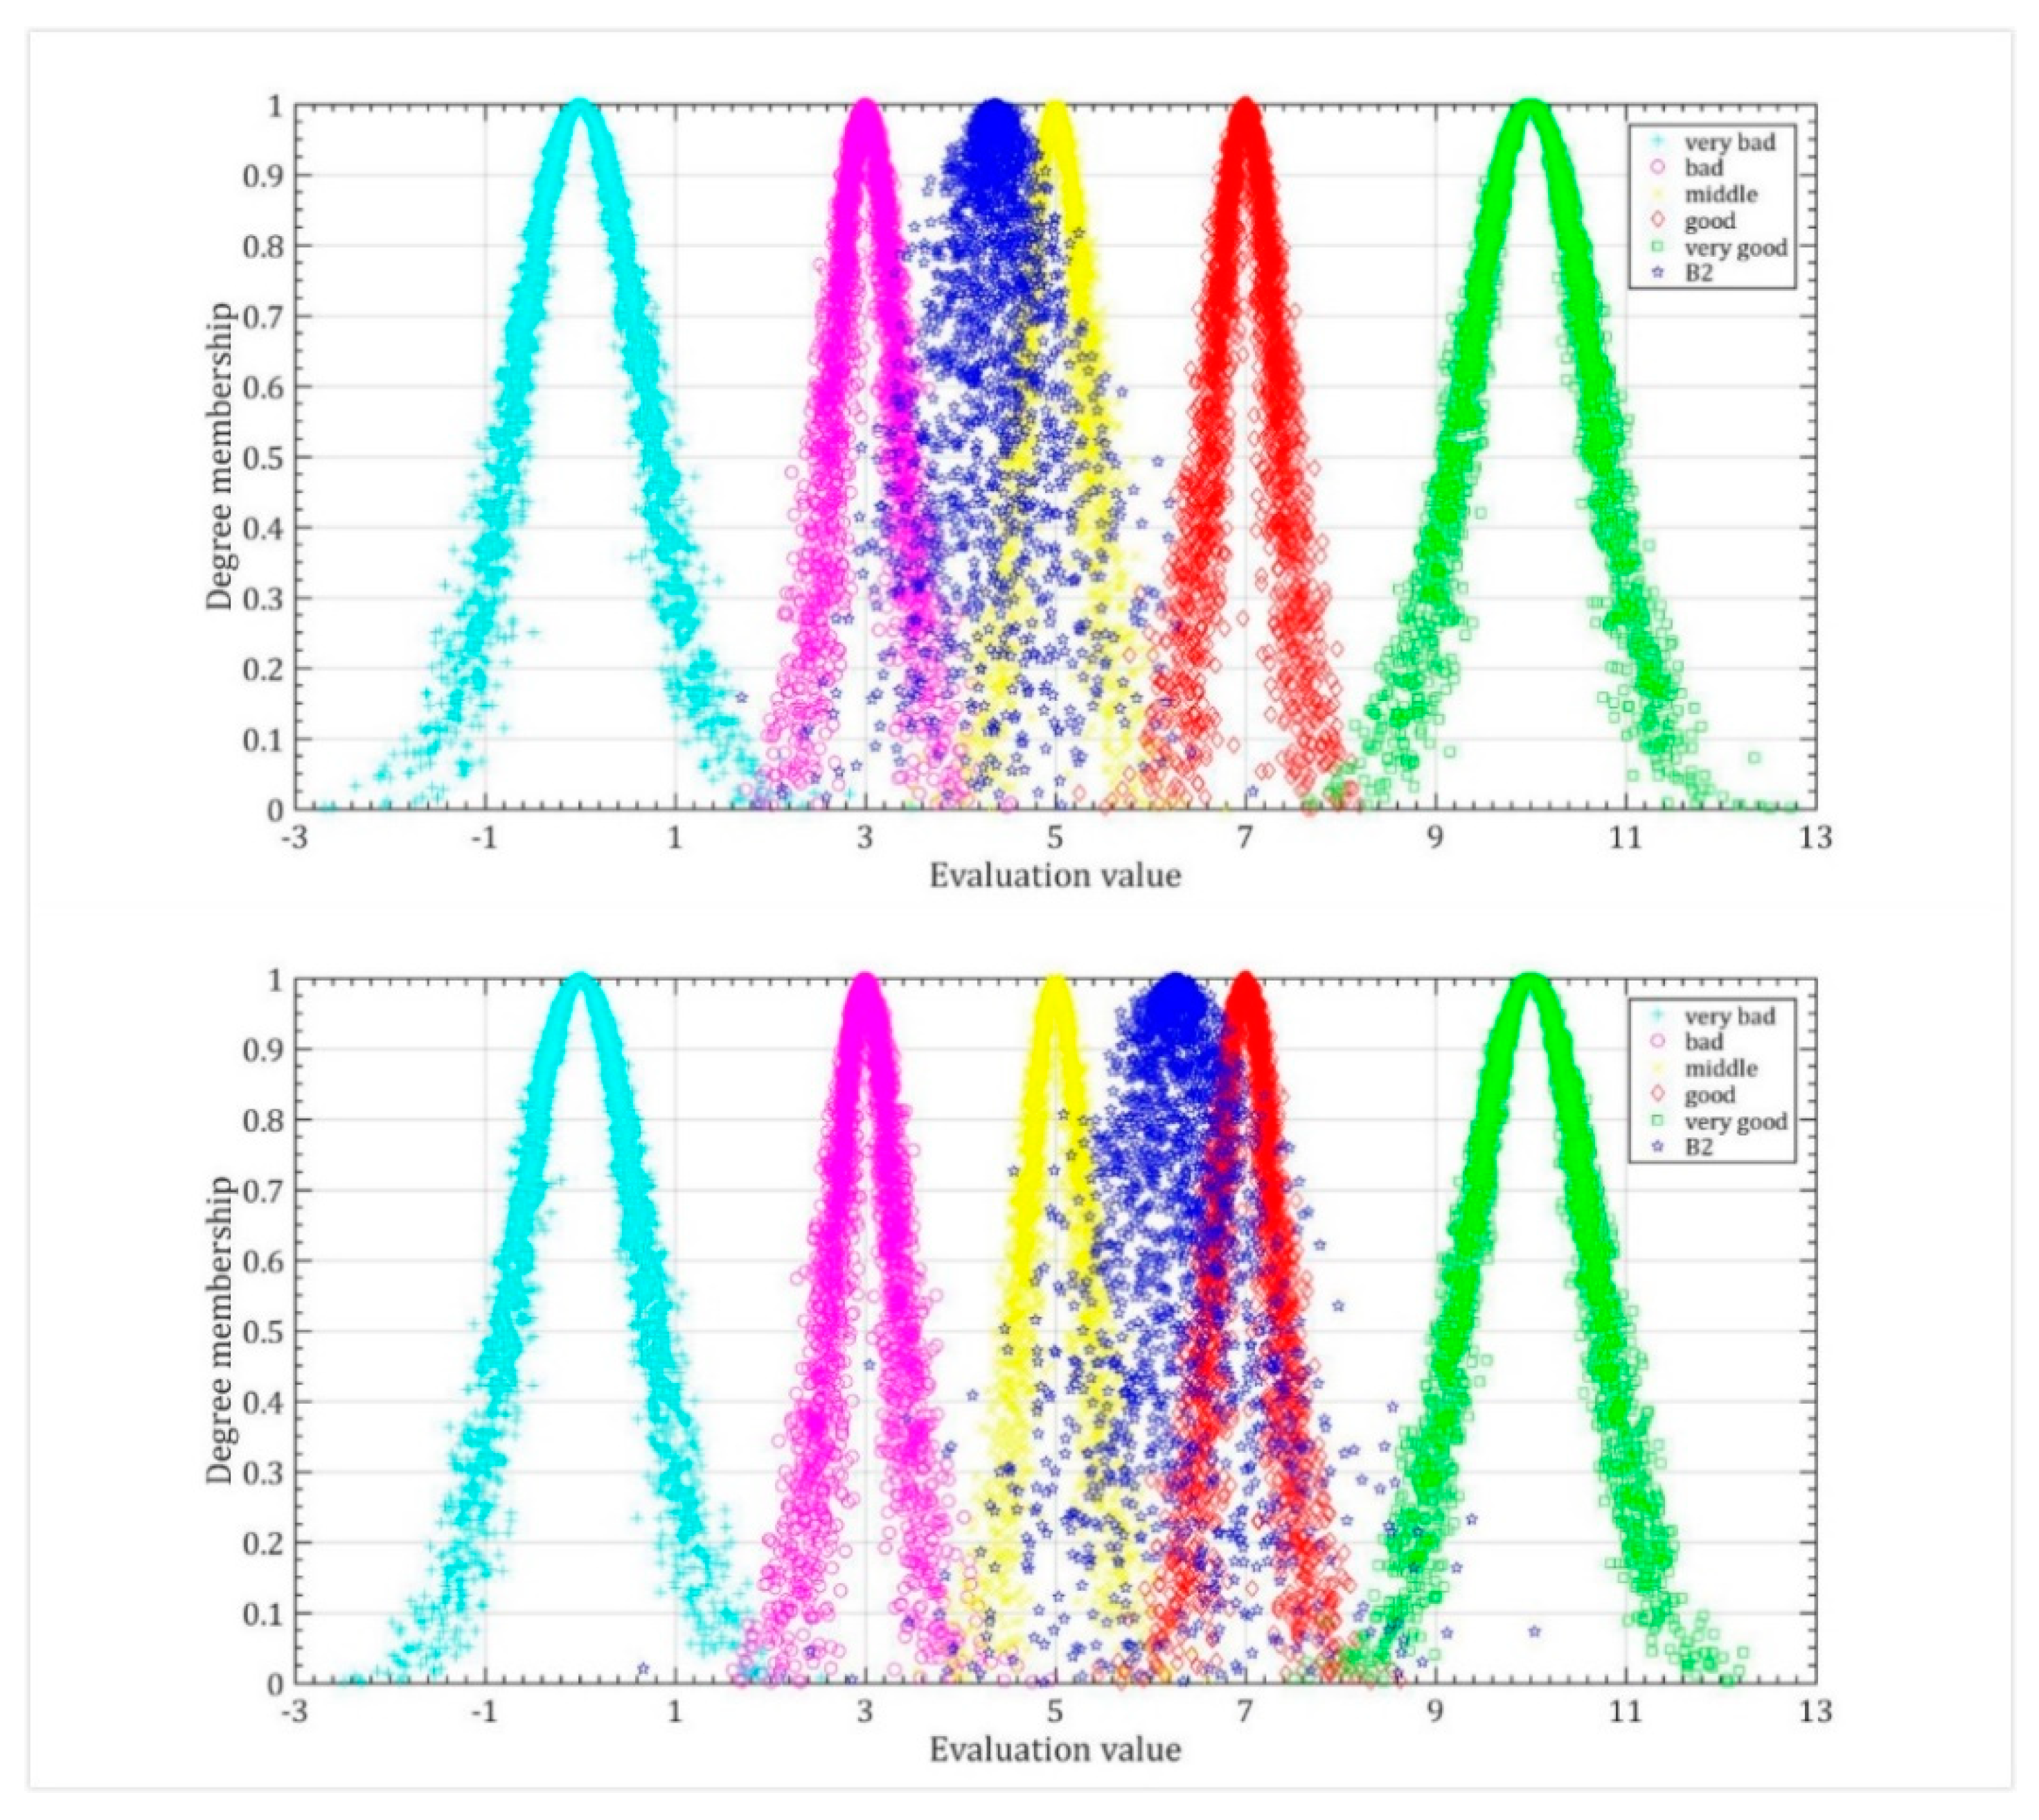
4.1.1. Establishment of the Comment Set Cloud Model
4.1.2. Classification of Land-Lost Farmers’ Households under Different Livelihood Asset Allocations
4.1.3. Determination of Indicator Weights
0.013, 0.0012, 0.0021, 0.0012, 0.0116, 0.0022, 0.0076, 0.1096, 0.0372, 0.0157, 0.0082, 0.0899,
0.0058, 0.0052, 0.005, 0.0168, 0.0276, 0.0049, 0.0143, 0.0951, 0.0248, 0.0332)
0.0060, 0.0053, 0.0317, 0.0092, 0.0071, 0.0690, 0.0259, 0.0818, 0.1765, 0.0215, 0.1113, 0.0305,
0.0321, 0.0167, 0.0036, 0.0070, 0.0391, 0.0030, 0.0030, 0.0269, 0.0030, 0.0196)
0.0215, 0.0097, 0.0734, 0.0349, 0.0096, 0.0133, 0.0478, 0.0387, 0.0398, 0.0271, 0.0089, 0.0198,
0.0205, 0.0208, 0.0219, 0.0138, 0.0344, 0.0221, 0.0157, 0.0393, 0.0512)
0.0592, 0.0336, 0.0170, 0.0237, 0.0520, 0.0333, 0.0204, 0.0232, 0.0220, 0.0399, 0.0256, 0.0143,
0.0366, 0.0164, 0.0167, 0.0295, 0.0250, 0.0171, 0.0239, 0.0175, 0.0147, 0.0505)
0.0144, 0.0008, 0.0006, 0.0026, 0.0120, 0.0006, 0.0030, 0.1554, 0.0427, 0.0185, 0.0066, 0.0236,
0.0034, 0.0032, 0.0031, 0.0109, 0.0113, 0.0050, 0.0094, 0.0443, 0.0289, 0.0504)
0.0135, 0.0068, 0.0205, 0.0083, 0.0141, 0.0876, 0.0201, 0.0722, 0.1480, 0.0327, 0.1087, 0.0166,
0.0448, 0.0104, 0.0023, 0.0079, 0.0372, 0.0020, 0.0027, 0.0179, 0.0017, 0.0377)
4.1.4. Cloud Model Parameters of Secondary Evaluation Indicators for the Welfare Effects of Land-Lost Farmers’ Households
4.1.5. Cloud Model Parameters of Primary Evaluation Indicators for the Welfare Effects of Land-Lost Farmers’ Households
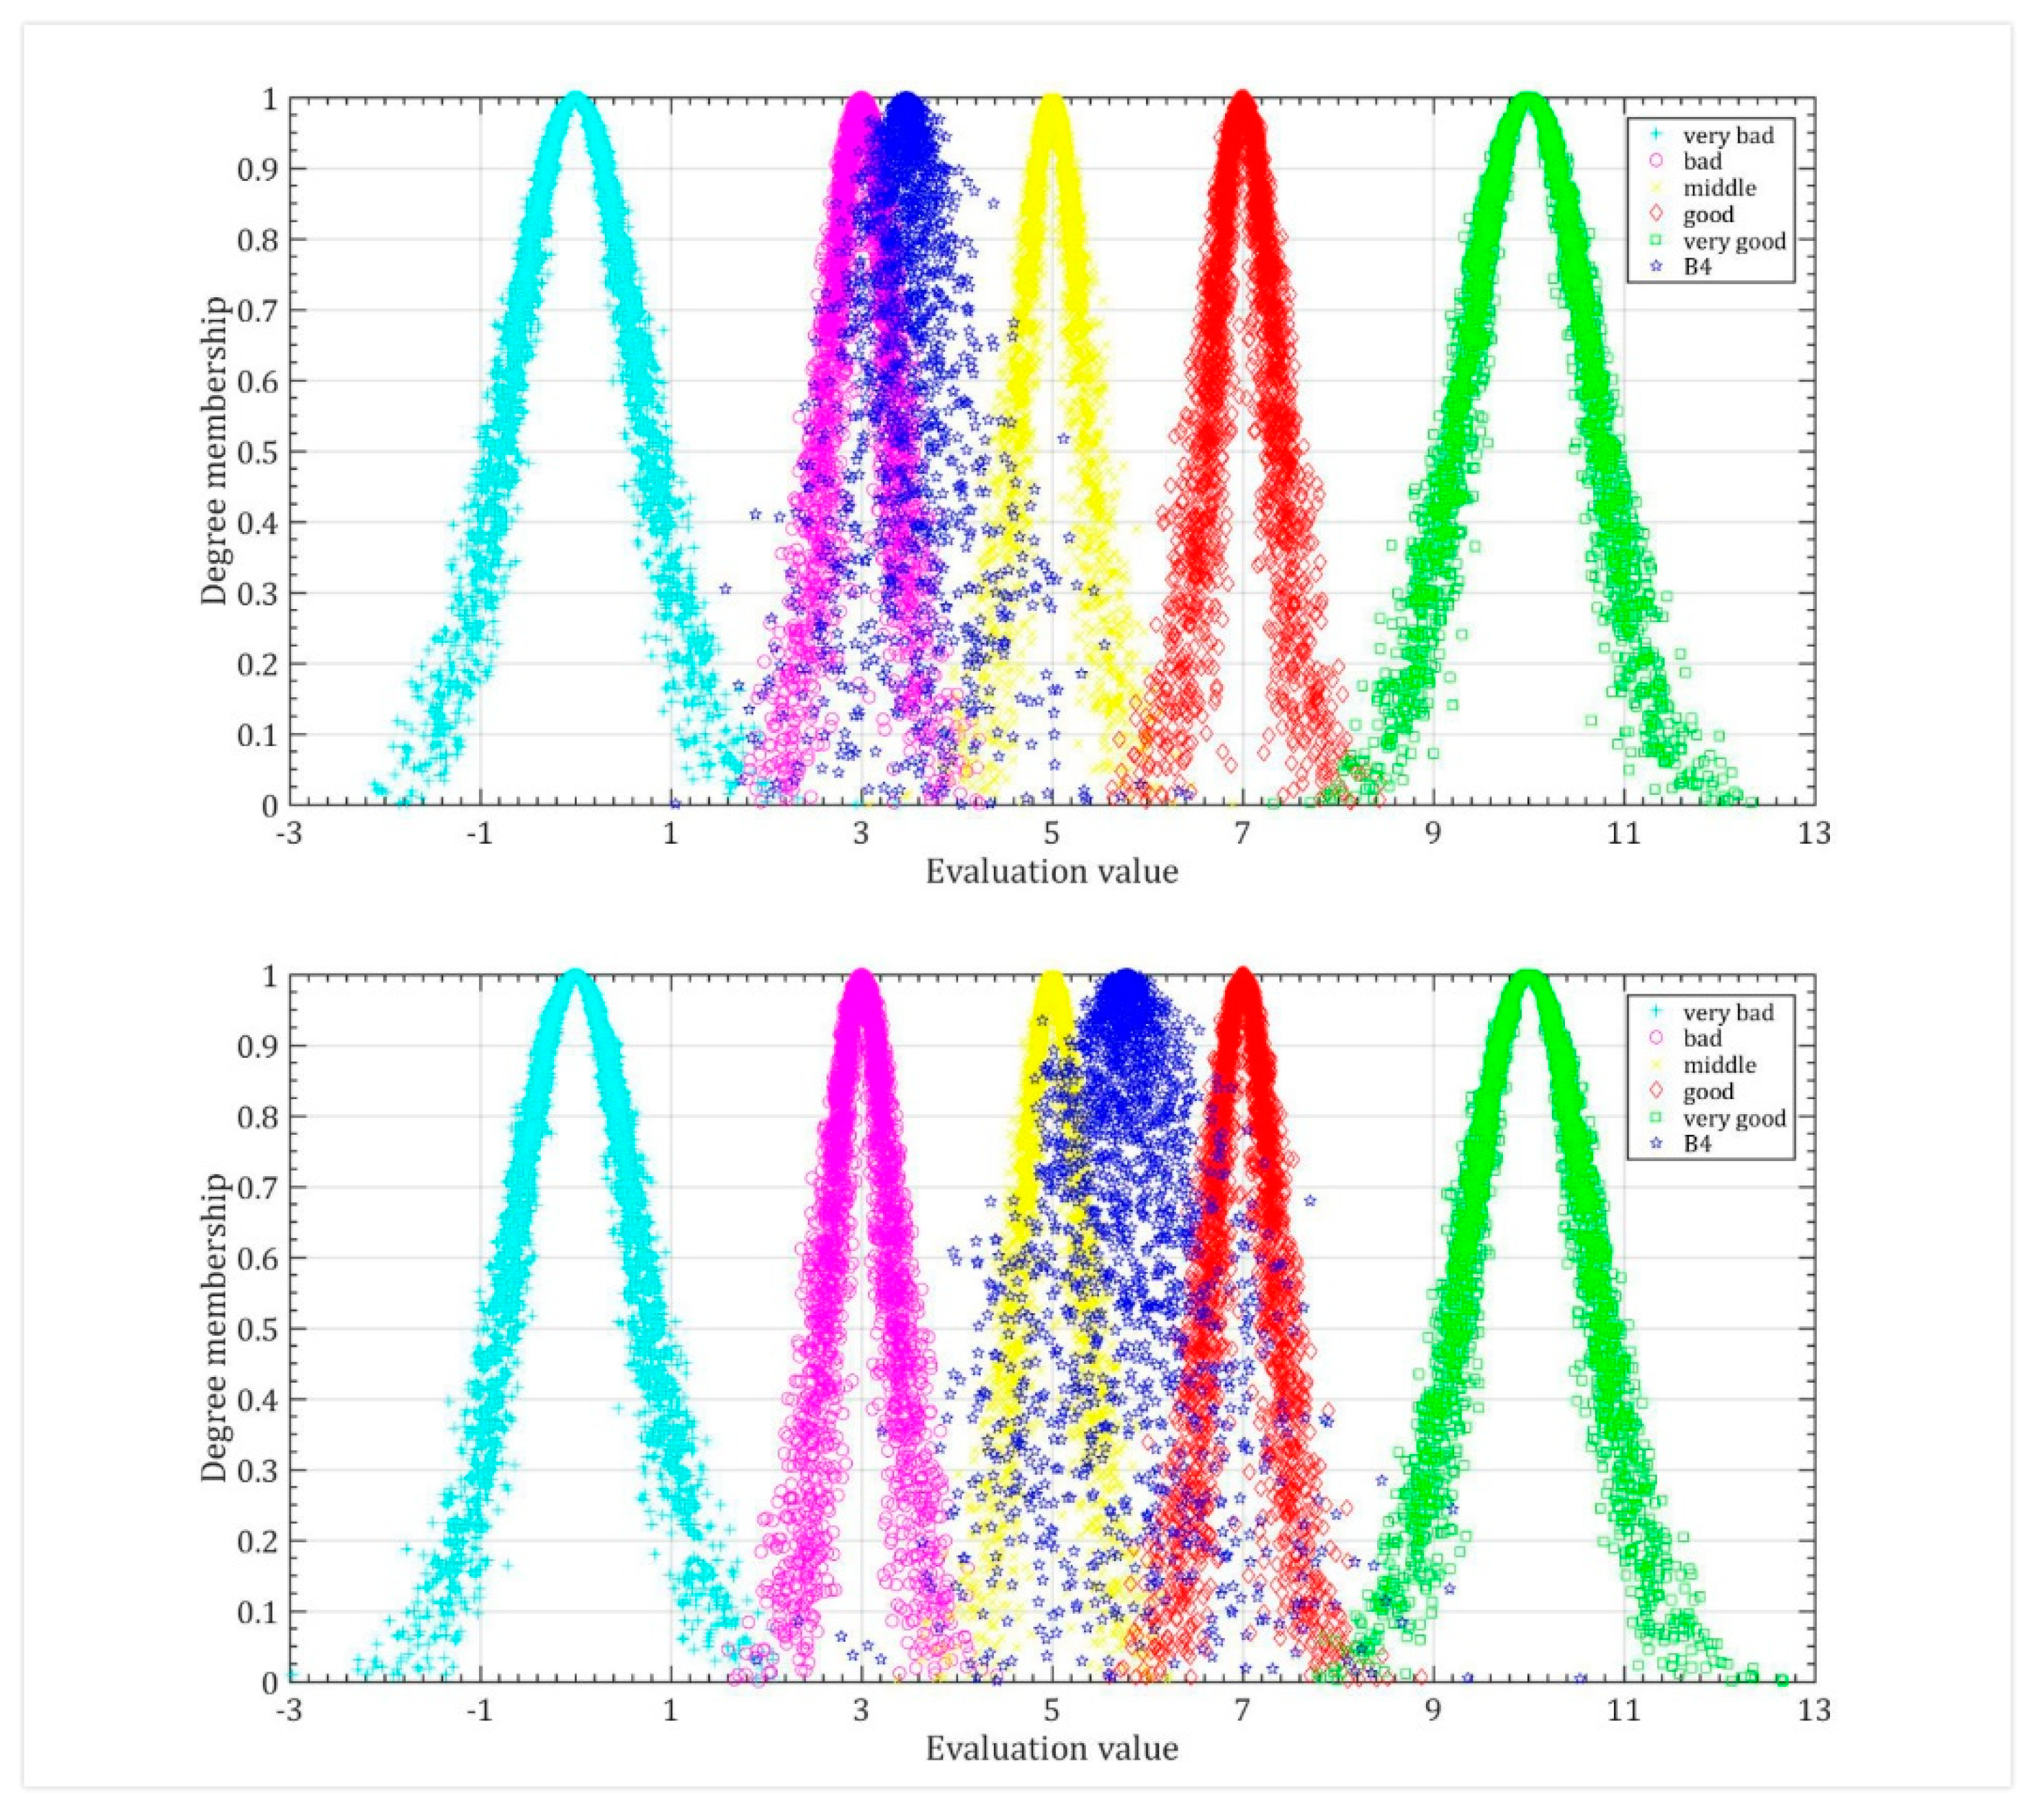
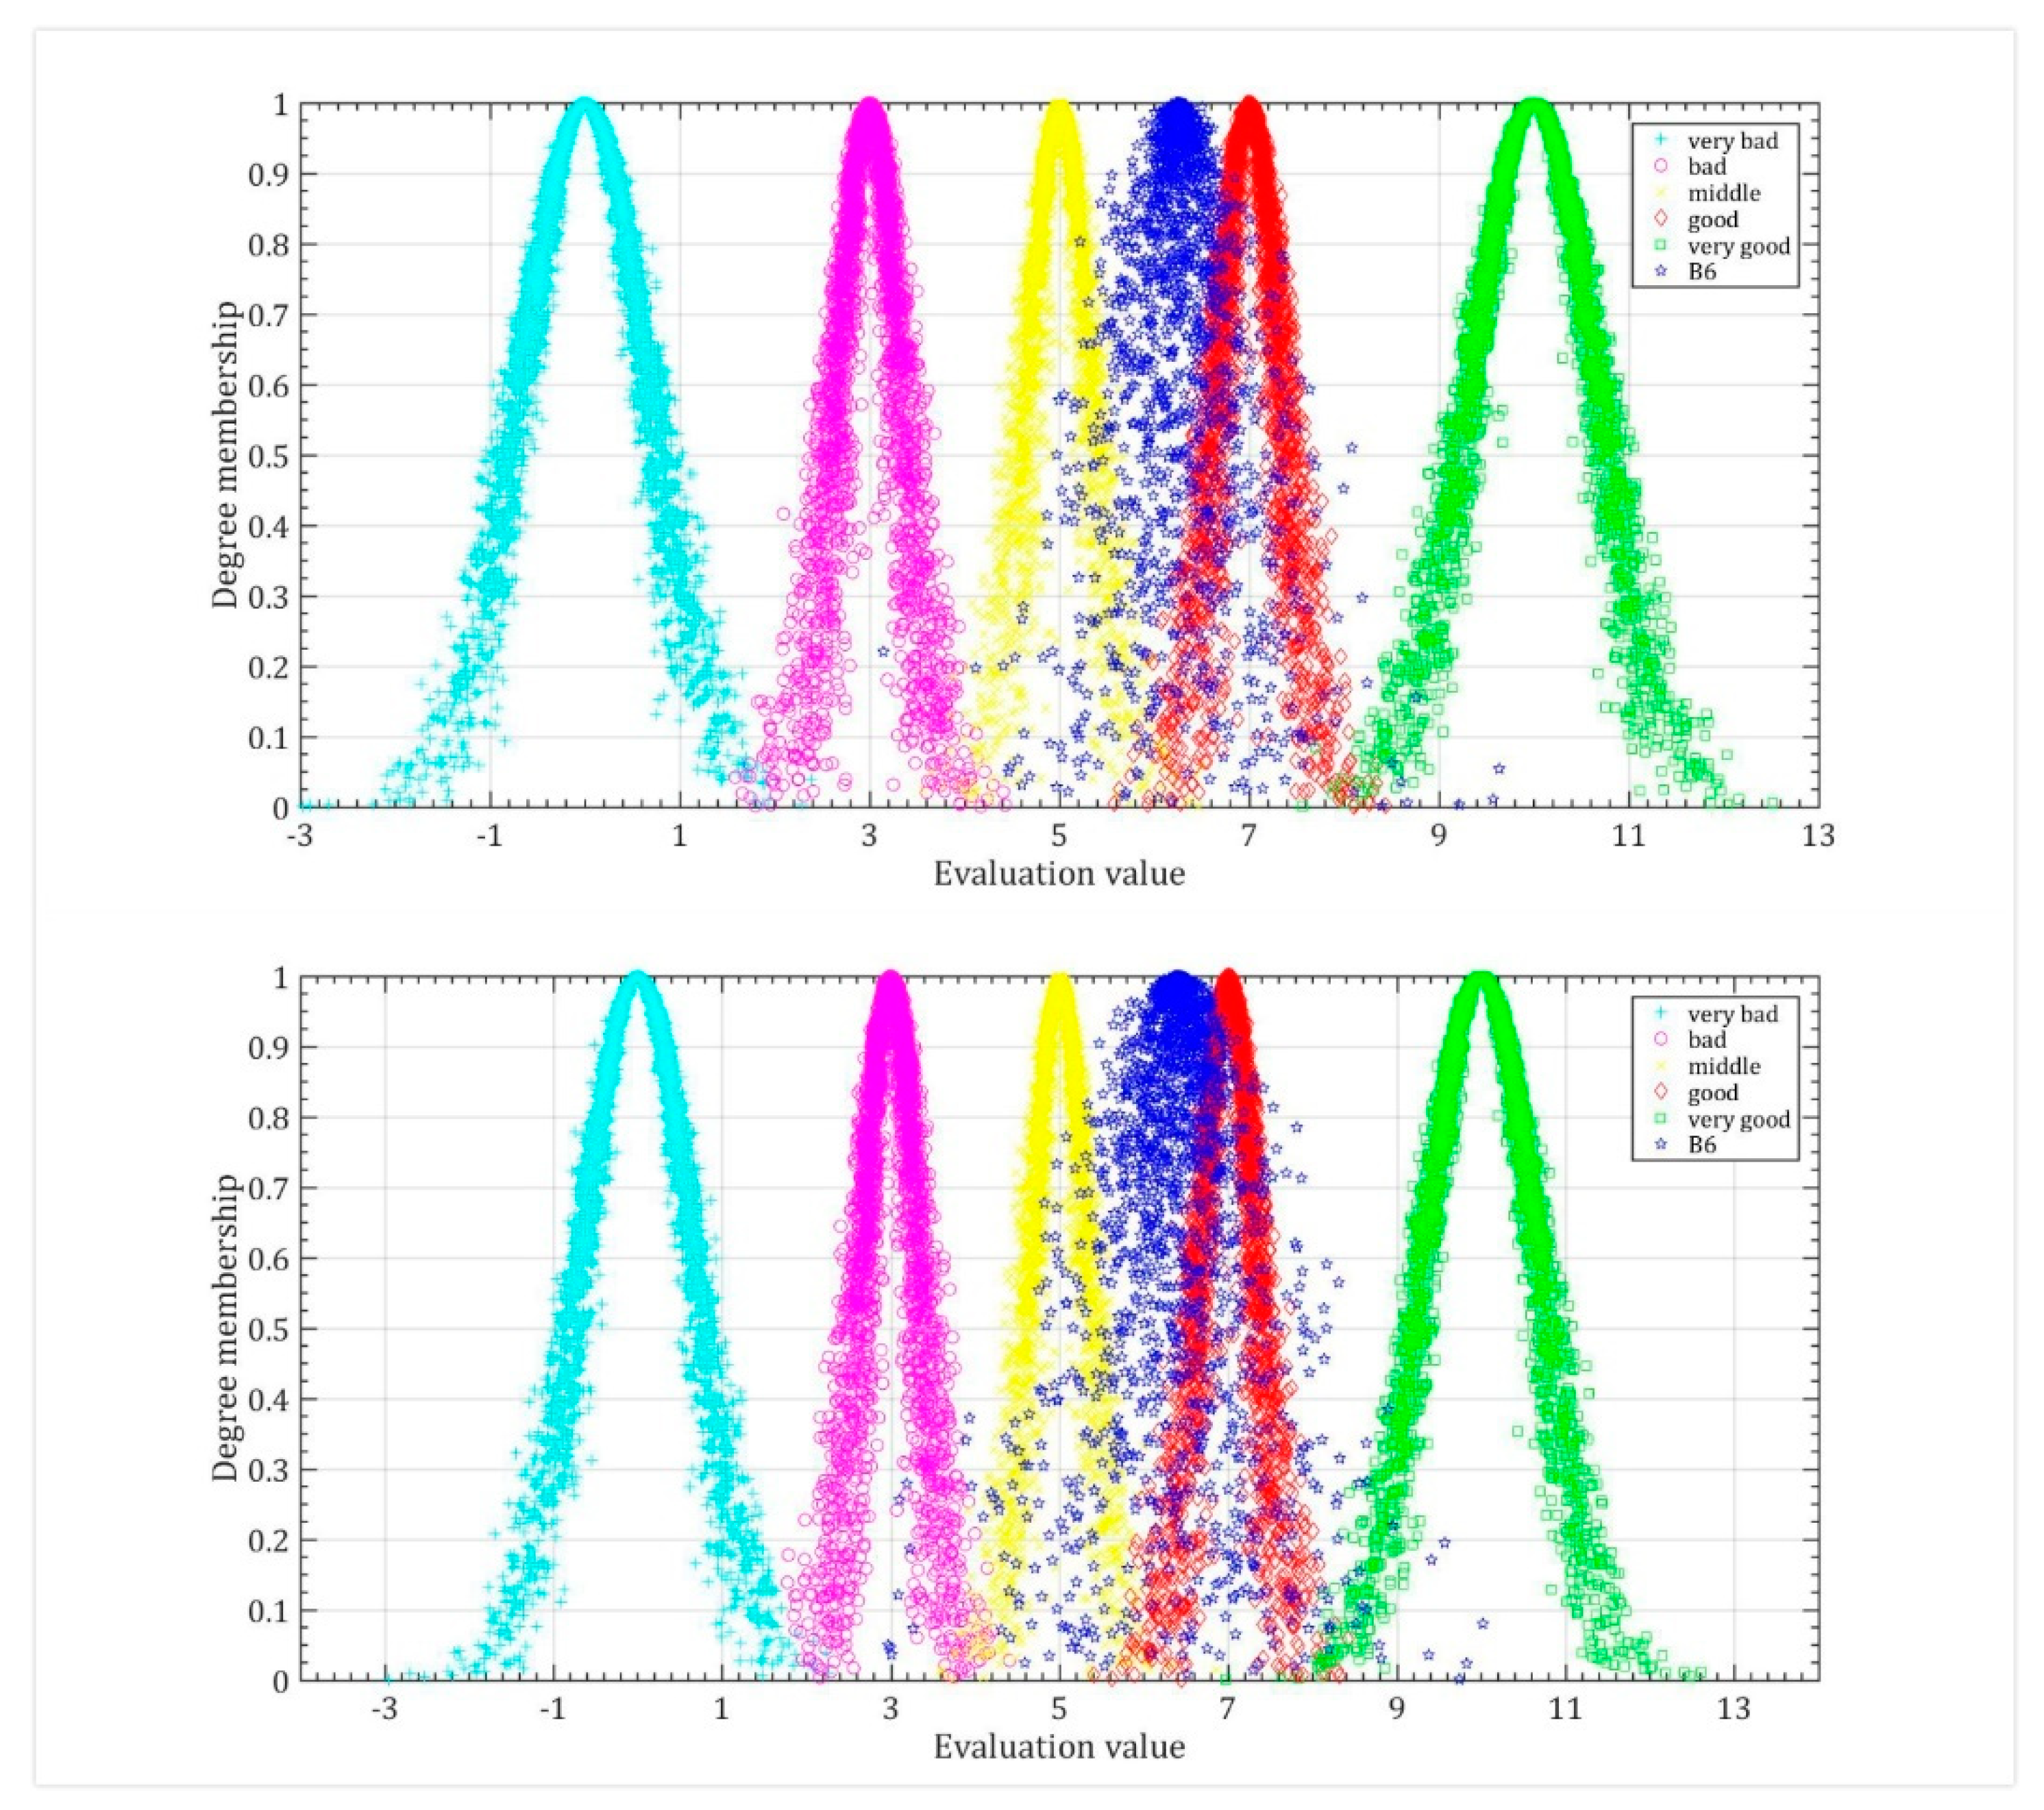
4.1.6. Representation of the Cloud Model of the Comprehensive Evaluation Index of the Welfare Effect of the Land-Lost Farmers’ Households
4.2. Determination and Analysis of the Evaluation Level of the Welfare Effect of the Land-Lost Farmers’ Households under Different Living Asset Allocations
4.2.1. Determination of the Evaluation Result Level
4.2.2. Analysis of Evaluation Results
5. Conclusions and Policy Implication
5.1. Conclusions
5.2. Policy Implications
Author Contributions
Funding
Acknowledgments
Conflicts of Interest
Appendix A
Appendix B

| Functional Activity (Level One Indicator) | Characterization Index (Secondary Indicators) | Secondary Evaluation Index Cloud Model Parameters | Weights | |
|---|---|---|---|---|
| Family’s financial situation (B1) | Per capita agricultural net income (C1) | (2.1179, 0.8969, 0.3490) | 0.4115 | 0.2158 |
| Per capita non-agricultural income (C2) | (6.4670, 1.2293, 0.5424) | 0.0082 | ||
| Per capita net income (C3) | (3.3962, 1.3122, 0.6103) | 0.1368 | ||
| Satisfaction with economic conditions (C4) | (4.0472, 1.4660, 0.4866) | 0.0506 | ||
| Social Security (B2) | Pension security (C5) | (4.0613, 1.4045, 0.4132) | 0.1227 | 0.0744 |
| Medical security (C6) | (6.4717, 1.2408, 0.5509) | 0.0183 | ||
| Social security satisfaction (C7) | (4.8726, 0.9492, 0.4163) | 0.0034 | ||
| Education guarantee (C8) | (4.6132, 1.2155, 0.5127) | 0.0041 | ||
| Unemployment protection (C9) | (3.8019, 1.4872, 0.5289) | 0.0225 | ||
| Living environment (B3) | Air quality (C10) | (4.0236, 1.5137, 0.4797) | 0.0311 | 0.0103 |
| Noise pollution (C11) | (4.6840, 1.8604, 0.7803) | 0.0051 | ||
| Green coverage (C12) | (3.3726, 1.2043, 0.5173) | 0.0144 | ||
| Road dust case (C13) | (4.5330, 1.2340, 0.5444) | 0.0008 | ||
| Solid waste disposal rate (C14) | (6.6085, 1.2063, 0.5176) | 0.0006 | ||
| Mental state (B4) | Farmers’ urban residents’ identity (C15) | (3.0660, 1.4290, 0.5049) | 0.0182 | 0.0026 |
| Neighborhood relationship (C16) | (3.4009, 1.1671, 0.4891) | 0.0120 | ||
| Confidence in future life (C17) | (5.0566, 0.8812, 0.2963) | 0.0006 | ||
| Degree of respect (C18) | (4.1132, 0.8283, 0.2529) | 0.0030 | ||
| Development opportunities (B5) | Number of development opportunities (C19) | (3.9057, 1.5589, 0.6410) | 0.2468 | 0.1554 |
| Work stability (C20) | (3.4811, 1.2722, 0.5783) | 0.0427 | ||
| Employment difficulty (C21) | (4.0991, 1.4328, 0.4881) | 0.0185 | ||
| Subjective feelings of entrepreneurial environment (C22) | (3.0377, 0.8761, 0.2775) | 0.0066 | ||
| Employment training (C23) | (5.0896, 0.8396, 0.2524) | 0.0236 | ||
| Living conditions (B6) | Housing types (C24) | (6.0047, 1.4968, 0.5047) | 0.0318 | 0.0034 |
| Security situation (C25) | (6.0283, 1.5438, 0.5552) | 0.0032 | ||
| Residential satisfaction (C26) | (5.7358, 1.5054, 0.5634) | 0.0031 | ||
| Surrounding facilities (C27) | (5.8962, 1.5673, 0.5618) | 0.0109 | ||
| Hydropower supply (C28) | (6.9292, 1.4313, 0.4373) | 0.0113 | ||
| Political participation (B7) | Informed status of land acquisition (C29) | (3.4953, 1.1885, 0.5108) | 0.1379 | 0.0050 |
| Willingness to land acquisition (C30) | (4.2689, 1.1659, 0.4626) | 0.0094 | ||
| Feelings of compensation rationality (C31) | (3.9340, 0.8834, 0.3048) | 0.0443 | ||
| Identity of land acquisition (C32) | (4.0566,1.3981, 0.4306) | 0.0289 | ||
| Social justice (C33) | (3.9717,1.6130, 0.6203) | 0.0504 | ||
| Functional Activity (Level One Indicator) | Characterization Index (Secondary Indicators) | Secondary Evaluation Index Cloud Model Parameters | Weights | |
|---|---|---|---|---|
| Family’s financial situation (B1) | Per capita agricultural net income (C1) | (4.4575, 1.2380, 0.5454) | 0.0263 | 0.0013 |
| Per capita non-agricultural income (C2) | (8.0472, 1.4306, 0.4369) | 0.0056 | ||
| Per capita net income (C3) | (5.8396, 1.5480, 0.6122) | 0.0099 | ||
| Satisfaction with economic conditions (C4) | (6.6321, 1.8768, 0.7787) | 0.0095 | ||
| Social Security (B2) | Pension security (C5) | (6.4717, 1.1212, 0.4589) | 0.1589 | 0.0040 |
| Medical security (C6) | (6.3915, 1.2963, 0.5924) | 0.0509 | ||
| Social security satisfaction (C7) | (5.4481, 1.2462, 0.5561) | 0.0117 | ||
| Education guarantee (C8) | (6.0755, 1.5378, 0.5599) | 0.0333 | ||
| Unemployment protection (C9) | (6.4292, 1.2458, 0.5487) | 0.0590 | ||
| Living environment (B3) | Air quality (C10) | (4.0519, 1.6107, 0.6195) | 0.1419 | 0.0135 |
| Noise pollution (C11) | (4.5755, 1.8864, 0.7942) | 0.0875 | ||
| Green coverage (C12) | (3.5047, 1.2529, 0.5603) | 0.0135 | ||
| Road dust case (C13) | (4.5425, 1.2272, 0.5383) | 0.0068 | ||
| Solid waste disposal rate (C14) | (6.5755, 1.2766, 0.5764) | 0.0205 | ||
| Mental state (B4) | Farmers’ urban residents’ identity (C15) | (5.4953, 1.2649, 0.5701) | 0.1301 | 0.0083 |
| Neighborhood relationship (C16) | (3.6321, 1.2053, 0.5209) | 0.0141 | ||
| Confidence in future life (C17) | (6.1038, 1.6097, 0.6495) | 0.0876 | ||
| Degree of respect (C18) | (5.5330, 1.1568, 0.4847) | 0.0201 | ||
| Development opportunities (B5) | Number of development opportunities (C19) | (7.0330, 1.5031, 0.4866) | 0.3782 | 0.0722 |
| Work stability (C20) | (7.1698, 1.5197, 0.5735) | 0.1480 | ||
| Employment difficulty (C21) | (6.6462, 1.9166, 0.7808) | 0.0327 | ||
| Subjective feelings of entrepreneurial environment (C22) | (5.5189, 1.3374, 0.6328) | 0.1087 | ||
| Employment training (C23) | (5.0142, 0.8043, 0.0853) | 0.0166 | ||
| Living conditions (B6) | Housing types (C24) | (5.9057, 1.6473, 0.6690) | 0.1026 | 0.0448 |
| Security situation (C25) | (6.4623, 1.2315, 0.5476) | 0.0104 | ||
| Residential satisfaction (C26) | (6.5849, 1.2620, 0.5618) | 0.0023 | ||
| Surrounding facilities (C27) | (5.9670, 1.4452, 0.4863) | 0.0079 | ||
| Hydropower supply (C28) | (7.0660, 1.6095, 0.6215) | 0.0372 | ||
| Political participation (B7) | Informed status of land acquisition (C29) | (6.5236, 1.2761, 0.5790) | 0.0620 | 0.0020 |
| Willingness to land acquisition (C30) | (5.4481, 1.2568, 0.5628) | 0.0027 | ||
| Feelings of compensation rationality (C31) | (6.4670, 1.2821, 0.5844) | 0.0179 | ||
| Identity of land acquisition (C32) | (5.0236, 0.8312, 0.1809) | 0.0017 | ||
| Social justice (C33) | (4.7736, 1.5612, 0.6201) | 0.0377 | ||
References
- Peng, K.L.; Zhu, H.L. The Impacts of Rural-Urban Land Conversion on the Welfare of Different Aged Land-lost Farmers. China Land Sci. 2015, 29, 71–78. [Google Scholar]
- Li, S.; Zhang, A.L. Research of Rural-Urban Land Conversion and Social Loss: Based on the Demonstration Study of Wuhan City Circle. Resour. Sci. 2014, 36, 303–310. [Google Scholar]
- Peng, K.L.; Zhang, P.; Zhang, A.L. Welfare Balance of Different Interest Groups during Rural-urban Land Conversion. Chin. J. Popul. Resour. 2009, 7, 57–64. [Google Scholar]
- Zhang, X.; Zhang, A.L.; Min, M. Evaluation on Rural-urban Land Conversion Efficiency of Hubei Province. Chin. J. Popul. Resour. 2013, 23, 146–151. [Google Scholar]
- Zhang, A.L.; Mao, H. The Conversion of Rural Land into Urban Land: Channels, Patterns and Characteristics. Geogr. Territ. Res. 2000, 2, 17–22. [Google Scholar]
- Wei, L.; Zhang, A.L. The Measurement of Welfare Changes and Welfare Gap among Farmers in Rural-Urban Land Transfer: An Empirical Study based on Two-dimensional Weighting Method and Three Types of Inequality Indexes. China Land Sci. 2016, 30, 72–80. [Google Scholar]
- Gao, J.Y.; Qiao, R.F.; Zhang, A.L. Fuzzy Evaluation of Farmers’ Welfare Changes before and after Rural-urban Land Conversion—Based on Sen’s Feasibility Capability Theory. Manag. World 2007, 6, 45–55. [Google Scholar]
- Zhou, Y.; Li, M.X. Change and Differentiation of Farmers’ Welfare under the Impact of Land Loss. Agric. Technol. Econ. 2014, 1, 73–80. [Google Scholar]
- Hu, D.G.; Yan, G.C.; Peng, K.L. Study on the Micro-level Welfare Effects of Rural-Urban Land Conversion in the Urban Agglomeration of Wuhan. China Land Sci. 2013, 27, 20–26. [Google Scholar]
- Wang, S.; Zhang, A.L.; Zhang, Y.S. Measurement of Household Welfare Change in the Process of Rural-Urban Land Conversion. Chin. J. Popul. Resour. 2014, 24, 108–115. [Google Scholar]
- Sen, A.; Hawthorne, G. The Standard of Living. Q. J. Econ. 1987, 13, 365–369. [Google Scholar]
- You, H.Y.; Wu, C.F.; Bao, H.J. Farmland Circulation, Off-farm Employment and Peasant Households’ Welfare Who Rent out Farmland: An Empirical Study of Peasant Households in Guizhou, Zhejiang and Shandong. Issues Agric. Econ. 2013, 34, 16–25. [Google Scholar]
- Sen, A. Treating Development with Freedom; Renmin University of China Press: Beijing, China, 2002. [Google Scholar]
- Ma, J.; Dai, H. A methodology to construct warning index system for coal mine safety based on collaborative management. Saf. Sci. 2017, 93, 86–95. [Google Scholar] [CrossRef]
- Ingrid, R. Sen’s capability approach and gender inequality: Selecting relevant capabilities. Fem. Econ. 2003, 9, 61–92. [Google Scholar]
- Li, G.D.; Qiu, D.C.; Wang, L.P.; Wang, P.; Luo, S.Q. Impact of farmer households’ livelihood assets on their options of economic compensation patterns for cultivated land protection. J. Geogr. Sci. 2014, 24, 331–348. [Google Scholar] [CrossRef]
- Chambers, R.; Conway, G. Sustainable Rural Livelihoods: Practical Concepts for the 21st Century; IDS Discussion Paper 296; Institute of Development Studies: Brighton, UK, 1992. [Google Scholar]
- Liu, Z.F.; Chen, Q.R.; Xie, H. Influence of the Farmer’s Livelihood Assets on Livelihood Strategies in the Western Mountainous Area, China. Sustainability 2018, 10, 875. [Google Scholar] [CrossRef]
- Lopez, R.A.; Shah, F.A.; Altobello, M.A. Amenity Benefits and the Optimal Allocation of Land. Land Econ. 1994, 70, 53–62. [Google Scholar] [CrossRef]
- Nie, X.; Wang, W.; Zhang, A.L. Study on the Factors Affecting the Multi-dimensional Welfare of Land-losing Farmers in the Process of Urbanization. China Rural Surv. 2013, 4, 86–93. [Google Scholar]
- Liu, Z.F.; Chen, Q.R.; Xie, H.L. Comprehensive Evaluation of Farm Household Livelihood Assets in a Western Mountainous Area of China: A Case Study in Zunyi City. J. Resour. Ecol. 2018, 9, 154–163. [Google Scholar]
- Hui, E.C.M.; Bao, H.J.; Zhang, X.L. The policy and praxis of compensation for land expropriations in China: An appraisal from the perspective of social exclusion. Land Use Policy 2013, 32, 309–316. [Google Scholar] [CrossRef]
- Albert, B. When do Agricultural Exports Help the Rural Poor? A Political-economy Approach. Oxf. Dev. Stud. 2001, 29, 125–144. [Google Scholar]
- Gerbergerald, E.R.; Ford, R.; Gerber, E.R. Direct democracy and land use policy: Exchanging public goods for development rights. Urban Stud. 2004, 41, 463–479. [Google Scholar]
- Egbu, A.U.; Olomolaiye, P.; Gameson, R. A neo-institutional economic critique of the system for allocating urban land and development rights in Nigeria. Habitat Int. 2008, 32, 121–135. [Google Scholar] [CrossRef]
- Zang, J.M.; Wang, W.M.; Chen, Y.Y. Study on Land Value-added Distribution and Guarantee of Land-losing Farmers’ Rights and Interests in Agricultural Land Non-agriculturalization-Based on the Perspective of Agricultural Land Development Rights. Agric. Econ. Issues 2008, 2, 80–85. [Google Scholar]
- Peng, K.l.; Bai, X.M. Welfare effects of rural-urban land conversion on different aged land-lost farmers: Exemplified in Wuhan city. Chin. J. Popul. Resour. 2016, 14, 45–52. [Google Scholar] [CrossRef]
- Amartya, S. Capability and Well-Being; Clarendon Press: Oxford, UK, 1993. [Google Scholar]
- Qie, H.K.; Wang, S.J. Analysis of the welfare changes of farmers before and after concentrated residence and its influencing factors-Based on the survey of farmers in Jiangsu Province. China Rural Surv. 2014, 1, 26–39. [Google Scholar]
- Zadeh, L.A. Fuzzy sets. Inf. Control 1965, 8, 338–353. [Google Scholar] [CrossRef]
- Ross, T.; Fuzzy, L. Fuzzy Logic with Engineering Applications; McGraw-Hill: New York, NY, USA, 1995. [Google Scholar]
- Li, J.; Tuo, H.W. Welfare Analysis for the Rural Households in the Slopping Land Conversion Program Area in the Zhouzhi County, Shaanxi Province Based upon the Capability Approach. Manag. Rev. 2012, 24, 66–72. [Google Scholar]
- Yin, Q.; Ma, L.L.; Wang, Q.R. Evaluation on the Welfare Level of Land-lost Peasants Based on Sens’ Function and Capacity Welfare Theory. China Land Sci. 2010, 24, 41–46. [Google Scholar]
- Wang, W.; Ma, C. Study on the welfare level of land-losing farmers based on the feasibility theory-Taking Yixing City and Taicang City of Jiangsu Province as an example. Agric. Technol. Econ. 2013, 6, 20–31. [Google Scholar]
- Li, D.Y.; Meng, H.J.; Shi, X.M. Membership clouds and membership cloud generator. J. Comput. Res. Dev. 1995, 6, 15–20. [Google Scholar]
- Liu, Y.; Li, D.Y.; Zhang, G.W.; Chen, G.S. Atomized feature in cloud based evolutionary algorithm. Acta Electron. Sin. 2009, 37, 1651–1658. [Google Scholar]
- Li, D.Y.; Liu, C.Y.; Du, Y.; Han, X. Artificial Intelligence with Uncertainty. J. Softw. 2004, 11, 1583–1594. [Google Scholar]
- Zhang, Y.; Yan, J.M.; Jiang, P.; Yang, N. Normal cloud model based evaluation of land resources ecological security in Hubei province. Trans. Chin. Soc. Agric. Eng. 2013, 29, 252–258. [Google Scholar]
- Liu, C.Y.; Li, D.Y.; Du, Y.; Han, X. Some Statistical Analysis of the Norm al Cloud Model. Inf. Control 2005, 2, 236–239. [Google Scholar]
- Chen, H.; Li, B.; Liu, C.Y. An Algorithm of Backward Cloud without Certainty Degree. J. Chin. Comput. Syst. 2015, 36, 544–549. [Google Scholar]
- Pavlickova, K.; Vyskupova, M. A method proposal for cumulative environmental impact assessment based on the landscape vulnerability evaluation. Environ. Impact Assess. Rev. 2015, 50, 74–84. [Google Scholar] [CrossRef]
- Li, L.; Fan, F.; Ma, L. Energy Utilization Evaluation of Carbon Performance in Public Projects by FAHP and Cloud Model. Sustainability 2016, 8, 630. [Google Scholar] [CrossRef]
- Guo, J.; Feng, H.; Sun, J.; Cao, P.; Wang, W.; Chen, H.; Yu, Y. Application of Cloud Model to Evaluation of Forest Soil Fertility: A Case in Chinese Fir Plantations in Southern China. Sustainability 2019, 11, 6286. [Google Scholar] [CrossRef]
- Wang, L.; Wang, Y.; Chen, J. Assessment of the Ecological Niche of Photovoltaic Agriculture in China. Sustainability 2019, 11, 2268. [Google Scholar] [CrossRef]
- Wu, G.; Duan, K.; Zuo, J. Integrated sustainability assessment of public rental housing community based on a hybrid method of AHP-entropy weight and cloud model. Sustainability 2017, 9, 603. [Google Scholar]
- Wang, S.; Zhang, L.; Ma, N. An Evaluation Approach of Subjective Trust Based on Cloud Model. In Proceedings of the 2008 International Conference on Computer Science and Software Engineering, Wuhan, Hubei, China, 12–14 December 2008; Volume 1, pp. 44–52. [Google Scholar]
- Gao, X.; Chen, L.; Sun, B.; Liu, Y. Employing SWOT Analysis and Normal Cloud Model for Water Resource Sustainable Utilization Assessment and Strategy Development. Sustainability 2017, 9, 1439. [Google Scholar]
- Wang, M.S.; Zhu, M. Evaluating intensive land use situation of development zone based on cloud models. Trans. Chin. Soc. Agric. Eng. 2012, 28, 247–252. [Google Scholar]
- Liang, T.-C.; Peng, S.-H. Using Analytic Hierarchy Process to Examine the Success Factors of Autonomous Landscape Development in Rural Communities. Sustainability 2017, 9, 729. [Google Scholar] [CrossRef]
- Baffoe, G. Exploring the utility of Analytic Hierarchy Process (AHP) in ranking livelihood activities for effective and sustainable rural development interventions in developing countries. Eval. Prog. Plan. 2018, 72, 197–204. [Google Scholar] [CrossRef]
- Liu, D.L.; Gong, W.; Xing, W.X.; Li, X.X.; Ma, X.J.; Yu, Y. Comprehensive method for determining the weights of vulnerability assessment indexes on islands and the coastal zone based on the AHP weight method and entropy weight method. Mar. Environ. Sci. 2015, 34, 462–467. [Google Scholar]
- Liang, F.S. Quality Assessment of Tax Revenue Based on AHP and Entropy Weight Method-An Empirical Research Based on the Data of Tax System in 2011. Tax. Econ. 2013, 5, 70–78. [Google Scholar]
- Ma, F.; He, J.; Ma, J. Evaluation of urban green transportation planning based on central point triangle whiten weight function and entropy-AHP. Transp. Res. Procedia 2017, 25, 3638–3648. [Google Scholar] [CrossRef]
- Department for International Development (DFID). Sustainable Livelihoods Guidance Sheets; Department for International Development (DFID): London, UK, 1999.
- Wu, Z.; Li, B.; Hou, Y. Adaptive choice of livelihood patterns in rural households in a farm-pastoral zone: A case study in Jungar, Inner Mongolia. Land Use Policy 2017, 62, 361–375. [Google Scholar] [CrossRef]
- Sampson, Y.; Appiah, D.O.; Lawrencia, P.S.; Felix, A. Smallholder Farmers’ Livelihood Security Options amidst Climate Variability and Change in Rural Ghana. Scientifica 2017, 17, 1–10. [Google Scholar]
- Baffoe, G.; Matsuda, H. An empirical assessment of rural livelihood assets from gender perspective: Evidence from Ghana. Sustain. Sci. 2017, 12, 815–828. [Google Scholar] [CrossRef]
- Jezeer, R.; Verweij, P.; Boot, R.; Junginger, M.; Santos, M. Influence of livelihood assets, experienced shocks and perceived risks on smallholder coffee farming practices in Peru. J. Environ. Manag. 2019, 242, 496–506. [Google Scholar] [CrossRef] [PubMed]
- Chen, H.; Zhu, T.; Krott, M.; Calvo, J.; Ganesh, S.; Makoto, I. Measurement and evaluation of livelihood assets in sustainable forest commons governance. Land Use Policy 2013, 30, 908–914. [Google Scholar] [CrossRef]
- Fang, Y.; Fan, J.; Shen, M.; Song, M. Sensitivity of livelihood strategy to livelihood capital in mountain areas: Empirical analysis based on different settlements in the upper reaches of the Minjiang River, China. Ecol. Indic. 2014, 38, 225–235. [Google Scholar] [CrossRef]
- Sen, A. Inequality Reexamined; The Journal of Philosophy: New York, NY, USA, 1994; Volume 35, pp. 65–67. [Google Scholar]
- Sen, A. Development as Freedom; Oxford University Press: Oxford, UK, 2001. [Google Scholar]
- Baffoe, G.; Matsuda, H. Why do rural communities do what they do in the context of livelihood activities? Exploring the livelihood priority and viability nexus. Community Dev. 2017, 48, 715–734. [Google Scholar] [CrossRef]
- Sujakhu, N.M.; Ranjitkar, S.; He, J.; Schmidt-Vogt, D.; Su, Y.; Xu, J. Assessing the Livelihood Vulnerability of Rural Indigenous Households to Climate Changes in Central Nepal, Himalaya. Sustainability 2019, 11, 2977. [Google Scholar] [CrossRef]
- Di, K.C.; Li, D.Y.; Li, D.R. Cloud Theory and Its Applications in Spatial Data Mining and Knowledge Discovery. J. Image Graph. 1999, 4, 930–935. [Google Scholar]
- Hu, S.; Li, D.; Liu, Y. Mining weights of land evaluation factors based on cloud model and correlation analysis. Geo-Spat. Inf. Sci. 2007, 10, 218–222. [Google Scholar] [CrossRef]
- Ye, Q.; Li, S.R.; Zhang, Y.H. Cloud model and application overview. Comput. Eng. Des. 2011, 32, 4198–4201. [Google Scholar]
- Zhang, F.Z.; Fan, Y.Z.; Shen, C.Z.; Li, D.Y.; Chen, H. Intelligent control inverted pendulum with cloud models. Control Theory Appl. 2000, 17, 519–523. [Google Scholar]
- Chen, H.; Li, B. Approach to Uncertain Reasoning Based on Cloud Model. J. Chin. Comput. Syst. 2011, 32, 2449–2455. [Google Scholar]
- Lv, H.J.; Wang, Y.; Li, D.Y. The application of backward cloud in qualitative evaluation. Chin. J. Comput. 2003, 26, 30–33. [Google Scholar]
- Liu, C.Y.; Feng, M.; Dai, X.J.; LI, D.Y. A New Algorithm of Backward Cloud. J. Syst. Simul. 2004, 11, 2417–2420. [Google Scholar]
- Saaty, T.L. How to Make a Decision: The Analytic Hierarchy Process. Interfaces 1994, 48, 9–26. [Google Scholar]
- Shannon, C.E. A mathematical theory of communication. Bell Labs Tech. J. 1948, 27, 379–423. [Google Scholar] [CrossRef]
- Perera, E.; Jayawardana, D.; Jayasinghe, P.; Ranagalage, M. Landslide vulnerability assessment based on entropy method: A case study from Kegalle district, Sri Lanka. Modeling Earth Syst. Environ. 2019, 5, 1635–1649. [Google Scholar] [CrossRef]
- Fan, D.G.; He, S.; Duan, F.; Niu, B.N. A Comprehensive Evaluation Model Based on Cloude Model. Sci. Technol. Inf. Dev. 2003, 12, 157–159. [Google Scholar]
- Qin, D.Z. A comprehensive evaluation for network security risk assessment based on the cloud model. Netw. Secur. Technol. Appl. 2011, 7, 29–32. [Google Scholar]
- Pang, H.M.; Liu, H.Z. Application of Cloud Model in risk Assessment of Quality Control for Information Engineering Surveillance. J. Guangxi Univ. Natl. 2016, 22, 71–73. [Google Scholar]
- Xu, Y.X.; Wang, H.Y. Evaluation of Airport Service Quality Cloud Model Based on AHP- Entropy Weight Method. Value Eng. 2016, 35, 7–10. [Google Scholar]
- Xu, K.H.; Meng, Q.; Li, K. The Comprehensive Evaluation of Attack Formations of Tank Element Base on Cloud Theory. Fire Control Command 2011, 36, 23–37. [Google Scholar]
- Zhao, Q.H.; Song, W.D.; Sun, G.H. DLG quality evaluation based on trapeziform comment cloud and virtual cloud theory. Sci. Surv. Mapp. 2011, 36, 47–49. [Google Scholar]
- Luo, S.; Liu, G.S.; Zhang, B.M.; Guo, H.T. Evaluation Model of Digital Map Quality Based on Cloud Model. J. Geomat. Sci. Technol. 2008, 2, 123–126. [Google Scholar]
- Wang, D.F.; Jia, Z.Y.; Ye, C.Y. Evaluation of Landing Direction Based on Cloud Theory. Ordnance Ind. Autom. 2016, 35, 70–72. [Google Scholar]
- Lush, G. Probability theory. Nature 1978, 272, 107. [Google Scholar] [CrossRef]
- Zdzisław, P. Rough sets. Int. J. Comput. Inf. Sci. 1982, 11, 341–356. [Google Scholar]
- Yager, R. On the dempster-shafer framework and new combination rules. Inf. Sci. 1987, 41, 93–137. [Google Scholar] [CrossRef]
- Yuan, F.; Cai, Y. Measure of Landless Farmers’ Welfare Variation duringthe Process of Land Expropriation in Suburbs: An Empirical Research on Wulijie Town, Jiangxia District, Wuhan. Resour. Sci. 2012, 34, 449–458. [Google Scholar]
- Zhu, L.; Cai, Y. The Impacts of Land Expropriation on Landless Farmers’ Welfare during the Rural-Urban Transition Process. J. South China Agric. Univ. 2013, 12, 34–43. [Google Scholar]
- Qian, Z. Land acquisition compensation in post-reform China: Evolution, structure and challenges in Hangzhou. Land Use Policy 2015, 46, 250–257. [Google Scholar] [CrossRef]
- Gengaje, R. Administration of farmland transfer in urban fringes: Lessons from Maharashtra, India. Land Use Policy 1992, 9, 272–286. [Google Scholar] [CrossRef]
- Liu, X.; Wang, G.; Luo, X. Multi-granularity Clustering of Remote Sensing Image Based on Gaussian Cloud Transformation. Comput. Sci. 2017, 44, 23–27. [Google Scholar]
- Gao, H.; Zhang, X.; Liu, Y.; Li, D. Longitudinal Control for Mengshi Autonomous Vehicle via Gauss Cloud Model. Sustainability 2017, 9, 2259. [Google Scholar] [CrossRef]
- Wang, Y.; Li, W.; Xiong, J.; Li, Y.; Wu, H. Effect of Land Expropriation on Land-Lost Farmers’ Health: Empirical Evidence from Rural China. Int. J. Environ. Res. Public Health 2019, 16, 2934. [Google Scholar] [CrossRef]
- Liu, Q.; Wang, M.; Wang, X.; Shen, F.; Jin, J. Land Eco-Security Assessment Based on the Multi-Dimensional Connection Cloud Model. Sustainability 2018, 10, 2096. [Google Scholar] [CrossRef]
- Ye, D.; Wu, K.; Liu, P. Developmental Potentiality Evaluation of Cultivated Land Reserve in Jingtal Based on Normal Cloud and Entropy Weight. Chin. J. Agric. Resour. Reg. Plan. 2016, 37, 22–28. [Google Scholar]


| Types | Index | Indicator Definition | Assignment |
|---|---|---|---|
| Human assets | Education of the member with the highest education level (H1) | Illiterate is 0, primary school is 0.25, junior high school and secondary school are 0.5, high school and junior college are 0.75, and undergraduate or above is 1. | |
| Households’ overall labor capacity (H2) | The sum of the working abilities of household members at different ages and health conditions | 0 to 6-year-old children are 0, 7 to 15 year-olds are 0.3, 16 to 54-year-old female or 16 to 59-year-old male healthy family members are 1, 55-year-old female or 60-year-old male and the abovementioned healthy family members are 0.5, family members with chronic disease are 0.5, and those with major illness, disability or old age are 0.5. | |
| Number of family members attending training (H3) | The number of family members participating in professional skills training in the past 12 months and summing them. | No participation is 0, participating once is 1, participating twice is 2, and participating three times or more is 3. | |
| Natural assets | Per capita cultivated area (N1) | The cultivated land per capita owned by the family | Cultivated area owned by the family/Number of family members |
| Cultivated land quality (N2) | Farmer perception | Very poor is 0, poor is 0.25, neutral is 0.5, good is 0.75, and very good is 1. | |
| Number of livestock (N3) | Amount of livestock raised by the family | Continuous variable | |
| Whether to raise poultry (N4) | For a dichotomous variable, it is 1, otherwise, it is 0. | ||
| Physical assets | Family housing area (P1) | Continuous variable | |
| Family housing type (P2) | Grass house is 0, civil house is 0.25, brick and wood house is 0.5, tile house is 0.75, and brick house is 1. | ||
| Family housing situation (P3) | Very poor is 1, poor is 2, generally is 3, good is 4, and very good is 5. | ||
| Productive tools (P4) | Pumps, harvesters, rice machines, tricycles, storefronts | The measure of household productive tools is the ratio of the number of options owned by the farmer to all options. | |
| Durable consumer goods (P5) | Motorcycle, mobile phone/landline, air conditioner, refrigerator, washing machine, TV, water heater, combination furniture, car | The measure of household durable consumer goods is the ratio of the number of options owned by the farmer to all options. | |
| Financial assets (F) | Annual household income (F1) | Continuous variable | |
| Access to borrowing (F2) | Measured from three aspects: bank or credit union, loan shark, relatives and friends | For a dichotomous variable, the value is hectares if it can obtain a certain aspect of the loan, otherwise, it is 0. Next, give loans to banks or credit unions, usury, relatives, and friends, and give them a weight of 0.50:0.25:0.25. Calculate the value of the indicator of the opportunity for farmers to obtain loans. | |
| Access to cash assistance (F3) | Has the farmers’ households received donations or remittances in cash in the past 12 months? | For the dichotomous variable, the farmers’ household received a cash receipt or remittance with a value of 1, otherwise, it was 0. | |
| Social assets (S) | Social connection degree (S1) | Are there relatives or friends working in government agencies or enterprises? | For a dichotomous variable, it is 1, otherwise, it is 0. |
| Number of family members participating in social organizations (S2) | Number of professional cooperative economic organizations in which family members have participated in the past 12 months | Not participating is 0, 1 is 0.25, 2 is 0.5, 3 is 0.75, and 4 or more is 1. | |
| Trust in people around (S3) | Neighborhood trust | Almost all untrustworthy is 0, a few trustworthy is 0.25, half are trustworthy is 0.5, trust most is 0.75, and trust all is 1. | |
| Whether you get outside help when your family is in difficulty (S4) | Includes financial support, policy support, technical support, and human support | Cannot get help is 0, can get one type of support is 0.25, two types of support is 0.5, three types of support is 0.75, and four types of support is 1. |
| Target Layer | Functional Activity (Level One Indicator) | Characterization Index (Secondary Indicators) |
|---|---|---|
| Evaluation of welfare effects of land-lost farmers’ households (A1) | Family’s financial situation (B1) | Per capita agricultural net income (C1) |
| Per capita non-agricultural income (C2) | ||
| Per capita net income (C3) | ||
| Satisfaction with economic conditions (C4) | ||
| Social Security (B2) | Pension security (C5) | |
| Medical security (C6) | ||
| Social security satisfaction (C7) | ||
| Education guarantee (C8) | ||
| Unemployment protection (C9) | ||
| Living environment (B3) | Air quality (C10) | |
| Noise pollution (C11) | ||
| Green coverage (C12) | ||
| Road dust case (C13) | ||
| Solid waste disposal rate (C14) | ||
| Mental state (B4) | Farmers’ urban residents’ identity (C15) | |
| Neighborhood relationship (C16) | ||
| Confidence in future life (C17) | ||
| Degree of respect (C18) | ||
| Development opportunities (B5) | Number of development opportunities (C19) | |
| Work stability (C20) | ||
| Employment difficulty (C21) | ||
| Subjective feelings of entrepreneurial environment (C22) | ||
| Employment training (C23) | ||
| Living conditions (B6) | Housing types (C24) | |
| Security situation (C25) | ||
| Residential satisfaction (C26) | ||
| Surrounding facilities (C27) | ||
| Hydropower supply (C28) | ||
| Political participation (B7) | Informed status of land acquisition (C29) | |
| Willingness to land acquisition (C30) | ||
| Feelings of compensation rationality (C31) | ||
| Identity of land acquisition (C32) | ||
| Social justice (C33) |
| Name of the Village | Issued Questionnaire | Rate | Collected Questionnaires | Rate | Valid Questionnaires | Rate |
|---|---|---|---|---|---|---|
| Taohuayi | 96 | 41.73% | 93 | 41.70% | 89 | 41.98% |
| Taohuasan | 68 | 29.57% | 67 | 30.04% | 62 | 29.25% |
| Taohuawu | 66 | 28.70% | 63 | 28.25% | 61 | 28.77% |
| Total | 230 | 100% | 223 | 100% | 212 | 100% |
| Comment | Very Poor | Poor | General | Good | Very Good |
|---|---|---|---|---|---|
| Interval | |||||
| 0 | 3 | 5 | 7 | 10 | |
| 2/3 | 1/3 | 1/3 | 1/3 | 2/3 | |
| Type of Land-Lost Farmers’ Households | Multi-Asset-Deficient | Single-Asset-Deficient | Ordinary-Asset | Rich-Asset |
|---|---|---|---|---|
| Interval | 0.913–1.274 | 1.275–1.747 | 1.755–2.449 | 2.454–3.125 |
| Functional Evaluation Index (Primary Evaluation Index) | Cloud Model Parameters of the Primary Evaluation Index of the Asset-Deficient Land-Lost Farmers’ Households | Cloud Model Parameters of the Primary Evaluation Index of the Asset-Balanced Land-Lost Farmers’ Households |
|---|---|---|
| Family’s financial situation (B1) | (3.0286, 0.4575, 0.4782) | (6.5295, 0.0428, 0.6461) |
| Social Security (B2) | (4.3653, 0.1688, 0.4576) | (6.2639, 0.2097, 0.5638) |
| Living environment (B3) | (3.9626, 0.0439, 0.5609) | (4.6698, 0.2384, 0.7287) |
| Mental state (B4) | (3.4699, 0.0208, 0.4586) | (5.7826, 0.1917, 0.6138) |
| Development opportunities (B5) | (4.1430, 0.3487, 0.5914) | (6.7623, 0.5549, 0.5837) |
| Living conditions (B6) Political participation (B7) | (6.2544, 0.0478, 0.5132) (3.9850, 0.1776, 0.4943) | (6.3991, 0.1608, 0.6268) (5.2882, 0.0892, 0.6007) |
| Comprehensive Indicator | Cloud Model Parameters of Comprehensive Evaluation Index of Asset-Deficient Land-Lost Farmers’ Households | Cloud Model Parameters of Comprehensive Evaluation Index of Asset-Balanced Land-Lost Farmers’ Households |
|---|---|---|
| Welfare effect of land-lost farmers’ households | (3.7392, 0.3846, 0.4822) | (6.1240, 0.4076, 0.5394) |
© 2019 by the authors. Licensee MDPI, Basel, Switzerland. This article is an open access article distributed under the terms and conditions of the Creative Commons Attribution (CC BY) license (http://creativecommons.org/licenses/by/4.0/).
Share and Cite
Zhang, Y.; Xie, H. Welfare Effect Evaluation of Land-Lost Farmers’ Households under Different Livelihood Asset Allocation. Land 2019, 8, 176. https://doi.org/10.3390/land8110176
Zhang Y, Xie H. Welfare Effect Evaluation of Land-Lost Farmers’ Households under Different Livelihood Asset Allocation. Land. 2019; 8(11):176. https://doi.org/10.3390/land8110176
Chicago/Turabian StyleZhang, Yanwei, and Hualin Xie. 2019. "Welfare Effect Evaluation of Land-Lost Farmers’ Households under Different Livelihood Asset Allocation" Land 8, no. 11: 176. https://doi.org/10.3390/land8110176
APA StyleZhang, Y., & Xie, H. (2019). Welfare Effect Evaluation of Land-Lost Farmers’ Households under Different Livelihood Asset Allocation. Land, 8(11), 176. https://doi.org/10.3390/land8110176