Article

Historical Trajectory in Vegetation Cover in Northeastern Namibia Based on AVHRR Satellite Imagery (1982–2015)

1
Department of Geographical and Historical Studies, University of Eastern Finland, Yliopistokatu 7, Metria-building, P.O. Box 111, FI-80101 Joensuu, Finland
2
European Forest Institute (EFI), Sant Pau Art Nouveau Site, Sant Leopold Pavilion, St. Antoni M. Claret 167, 08025 Barcelona, Spain
*
Author to whom correspondence should be addressed.
Land 2019, 8(11), 160; https://doi.org/10.3390/land8110160
Submission received: 6 September 2019 / Revised: 21 October 2019 / Accepted: 24 October 2019 / Published: 28 October 2019

Abstract

:
The negative impact of the reduction of vegetation cover is already being felt in the Zambezi Region in northeastern Namibia. The region has been undergoing various land cover changes in the past decades. To understand the historical trend of vegetation cover (increase or decrease), we analyzed 8-km resolution Global Inventory Monitoring and Modeling Studies (GIMMS) from the Advanced Very High Resolution Radiometer (AVHRR) and 0.25° × 0.25° (resampled to 8 km) resolution Global Precipitation Climatology Center (GPCC). We used the Time Series Segmented Residual Trends (TSS-RESTREND) method. We found that the general trajectory of vegetation cover was negative. Pixel-wise analysis and visual interpretation of historical images both revealed clear signs of vegetation cover change. We observed a single breakpoint in the vegetation trajectory which correlated to the 1991–1992 drought in southern Central Africa. Potential drivers of land cover change are the (il)legal expansion of subsistence farming, population growth, and wood extraction. These findings will serve as a reference for decision makers and policymakers. To better understand the human-induced land cover change at the micro scale and sub-regional level, we recommend using higher resolution remote sensing datasets and historical documents to assess the effect of demographic change, disease, civil unrest, and war.

Graphical Abstract

1. Introduction

Land degradation is one of the most serious and pervasive global environmental problems we face [1,2]. This is especially the case in dryland ecosystems, where any slight change in land cover can easily lead to significant land degradation [3,4]. Land degradation has been defined as the “reduction in the capacity of the land to provide ecosystem goods and services and assure its functions over a period of time for the beneficiaries of these” [5] (p.1). Land degradation usually occurs due to long-term reduction in temporal and spatial vegetation cover and primary productivity [6]. Land degradation is categorized as vegetation degradation, soil degradation, and unsustainable water use practices [3]. Broadly speaking, land degradation is caused by the complex interaction of natural factors (e.g., droughts) and unsustainable anthropogenic land use practices (e.g., overexploitation of natural vegetation cover [5,6,7]. Globally, human-induced land degradation has negatively affected the well-being of at least 3.2 billion people [2]. Consequently, the impact of these anthropogenic activities is leading to a situation in which we could potentially lose 10% of the world’s annual global product in biodiversity and ecosystem services [2]. As a result, understanding the dynamics of land use and land cover change has become the central focus of environmental research around the world [8]. Measures that might prevent and/or avoid land degradation are therefore welcome and shown to be more beneficial in the long term for ecosystem sustainability and human well-being compared to land restoration measures [2]. It is therefore important to improve our understanding of the dynamics of land degradation. This new understanding will assist in improving the current natural land resources management strategies that better protect the environment and ensure food security. Ensuring food security is essential, most especially for the most vulnerable people in rural communities. In this study we focus on the increase (greening) or decrease (browning) of vegetation cover change [9].
Africa accounts for 65% of the world’s extensive cropland degradation [10]. The impact of anthropogenic activities and conflict over the use of land resources in Africa has been recognized as a major problem [11]. Thiombiano and Tourino-Soto [10] (p.2), listed the main causes of land degradation in Africa as: “demography growth, conflicts and wars with expanded refugees settlements, inappropriate soil management, deforestation, shifting cultivation, insecurity in land tenure, variation of climate conditions and intrinsic characteristics of fragile soils in diverse agro-ecological zones.”
In Southern Africa, for example Namibia, land degradation has been identified as a major and urgent issue [3]. Namibia is one of the driest countries in sub-Saharan Africa. About 22% of the land area is classified as desert, 70% as arid to semi-arid, and 8% as dry sub-humid [12]. Consequently, any slight reduction in vegetation cover may have a significantly negative impact on the environment [3] as well as the livelihoods, and social and cultural lives of the people [13]. In Namibia, 70% of the population is subsistence farmers [3]. Most are rural dwellers and depend on natural land resources for their livelihood [3,14].
The negative impact of the reduction in vegetation cover is already being felt in the Kavango and Zambezi Regions in the northeast of the country [3,15]. For example, studies in the Zambezi Region all reported different forms of vegetation cover change (gains and losses) [16,17,18,19]. To address land degradation, the government launched Namibia’s Programme to Combat Desertification (NAPCOD) in 1994, after the country became a signatory to the international Convention to Combat Desertification (CCD) in the same year [20].
In this study we characterize the historical trajectory of the vegetation trend for the 34 years (1982–2015) in the Zambezi Region (formerly Caprivi) of northeastern Namibia. The region has the largest savannah woodland cover in the country [13], comprising a mixture of trees, shrubs, and grasses [17,19]. The region is very important for agriculture due to its fertile soils and high rainfall [19]. Current historical vegetation-related studies in the region are mainly forest inventories [21,22] or categorical in nature [16,17,19]. Moreover, to the best of our knowledge, there are no studies characterizing the general trajectory of the region’s vegetation trend.
The main objective of this study is therefore to characterize the historical trend in vegetation greening or browning in the region in the last 34 years (1982–2015). The specific objectives of this study are to:
(i) analyze the general trajectory of vegetation shift (greening or browning) in the Zambezi Region in the last 34 years (1982–2015);
(ii) analyze the potential factors that might explain the observed vegetation shift during this period (1982–2015).
To characterize the vegetation trajectory, we used time series remote sensing data and the Time Series Segmented Residual Trends (TSS-RESTREND) method [23]. The use of TSS-RESTREND allows the separation of human-induced vegetation cover change from that caused by natural climatic factors [23,24,25]. TSS-RESTREND is a significant method because it addresses the drawbacks of two widely used methods in assessing dryland vegetation: Residual Trends (RESTREND) [25] and Breaks For Additive Seasonal and Trend (BFAST) [26,27]. RESTREND was developed to assess human-induced land degradation over drylands [25]. There is a strong relationship in the drylands between vegetation productivity and precipitation [1,25]. Precipitation is a more dominant factor for vegetation productivity in drylands [25]. This strong relationship makes it difficult to separate vegetation cover changes due to precipitation from those caused by human activities [1]. The Residual Trends (RESTREND) method [25] was developed to remove this strong relationship. When climate variability is accounted for, land degradation due to human activities can be better identified [25]. However, the main drawback of RESTREND is its inability to provide reliable results when there is no strong linear relationship between the variability in the vegetation index and precipitation [23]. Similarly, BFAST was developed to detect points where there was a change in the relationship between the vegetation index and precipitation [23,26,27]. The drawback of BFAST is its sensitivity to interannual variability in climate over dryland ecosystems [28]. Consequently, when a phenological vegetation signal is missing, BFAST interprets this as a breakpoint [23]. Both drawbacks are addressed and implemented in the TSS-RESTREND method and have been successfully used to assess land degradation in dryland Australia [23]. Since Australia and Namibia have a similar dry environment, TSS-RESTREND is very suitable. Using TSS-RESTREND to assess vegetation cover change is unique and provides results that differ from previous studies considered by this study [16,17,18,19].
We anticipate that the results of our long-term vegetation analysis will provide additional information on the historical trajectory of vegetation cover in the Zambezi Region. This additional information may inform policy decision-making regarding natural resources conservation and management in the region and elsewhere.

2. Materials and Methods

2.1. Study Area

The Zambezi Region has a land area of 14,528 km2, with a total population of 98,849. It shares a border with Angola, Botswana, Zimbabwe, and Zambia [29,30]. The region receives the highest annual precipitation in the entire country (500–700 mm/year) [31,32], in contrast to the national mean (<250 mm/year) [3] and the southwestern and coastal areas (<50 mm/year) [31]. The annual evaporation rate in the region is about 2500 mm [32]. There is a distinct wet season, which begins in November and ends in April. The region has average winter and summer temperatures of 5 °C and 35 °C [32]. The vegetation cover in the region is mainly woodland savanna and open grassland [13,19]. The topography of the region is flat, with the height above sea level from 930 m in the east to 1100 m in the west [32]. The region has eight constituencies: Kongola, Judea Lyaboloma, Linyanti, Sibbinda, Katima Mulilo Rural, Kabbe South, Kabbe North and Katima Mulilo Urban (Figure 1) [33]. Apart from Katima Mulilo Urban, the land is communal, administered by traditional authorities. The region has several conservancies, but the most relevant for this study is the Salambala Conservancy because of its long history of communal land administration [19]. A conservancy is an area set aside and managed by local communities who have rights to live within, use, and manage wildlife and other natural resources for personal and tourism purposes [34,35]. The Salambala Conservancy has a core area that is surrounded by 19 villages [36]. The core area is strictly for tourism and wildlife management [36], and all other activities (e.g., grazing, farming, and illegal wood harvesting) are prohibited.

2.2. Satellite Data

We downloaded a total of 816 raster images (two images per month) of 8-km resolution Global Inventory Monitoring and Modeling Systems (GIMMS) normalized difference vegetation index (NDVI) data [37]. The current version of the 8-km GIMMS (NDVI3g.v1) is available from 1981 to 2015 [37,38]. Only raster time series from 1982 to 2015 (816 raster images) were used, because the 1981 dataset is incomplete. All downloaded raster images were used, and none was excluded. The NDVI3g.v1 was generated from the Advanced Very High Resolution Radiometer (AVHRR) sensor using the ration between visible (0.58–0.68 µm) channel one and near-infrared (0.725–1.10 µm) spectral bands [39]. The equation is written as:
( channel   2 channel   1 ) ( channel + channel   1 )
The bi-monthly raster time series were resampled using a common 8-km grid with the nearest neighbor interpolation algorithm, and re-projected to the Universal Transverse Mercator (UTM) coordinate reference system. Finally, the bi-monthly rasters were aggregated to monthly rasters [37], creating 408 NDVI raster images with 12 images per year. During aggregation, the maximum value composite (MVC) technique was applied, and quality flags [37] were used to retain only good quality pixels [9]. The MVC works by retaining the maximum NDVI value for each pixel, which is later used to create the final composite image [40]. Using MVC means the impact and risk of contaminated pixels interfering with the detection of changes within the time series is minimized [41].
The time series precipitation data used was the Global Precipitation Climatology Centre (GPCC), available from 1979 to present [42]. The monthly GPCC 0.25° × 0.25° degree resolution data (1980–2015) was downloaded and processed [43]. The GPCC was resampled to a common 8-km grid and re-projected onto the UTM reference system. The precipitation data used was from 1980–2015 (two years earlier than the NDVI), because this information is required by the processing algorithms during analysis to calculate the maximum rainfall accumulation months. Thus, 432 gridded monthly precipitation rasters were used. GPCC products are gridded and generated using gauges from ca. 67,200 ground stations [44].
For this study, we used precipitation because it is the dominant factor determining vegetation productivity in drylands [25].

2.3. Data Analysis

We used R (R Core Team, 2019) [45] with GIMMS [37] to download NDVI3g.v1 and TSS-RESTREND [23] to perform the analysis. For graphics production and visual interpretation, we used a combination of ArcMap (version 10.5.1) [46], R (R Core Team, 2019) [45], Inkscape (version 0.92.3) [47], and Google Earth Pro.
Pixel-wise analysis was performed using the Time Series Segmentation and Residual Trend (TSS-RESTREND) analysis method [23] to characterize the increased or decreased trajectory of vegetation change. Since TSS-RESTREND was designed to work on a single pixel [23], we wrote an R script that iterated over each pixel across the time series, fit the pixel-wise TSS-RESTREND model, and wrote out the values for each pixel. RESTREND performs a pixel-by-pixel correlation of NDVI and precipitation using the optimal accumulation period and offset months [23]. The residuals are computed by taking the difference between the observed and predicted NDVI [23]. An ordinary least squares linear regression model is fitted for the residual and time [23]. The equation takes the following form:
y i   = β 0 + β 1 x ,
where x is the time in years, β0 is the intercept, β1 is the slope, and i = 1982,…,2015.
One of the main drawbacks of the standard RESTREND algorithm [25] is that it only works well if there is a strong correlation between the vegetation index and precipitation [23]. BFAST, on the other hand, iteratively decomposes the time series into trend, seasonal, and remainder components [48]. BFAST fits a linear piecewise harmonic model using the ordinary least squares moving sum (OLS-MOSUM) to test for structural changes within time series data [41].
The decomposition model takes the following form:
Y t   = T t + S t + e t ,
where Yt is the original observed data time series (TS) at time t, Tt is the trend, St is the seasonal, and et is the remaining unexplained variation within the TS, respectively [26]. The main drawback with BFAST is its sensitivity to interannual variation in climate [28]. It will therefore identify a skipped phenological cycle as a breakpoint [23]. TSS-RESTREND has addressed both drawbacks in RESTREND and BFAST [23]. TSS-RESTREND can segment a time series and test residual monotonicity, and the consistency in the vegetation precipitation relationship (VPR) [23]. TSS-RESTREND fits a multivariate regression between the VPR residual and a dummy variable (0 before a breakpoint, and 1 after). The model takes the following form:
y i   = β 0 + β 1 x +   β 2 z i +   β 3 x i z i
where x is time in years, β0 is the intercept, β1 is the slope, β2 is the offset at the breakpoint position, β3 is the change in slope at the breakpoint position, z is the dummy variable (0 or 1), and i = 1982,…,2015.
To determine how vegetation cover change was distributed across the Zambezi Region, we analyzed the area on two levels: (i) the whole region; and (ii) pixel-wise.
During the analysis, the methods used to fit the models were based on whether a breakpoint was detected or not [23]. If a breakpoint was detected, the type and nature of the breakpoint determined which TSS-RESTREND technique was used in the final analysis [23]. All these processes were automated and implemented in the TSS-RESTREND method. The details concerning how the TSS-RESTREND method works can be found in [23,49]. Here we give only a brief overview of the TSS-RESTREND method. First, the highest correlation of the combinations between the optimal precipitation accumulation period (1–24 months) and offset period (0–3 months) was calculated per pixel [23]. Second, the calculated optimal precipitation accumulation period was then used to fit an ordinary least squares method (OLS) with the NDVI to produce the relation between the vegetation and precipitation across the whole time series (ctsVPR) [23]. The residuals of the ctsVPR were then calculated by recording the difference between the observed and predicted NDVI [23]. This difference was then referred to as the VPR residuals [23]. BFAST was then applied to the VPR residuals to check for any breakpoints, and the Chow test was used to test if any detected breakpoint(s) was/were significant [23]. If the Chow test was non-significant, a regression model was fitted between the VPR residuals against time. This form of regression is referred to as a residual trend analysis (RESTREND) [23,25]. On the other hand, if the Chow test was significant in its VPR residuals, the time series was divided at the breakpoint. A multivariate regression analysis of the VPR residuals and time was performed separately on either side of the breakpoint [23]. This regression is known as the segmented-RESTREND [23]. However, if the Chow test was significant in its VPR, the NDVImax of the time series was divided at the location of the segmented breakpoint, and the VPR was recalculated on both sides of the breakpoint [23]. Having calculated the VPR, the optimal accumulation period was standardized and used to fit a multivariate regression with the NDVImax [23]. Standardizing made it possible to compare all the optimal accumulation and offset periods across all the breakpoints [23].
We also performed a visual interpretation of historical Google Earth satellite images. We interpreted the images by comparing the earlier time period (1984) to the current time (2015 and 2019) images across our study area. We also conducted field trips in 2006 and 2017 to perform a visual assessment of vegetation cover change in the region.

3. Results and Discussion

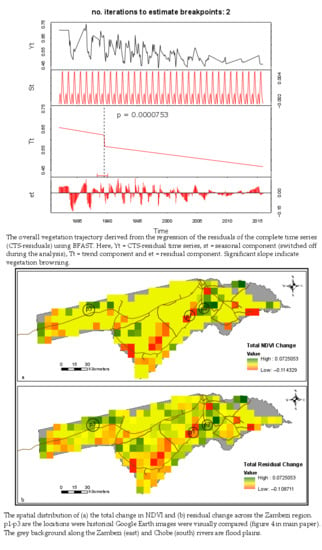
3.1. Historical Trajectory of the Vegetation Trend: 1982–2015

Figure 2 presents the overall trajectory of the vegetation trend in the Zambezi Region during the period 1982–2015, which is characterized by a negative (browning) pattern (Figure 2a). The temporally reordered VPR over the length of the time series indicates a clear negative response of NDVImax to precipitation (Figure 2b). Furthermore, the total break height (BH) of the standardized VPR was significant and negative (BH = −0.125, p = 0.000057, and R2 = 0.519). The residual change (rc) is significant and negative (p = 0.000000951, R2 = 0.636, rc = 0.101) (Figure 2d). The total change (TC) is also negative and significant (TC = −0.226, p = 0.000057).
The most significant breakpoint was detected in 1989 (p = 0.0000753; Figure 2a). The detected breakpoint corresponds to the drought period (1991–1992) in southern Central Africa [50]. However, the impact of the drought was minimal in Namibia compared with other countries in the region (e.g., Zambia and Zimbabwe) [50].
Figure 3a,b shows the pixel-by-pixel distribution of the vegetation trend. The total change in NDVI (Figure 3a) depicts most of the pixels as unchanged. However, the total residual change (Figure 3b) depicts a wide distribution of positive, negative, and unchanged pixels. The negative pixels indicate locations of vegetation cover loss caused by anthropogenic activities, not climatic factors. This is because the NDVI variability associated with climatic factors has been removed and any negative trend in the residuals indicates human-induced vegetation cover loss [25]. However, other natural processes (e.g., forest fires, plant disease, vegetation successional patterns, wild animal grazing, etc.) are also potential drivers of the observed negative trend in vegetation cover. Yet during the study period there were no reports of widespread natural changes. Such natural influences were therefore negligible. We observed that vegetation cover change occurred close to settlements and mostly around road infrastructures (Figure 3a,b). We provide a detailed discussion of the potential factors driving vegetation cover change in Section 3.2.
Our findings regarding the overall trajectory of vegetation cover resonate with similar results by de Blécourt 2018 et.al., and Kamwi et al. 2017 [17,18], who reported vegetation cover change in the Zambezi Region during the same period. Furthermore, the observed vegetation cover change in the region reflects similar observations reported in other regions of Namibia (e.g., Okavango [15,51] and Ohangwena [52,53]). The observed vegetation cover change in the Zambezi Region reflects the historical nature of vegetation cover change in Namibia [54,55,56]. Moreover, similar patterns of vegetation cover change have been reported in Angola [57] and Zambia [58].
Our analysis of historical Google Earth images also confirms the negative trend in vegetation cover shown in Figure 2a. We observed that forest areas cleared for farming and settlement purposes were visible signs of intensive agricultural activity (e.g., p1 in Figure 3a,b and Figure 4a–d). We also observed that pixels showing vegetation greening were the locations of human activity (e.g., p2 in Figure 3a,b and Figure 4e–h). However, some greening pixels (e.g., p3 in Figure 3a,b and Figure 4i–l) were now overgrown by new vegetation. Location p3 is within the Bwabwata National Park, where the former South African Defence Force (SADF) camps and training areas were located. These observations from Google Earth images also showed vegetation cover loss had expanded beyond our study period (1982–2015) (see Figure 4d p1: 2019, and Figure 4h p2: 2019). We also observed the expansion of vegetation cover loss in the region during our field trips in 2006 and 2017.

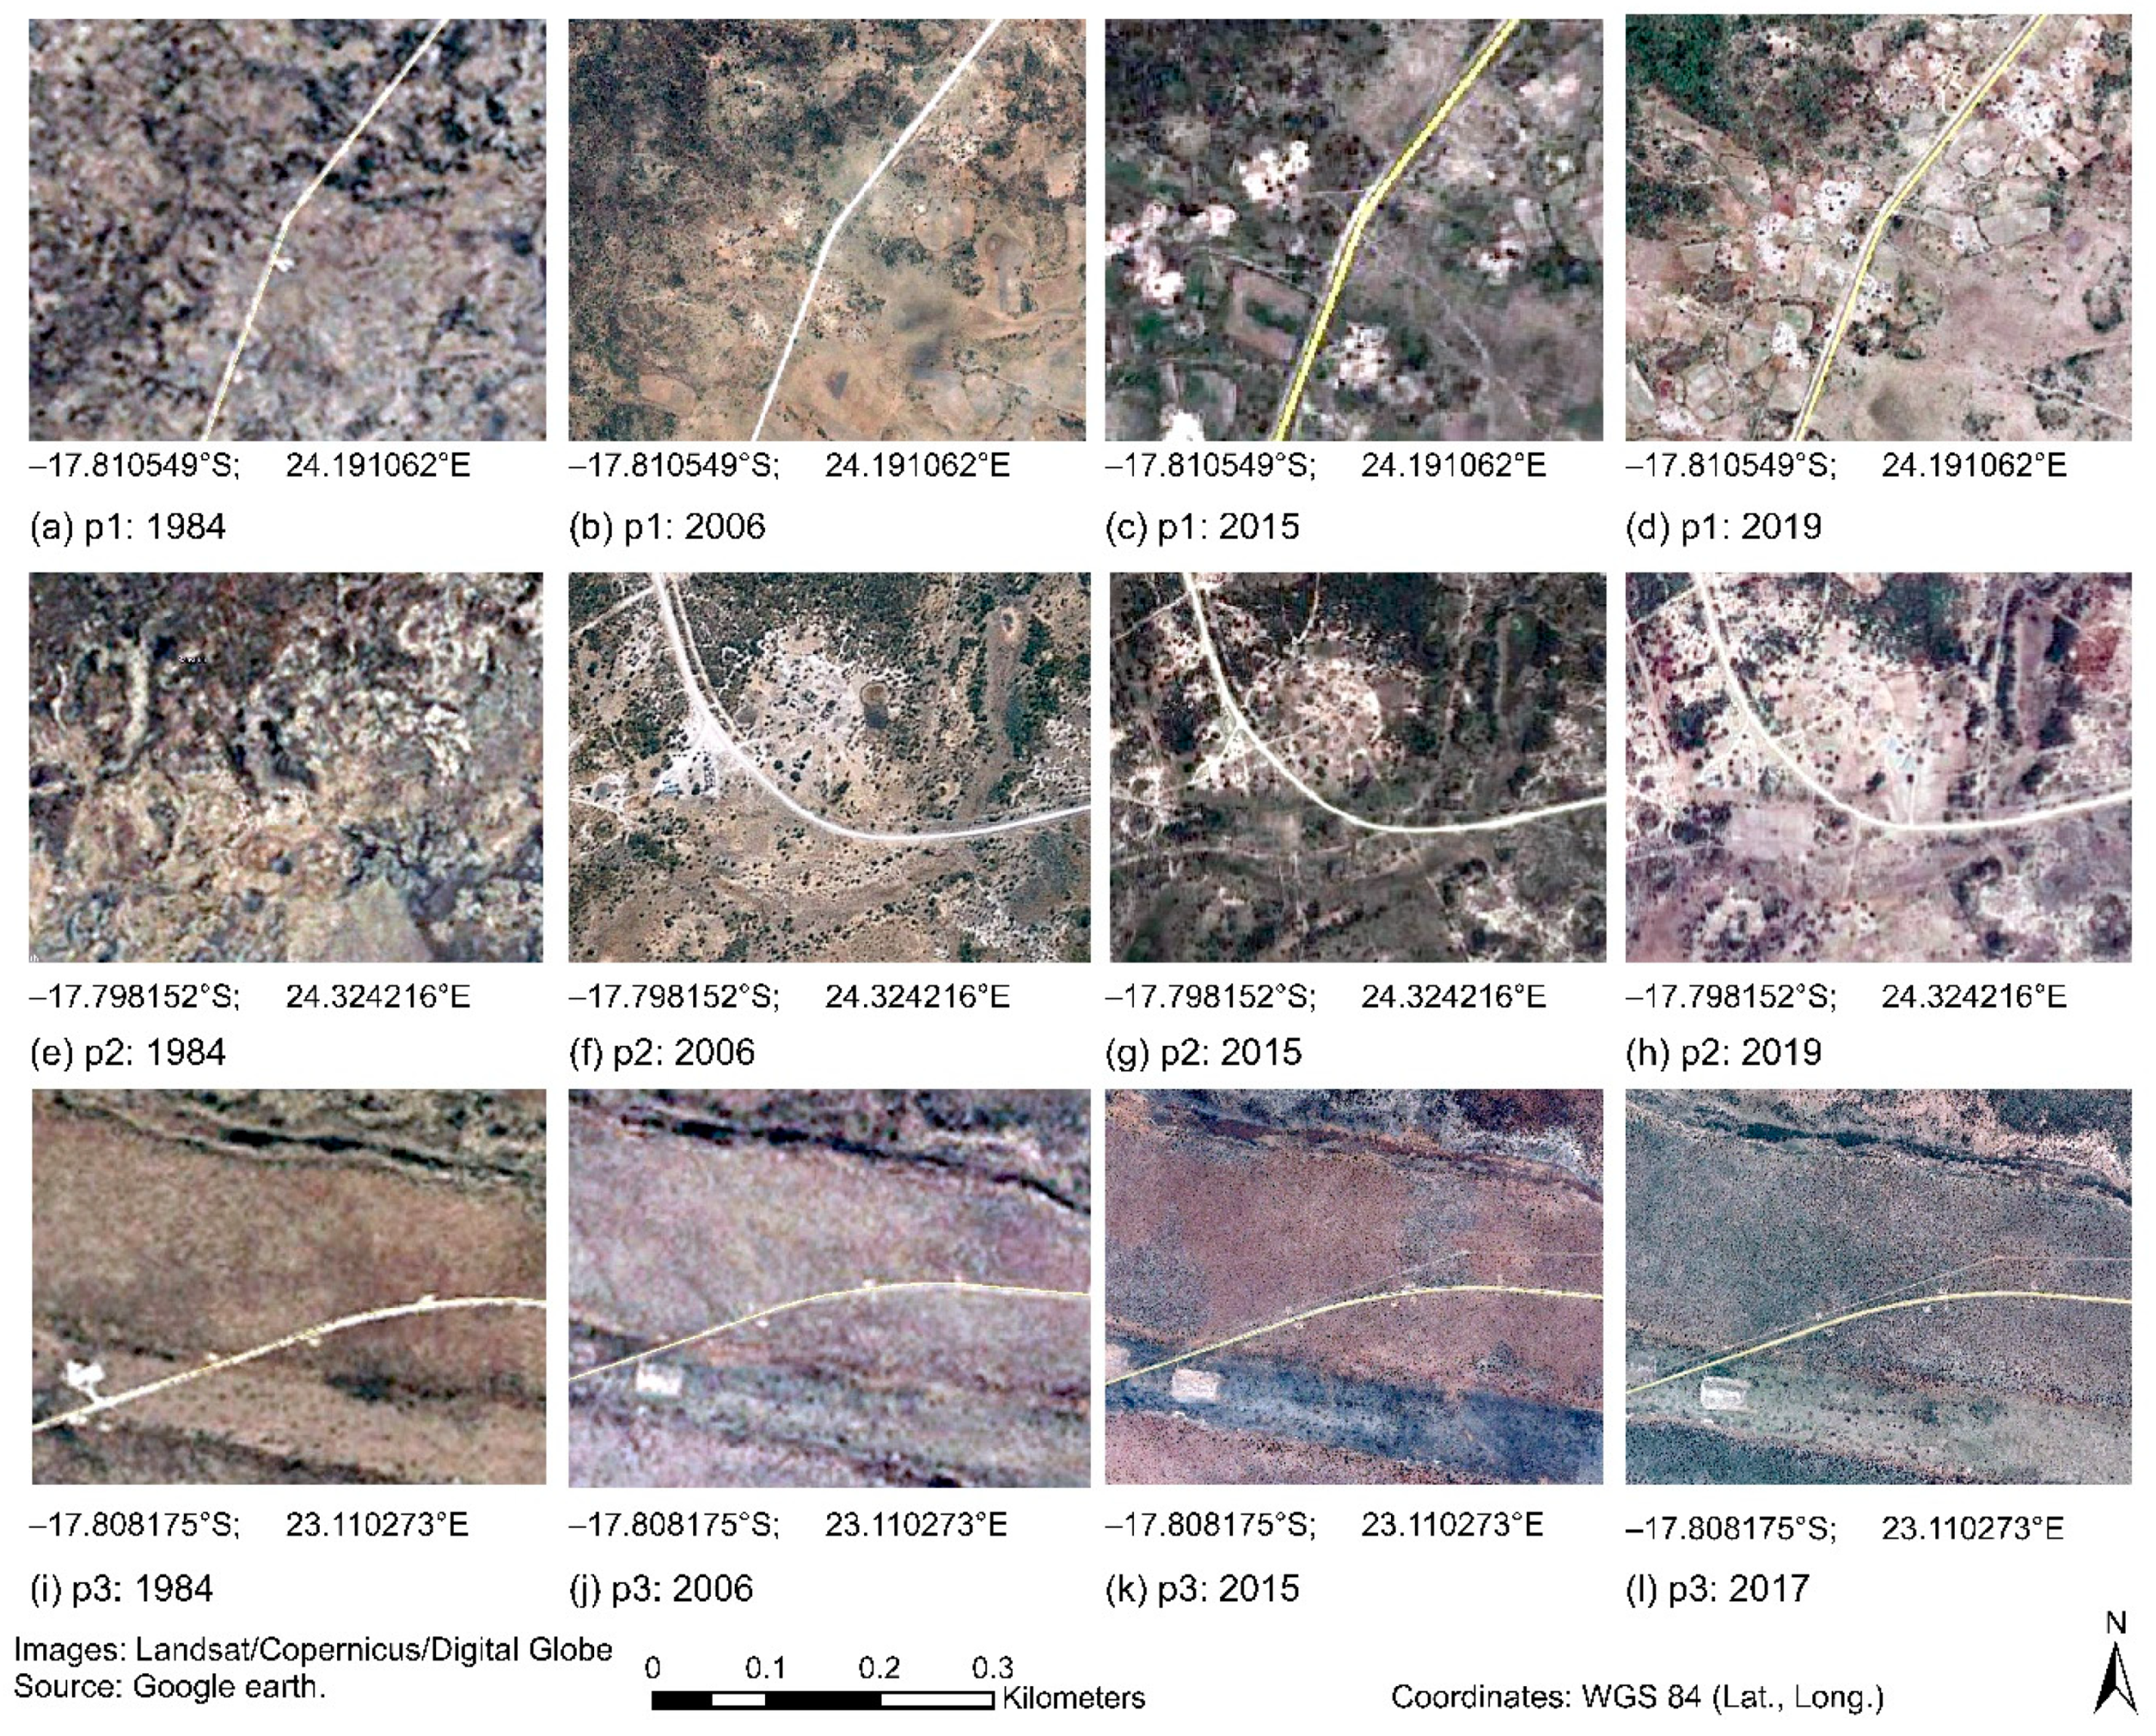
3.2. Potential Direct and Indirect Causes of Vegetation Cover Change: 1982–2015

Following the categorization of Geist and Lambin [8,59], an in-depth literature review revealed that vegetation cover change in the region was driven by the full interplay of demographic [13], ecological (e.g., floods) [60], and environmental factors (e.g., topography) [19]. The main direct causes of vegetation cover change included subsistence farming, infrastructure development (e.g., roads), settlements, and (il)legal wood extraction (e.g., for firewood and housing construction) [13,17,19]. Although the effect of the identified drivers varied across different years, the resolution of our data (8 km) did not allow small-scale abrupt changes to be registered. However, the combined effect of the individual factors was revealed in the trend, which corresponded with previous studies in the region (e.g., [17,18,19]).
Recent studies indicate that woodland conversion to farmland persists in the region [18] due to population growth, leading to an increased demand for land for farming and construction [3,16]. For example, the land area cleared for farming quadrupled from 701.8 ha in 1970 to 3161.3 ha in 2006 [19]. Similarly, the need for grazing areas increased the pressure and demand for land areas in the region, as the number of cattle in the region increased from 100,000 in 1989 to 151,000 in 2012 [19]. In 2012 the density of cattle was about 100:666 large stock unit (LSU) which is close to the region’s carrying capacity of 160:635 LSU [19]. The high density has increased the pressure on land and land resources. The carrying capacity mentioned above does not account for the region’s large elephant herd (about 8726) [61], nor is the largest population of migratory elephants in Africa (about 200,000) accounted for. This population is mainly located in the Chobe National Park in Botswana, on the southern border of the Zambezi Region [62].
Infrastructure expansion, including roads and settlements, is another factor driving vegetation cover change in the region. The length of (minor and main) roads was 699.9 km in 1970 but increased to 2385.0 km by 2006 [19]. An important road is the Trans Zambezi Highway (TZH) (formerly Trans Caprivi Corridor (TCC)) [19,63]. The TZH connects the Copperbelt in Zambia, the Democratic Republic of Congo, and the Walvis Bay seaport in Namibia. It has become an important trade route and has improved access to tourist and inland areas in the Zambezi Region [19]. In addition, the construction of the TZH has resulted in new settlements and farms, usually close to this new road [19]. Consequently, the increase in settlements and population in close proximity to the road has potentially contributed to activities causing the vegetation cover change we have observed (see Figure 3a,b) [3,60].
According to our in-depth literature review, (il)legal extraction of wood is the third direct cause of vegetation cover change in the region. Barnes et al. [64] estimated an annual harvest of 220,000 m3, 18,500 m3, and 59,400 m3 of fuel wood in the region. The wood extraction statistics in the region reflect the national pattern. The national statistics show the annual wood harvest to be 1,022,700 m3 of fuel wood and 334,400 m3 of poles, amounts which are projected to be 2,631,000 m3 and 745,000 m3 by 2030 [64]. Moreover, illegal wood harvesting activities have also been reported to be occurring in the region [13,65,66].
Indirect causes of vegetation cover change in the region include demographic, ecological (e.g., floods), and environmental factors (e.g., topography). According to official census data the population in the region was 90,422 in 1991, but this increased to 97,176 by 2015 [30], with a total of 36,243 agricultural households recorded in the 2013/2014 agricultural census [67]. Like population growth, the number of households also increased in the region. In 1991 the number of households was 18,061, in 2001 and 2011 there were 16,839 and 21,283, respectively [30]. The increase in the number of households agrees with similar studies by de Blécourt et al. [18]. The drop in population and number of households in 2001 was due to the human immunodeficiency virus (HIV)/acquired immune deficiency syndrome (AIDS) epidemic, which infected about 40% of the region’s people [68,69], and to the electoral rezoning of the region [19]. However, improved healthcare and the availability of antiretroviral drugs [70,71] brought population growth to the region. This led to the conversion of large expanses of woodland into agricultural farmland [16], settlements, and other land use, such as fields for cattle grazing [3,19].
Recently, recurrent floods have driven the migration and resettlement of people and livestock seeking higher elevation areas, mostly close to roads [3,16,19]. For example, the 2009 floods affected about 700,000 people in six regions in northern Namibia (Zambezi, Kavango, Ohangwena, Omusati, Oshana, and Oshikoto), displacing 55,000 people, 28,000 of whom had to be relocated [72]. The floods of 2011 affected 138,300 people, 60,000 lost their properties, and 18,000 had to be relocated [72]. In the Zambezi Region the 2009 floods displaced about 23,000 people, destroying about 7017 homes and 71 km of roads with estimated damages of 19 million US dollars [65]. Other flood events included: (i) 2002 and 2003, which affected about 12,000 people; (ii) 2004, which affected more than 20,000 people; (iii) 2007, which displaced about 15,000 people [19]; (iv) 2010, which affected 50,000 people, with 17,109 requiring relocation [73]; (v) 2011, which required the relocation of 10,954 people [74]; and (vi) 2012, with 11,000 people relocated [75]. The extent of flood during 2009, 2011, and 2012 were mapped to cover an area of 542 km2, 720 km2, and 673 km2, respectively [60]. All these flood events contributed to an increase in settlements and placed further pressure on land and the demand for natural land resources for housing, farming, and grazing [3,16,19]. The demand increased the amount of wood extracted and the land area cleared for farming and grazing [16,19]. It has been suggested that the amount of wood harvested could be higher than the reported official statistics [36].
Our own field observations and interviews, corroborated by other authors [54,76,77], reveal that other factors contributing to loss of vegetation cover in the region include land tenure, longstanding traditional land inheritance [19], and non-harmonized land management practices between the state government and traditional authorities [19]. Colpaert et al. [19] also noted that expanding the protected areas led to more pressure on the remaining communal land. This expansion resulted in regional conflicts [19] and people resettling in protected areas [16,20,36]. All these anthropogenic activities may explain the vegetation cover change in the region, and why this is largely occurring close to the road (see Figure 3a,b).

4. Conclusions

Our findings provide a better understanding of the long-term trajectory of the vegetation cover trend in the Zambezi Region of northeastern Namibia in the last 34 years (1982–2015). Our analysis reveals the long-term trajectory of vegetation cover change to be negative. There are visible signs of vegetation cover change. We observed the vegetation cover change to be mostly around road infrastructures with high population densities. An in-depth literature review revealed the main drivers of vegetation cover change in the region to be subsistence farming, infrastructure expansion, including settlements, and (il)legal wood extraction for firewood.
Population growth and land tenure insecurity (including customary land rights) are among the major indirect drivers of vegetation cover change. The spatial trend of vegetation cover and the visible anthropogenic signs we have observed suggest there is a distinct correlation. It appears these drivers have potentially contributed significantly to driving the vegetation cover change observed by this study. To this end, any land use policy should include additional measures to enhance food and energy security and provide incentives for rural dwellers to properly and sustainably use and manage land resources. These measures will help reverse vegetation browning in the Zambezi Region and elsewhere in Namibia. Of particular concern are the unregulated expansion of farming and illegal wood harvesting activities. These undesirable land use activities are severely impacting vegetation cover and the wildlife population. This requires the relevant authorities and conservation officials to address the problem of unwanted activities by strengthening forest governance and enhancing the capacity of the region’s law enforcement authorities to act.
Capturing land cover change using coarse resolution data (8 km in this study) is challenging [23,28], though such data have been successfully used to characterize land cover change (e.g., [23,25]). Future studies might therefore explore higher resolution datasets and historical documents to assess the effect of demographic change, disease, civil unrest, and war.

Author Contributions

Conceptualization: A.-M.G.G., Y.T.T. and A.C.; data curation: A.-M.G.G. and A.C.; formal analysis: A.-M.G.G. and A.C.; investigation: A.-M.G.G.; methodology: A.-M.G.G. and A.C.; software: A.-M.G.G. and A.C.; visualization: A.-M.G.G. and A.C.; writing—original draft preparation: A.-M.G.G.; writing—review and editing: A.-M.G.G., Y.T.T. and A.C.; funding acquisition, A.C.; project administration, A.C.; resources: A.C.; supervision, A.C.

Funding

This research and APC was funded by the Kone Foundation, project number 085,244, and the University of Eastern Finland.

Acknowledgments

We acknowledge the University of Namibia (UNAM), especially the staff of the Katima-Mulilo campus, for their assistance during the fieldwork. We would especially like to mention the tireless support of the campus director, Bennett Kamungu, and the MSc students during field trips in the area. We also thank Lauri Korhonen of the School of Forest Sciences at the University of Eastern Finland for providing some R code snippets.

Conflicts of Interest

The authors declare no conflicts of interest.

References

  1. Wessels, K.J.; Prince, S.D.; Malherbe, J.; Small, J. Can human-induced land degradation be distinguished from the effects of rainfall variability? A case study in South Africa. J. Arid Environ. 2007, 68, 271–297. [Google Scholar] [CrossRef]
  2. IPBES. Summary for Policymakers of the Thematic Assessment Report on Land Degradation and Resporation of the Intergovernmental Platform on Biodiversity and Ecosystem Services; IPBES secretariat: Bonn, Germany, 2018; Volume 36. [Google Scholar]
  3. NAPCOD. Third National Action Programme for Namibia To Implement the United Nations Convention to Combat Desertification 2014–2024; Ministry of Environment and Tourism: Windhoek, Namibia, 2014.
  4. Zhou, Q.; Li, B.; Kurban, A. Trajectory analysis of land cover change in arid environment of China. Int. J. Remote Sens. 2008, 29, 1093–1107. [Google Scholar] [CrossRef]
  5. Weinzierl, T.; Wehberg, J.; Böhner, J.; Conrad, O. Spatial Assessment of Land Degradation Risk for the Okavango River Catchment, Southern Africa. Land Degrad. Dev. 2016, 27, 281–294. [Google Scholar] [CrossRef]
  6. Ibrahim, Y.Z.; Balzter, H.; Kaduk, J.; Tucker, C.J. Land degradation assessment using residual trend analysis of GIMMS NDVI3g, soil moisture and rainfall in Sub-Saharan West Africa from 1982 to 2012. Remote Sens. 2015, 7, 5471–5494. [Google Scholar] [CrossRef]
  7. Geist, H.J.; Lambin, E.F. Proximate Causes and Underlying Driving Forces of Tropical Deforestation. Bioscience 2002, 52, 143. [Google Scholar] [CrossRef]
  8. Tegegne, Y.T. FLEGT and REDD+ synergies and impacts in the Congo Basin: lessons for global forest governance. Academic dissertation for the Dr. Sc. (Agric.&For.) Degree; Viikki Tropical Resources Institute (VITRI): Helsinki, Finland, 2016; ISBN 978-951-51-2816-4. [Google Scholar]
  9. de Jong, R.; Verbesselt, J.; Zeileis, A.; Schaepman, M. Shifts in Global Vegetation Activity Trends. Remote Sens. 2013, 5, 1117–1133. [Google Scholar] [CrossRef] [Green Version]
  10. Thiombiano, L.; Tourino-Soto, I. Status and Trends in Land Degradation in Africa. In Climate and Land Degradation; Springer: Berlin/Heidelberg, Germany, 2007; pp. 39–53. [Google Scholar]
  11. Brink, A.B.; Bodart, C.; Brodsky, L.; Defourney, P.; Ernst, C.; Donney, F.; Lupi, A.; Tuckova, K. Anthropogenic pressure in East Africa-Monitoring 20 years of land cover changes by means of medium resolution satellite data. Int. J. Appl. Earth Obs. Geoinf. 2014, 28, 60–69. [Google Scholar] [CrossRef]
  12. Turpie, J.; Midgley, G.; Brown, C.; Barnes, J.; Pallett, J.; Desmet, P.; Tarr, J.; Tarr, P. C Limate C Hange Vulnerability and Adaptation Assessment For Namibia’s Biodiversity and Protected Area System; Anchor Enviromental Consultants, Namibia Nature Foundation, and South African Institute for Environmental Assessment: Amesbury, MA, USA, 2010. [Google Scholar]
  13. Kamwi, J.M.; Chirwa, P.W.C.; Manda, S.O.M.; Graz, P.F.; Kätsch, C. Livelihoods, land use and land cover change in the Zambezi Region, Namibia. Popul. Environ. 2015, 37, 207–230. [Google Scholar] [CrossRef] [Green Version]
  14. Jones, B.T.B. Community Management of Natural Resources in Namibia; International Institute for Environment and Development (IIED): London, UK, 1999. [Google Scholar]
  15. Pröpper, M.; Gröngröft, A.; Falk, T.; Eschenbach, A.; Fox, T.; Gessner, U.; Hecht, J.; Hinz, M.O.; Huettich, C.; Hurek, T.; et al. Causes and perspectives of land-cover change through expanding cultivation in Kavango. In Biodiversity in Outhern Africa. Volume 3: Implications for Landuse and Management; Hoffma, M.T., Schmiedel, U., Jürgens, N., Eds.; Klaus Hess Publishers: Hohenhorn, Germany, 2010; ISBN 9783933117441. [Google Scholar]
  16. Wingate, V.; Phinn, S.; Kuhn, N.; Bloemertz, L.; Dhanjal-Adams, K. Mapping Decadal Land Cover Changes in the Woodlands of North Eastern Namibia from 1975 to 2014 Using the Landsat Satellite Archived Data. Remote Sens. 2016, 8, 681. [Google Scholar] [CrossRef]
  17. Kamwi, J.M.; Kaetsch, C.; Graz, F.P.; Chirwa, P.; Manda, S. Trends in land use and land cover change in the protected and communal areas of the Zambezi Region, Namibia. Environ. Monit. Assess. 2017, 189, 242. [Google Scholar] [CrossRef]
  18. de Blécourt, M.; Röder, A.; Gröngröft, A.; Baumann, S.; Frantz, D.; Eschenbach, A. Deforestation for agricultural expansion in SW Zambia and NE Namibia and the impacts on soil fertility, soil organic carbon- and nutrient levels. In Climate Change and Adaptive Land Management in Southern Africa: Assessments, Changes, Challenges, and Solutions: Product of the First Research Portfolio of SASSCAL 2012–2018; Klaus Hess: Hohenhorn, Germany, 2018. [Google Scholar]
  19. Colpaert, A.; Matengu, K.; Polojärvi, K. Land use practices in Caprivi’s changing political environment. J. Stud. Hum. Soc. Sci. 2013, 2, 141–162. [Google Scholar]
  20. Klintenberg, P.; Seely, M. Land degradation monitoring in Namibia: A first approximation. Env. Monit. Assess. 2004, 99, 5–21. [Google Scholar] [CrossRef]
  21. Chakanga, M.; Korhonen, K.; Seläniemi, T. Forest Inventory Report of Caprivi Region; Ministry of Environment and Tourism, Directorate of Forestry: Windhoek, Namibia, 1998.
  22. Laamanen, R.; Otsub, M.; Tubalele, M. Woody Resources in the Salambala Conservancy Core Area; Ministry of Environment and Tourism, Directorate of Forestry: Windhoek, Namibia, 2002.
  23. Burrell, A.L.; Evans, J.P.; Liu, Y. Detecting dryland degradation using Time Series Segmentation and Residual Trend analysis (TSS-RESTREND). Remote Sens. Environ. 2017, 197, 43–57. [Google Scholar] [CrossRef]
  24. Wessels, K.J.; Prince, S.D.; Frost, P.E.; Van Zyl, D. Assessing the effects of human-induced land degradation in the former homelands of northern South Africa with a 1 km AVHRR NDVI time-series. Remote Sens. Environ. 2004, 91, 47–67. [Google Scholar] [CrossRef]
  25. Evans, J.; Geerken, R. Discrimination between climate and human-induced dryland degradation. J. Arid Environ. 2004, 57, 535–554. [Google Scholar] [CrossRef]
  26. Verbesselt, J.; Hyndman, R.; Newnham, G.; Culvenor, D. Detecting trend and seasonal changes in satellite image time series. Remote Sens. Environ. 2010, 114, 106–115. [Google Scholar] [CrossRef]
  27. Verbesselt, J.; Zeileis, A.; Hyndman, R. Breaks for Additive Season and Trend (BFAST). Tech. Rep. 2012. Version 1.4.4. p. 23. Available online: http//r-forge.r-project.org/projects/bfast/ (accessed on 19 October 2019).
  28. De Jong, R.; Verbesselt, J.; Schaepman, M.E.; De Bruin, S. Trend changes in global greening and browning: Contribution of short-term trends to longer-term change Running title: Trend changes in global greening and browning. Glob. Chang. Biol. 2012, 18, 642–655. [Google Scholar] [CrossRef]
  29. NSA Zambezi Demographic Statistics. Available online: https://namibia.opendataforafrica.org/apps/atlas/Zambezi (accessed on 10 October 2018).
  30. NSA. Namibia 2011 Census Atlas; Namibia Statisitcs Agency: Windhoek, Namibia, 2011. [Google Scholar]
  31. Mendelsohn, J.; Jarvis, A.; Roberst, C.; Robertson, T. Atlas of Namibia: A Portrait of the Land and Its People; Published for the Ministry of Environment and Tourism by David Philip: Cape Town, South Africa, 2002; ISBN 0-86486-516-3.
  32. Mendelsohn, J.; Roberts, C. Environmental Profile and Atlas of Caprivi; Directorate of Environment and Tourism Affairs, Ministry of Enviornment and Tourism: Windhoek, Namibia, 1997; ISBN 0-86976-408-X.
  33. GON. Regional Government-GRN Portal. Available online: http://www.gov.na/regional-government (accessed on 12 October 2018).
  34. Mufune, P. Community Based Natural Resource Management (CBNRM) and Sustainable Development in Namibia. J. Land Rural Stud. 2015, 3, 121–138. [Google Scholar] [CrossRef]
  35. NACSO. Namibia’s Communal Conservancies: A Review of Progress and Challenges in 2011; Namibian Association of CBNRM Support Organisations: Windhoek, Namibia, 2013; Volume 2013. [Google Scholar]
  36. Laamanen, R.; Otsub, M. Forest Management Plan for the Salambala Conservancy Core Area; Ministry of Environment and Tourism, Directorate of Forestry: Windhoek, Namibia, 2002. [Google Scholar]
  37. Detsch, F. Download and Process GIMMS NDVI3g Data. R Packag. 2016. Version 1.0.0. pp. 1–13. Available online: https://cran.r-project.org/package=gimms (accessed on 12 October 2019).
  38. Guo, M.; Li, J.; He, H.; Xu, J.; Jin, Y. Detecting Global Vegetation Changes Using Mann-Kendal (MK) Trend Test for 1982–2015 Time Period. Chin. Geogr. Sci. 2018, 28, 907–919. [Google Scholar] [CrossRef]
  39. Pinzon, J.; Tucker, C. A Non-Stationary 1981–2012 AVHRR NDVI3g Time Series. Remote Sens. 2014, 6, 6929–6960. [Google Scholar] [CrossRef]
  40. Holben, B.N. Characteristics of maximum-value composite images from temporal AVHRR data. Int. J. Remote Sens. 1986, 7, 1417–1434. [Google Scholar] [CrossRef]
  41. Jong, R.; Verbesselt, J.; Schaepman, M.E.; Bruin, S. Trend changes in global greening and browning: Contribution of short-term trends to longer-term change. Glob. Chang. Biol. 2012, 18, 642–655. [Google Scholar] [CrossRef]
  42. Adler, R.F.; Huffman, G.J.; Chang, A.; Ferraro, R.; Xie, P.; Janowiak, J.; Rudolf, B.; Schneider, U.; Curtis, S.; Bolvin, D.; et al. The Version-2 Global Precipitation Climatology Project (GPCP) Monthly Precipitation Analysis (1979–Present). J. Hydrometeorol. 2003, 4, 1147–1167. [Google Scholar] [CrossRef]
  43. Schneider, U.; Becker, A.; Finger, P.; Meyer-Christoffer, A.; Ziese, M. GPCC Full Data Monthly Product Version 2018 at 0.25°: Monthly Land-Surface Precipitation from Rain-Gauges built on GTS-based and Historical Data. 2018. [Google Scholar] [CrossRef]
  44. Schneider, U.; Becker, A.; Finger, P.; Meyer-Christoffer, A.; Ziese, M.; Rudolf, B. GPCC’s new land surface precipitation climatology based on quality-controlled in situ data and its role in quantifying the global water cycle. Theor. Appl. Clim. 2014, 115, 15–40. [Google Scholar] [CrossRef]
  45. R Core Team. A Language and Environment for Statistical Computing; R Foundation for Statistical Computing: Vienna, Austria, 2019. Available online: http//www.R-project.org/ (accessed on 19 October 2019).
  46. ESRI. Environmental Systems Research Institute (ESRI); ESRI: Redlands, CA, USA, 2017; ArcGIS 10.5.1. [Google Scholar]
  47. Inkscape: An Open-Source Vector Graphics Editor. Available online: https://inkscape.org/ (accessed on 25 October 2019).
  48. Grogan, K.; Pflugmacher, D.; Hostert, P.; Verbesselt, J.; Fensholt, R. Mapping Clearances in Tropical Dry Forests Using Breakpoints, Trend, and Seasonal Components from MODIS Time Series: Does Forest Type Matter? Remote Sens. 2016, 8, 657. [Google Scholar] [CrossRef]
  49. Burrell, A.L.; Evans, J.P.; Liu, Y. The impact of dataset selection on land degradation assessment. ISPRS J. Photogramm. Remote Sens. 2018, 146, 22–37. [Google Scholar] [CrossRef]
  50. Gommes, R.; Petrassi, F. Rainfall Variability and Drought in Sub-Saharan Africa; Environmenatl and Natural Resources Service (SDRN) FAO Research, Extension and Training Division, FAO: Rome, Italy, 1996. [Google Scholar]
  51. Röder, A.; Pröpper, M.; Stellmes, M.; Schneibel, A.; Hill, J. Land Use Policy Assessing urban growth and rural land use transformations in a cross-border situation in Northern Namibia and Southern Angola. Land Use Policy 2015, 42, 340–354. [Google Scholar] [CrossRef]
  52. Erkkilä, A. Living on the Land: Change in Forest Cover in North-Central Namibia 1943–1996. Silva Carelia 37; University of Joensuu, Faculty of Forestry: Joensuu, Finland, 2001; p. 118. [Google Scholar]
  53. Erkkilä, A.; Löfman, S. Forest cover change in the ohangwena region, Northern Namibia: A case study based on multitemporal landsat images and aerial photography. S. Afr. J. 1999, 184, 25–32. [Google Scholar] [CrossRef]
  54. Watts, S. The effects of communal land resource management on forest conservation in northern and north-eastern Namibia. Dev. S. Afr. 2003, 20, 337–359. [Google Scholar] [CrossRef]
  55. Erkkilä, A.; Siiskonen, H. Forestry in Namibia 1850-1990; Silva Carelica 20. University of Joensuu: Joensuu, Finland, 1992. [Google Scholar]
  56. FAO. Global Forest Resources Assessment 2015. Desk Reference; Food and agricultural Organization of the United Nations: Room, Italy, 2015; ISBN 978-92-5-108826-5. [Google Scholar]
  57. Mendelsohn, J.M. Landscape Changes in Angola. Biodivers. Angola 2019, 123–137. [Google Scholar] [Green Version]
  58. Petit, C.; Scudder, T.; Lambin, E. Quantifying processes of land-cover change by remote sensing: Resettlement and rapid land-cover changes in south-eastern Zambia. Int. J. Remote Sens. 2001, 22, 3435–3456. [Google Scholar] [CrossRef]
  59. Tegegne, Y.T.; Lindner, M.; Fobissie, K.; Kanninen, M. Evolution of drivers of deforestation and forest degradation in the Congo Basin forests: Exploring possible policy options to address forest loss. Land Use Policy 2016, 51, 312–324. [Google Scholar] [CrossRef]
  60. Long, S.; Fatoyinbo, T.E.; Policelli, F. Flood extent mapping for Namibia using change detection and thresholding with SAR. Environ. Res. Lett. 2014, 9, 035002. [Google Scholar] [CrossRef]
  61. Rowan, M.B. The Transboundary Mammal Project of the Ministry of Environment and Tourism Namibia Facilitated by The Namibia Nature Foundation; Ministry of Environment and Tourism: Windhoek, Namibia, 2005.
  62. Pricope, N.G. Variable-source flood pulsing in a semi-arid transboundary watershed: The Chobe River, Botswana and Namibia. Environ. Monit. Assess. 2013, 185, 1883–1906. [Google Scholar] [CrossRef]
  63. Zeller, W. Danger and opportunity in Katima Mulilo: A Namibian border boomtown at transnational crossroads. J. S. Afr. Stud. 2009, 35, 133–154. [Google Scholar] [CrossRef]
  64. Barnes, J.I.; Nhuleipo, O.; Muteyauli, P.I.; Macgregor, J. Preliminary economic asset and flow accounts for forest resources in Namibia. Environment 2005, 264, 29. [Google Scholar]
  65. Shinovene, I.; Ngutjinazo, O. Nghinomenwa Erastus Rare Namibian Hardwood Trees Face the Chop-Amabhungane. Available online: https://amabhungane.org/stories/rare-namibian-hardwood-trees-face-the-chop/ (accessed on 20 June 2019).
  66. Grobler, J. Felling Namibia’s Ancient Giants. Available online: https://www.occrp.org/en/investigations/7125-felling-namibia-s-ancient-1 (accessed on 13 February 2018).
  67. MAWF. Namibia Census of Agriculture Communal Sector; Namibia Statistics Agency: Windhoek, Namibia, 2015. [Google Scholar]
  68. De la Torre, C.; Khan, S.; Eckert, E.; Luna, J.; Koppenhaver, T. HIV/AIDs in Namibia: Behavioral and Contextual Factors Driving the Epidemic; Ministry of Health and Social Services: Windhoek, Namibia, 2009.
  69. Hong, S.Y.; Fanelli, T.J.; Jonas, A.; Gweshe, J.; Tjituka, F.; Sheehan, H.M.B.; Wanke, C.; Terrin, N.; Jordan, M.R.; Tang, A.M. Household Food Insecurity Associated with Antiretroviral Therapy Adherence Among HIV-Infected Patients in Windhoek, Namibia. Jaids J. Acquir. Immune Defic. Syndr. 2014, 67, e115–e122. [Google Scholar] [CrossRef]
  70. Chinsembu, K.C.; Hedimbi, M. An ethnobotanical survey of plants used to manage HIV/AIDS opportunistic infections in Katima Mulilo, Caprivi region, Namibia. J. Ethnobiol. Ethnomed. 2010, 6, 25. [Google Scholar] [CrossRef]
  71. Phororo, H. HIV/AIDS and the Private Sector in Namibia: Getting the Small Businesses on Board; Hanns Seidel Foundation Namibia: Windhoek, Namibia, 2003. [Google Scholar]
  72. Anthonj, C.; Nkongolo, O.T.; Schmitz, P.; Hango, J.N.; Kistemann, T. The impact of flooding on people living with HIV: A case study from the Ohangwena Region, Namibia. Glob. Health Action 2015, 8, 1–14. [Google Scholar] [CrossRef]
  73. DREF. Namibia Floods; International Federation of red Cross and Red Crescent (IFRC) Disaster Relief Fund(DREF): Geneva, Switzerland, 2011. [Google Scholar]
  74. DDRM-OPM. National Response to the 2011 Flood Disaster; Directorate Disater Risk Managment-OPM: Windhoek, Namibia, 2011. [Google Scholar]
  75. Nakale Albertina Floods Subside in Caprivi-Namibia|ReliefWeb. Available online: https://reliefweb.int/report/namibia/floods-subside-caprivi (accessed on 2 July 2019).
  76. Röder, A.; Pröpper, M.; Stellmes, M.; Schneibel, A.; Hill, J. Reprint of “Assessing urban growth and rural land use transformations in a cross-border situation in Northern Namibia and Southern Angola”. Land Use Policy 2016, 53, 97–111. [Google Scholar] [CrossRef]
  77. Coetzee, M.; Kinyaga, V.; Kruger, B.; Seely, M.; Werner, W. Combating land degradation in Namibia over 23 years: Learning what matters in DLDD. Trans. R. Soc. S. Afr. 2014, 69, 171–174. [Google Scholar] [CrossRef]
Figure 1. Location of study area, the Zambezi region (a), in Namibia (b) showing main roads, towns and settlements.
Land 08 00160 g001
Figure 2. (ac) The output of the Time Series Segmented Residual Trends (TSS-RESTREND) analysis across the Zambezi Region. (a) The overall vegetation trajectory is derived from the regression of the residuals of the complete time series (CTS residuals) using Breaks For Additive Seasonal and Trend (BFAST). Here, Yt = CTS residual time series, st = seasonal component (switched off during the analysis), Tt = trend component, and et = residual component. (b) The reordered temporal distribution of normalized difference vegetation index (NDVImax) over time. The vertical dotted line represents the position of the breakpoint. The orange and purple points are the values before and after the breakpoint, respectively. (c) The standardized change in the segmented vegetation precipitation relationship (VPR) are before (orange) and after (purple) the detected breakpoint. The break height of the VPR (BH = −0.125) is indicated by the black bar; the broken gray line is the VPR fitted to the data using a standard RESTREND. (d) The segmented RESTREND method that was used with the segmented VPR. The residual change (rc = −0.101) is indicated by the red vertical bar. To calculate the total change (TC = −0.226), we added the BH and the rc. The p-value and R2 are also displayed on the graph.
Land 08 00160 g002
Figure 3. The spatial distribution of (a) the total change in NDVI and (b) residual change across the Zambezi Region. p1–p3 are the locations where historical Google Earth images were visually compared (Figure 4). The gray background along the Zambezi (east) and Chobe (south) Rivers are floodplains.
Land 08 00160 g003
Figure 4. Visual comparison of historical images from select pixels where vegetation cover change was occurring across the Zambezi Region in 1984 and 2015. These locations (p1–p3) correspond to the marked pixels in Figure 3a,b above. p1 shows the approximate location of degraded pixels between 1984 (left-hand column) and 2015 (middle column), covering the period of our NDVI data. The greening pixel (p2) is due to human activity (possibly farms or surface grasses). The right-hand column represents the situation beyond our study period. The location (p3) shows evidence of forest regeneration. We used images on December 31 for 1984 and 2015. For the images in the third column on the right, we used the best quality images closest to the same altitude as in 1984 and 2015.
Land 08 00160 g004

