Abstract
Wildlands are increasingly lost to human development. Conservation scientists repeatedly call for protecting the remaining wildlands and expanding the land area protected in reserves. Despite these calls, conservation reserves can be eliminated through legislation that demotes their conservation status. For example, legislation introduced to the Congress of the United States recently would demote 29 Wilderness Study Areas (WSAs) from the protections afforded by their existing status. The proposed legislation suggests that the 29 areas are not suitable for a promotion and future inclusion in the National Wilderness Preservation System based on decades-old local evaluations. Local evaluations, notwithstanding, it may be important to consider the value of lands from a national perspective. Without a national perspective, local evaluations alone may lead to overlooking the national significance of lands. With this in mind, I used five qualities of wildland value (wildness, intactness of night sky, lack of human-generated noises, intactness of mammals, and intactness of mammal carnivores of conservation concern) to compare the 29 WSAs to all national parks and wilderness areas located within the contiguous United States. The pool of 29 WSAs was similar to the pool of national parks and wilderness areas with respect to the five qualities assessed, and some of the WSAs were characterized by higher values than most of national parks and wilderness areas. This analysis demonstrates the national significance of the WSAs targeted for demotion of their existing conservation status. Such an approach could be used in future land management legislation and planning to ensure that a national perspective on conservation value is brought to bear on decisions facing federally-managed lands.
1. Introduction
Humans are impacting Earth’s remaining wildlands at an increasingly rapid rate, and researchers have measured this loss at global and national scales [1,2]. Given the loss of wildlands, conservation scientists continue to make calls to protect what is left of Earth’s wild places [3,4,5]. Wildlands are defined by their lack of human modification and serve to maintain ecological processes, populations of species, and biological diversity [5,6,7]. Lack of human modification in the way of limited road density, light and noise pollution, and intact biological communities represent important conservation priorities [1].
Protected areas, including national parks and wilderness areas, are an effective means of maintaining wildlands and the values therein [8,9]. Teams of scientists have recommended additional lands be included in protected areas [10], recognizing that existing systems of conservation reserves may be insufficient to sustain species and ecosystems into the future [11]. Despite these calls for additional protected areas, policy makers at times recommend that conservation protections be removed from lands (e.g., Bears Ears National Monument and the Arctic National Wildlife Refuge).
In December 2017, Senator Steve Daines introduced the Protect Public Use of Public Lands Act to the U.S. Congress, which would “release” five Wilderness Study Areas (WSAs) located on U.S. Forest Service lands in Montana. Later in March of 2018, Congressman Greg Gianforte introduced two bills to release 24 additional WSAs, mostly located on Bureau of Land Management (BLM) lands in Montana. The release of these 29 WSAs (Figure 1) would functionally eliminate the management direction that maintains the wild character of these places. WSAs are classified by the Gap Analysis Program (GAP) as GAP status 2 because of the management directives that maintain biological diversity while restricting commercial extractive uses (timber harvesting or mineral and energy extraction) and motorized recreation. GAP status classification ranges from 1 to 4 and is assigned to lands or management areas based on their policies and guidelines (Table 1). The Forest Service WSAs targeted in the proposed bills were originally designated by Congress via the Montana Wilderness Study Act of 1977 to “maintain their presently existing wilderness character and potential for inclusion in the National Wilderness Preservation System”. The BLM WSAs were designated as such through administrative planning processes based on mandates in the Federal Land Policy Management Act of 1976 [12] to preserve the wilderness character of lands.
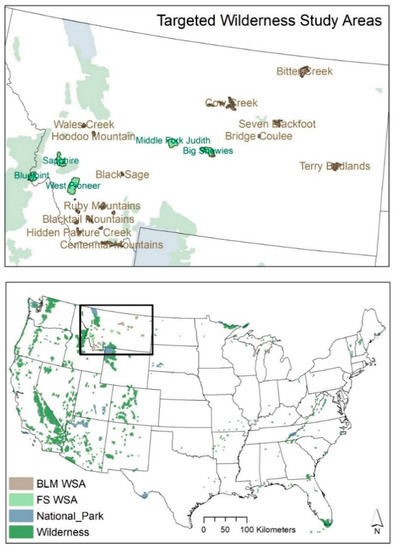
Figure 1.
Map of targeted Wilderness Study Areas (WSAs) in Montana (top) and all national parks and wilderness areas in the lower 48 states used in this analysis (bottom). Not all WSAs are labeled; see Table 2 for full list of WSAs included in proposed legislation aimed at demoting their conservation status.

Table 1.
Gap Analysis Program (GAP) status classification and overview of conservation protection. WSAs set for release in proposed legislation would functionally demote those areas from GAP 2 to GAP 3. BLM: Bureau of Land Management.
Release of WSAs would demote the protected area status from GAP 2 to GAP 3 and represents an example of the impermanence of certain highly protected conservation reserves. Conservation reserves can be designated, but such legal protections can also be removed. In the introduced bills proposing release of the 29 WSAs, Senator Daines and Representative Gianforte argue that these areas are not suitable for permanent protection via legislative wilderness designation, and therefore would be more appropriately managed for motorized recreation use and extractive resource use. It was argued that suitability was assessed using local evaluations that occurred during the 1980s. However, before demoting these or any such areas from their current status as WSAs based solely on local assessments, it may be critical to conduct updated assessments and include analyses that quantify their value at national scales [13,14]. Without such an assessment, the value of areas slated for demotion may not be fully appreciated.
Here, I evaluate the wildland qualities of the WSAs targeted for release and compare them to national parks and designated wilderness areas located in the contiguous United States. National parks and wilderness areas represent highly protected iconic lands in the U.S. that sustain “vignettes of primitive America” and “the biotic associations … maintained” [15]. National parks and wilderness areas also represent core conservation reserves [16], valuable for protecting wildland values and biodiversity. I compared the relative wildland quality of the targeted WSAs to national parks and wilderness areas to assess their value at a national scale.
To assess the value of the targeted WSAs, I used five maps of data representing wildland qualities and wilderness character: (1) wildness as estimated by human modification [17]; (2) intactness of night skies (opposite of light pollution) [18]; (3) quietness of landscapes (opposite of noise pollution) [19]; (4) intactness of mammal assemblage; and (5) intactness of carnivores of conservation concern [20]. These five metrics represent available mapped data that serve as indicators for the qualities of wildlands associated with ecological integrity available at the extent of the contiguous United States. Wildness, night skies, and quietness have previously been used to assess wilderness character [21,22]. Sustaining lands with high degrees of wildness, dark night skies, lack of human-generated noise pollution, and intact mammal and carnivore communities represent important national or international goals in wildland protection [5,6,23].
2. Materials and Methods
Wildness was estimated using the map of human modification (Figure 2 [17]). Human modification data are based on land cover, human population density, roads, and other mapped data on ecological condition [17]. These data are highly correlated with an earlier map depicting wildness [24], and have been used as a surrogate for wildness in other work [11]. Data are scaled from 0 (no measured human modification) to 1 (high degree of human modification), but I reverse ordered these so that higher values represent wilder values.
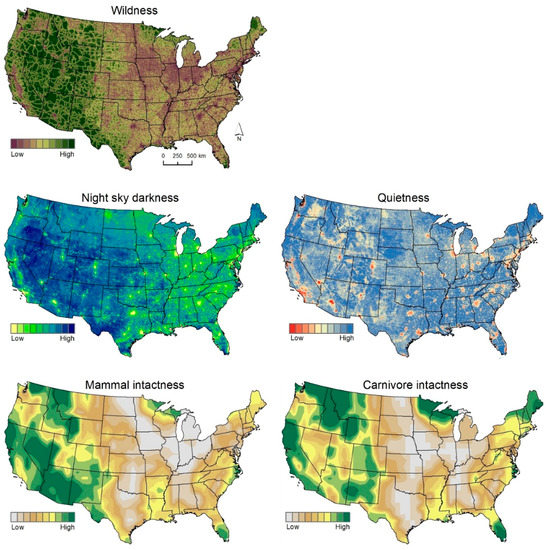
Figure 2.
Map of values used to assess wildland quality of Wilderness Study Areas targeted for release.
Light pollution is measured during the night from the Visible Infrared Imaging Radiometer Suite (VIIRS), a sensor on board the Suomi National Polar-orbiting Partnership satellite (Figure 2, [25]). This mapped dataset serves as a measure of the intactness of the night sky. From the VIIRS light pollution data, higher values represent more intense light pollution and thus lower wildland quality and greater ecological impacts. Therefore, I reverse ordered the data to represent intactness of the night sky. Because the data are highly skewed, I log-transformed the data. For the final metrics, higher values represent darker, more intact night skies. Similarly, mapped data of human-generated noise pollution is based on field observations and a spatial model using landscape features that influence sound propagation [26,27]. Greater intensity of human noises (higher predicted dBA) is associated with reduced wildland quality and greater ecological impacts (Figure 2). Similar to light pollution data, I reverse ordered these data to represent lack of noise pollution or quietness of the landscape in mapped pixels.
Intactness of wildlife community was estimated by overlaying current and historical distributions of species [20]. I used this overlay to calculate the proportion of mammal species currently present from species historically present. Values closer to 1 are associated with high intactness of wildlife community (i.e., a value of 1 represents lands where all species still occur from those that historically occurred). I also calculated this intactness ratio using 10 mammal carnivores of conservation concern including red wolves (Canis rufus), grey wolves (Canis lupus), mountain lions (Puma concolor), lynx (Lynx canadensis), black bear (Ursus americanus), grizzly bear (Ursus arctos), fisher (Pekania pennanti), wolverines (Gulo gulo), black footed ferret (Mustela nigripes), and swift fox (Vulpes velox). These species were chosen based on whether the species or a population of the species was listed as threatened or endangered under the Endangered Species Act, or if the species was listed as sensitive by the U.S. Forest Service. See bottom maps of Figure 2.
After obtaining or calculating these mapped metrics, I overlaid locations of four groups of land management zones: national parks (N = 47), wilderness areas (N = 709), the targeted WSAs keeping the forest service (N = 5), and BLM units (N = 24) separated (Figure 1). In cases where wilderness areas and national parks overlapped, wilderness areas took priority. I then calculated the average value of each of the five metrics of wildland quality for all management units using the raster package of R. I calculated summary statistics for each group (i.e., national park, wilderness area, BLM WSA, and U.S. Forest Service (FS) WSA) and plotted the distribution of data using boxplots. This allowed me to compare the median, means, and distribution of each of the five mapped metrics among the four groups of land management zones to evaluate how the targeted WSAs compared to existing highly protected and valuable conservation areas. Finally, I created dot charts of ranks of the targeted WSAs for each of the five metrics and added plots of the median values among national parks and wilderness areas. This simple plotting technique allowed me to easily assess the value of individual targeted WSAs and compare the WSA units to the central tendency of wildland values among national parks and wilderness areas combined.
3. Results
Average and median wildness tended to be higher in the targeted FS and BLM WSAs than in either national parks or wilderness areas (Figure 3). All five FS WSAs and 18 of 24 of the BLM WSAs were wilder than half of national parks and wilderness areas combined (Figure S1). In fact, one FS WSA (Big Snowies) and four BLM WSAs (East Fork Blacktail Deer Creek, Twin Coulee, Centennial Mountains, and Blacktail Mountains) were wilder than 90% of all national parks and wilderness areas combined (Figure S1).
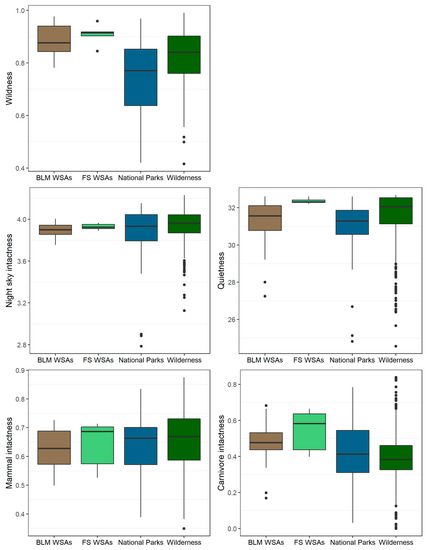
Figure 3.
Boxplots of values used to assess wildland quality of Wilderness Study Areas targeted for release administered by the Bureau of Land Management (BLM) and U.S. Forest Service (FS) compared to the national parks and wilderness areas. Upper and lower bounds of boxplots represent the 75th and 25th percentiles, the dark lines in the box are the median values, and ‘whiskers’ are the 95th and 5th percentiles. Filled circles beyond the whiskers are values from units outside the 95th and 5th percentiles.
Night sky intactness estimates of targeted FS and BLM WSAs were similar to levels in national parks and wilderness areas (Figure 3). One of the targeted FS WSAs (Big Snowies) and six of the BLM WSAs (Twin Coulee, Bridge Coulee, Wales Creek, Dog Creek South, Stafford, and Axolotl Lakes) where characterized by darker night skies than half of all national parks and wilderness areas combined (Figure S2). Landscape quietness estimates in the targeted FS WSAs were higher compared to national parks and wilderness areas, while quietness in targeted BLM WSAs were similar to parks and wilderness areas (Figure 3). All five targeted FS WSAs and seven targeted BLM WSAs (East Fork Blacktail Deer Creek, Twin Coulee, Axolotl Lakes, Wales Creek, Hoodoo Mountain, Blacktail Mountains, and Seven Blackfoot) experienced quieter conditions than half of all national parks and wilderness areas combined (Figure S3).
Mammal intactness was similar among targeted WSAs and national parks and wilderness areas (Figure 3). Three of the five targeted FS WSAs (Blue Joint, Sapphire, and West Pioneer) and 11 BLM WSAs had higher mammal intactness values than half of national parks and wilderness areas combined (Figure S4). On average, carnivore intactness tended to be higher in targeted WSAs than national parks and wilderness areas (Figure 3). Estimates of carnivore intactness in all targeted FS WSAs and 20 BLM WSAs were greater than half of all national parks and wilderness areas. In fact, three targeted FS WSAs and two BLM WSAs had carnivore estimates greater than 90% of all national parks and wilderness areas (Figure S5).
4. Discussion
The Wilderness Study Areas targeted for demotion in recently introduced legislation to the U.S. Congress are comparable to nationally-significant protected areas with respect to their wildland quality. In some cases, individual units targeted for release represent some of the most valuable areas with respect to the wildland qualities compared to nationally-celebrated parks and wilderness areas. While legislation proposing demotion of the conservation status (i.e., “release”) of these WSAs argues that these 29 units are unsuitable for wilderness-level protection, this national comparison suggests otherwise. These 29 areas may be just as valuable—and in some cases, based on some metrics, more valuable—than existing national parks and wilderness areas.
My assessment of “wildness” using Theobald’s map of human modification shows the 29 areas to be comparable to the wildest national parks and wilderness areas in the country. As wildlands continue to be developed globally and nationally [2,5], it is critical that we include assessments of wildness in conservation prioritization [11]. Wildness and a low degree of human modification are also associated with high degree of permeability for moving organisms and processes [16,28,29]. Protecting lands that maintain a high degree of wildness should inform future conservation globally [6] and nationally [11], and may provide benefits to species under climate change [30].
Dark skies and quiet landscapes may be considered components of wildness, but here I evaluate them as separate qualities for the comparison between targeted WSAs and existing national parks and wilderness areas. Dark night skies and relatively quiet conditions indicate that these lands are important areas to maintain these qualities both for their ecological [18,19] and recreational value. As with wildness, the targeted WSAs are comparable to national parks and wilderness areas and, in some cases, maintain darker night skies and quieter conditions than national parks and wilderness areas combined. Protecting the remaining lands that maintain darks skies and quiet landscapes may offer benefits to species sensitive to these impacts, while also maintaining high quality lands for wildland recreation.
Finally, intactness of assemblages of species has only recently been quantified and mapped at large spatial extents [20,23,31,32]. Here, I focused on mapping the proportion of mammals and mammal carnivores that still occur of that which occurred before pre-European local extinctions [20]. Lands that maintain a high degree of “historical fidelity” in their species composition are considered more biologically intact [33]. Few places in the contiguous United States still maintain the full complement of species that existed before extinctions following Euro-American colonization. The targeted WSAs in Montana are comparable to existing national parks and wilderness areas with respect to the intactness of mammal species. However, the targeted WSAs tended to be more highly intact with respect to the carnivores of conservation concern included here. Three of the five Forest Service WSAs were more intact than 90% of all national parks and wilderness areas combined. These areas still maintain grizzly bear habitat and at least occasional occupancy and are home to other mammal carnivores such as wolverines, grey wolves, mountain lions, and lynx. Few other areas host such an intact assemblage of carnivores.
The value of these WSAs in sustaining wildlands, dark skies, quiet landscapes, and relatively intact mammal assemblages should be considered when evaluating the suitability of these lands for elevated levels of protection. Indeed, before demoting these lands and opening them for commercial timber extraction, energy development, and intensified motorized recreation, a national perspective on their value, such as the one I present here, is needed. Local assessment will always be an important step in conservation planning, but increasingly we have datasets and tools available to place lands into a more national perspective to assess their value at that scale. Federal lands should be managed with such a perspective. Assessments such as the one I present here will not be the deciding factor in the future of these 29 WSAs, but such an assessment should provide important perspective on their value.
5. Conclusions
Federal legislation has been introduced to demote the conservation status of 29 Wilderness Study Areas (WSAs) in Montana. Three decades ago, these WSAs were deemed unsuitable for conservation status promotion by the Forest Service and BLM. However, the proposed legislation would actually demote their conservation status and the protections afforded by their existing designations. This demotion could result in increased commercial development in these areas, including timber harvesting, energy exploration and development, road-building, and motorized recreation. I have shown that these areas maintain a high degree of wildland quality when compared with existing national parks and wilderness areas in the contiguous United States. A similar analysis that places local evaluations into a national perspective should be conducted when similar policies or bills are proposed that would demote the conservation status of lands.
Supplementary Materials
The following are available online at http://www.mdpi.com/2073-445X/7/2/69/s1.
Funding
This research received no external funding.
Acknowledgments
Thanks to Connor Bailey for compiling and sharing data on Wilderness Study Areas. Barb Cestero and Scott Brennan provided comments and reviews that improved the paper.
Conflicts of Interest
The author declares no conflict of interest.
References
- Venter, O.; Sanderson, E.W.; Magrach, A.; Allan, J.R.; Beher, J.; Jones, K.R.; Possingham, H.P.; Laurance, W.F.; Wood, P.; Fekete, B.M.; et al. Sixteen years of change in the global terrestrial human footprint and implications for biodiversity conservation. Nat. Commun. 2016, 7, 1–11. [Google Scholar] [CrossRef] [PubMed]
- Theobald, D.M.; Zachmann, L.J.; Dickson, B.G.; Gray, M.E.; Albano, C.M.; Landau, V.; Harrison-Atlas, D. The Disappearing West: Description of the Approach, Data, and Analytical Methods Used to Estimate Natural Land Loss in the Western U.S.; Conservation Science Partners: Truckee, CA, USA, 2016. [Google Scholar]
- Aplet, G.H. On the nature of wildness: Exploring what wilderness really protects. Denver Law Rev. 1999, 76, 347–367. [Google Scholar]
- Martin, J.-L.; Maris, V.; Simberloff, D.S. The need to respect nature and its limits challenges society and conservation science. Proc. Natl. Acad. Sci. USA 2016, 113, 6105–6112. [Google Scholar] [CrossRef] [PubMed]
- Watson, J.E.M.; Shanahan, D.F.; Marco, M.; Di Allan, J.; Laurance, W.F.; Sanderson, E.W.; Mackey, B.; Venter, O. Catastrophic declines in wilderness areas undermine global environment targets. Curr. Biol. 2016, 26, 1–6. [Google Scholar] [CrossRef] [PubMed]
- Kormos, C.F.; Badman, T.; Jaeger, T.; Bertzky, B.; Merm, R.; Van Osipova, E.; Shi, Y.; Larsen, P.B. World Heritage, Wilderness, and Large Landscapes and Seascapes; International Union for Conservation of Nature: Gland, Switzerland, 2017. [Google Scholar]
- Allan, J.R.; Venter, O.; Watson, J.E.M. Temporally inter-comparable maps of terrestrial wilderness and the Last of the Wild. Sci. Data 2017, 4, 1–8. [Google Scholar] [CrossRef] [PubMed]
- Cantú-Salazar, L.; Gaston, K.J. Very Large Protected Areas and Their Contribution to Terrestrial Biological Conservation. BioScience 2010, 60, 808–818. [Google Scholar] [CrossRef]
- Gaston, K.J.; Jackson, S.F.; Cantú-Salazar, L.; Cruz-Piñón, G. The ecological performance of protected areas. Annu. Rev. Ecol. Evolut. Syst. 2008, 39, 93–113. [Google Scholar] [CrossRef]
- Aycrigg, J.L.; Groves, C.; Hilty, J.A.; Scott, J.M.; Beier, P.; Boyce, D.A.; Figg, D.; Hamilton, H.; Machlis, G.; Muller, K.; et al. Completing the system: Opportunities and challenges for a national habitat conservation system. BioScience 2016, 66, 774–784. [Google Scholar] [CrossRef]
- Belote, R.T.; Dietz, M.S.; Jenkins, C.N.; McKinley, P.S.; Irwin, G.H.; Fullman, T.J.; Leppi, J.C.; Aplet, G.H. Wild, connected, and diverse: Building a more resilient system of protected areas. Ecol. Appl. 2017, 27, 1050–1056. [Google Scholar] [CrossRef] [PubMed]
- U.S. Department of the Interior. The Federal Land Policy and Management Act, as Amended; Bureau of Land Management and Office of the Solicitor, Ed.; U.S. Department of the Interior: Washington, DC, USA, 2001.
- Belote, R.T.; Irwin, G.H. Quantifying the National Significance of Local Areas for Regional Conservation Planning: North Carolina’s Mountain Treasures. Land 2017, 6, 35. [Google Scholar] [CrossRef]
- Noss, R.F.; Platt, W.J.; Sorrie, B.A.; Weakley, A.S.; Means, D.B.; Costanza, J.; Peet, R.K. How global biodiversity hotspots may go unrecognized: Lessons from the North American Coastal Plain. Divers. Distrib. 2015, 21, 236–244. [Google Scholar] [CrossRef]
- USA National Park Service. Compilation of the Administrative Policies for the National Parks and National Monuments of Scientific Significance (Natural Area Category); U.S. Government Publishing Office: Washington, DC, USA, 1970; 147p.
- Belote, R.T.; Dietz, M.S.; McRae, B.H.; Theobald, D.M.; McClure, M.L.; Irwin, G.H.; McKinley, P.S.; Gage, J.A.; Aplet, G.H. Identifying corridors among large protected areas in the United States. PLoS ONE 2016, 11, e0154223. [Google Scholar] [CrossRef] [PubMed]
- Theobald, D.M. A general model to quantify ecological integrity for landscape assessments and US application. Landsc. Ecol. 2013, 28, 1859–1874. [Google Scholar] [CrossRef]
- Longcore, T.; Rich, C. Ecological light pollution. Front. Ecol. Environ. 2004, 2, 191–198. [Google Scholar] [CrossRef]
- Shannon, G.; McKenna, M.F.; Angeloni, L.M.; Crooks, K.R.; Fristrup, K.M.; Brown, E.; Warner, K.A.; Nelson, M.D.; White, C.; Briggs, J.; et al. A synthesis of two decades of research documenting the effects of noise on wildlife. Biol. Rev. 2016, 91, 982–1005. [Google Scholar] [CrossRef] [PubMed]
- Faurby, S.; Svenning, J.C. Historic and prehistoric human-driven extinctions have reshaped global mammal diversity patterns. Divers. Distrib. 2015, 21, 1155–1166. [Google Scholar] [CrossRef]
- Tricker, J.; Landres, P.; Dingman, S.; Callagan, C.; Stark, J.; Bonstead, L.; Fuhrmann, K.; Carver, S. Mapping Wilderness Character in Death Valley National Park; Natural Resource Report NPS/DEVA/NRR—2012/503; National Park Service, U.S. Department of the Interior: Fort Collins, CO, USA, 2012.
- Tricker, J.; Landres, P.; Chenoweth, J.; Hoffman, R.; Scott, R. Mapping Wilderness Character in Olympic National Park Final Report; U.S. Department of Agriculture, Forest Service, Rocky Mountain Research Station, Aldo Leopold Wilderness Research Institute: Missuola, MT, USA, 2013.
- Newbold, T.; Hudson, L.N.; Hill, S.L.L.; Contu, S.; Gray, C.L.; Scharlemann, J.P.W.; Börger, L.; Phillips, H.R.P.; Sheil, D.; Lysenko, I.; et al. Global patterns of terrestrial assemblage turnover within and among land uses. Ecography 2016, 39, 1151–1163. [Google Scholar] [CrossRef]
- Aplet, G.; Thomson, J.; Wilbert, M. Indicators of wildness: Using attributes of the land to assess the context of wilderness. In Proceedings of the Wilderness Science in a Time of Change, Missoula, MT, USA, 23–27 May 1999; McCool, S.F., Cole, D.N., Borrie, W.T., O’Laughlin, J., Eds.; Rocky Mountain Research Station: Fort Collins, CO, USA, 2000; pp. 89–98. [Google Scholar]
- Monahan, W.B.; Gross, J.E.; Svancara, L.K.; Philippi, T. A Guide to Interpreting NPScape Data and Analyses; Natural Resource Technical Report NPS/NRSS/NRTR—2012/578; National Park Service, U.S. Department of the Interior: Fort Collins, CO, USA, 2012.
- Mennitt, D.; Sherrill, K.; Fristrup, K. A geospatial model of ambient sound pressure levels in the contiguous United States. J. Acoust. Soc. Am. 2014, 135, 2746–2764. [Google Scholar] [CrossRef] [PubMed]
- Nelson, L.; Kinseth, M.; Flowe, T. Explanatory Variable Generation for Geospatial Sound Modeling Standard Operating Procedure; Natural Resource Report NPS/NRSS/NRR—2015/936; National Park Service, U.S. Department of the Interior: Fort Collins, CO, USA, 2015.
- Theobald, D.M.; Reed, S.E.; Fields, K.; Soulé, M. Connecting natural landscapes using a landscape permeability model to prioritize conservation activities in the United States. Conserv. Lett. 2012, 5, 123–133. [Google Scholar] [CrossRef]
- Anderson, M.G.; Clark, M.; Sheldon, A.O. Estimating climate resilience for conservation across geophysical settings. Conserv. Biol. 2014, 28, 959–970. [Google Scholar] [CrossRef] [PubMed]
- Martin, T.G.; Watson, J.E.M. Intact ecosystems provide best defence against climate change. Nat. Clim. Chang. 2016, 6, 122–124. [Google Scholar] [CrossRef]
- Newbold, T.; Hudson, L.N.; Arnell, A.P.; Contu, S.; Palma, A.; De Ferrier, S.; Hill, S.L.L.; Hoskins, A.J.; Lysenko, I.; Phillips, H.R.P.; et al. Has land use pushed terrestrial biodiversity beyond the planetary boundary? A global assessment. Science 2016, 353, 288–291. [Google Scholar] [CrossRef] [PubMed]
- Newbold, T.; Hudson, L.N.; Hill, S.L.L.; Contu, S.; Lysenko, I.; Senior, R.A.; Börger, L.; Bennett, D.J.; Choimes, A.; Collen, B.; et al. Global effects of land use on local terrestrial biodiversity. Nature 2015, 520, 45–50. [Google Scholar] [PubMed]
- Scholes, R.J.; Biggs, R. A biodiversity intactness index. Nature 2005, 434, 45–49. [Google Scholar] [CrossRef] [PubMed]


© 2018 by the author. Licensee MDPI, Basel, Switzerland. This article is an open access article distributed under the terms and conditions of the Creative Commons Attribution (CC BY) license (http://creativecommons.org/licenses/by/4.0/).