Towards a Simpler Characterization of Urban Sprawl across Urban Areas in Europe

Abstract
:1. Introduction
2. Materials and Methods
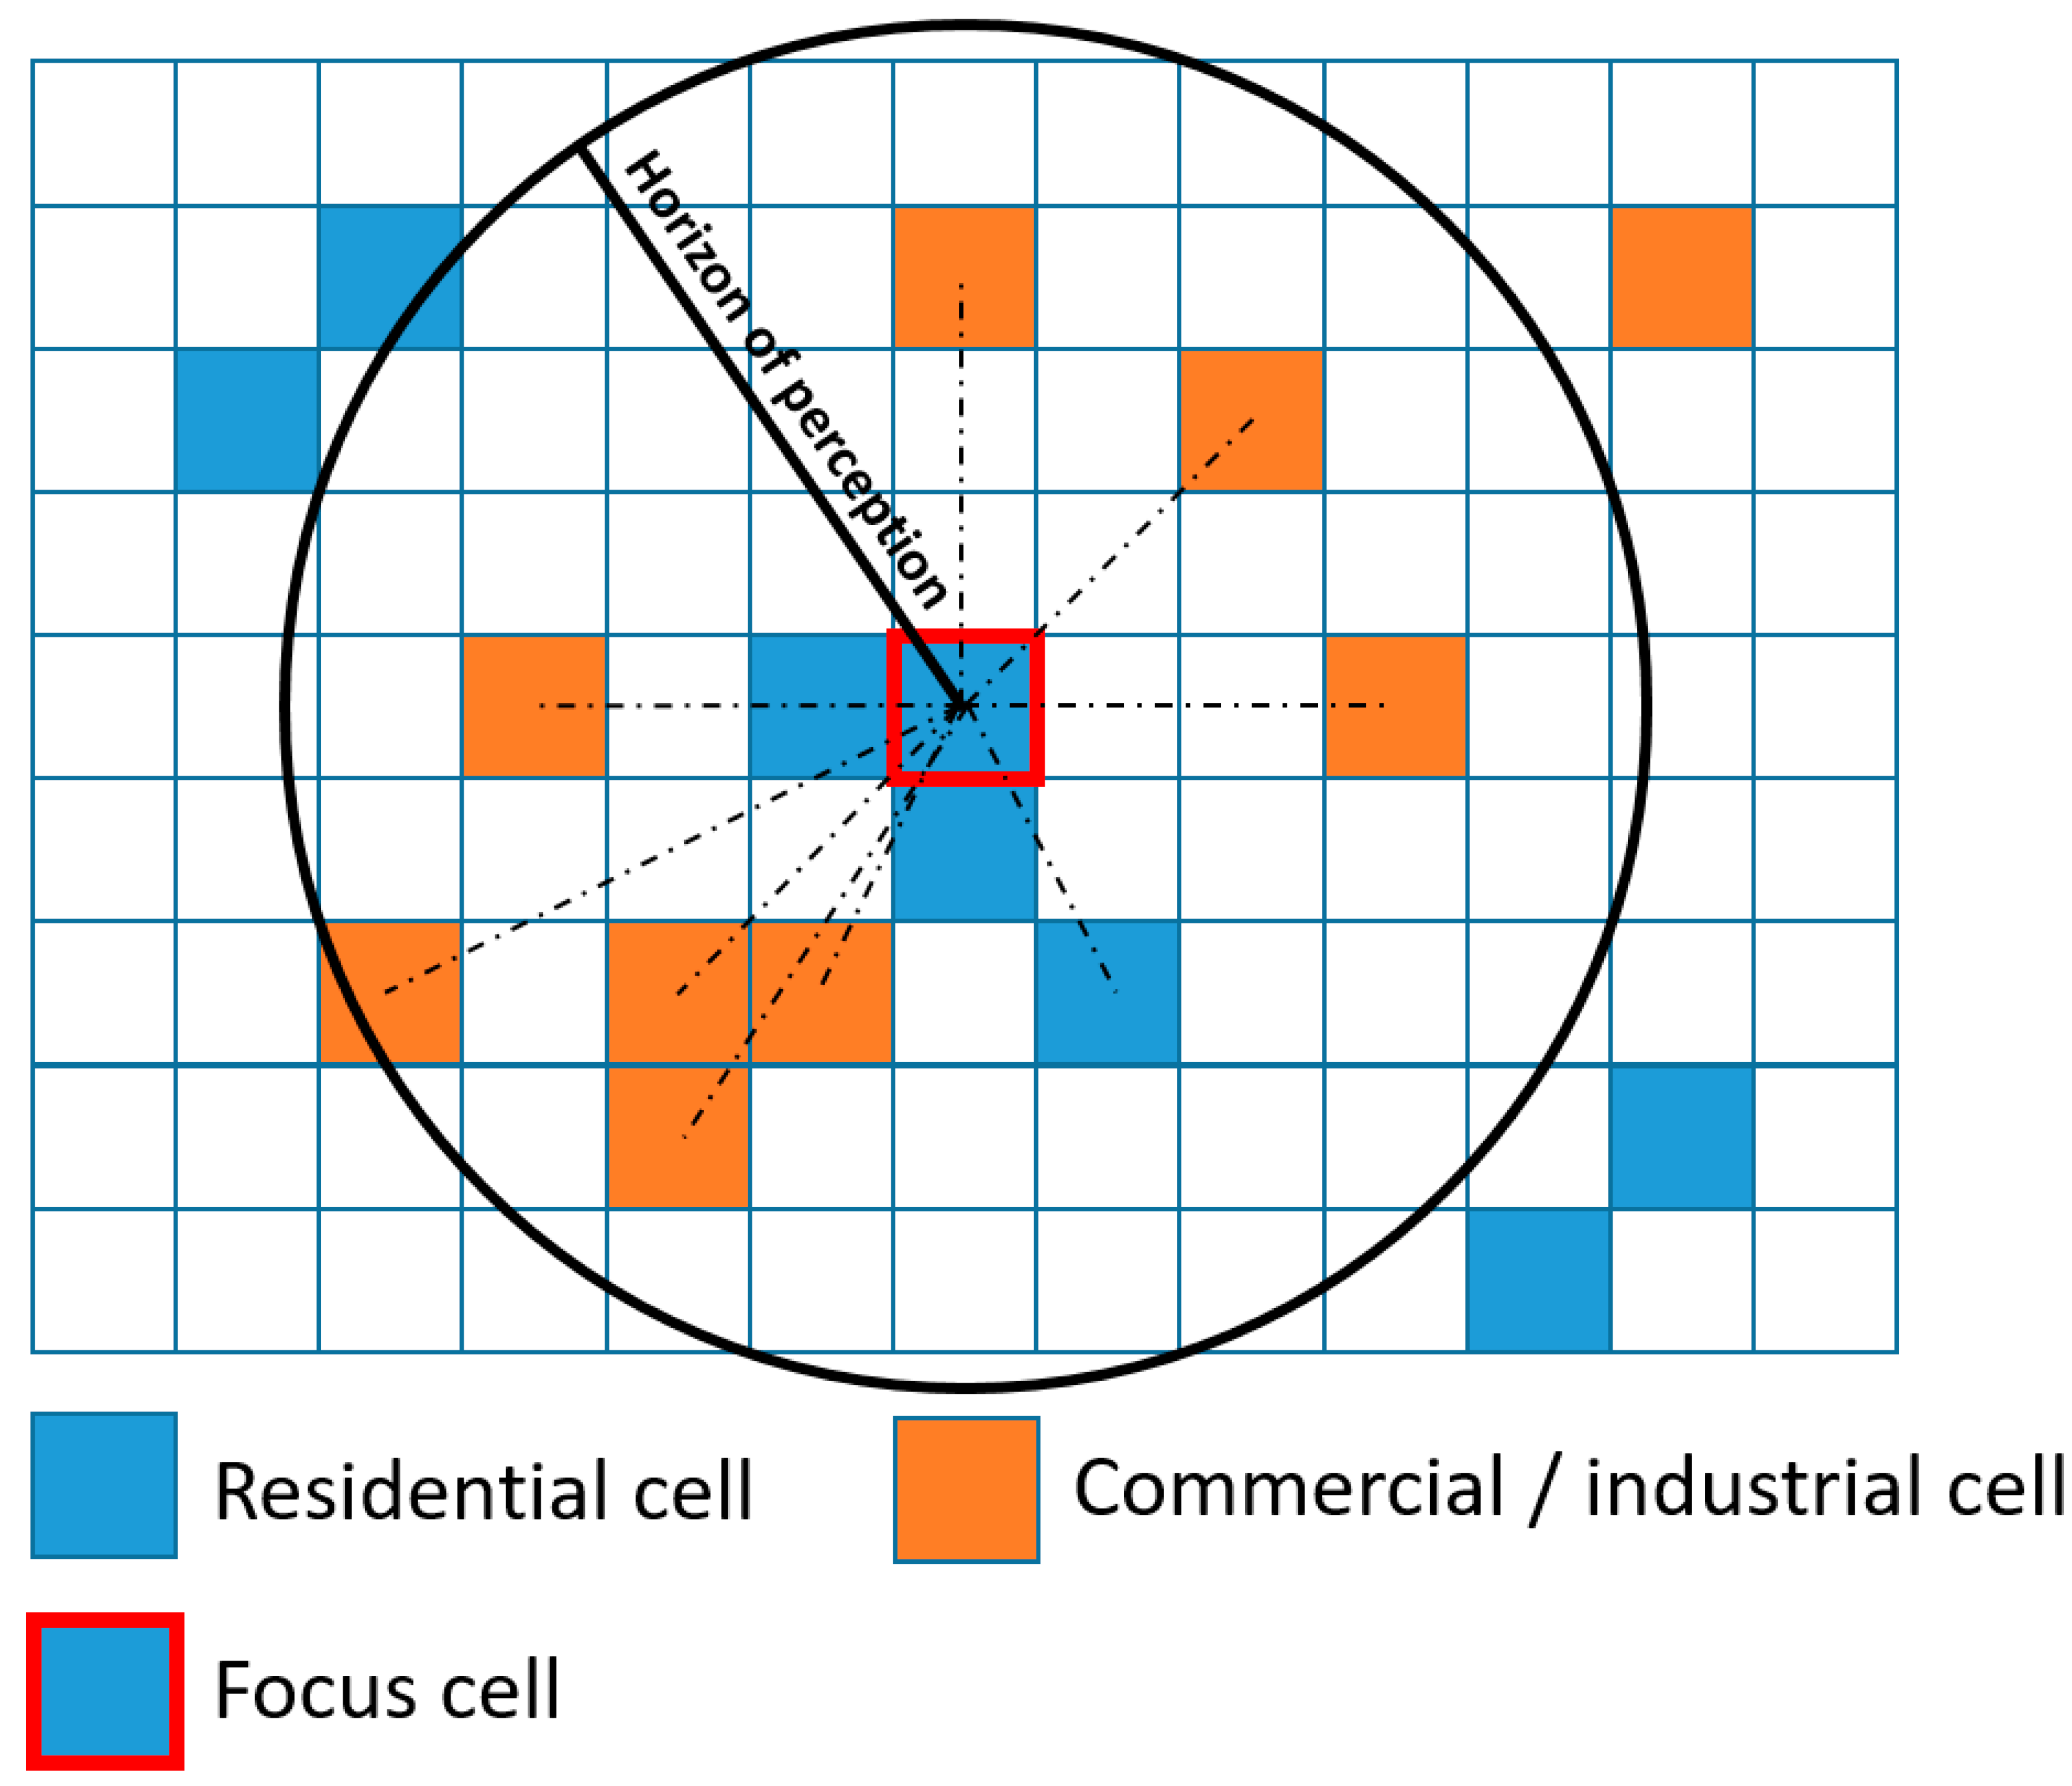
2.1. Adaptation of the Weighted Urban Proliferation Index
- -
- Raster cells classified as residential land-use were attributed a PBA value of 100.
- -
- For raster cell hosting populations not classified as residential land-use by LUISA, PBA was approximated using a population dependent step function assuming 200 m2 of built-up area per group of 1–4 people and reaching a maximum of 100% of the cell.
2.2. Input Data
2.3. Computations of the WUP
3. Results
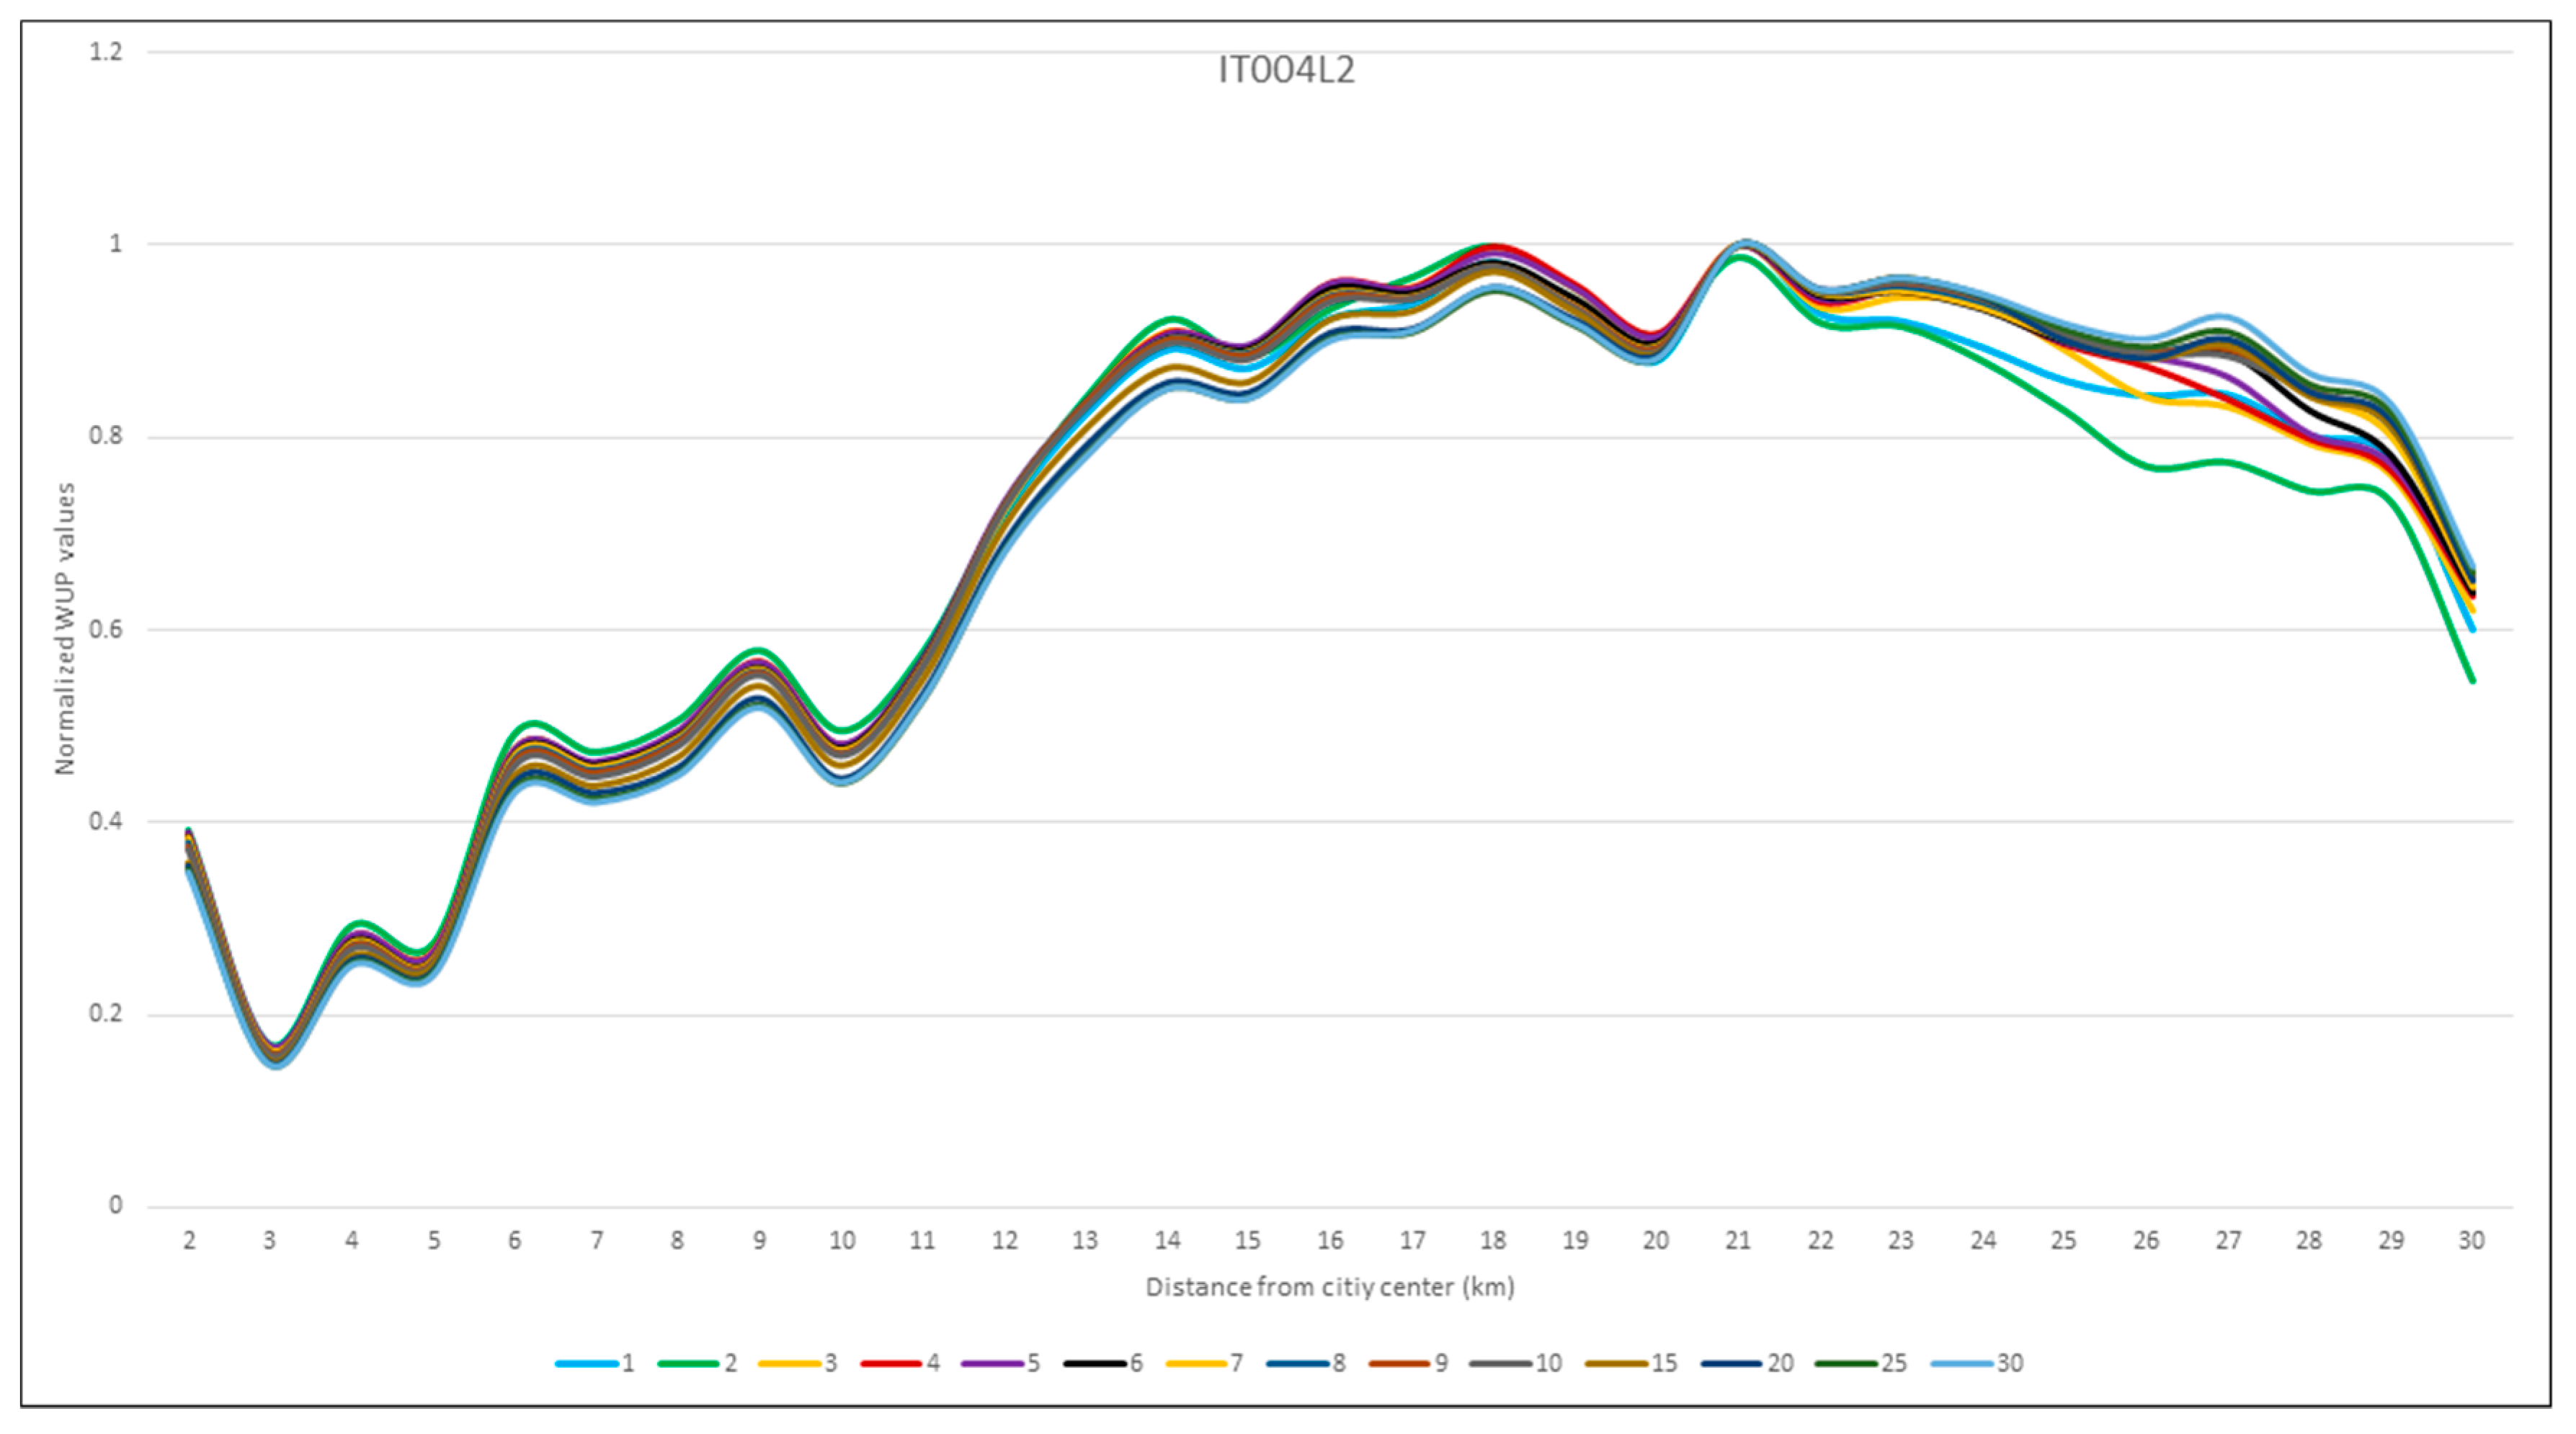
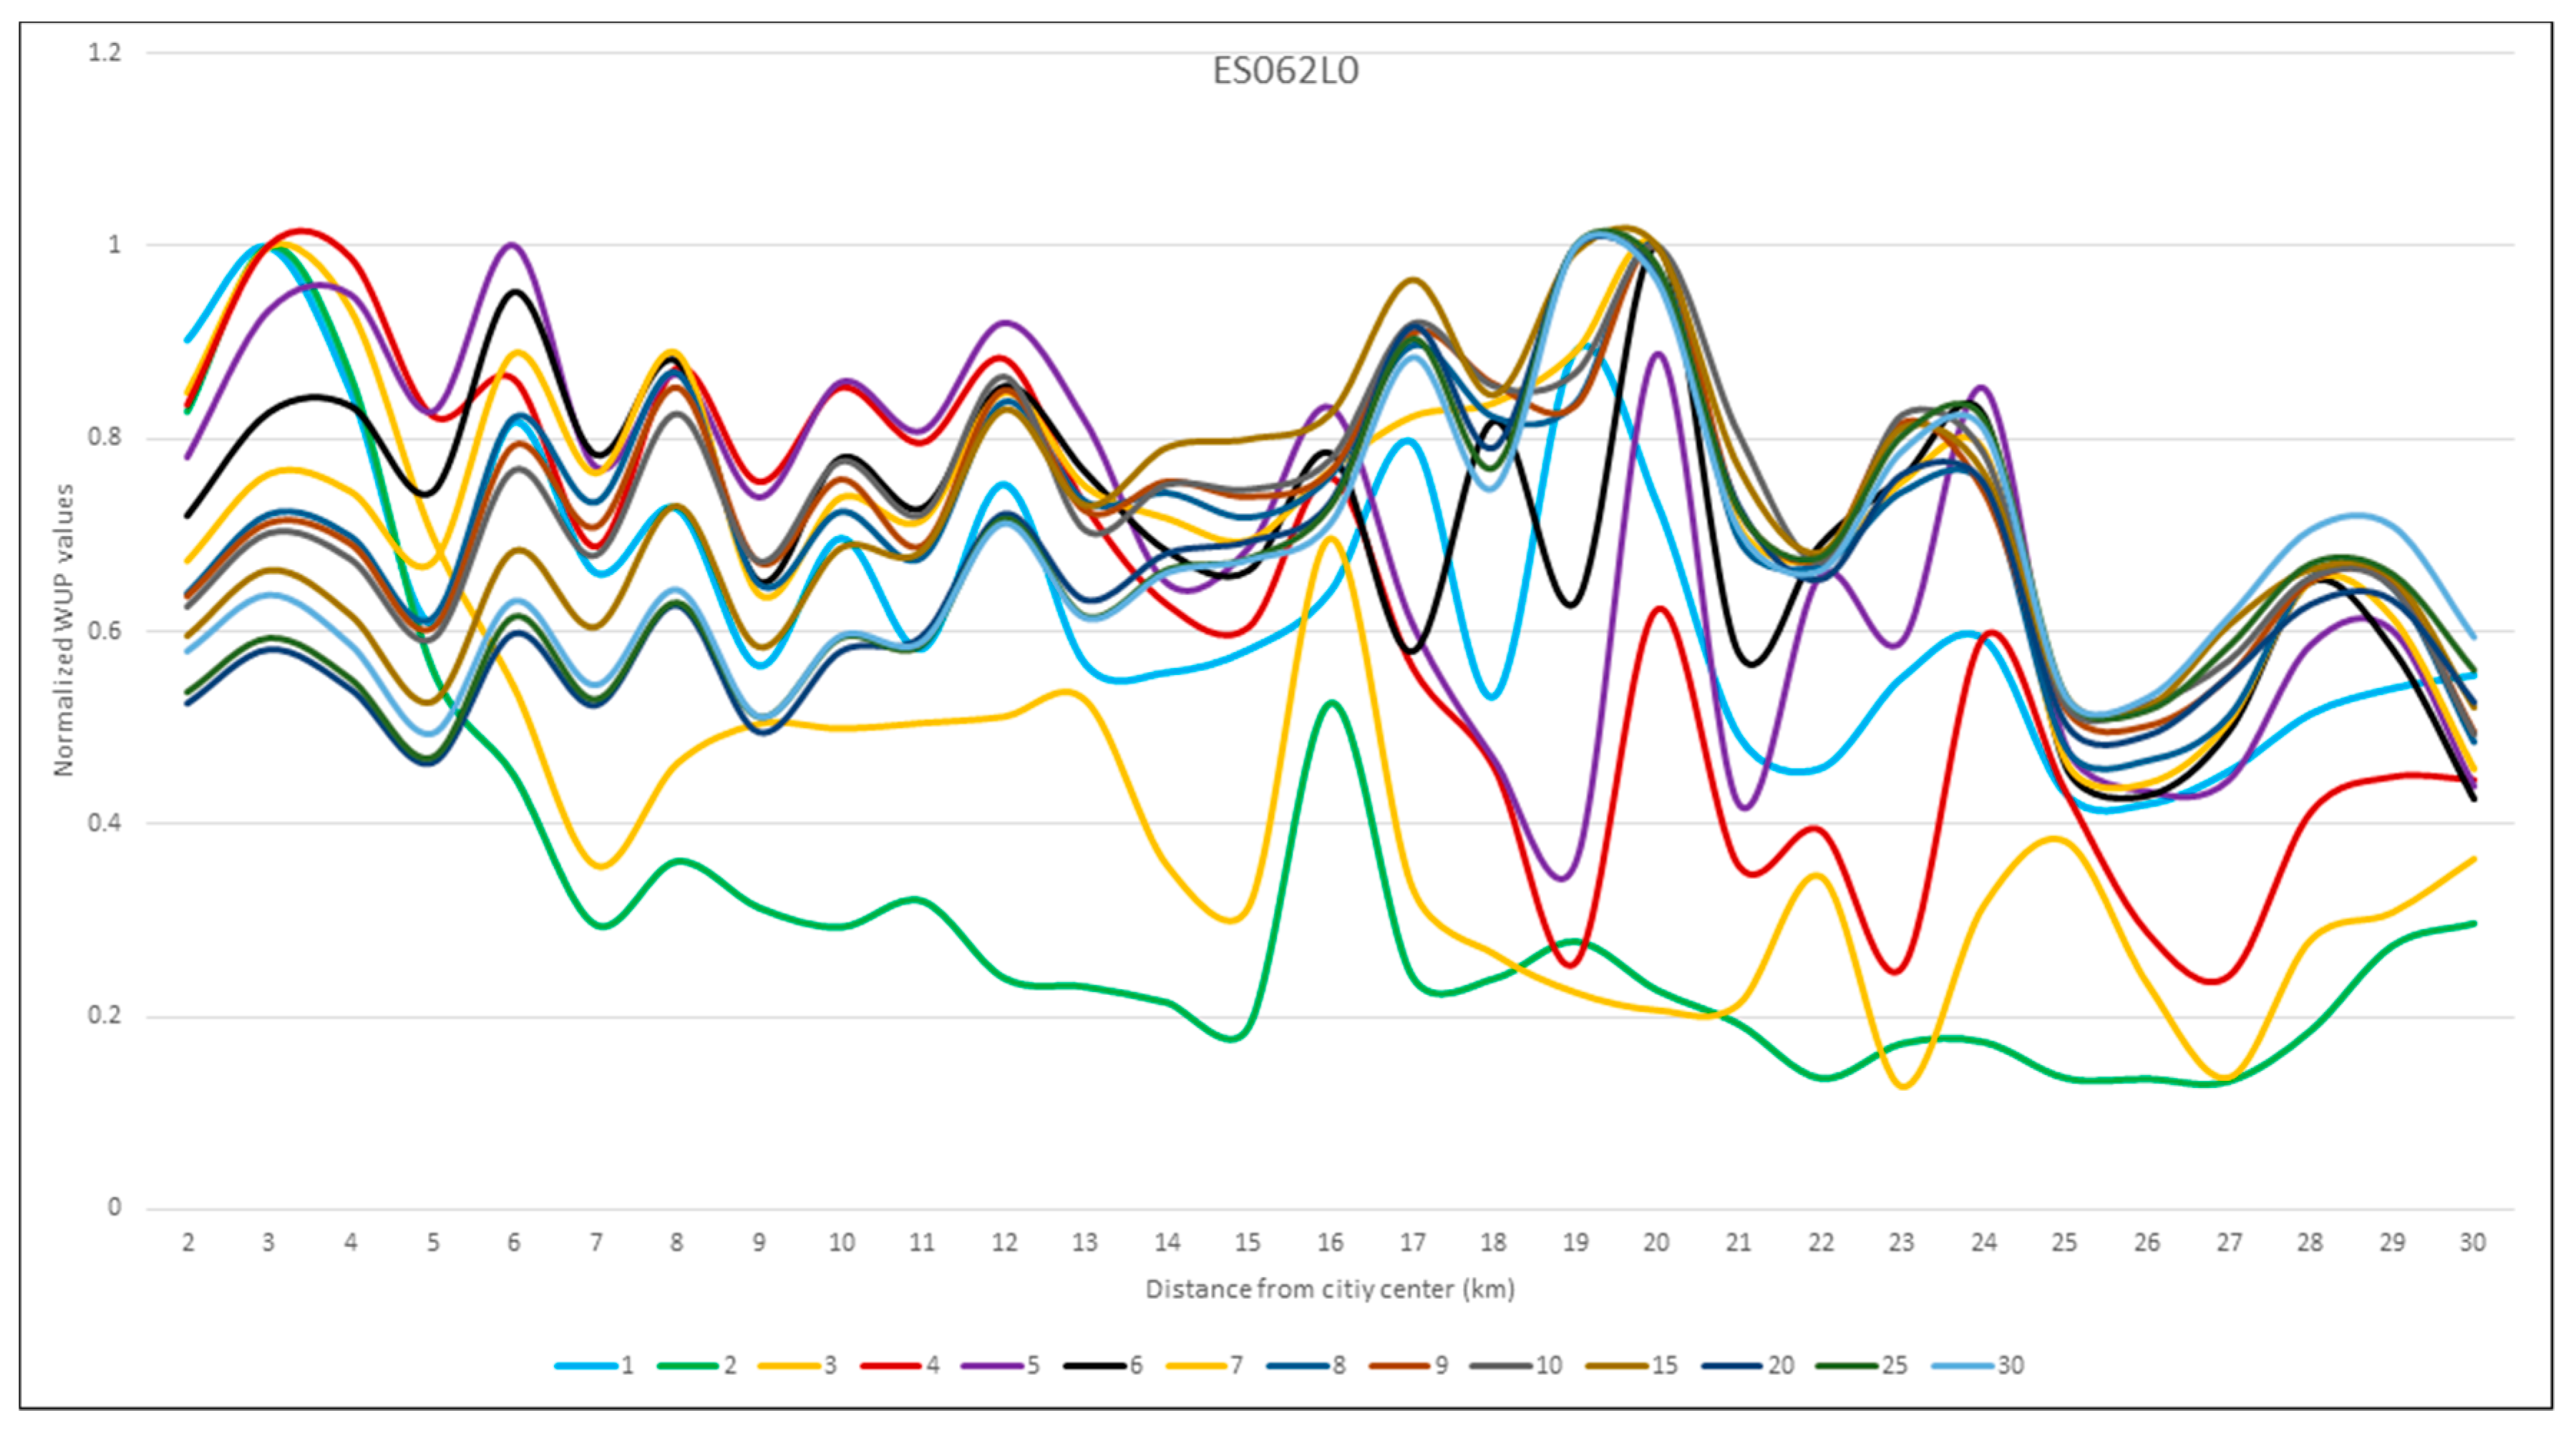
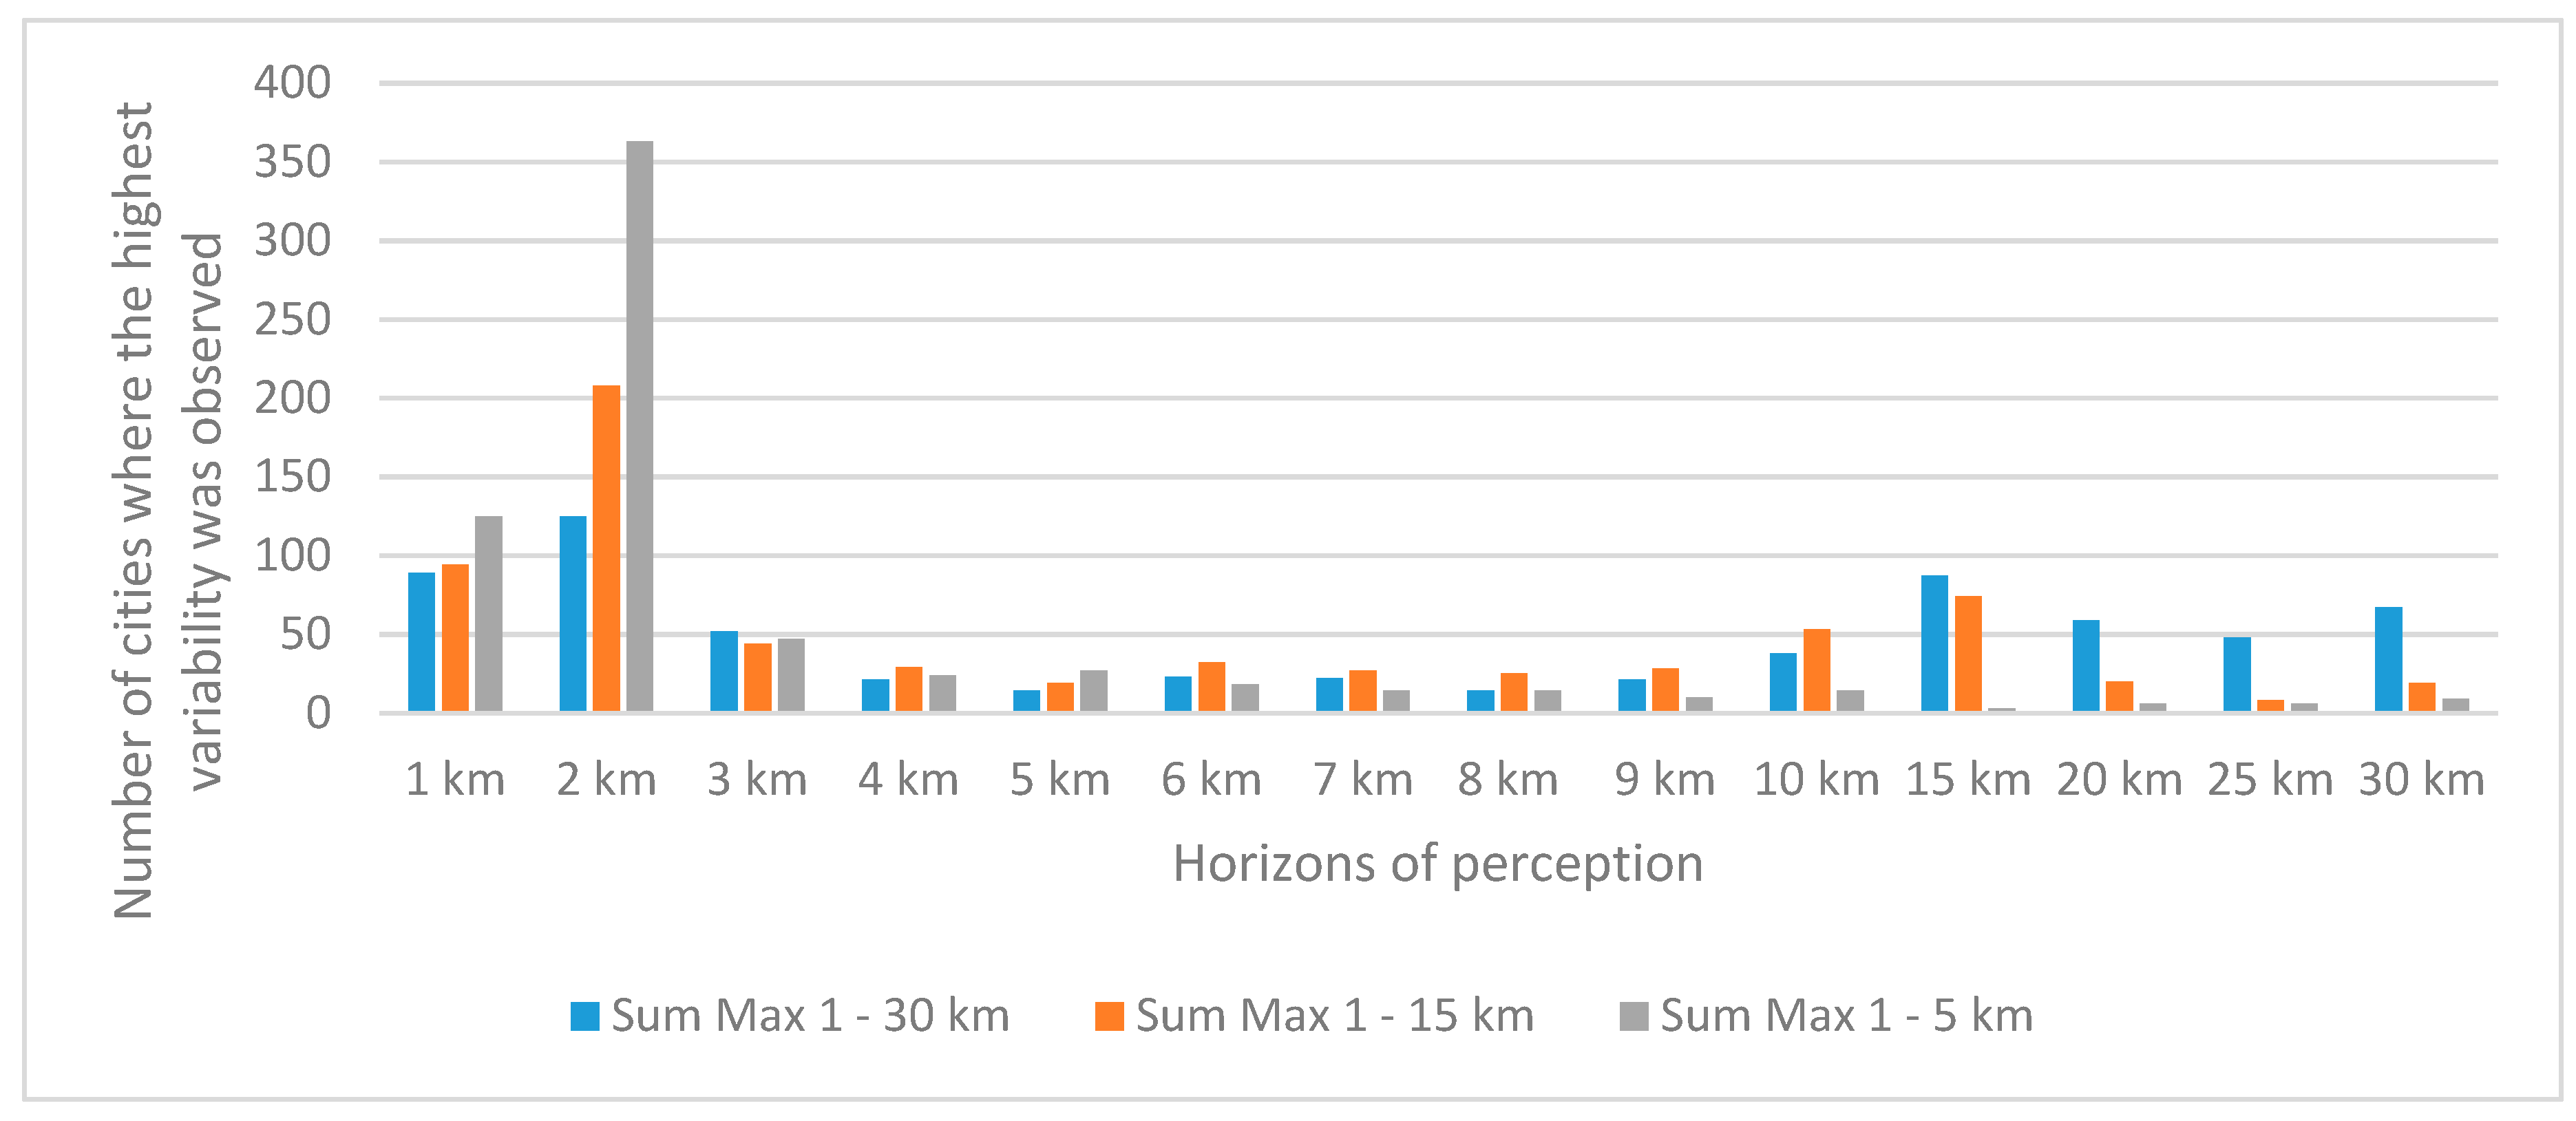
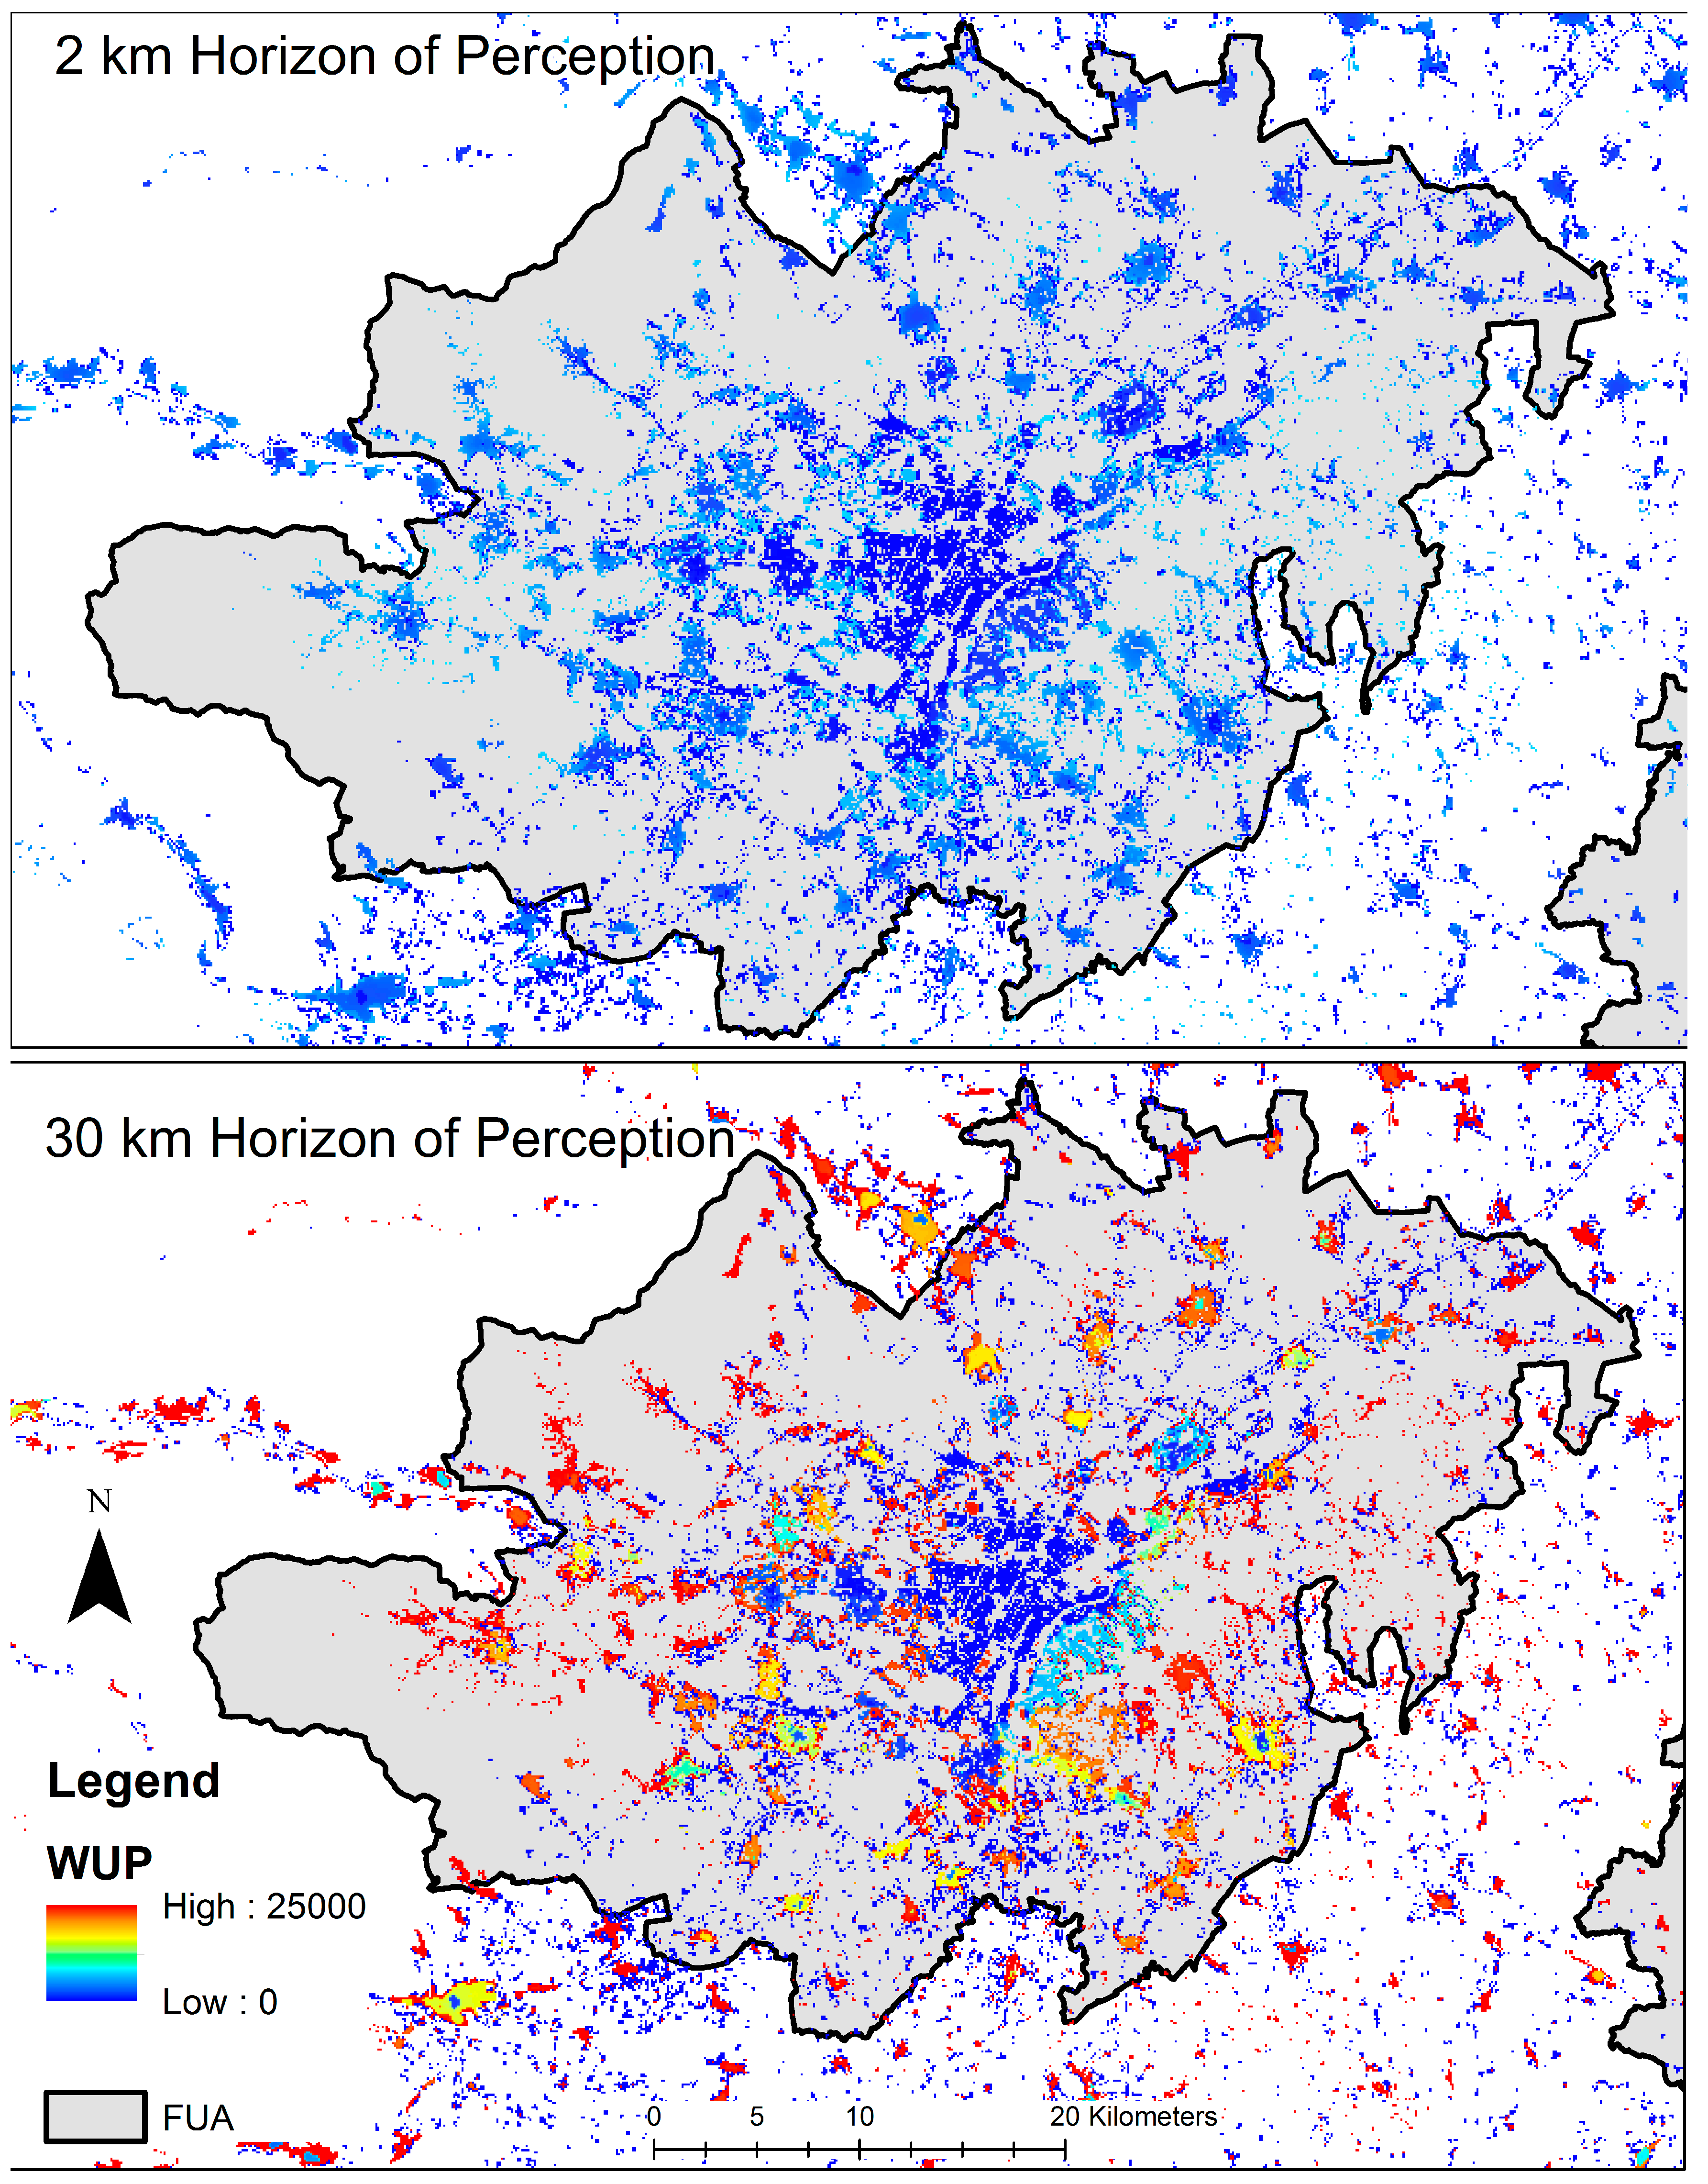
3.1. Identification of the Optimal Horizon of Perception
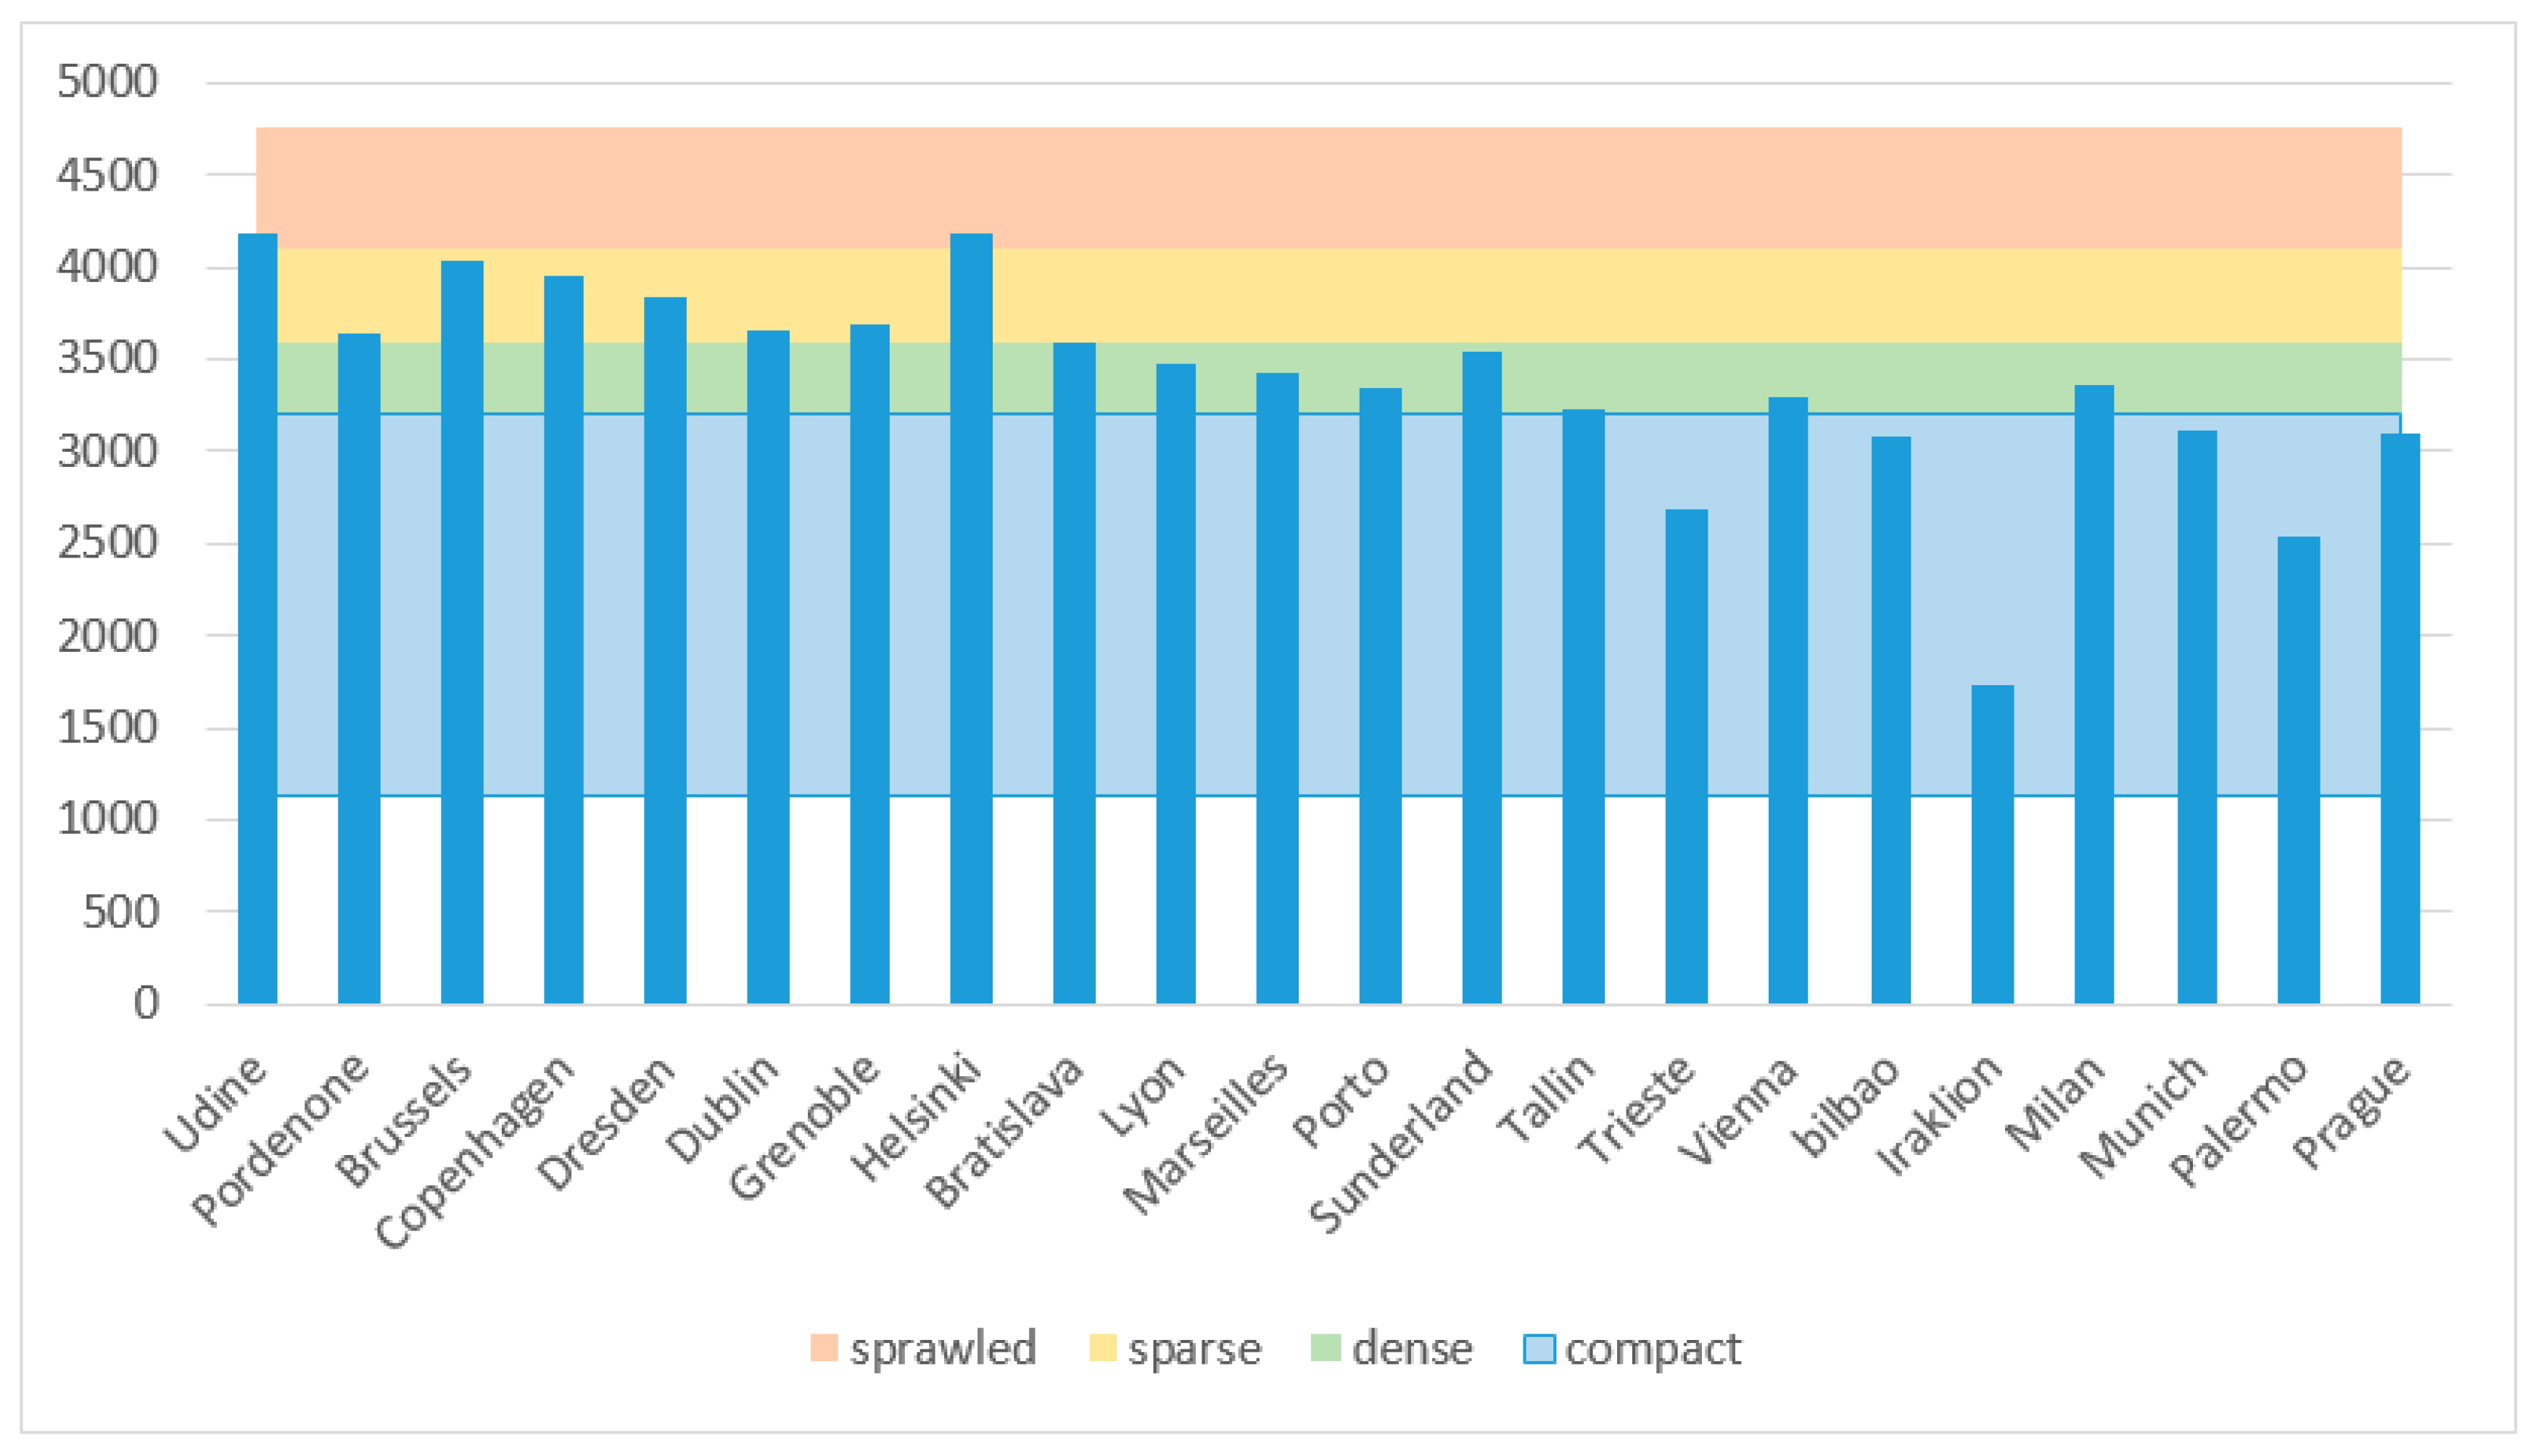
3.2. Towards a New Indicator of Sprawl
4. Discussion and Conclusions
Author Contributions
Conflicts of Interest
References
- Brueckner, J.K. Urban sprawl: Diagnosis and remedies. Int. Reg. Sci. Rev. 2000, 23, 160–171. [Google Scholar] [CrossRef]
- Burchell, R.W.; Shad, N.A.; Listokin, D.; Phillips, H.; Downs, A.; Seskin, S.; Davis, J.S.; Moore, T.; Helton, D.; Gall, M. The Costs of Sprawl—Revisited; Transportation Research Board: Washington, DC, USA, 1998; ISBN 030906306Xn1073-4872. [Google Scholar]
- Downs, A. How America’s cities are growing: The big picture. Brook. Rev. 1998, 16, 8–12. [Google Scholar] [CrossRef]
- Ewing, R. Is Los Angeles-Style Sprawl Desirable? J. Am. Plan. Assoc. 1997, 63, 107–126. [Google Scholar] [CrossRef]
- Johnson, M.P. Environmental impacts of urban sprawl: A survey of the literature and proposed research agenda. Environ. Plan. A 2001, 33, 717–735. [Google Scholar] [CrossRef]
- Glaeser, E.L.; Kahn, M.E. Sprawl and Urban Growth. Handb. Reg. Urban Econ. 2004, 4, 2481–2527. [Google Scholar] [CrossRef]
- European Environment Agency. Urban Sprawl in Europe—Joint EEA-FOEN Report; European Environment Agency: Luxembourg, 2016. [Google Scholar]
- European Environment Agency; European Commission JRC. Urban Sprawl in Europe—The Ignored Challenge; European Environment Agency: Luxembourg, 2006; Volome 10, ISBN 9781405139175 (pbk. alk. paper) 140513917X (pbk. alk. paper). [Google Scholar]
- Feng, L.; Li, H. Spatial Pattern Analysis of Urban Sprawl: Case Study of Jiangning, Nanjing, China. J. Urban Plan. Dev. 2012, 138, 263–269. [Google Scholar] [CrossRef]
- Jat, M.K.; Garg, P.K.; Khare, D. Monitoring and modelling of urban sprawl using remote sensing and GIS techniques. Int. J. Appl. Earth Obs. Geoinf. 2008, 10, 26–43. [Google Scholar] [CrossRef]
- Lv, Z.Q.; Wu, Z.F.; Wei, J.B.; Sun, C.; Zhou, Q.G.; Zhang, J.H. Monitoring of the urban sprawl using geoprocessing tools in the Shenzhen Municipality, China. Environ. Earth Sci. 2011, 62, 1131–1141. [Google Scholar] [CrossRef]
- Rahman, A.; Aggarwal, S.P.; Netzband, M.; Fazal, S. Monitoring Urban Sprawl Using Remote Sensing and GIS Techniques of a Fast Growing Urban Centre, India. IEEE J. Sel. Top. Appl. Earth Obs. Remote Sens. 2011, 4, 56–64. [Google Scholar] [CrossRef]
- Sisodia, P.S.; Tiwari, V.; Dahiya, A.K. Urban sprawl monitoring using remote sensing and GIS techniques of the city Jaipur, India. Int. J. Appl. Geospat. Res. 2016, 7, 93–104. [Google Scholar] [CrossRef]
- Zeng, C.; He, S.; Cui, J. A multi-level and multi-dimensional measuring on urban sprawl: A case study in Wuhan metropolitan area, central China. Sustainability 2014, 6, 3571–3598. [Google Scholar] [CrossRef]
- Zeng, C.; Liu, Y.; Stein, A.; Jiao, L. Characterization and spatial modeling of urban sprawl in the Wuhan Metropolitan Area, China. Int. J. Appl. Earth Obs. Geoinf. 2015, 34, 10–24. [Google Scholar] [CrossRef]
- Frenkel, A.; Ashkenazi, M. Measuring urban sprawl: How can we deal with it? Environ. Plan. B Plan. Des. 2008, 35, 56–79. [Google Scholar] [CrossRef]
- Jaeger, J.A.G.; Bertiller, R.; Schwick, C.; Kienast, F. Suitability criteria for measures of urban sprawl. Ecol. Indic. 2010, 10, 397–406. [Google Scholar] [CrossRef]
- Ewing, R. Causes, characteristics, and effects of sprawl: A literature review. Environ. Urban Issues 1994, 21, 1–15. [Google Scholar]
- Jaeger, J.A.G.; Bertiller, R.; Schwick, C.; Cavens, D.; Kienast, F. Urban permeation of landscapes and sprawl per capita: New measures of urban sprawl. Ecol. Indic. 2010, 10, 427–441. [Google Scholar] [CrossRef]
- Ewing, R.; Pendall, R.; Chen, D. Measuring Sprawl and Its Impact; Smart Growth America: Washington, DC, USA, 2002. [Google Scholar]
- Tsai, Y.H. Quantifying urban form: Compactness versus ‘sprawl’. Urban Stud. 2005, 42, 141–161. [Google Scholar] [CrossRef]
- Wassmer, R.W. Urban Sprawl in a U.S. Metropolitan Area: Ways to Measure and a Comparison of the Sacramento Area to Similar Metropolitan Areas in California and the U.S. SSRN Electron. J. 2000. [Google Scholar] [CrossRef]
- Torrens, P.M.; Marina, A. Measuring Sprawl. In Association of Collegiate Schools in Planning Conference; University College London: London, UK, 2000; p. 34. [Google Scholar]
- Poelmans, L.; Van Rompaey, A. Detecting and modelling spatial patterns of urban sprawl in highly fragmented areas: A case study in the Flanders-Brussels region. Landsc. Urban Plan. 2009, 93, 10–19. [Google Scholar] [CrossRef]
- Kasanko, M.; Barredo, J.I.; Lavalle, C.; McCormick, N.; Demicheli, L.; Sagris, V.; Brezger, A. Are European cities becoming dispersed? A comparative analysis of 15 European urban areas. Landsc. Urban Plan. 2006, 77, 111–130. [Google Scholar] [CrossRef]
- Altieri, L.; Cocchi, D.; Pezzi, G.; Scott, E.M.; Ventrucci, M. Urban sprawl scatterplots for Urban Morphological Zones data. Ecol. Indic. 2014, 36, 315–323. [Google Scholar] [CrossRef]
- Schwarz, N. Urban form revisited-Selecting indicators for characterising European cities. Landsc. Urban Plan. 2010, 96, 29–47. [Google Scholar] [CrossRef]
- Jaeger, J.A.G.; Schwick, C. Improving the measurement of urban sprawl: Weighted Urban Proliferation (WUP) and its application to Switzerland. Ecol. Indic. 2014, 38, 294–308. [Google Scholar] [CrossRef]
- Baranzelli, C.; Jacobs-crisioni, C.; Batista, F.; Castillo, C.P.; Barbosa, A.; Torres, J.A.; Lavalle, C. The Reference Scenario in the LUISA Platform—Updated Configuration 2014 towards a Common Baseline Scenario for EC Impact Assessment Procedures; Publications Office of the European Union: Luxembourg, 2014. [Google Scholar]
- Batista e Silva, F.; Gallego, J.; Lavalle, C. A high-resolution population grid map for Europe. J. Maps 2013, 9, 16–28. [Google Scholar] [CrossRef]
- OECD. Definition of Functional Urban Areas (FUA) for the OECD Metropolitan Database; OECD: Paris, France, 2013. [Google Scholar]
- Jaeger, J.A.G.; Bertiller, R.; Schwick, C.; Müller, K.; Steinmeier, C.; Ewald, K.C.; Ghazoul, J. Implementing Landscape Fragmentation as an Indicator in the Swiss Monitoring System of Sustainable Development (Monet). J. Environ. Manag. 2008, 88, 737–751. [Google Scholar] [CrossRef] [PubMed]
| 1 | The LUISA Territorial Modelling platform aims to capture, at a very fine geographical detail (1 ha), the impacts of territorial policies on Europe. It is based on the concept of ‘land function’ for cross-sector integration and for the representation of complex system dynamics. It allows for the integrated assessment of how policy impacts the economic, social, and environmental domains, and has been used repeatedly for the ex-ante evaluation of EC policies that have a direct or indirect territorial impact. |
| 2 | For more detail on the choice of the weighting function see [19]. |
| 3 | The constant used to calculate the WCC come from a numerical approximation of integral equations valid for cell sizes between 0 and 1000 m [19]. |


| Sprawl Level | ACWUP Classification | European Environment Agency and European Commission’s Joint Research Centre Classification | ACWUP ranking |
|---|---|---|---|
| Sprawled | ≥4100 | Udine Pordenone | Helsinki Udine * |
| Sparse | 3600–4100 | Brussels Copenhagen Dresden Dublin Grenoble Helsinki | Brussels * Copenhagen * Dresden * Dublin * Grenoble * Pordenone |
| Dense | 3200–3600 | Bratislava Lyon Marseille Porto Sunderland Tallin Trieste Vienna | Bratislava * Sunderland * Lyon * Marseilles * Porto * Milan Vienna * Tallin * |
| Compact | ≤3200 | Bilbao Iraklion Milan Munich Palermo Prague | Munich * Prague * Bilbao * Palermo * Trieste Iraklion * |
| Most Sprawled Cities | ACWUP Values | Least Sprawled Cities | ACWUP Values |
|---|---|---|---|
| Osnabrück | 4317 | Thessaloniki | 1772 |
| Saarbrücken | 4286 | Athina | 2215 |
| Braunschweig-Salzgitter-Wolfsburg | 4237 | Madrid | 2297 |
| Ostrava | 4237 | Plovdiv | 2320 |
| Gent | 4192 | Granada | 2506 |
| Glasgow | 4190 | Palermo | 2533 |
| Helsinki | 4181 | Freiburg im Breisgau | 2654 |
| Antwerpen | 4050 | Genova | 2686 |
| Rzeszów | 4033 | Bari | 2736 |
| Brussels | 4030 | Barcelona | 2751 |
| Ruhrgebiet | 4025 | Rotterdam | 2815 |
| West Midlands urban area | 3999 | Frankfurt am Main | 2832 |
| Rouen | 3986 | Rennes | 2834 |
| Liège | 3986 | Amsterdam | 2881 |
© 2018 by the authors. Licensee MDPI, Basel, Switzerland. This article is an open access article distributed under the terms and conditions of the Creative Commons Attribution (CC BY) license (http://creativecommons.org/licenses/by/4.0/).
Share and Cite
Aurambout, J.-P.; Barranco, R.; Lavalle, C. Towards a Simpler Characterization of Urban Sprawl across Urban Areas in Europe. Land 2018, 7, 33. https://doi.org/10.3390/land7010033
Aurambout J-P, Barranco R, Lavalle C. Towards a Simpler Characterization of Urban Sprawl across Urban Areas in Europe. Land. 2018; 7(1):33. https://doi.org/10.3390/land7010033
Chicago/Turabian StyleAurambout, Jean-Philippe, Ricardo Barranco, and Carlo Lavalle. 2018. "Towards a Simpler Characterization of Urban Sprawl across Urban Areas in Europe" Land 7, no. 1: 33. https://doi.org/10.3390/land7010033
APA StyleAurambout, J.-P., Barranco, R., & Lavalle, C. (2018). Towards a Simpler Characterization of Urban Sprawl across Urban Areas in Europe. Land, 7(1), 33. https://doi.org/10.3390/land7010033