Article

Analysis of Vegetation Phytosociological Characteristics and Soil Physico-Chemical Conditions in Harishin Rangelands of Eastern Ethiopia

Rangeland Ecology and Biodiversity Department, School of Animal and Rangeland Science, Haramaya University, P.O. Box 138, 251-138 Dire Dawa, Ethiopia
Submission received: 6 September 2016 / Revised: 2 December 2016 / Accepted: 22 December 2016 / Published: 10 January 2017

Abstract

:
The objective of this study is to analyse the phytodiversity, distribution, herb biomass and physico-chemical conditions of the vegetation system in the context of communal continuous open grazing and enclosed grazing management practices in the Harishin rangelands of Eastern Ethiopia. A total of 58 herbaceous species and 11 woody species were recorded in the study area. Analysis of Importance Value Index for two management practices was represented by different combinations of species with varied dominance. The herbs’ diversity–dominance curve revealed a lognormal distribution in both managements practices. The overview of distribution patterns for most of the species layer showed contiguous growth and a clumped distribution pattern. Species diversity, richness, herb biomass, basal cover and soil physico-chemical attributes showed a distinct separation in relation to grazing management practices. Based on the findings, one can conclude that the establishment of enclosures has a positive impact in restoring rangeland vegetation diversity, distribution, in increasing herb productivity and in boosting soil fertility.

1. Introduction

Rangelands provide about 70% of the global forage for both domestic and wild ungulates [1,2]. In Africa, rangelands constitute about 65% of the total land area. They are the major sources of feed for ruminants [3]. In Ethiopia, rangelands cover about 62% of the country’s total landmass. They are largely found in the lowland areas of the country, particularly in areas below 1500 m above sea level. They support about 12–15 million pastoral and agro-pastoral communities in seven regional states of the country [4]. The rangeland ecosystems in the arid and semi-arid areas of Ethiopia have suffered from huge land and vegetation degradation due mainly to poor management, population growth, traditional open grazing systems, deforestation, continuous heavy grazing, as well as land use and climate changes [5,6]. These problems have led to a huge decline in rangeland resources and degradation of biodiversity, thereby having negative impacts on the rangeland ecosystems, livestock production, and the livelihoods of the pastoral communities [7,8,9].
The Somali Regional State is a major pastoral habitat in Ethiopia. It has a total land area of about 327,000 km2 of which, about 90% is classified as rangeland [8]. Like other arid and semi-arid rangeland ecosystems in the country, the rangelands in the region have long been exposed to extensive livestock grazing pressures. These have gradually caused a reduction in vegetation cover and preferred grass species, depletion of soil nutrients and acceleration of erosion [8]. Though extensive livestock grazing pressure is dominant in the region, it is common also to see the practice of enclosing communal open grazing rangelands. For instance, the pastoralists in the Harshin District in the region have been using enclosures in response to declining rangeland resources [10]. Currently, approximately 80% of the pasture lands in the district are occupied by individuals [11]. In the district, the practice of enclosing rangelands started during the early periods of the second half of the twentieth century when settlers from highland areas started to cultivate in Tuguchal, northwest of the district [12]. The intention was to discourage farmers from converting rangelands into farmlands. Some studies reported that rangeland enclosures had begun in the 1970s and showed a dramatic increase in the 1980s and 1990s following intense competition for access to land resources between pastoralists and returnees from Somali-Land [13,14]. In relation to this, Napier and Desta [11] reported that enclosures are established to reserve resources for use during dry seasons and to generate income by selling pasture/hay. This way of managing and reserving pastoral resources is common among pastoral and agro-pastoral communities in Africa. For instance, the Gogo and Maasai of Tanzania, the Himba of Namibia, and the Borana of Ethiopia traditionally set aside some of their grazing land during the rainy season and resort to it during the dry season [15].
Sumeet et al. [16] noted that findings from studies that address patterns of plant distribution and dynamics of biological resources can provide a rational basis for planning and making decisions about the environment. Otherwise, restoration of resources in their natural habitat would be very difficult [17]. The principal aim of phytosociology is to describe the vegetation, explain or predict its pattern, and classify it in a meaningful manner [18]. In connection to this, Warger and Morrel [19] noted that phytosociological analysis is important for understanding the functioning of any community. They strongly argue that it is the basis of the ecological study of any piece of vegetation [20]. Various studies (e.g., Brand and Goetz [21], Descheemaeker et al. [22], Yayneshet et al. [23], Bakker et al. [24] Allington and Valone [25], and Haftay et al. [10] were conducted to assess the direction of vegetation change in the context of rangeland enclosures to estimate dry matter yields and to indirectly measure the species composition. However, no study has been conducted using the phytosociological data analysis method for rangeland vegetation layers of the rangelands in Ethiopia in general and the Harishin rangelands in particular. Therefore, this study was designed to analyse the phytosociological characteristics of the Harishin rangelands vegetation and soil parameters. Such an analysis is important to provide detailed information on vegetation social status and to offer insights on rangeland ecosystem function and its restoration.
The objective of the study is to analyze the phytodiversity, distribution, herbs biomass and the soil physico-chemical conditions of the vegetation system in the context of traditional grazing management practices in Harishin rangelands of Ethiopia.

2. Material and Method
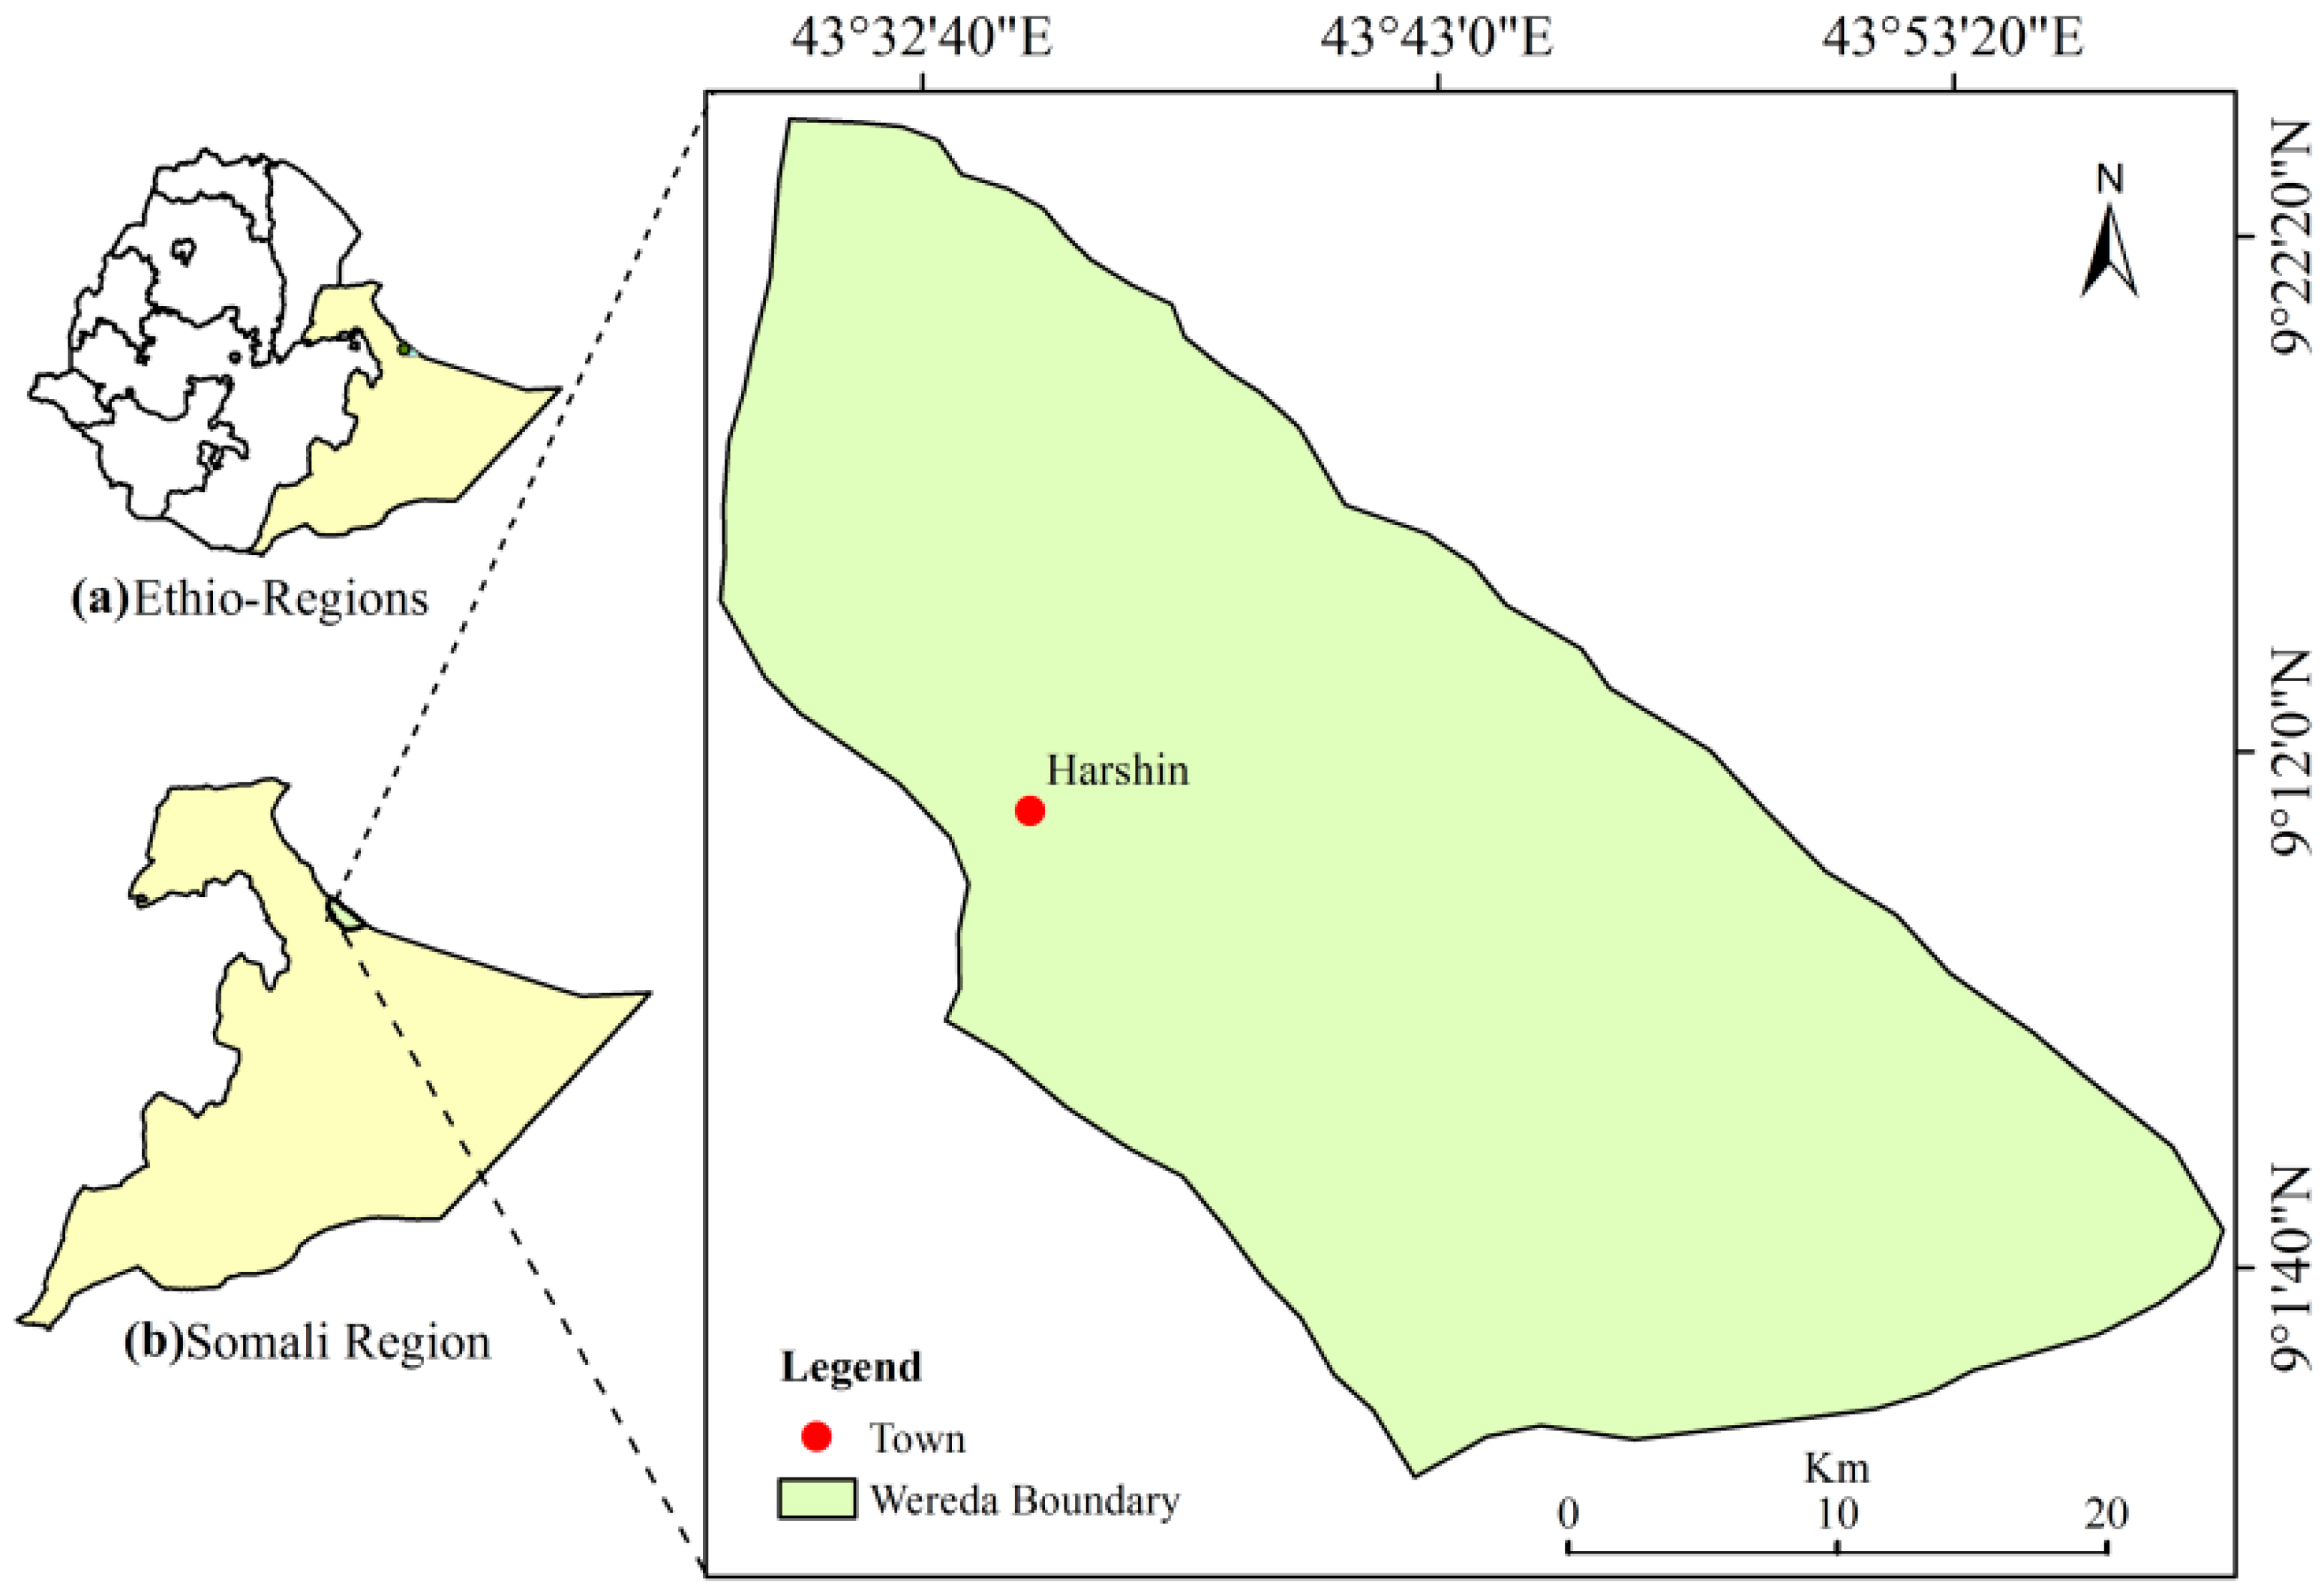
2.1. Study Area

The study was conducted in the Harshin rangelands of the Somali Regional State in Eastern Ethiopia (located between 9°1′40′′ N and 9°22′20′′ N and 43°32′40′′ E and 43°53′20′′ E), which is about 950 km east of Addis Ababa (Figure 1). The rainfall of the district is bimodal with a short rainy season in April to May. The main rainy season is from June to August. The mean minimum and maximum temperatures of the area are 20 °C and 35 °C, respectively. The mean annual rainfall is 560 mm. The natural vegetation of the study area is characterized as Acacia-wooded grasslands [26].

2.2. Site Selection

A reconnaissance survey was made to identify the rangeland sites. Six enclosures, constituting about 12 ha of total area, and the adjacent communal open grazing areas were systematically selected. Enclosures fenced for about 30 years were selected purposely to reduce variability among ages of enclosures. The opinions of community elders and agricultural office experts in the district were used to evaluate the similarity between the enclosures and the adjacent open areas in terms of their protection history, vegetation management and homogeneity in land use [10]. To avoid enclosure edge effects, open grazing area plots that lie at least 50 m from the boundaries of each enclosure were selected. The stocking densities of private enclosures were highly variable and depend, among other things, on enclosure size, level of grass regeneration and household herd size [10]. The communal rangelands were continuously grazed throughout the year and subjected to over grazing due to high stocking rates. The regional stocking density was estimated to be about 1.4, 56.6, and 3.5 per km2 for cattle, small ruminants and camels, respectively [10]. The vegetation survey was conducted in September and October 2014 when the flowering vegetation was at a late stage.

2.3. Herbaceous and Woody Vegetation Sampling

Two 20 m × 20 m (400 m2) plots were randomly laid out for sampling the private enclosures and the adjacent open access communal grazing areas. Finally, a total of 24,400 m2 plots (2 management type × 6 sampling sites × 2 plots) were considered. In the 400 m2 plots, the woody species, including both single stemmed and multi-stemmed ones, were recorded. Then, the number of individuals of each tree and shrub species was counted to estimate the diversity, frequency, density, abundance and Importance Value Index (IVI) of the woody vegetation. The basal cover of the woody species was estimated by measuring two canopy diameters at maximum and minimum diameters perpendicular to each other [27].
Within each of the 400 m2 plots, five 1 m × 1 m (1 m2) quadrants were nested (four at the corners and one at the center) yielding 120 quadrants (24 plots × 5 quadrants). The number of individuals of each herb species was counted to estimate the diversity, frequency, density, abundance, IVI, biomass and basal area cover. In each of the sample sites, the herbaceous vegetation was harvested at the ground level using hand shears from the five 1 m2 nested quadrants to assess the dry matter biomass. Then, the cut samples were weighed using a simple balance immediately. About 20%–30% of this biomass was retained for oven drying (105 °C for 24 h) and used to estimate dry matter. Herbaceous basal cover was estimated visually based on the proportion of area (soil part) covered by a grass base compared to bare ground in the 1-m2 quadrants. Identification of all species was done in the field. When it was difficult to identify species in the field, the species were recorded and herbarium specimens collected, pressed and dried properly using plant presses. That dried product was soon transported to Haramaya University for proper identification. The nomenclature of the plant species was designated based on the Flora of Ethiopia [28].

2.4. Soil Sampling and Analysis

From each sample site, 10 soil samples were taken from the 1 m2 quadrant located within 400-m2 plot yielding 120 soil samples (2 plots × 5 quadrate × 6 sample sites × 2 management practices). The soil samples were dug out with an Auger at a depth of 0–20 cm. The soil samples at each site were pooled to form one composite soil sample per sampling site yielding a total of 12 soil samples (2 management practices × 6 sample sites). Finally, the soil PH, electrical conductivity (EC), Total Nitrogen (N), Soil Organic Mater (SOM), Soil Organic Carbon (SOC), the availability of phosphorous (P), exchangeable potassium (K+), texture and bulk density were analysed in the soil laboratory at Haramaya University.
The soil PH was determined using PH meter in 1:2.5 soil water suspension ratios [29]. Electrical Conductivity (EC) was determined in a 1:2.5 soil water suspension following the steps and procedures suggested by Chopra and Kanwar [30]. Total percentage of nitrogen was determined using the Kjeldahl procedures suggested by Jackson [31]. Organic carbon was determined following the method recommended by Walkey and Black. Then, the organic matter of the sample soil was calculated by multiplying the percentage of the organic carbon by a factor of 1.724 following the method recommended by Brady [32]. The level of the available phosphorous was determined using the methods and procedures specified by Olsen et al. [33]. Available potassium was determined using Ammonium Acetate method at pH 7 [29]. Texture was analyzed with the help of the hydrometer method [34]. Finally, soil’s bulk density was determined by weighing the volume of the sample soil after drying it at 105 °C for 48 h [35].

2.5. Data Analysis

The distribution of species similarity between open grazing and enclosed areas was computed using the Index of Similarity (IS). Community Coefficient or Index of Similarity (IS) indicates the percentage of species similarity across the two rangeland management practices. Thus, Index of Similarity (IS) was calculated as follows:
ISs = c a + b + c × 100
where: c is the number of species common to both the forest stands; a, the number of species unique to the enclosure area; b is the number of species unique to open grazing area.
Species phytosociological characters were evaluated by analysing the frequency, density, abundance and Importance Value Index (IVI) using a formula recommended in Mandal and Josh [20].
Frequency = Total   no .   of   quadrates   in   which   the   species   occurred Total   no .   of   quadrates   studied × 100
Relative   Frequency = Frequency   of   a   species Frequency   of   all   species × 100
Density = Total   no .   of   individuals   of   a   species Total   no .   of   quadrates   studied
Relative   density = Number   of   individuals   of   a   species Number   of   individuals   of   all   species × 100
Abundance = Total   number   of   individuals   of   a   species Total   number   of   quadrates   in   which   the   species   occurred
Relative   Dominance   of   Herbaceous   Species = Basal   area   of   a   species Basal   area   of   all   the   species × 100
IVI = Relative   frequency + Relative   density + Relative   dominance
Woody species basal cover refers to the proportion of the ground area covered by the vertical projection of the species canopy cover and was used to determine woody species’ relative dominance. It was calculated using the following formula [27]:
Basal   cover = II ( CDMax + CDmin ) 2 4
where: CDMax = canopy diameter maximum; and CDmin = canopy diameter minimum
Relative   Dominance   of   Woody   Species = basal   cover   of   a   species basa   cove   of   all   the   species × 100
IVI   of   woody   species = Relative   frequency + Relative   density + Relative   basal   cover
The distribution of dominance of plant species in each of the open grazing and enclosed areas was determined using IVI. The herbs IVI data were graphically plotted in MS-Excel. Herbs dominance–diversity curve was drawn using natural log-transformed by plotting the co-ordinate points of its relative importance index (IVI) on the y-axis and its position in the sequence of species from the highest to the lowest IVI on the X-axis [36]. A linear fit was applied to rank VI value to delineate the resource sharing patterns by the species in the community and characterized as highest, medium and least important herbs. Moreover, the ratio of abundance to frequency (A/F) for different species was determined to elicit the distribution pattern. The ratio of abundance to frequency indicates regular random (<0.050), contagious (0.050–1.00) and clump (>1.00) distribution patterns. The diversity of the species was computed using the Shannon-Weiner index (H) calculated as [37]:
H = i = 1 s pi ln pi
where s = number of species; pi = proportion of individuals or abundance of the i-th species; and Ln is the natural logarithms to the base e. Shannon-Weiner Index (H’) was converted to effective number of species diversity [38] using the formula:
N 1 = Exp ( H )
N1 = Effective number of species; H’ = Shannon-Weiner function.
Principal component analysis (PCA) ordination was used to explain variance of analysed soil attributes across the two rangeland management practices. PCA axis correlation coefficient was used to explain the location of the vegetation and soil attributes across the open grazing and enclosed areas. Moreover, species rarefaction curves were drawn by plotting the average number of species as a function of the number of plots to see differences in the level of richness of the species in the open grazing area and enclosure areas. PCA and species richness rarefaction curve analysis were conducted using PAleontological Statistics (PAST) software package version 2.17 [39]. Vegetation and soil variables measured for the two management practices were statistically compared using a two-tailed t-test with each management practice being a categorical predictor and vegetation and soil variables as dependent variables. Vegetation and soil variables’ homogeneity of variance were tested using Levene’s equality of variance test. The computation was done after observing non-significant differences for all measured vegetation and soil variables. The statistical-test analyses were conducted using Statistical Package for Social Sciences version 20 [40]. Differences were considered significant at p < 0.05.

3. Results

3.1. Species Similarity between Management Practices

A total of 58 herbaceous species and 11 woody species were recorded in the open grazing areas and enclosure areas. The species distribution of Similarity Index between the enclosures and the open grazing areas were about 47.9% and 45.5% for herbaceous and woody species, respectively. The identified herbaceous species were greater in the enclosure areas than in the open grazing areas. About 52% of the herbaceous species were unique to enclosure areas. However, the identified woody species were greater in the open grazing areas than in the enclosure areas. About 36% of the woody species were unique to open grazing areas.

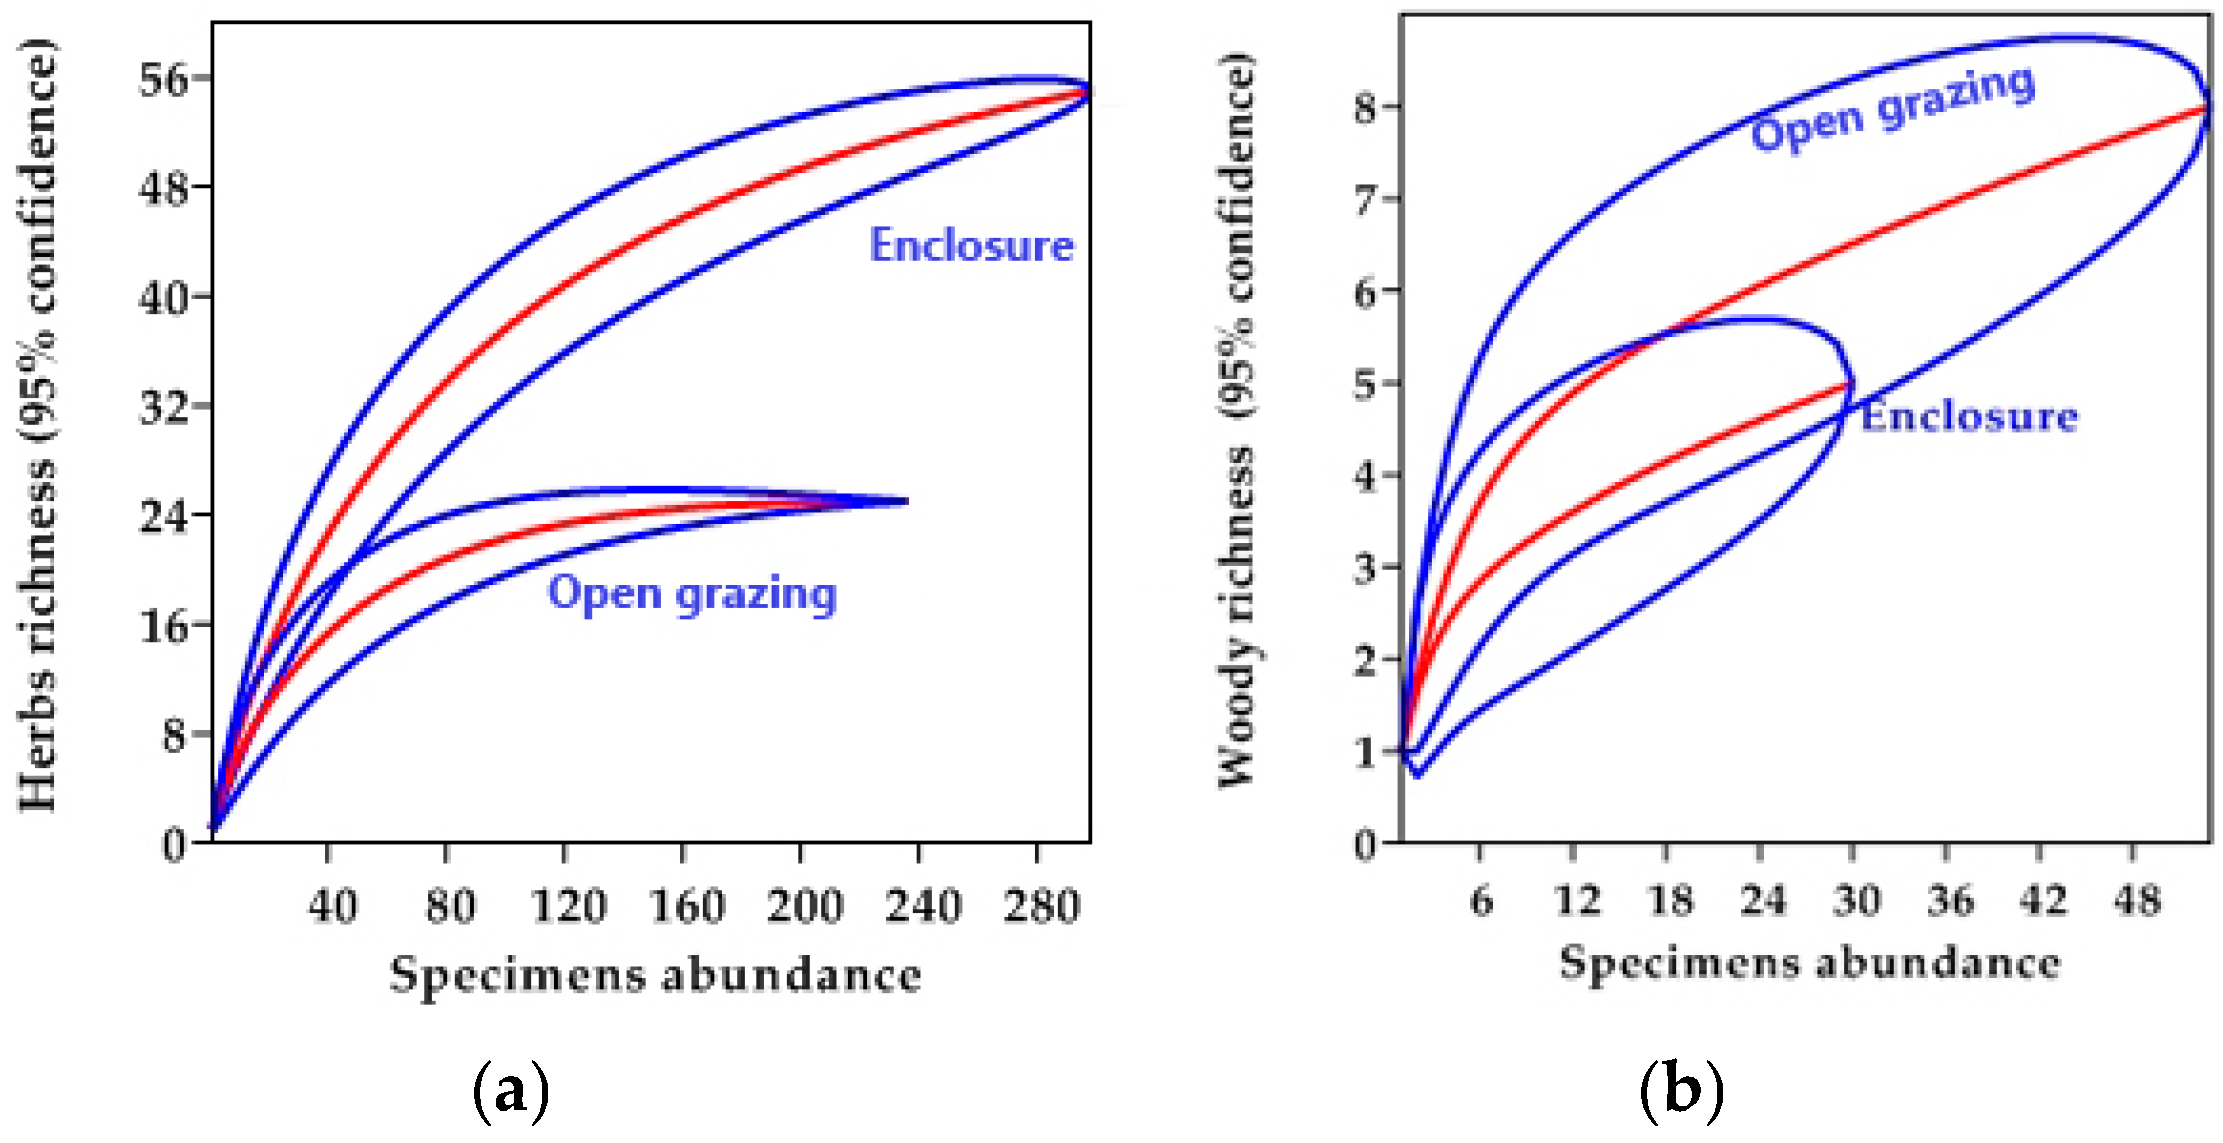
3.2. Species Diversity and Distribution

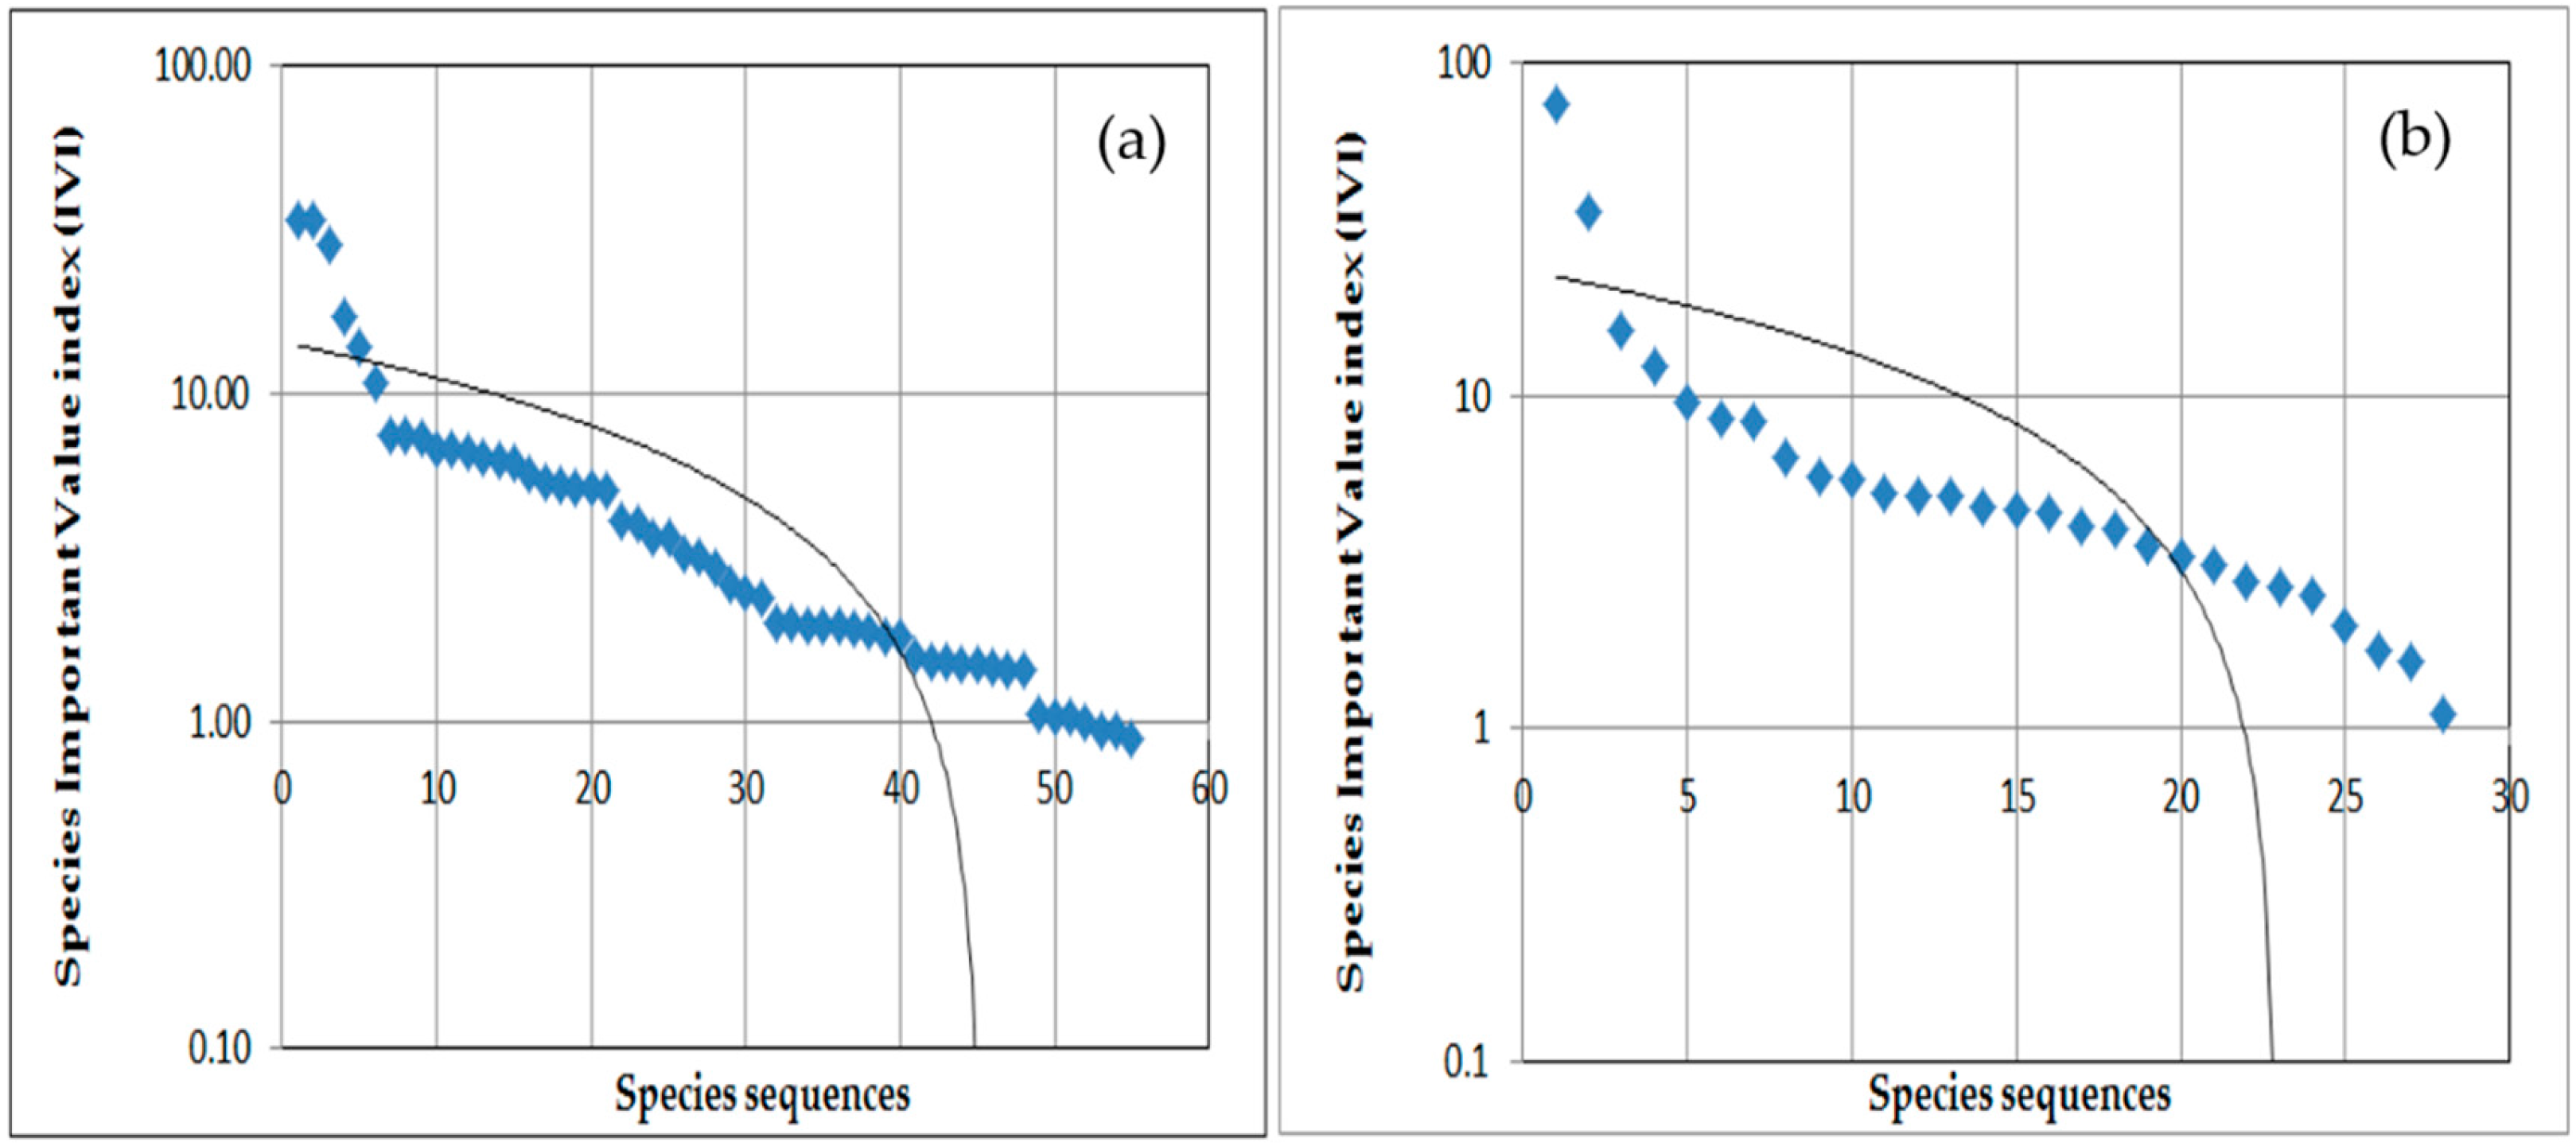
3.2.1. Diversity and Dominance (IVI) of Herb Species in Open Grazing Area

A total of 38 herbaceous species with a 4.51 diversity value were recorded in the open grazing areas. Distribution analysis of the herb species in the open grazing areas showed that the dominant species was Eragorostis aspera with an IVI value of 75.29. The co-dominating species were Eragrostis cilianensis IVI =36.11), Cynodon dactylon (IVI = 15.81), Tragus racemosus (IVI = 12.30), and Cenchurus ciliaris (IVI =10.99). A 58.33% frequency was observed in three species, namely Eragorostis aspera, Cynodon dactylon and Cenchurus ciliaris.
The species of Eragorostis aspera was found to have the highest density (39.43 m−2) followed by Eragrostis cilianensis (14.49 m−2) and Cynodon dactylon (5.70 m−2). Regarding the rank of the IVI distribution plot for herb layer sharing in the open grazing management practices, three species were recorded with the highest dominance followed by 23 species of medium dominance and 12 species of least importance (Table 1).

3.2.2. Diversity and Dominance (IVI) of Herb Species in Enclosure Areas

A total of 55 herbaceous species with a 6.55 diversity value were recorded in the enclosure areas. Analysis of the distribution of the herb species in the enclosure areas showed that the dominant species were Cynodon dactylon and Eragrostis cilianensi with a 33.96 IVI value. The co-dominating species were found to be Cenchurus ciliaris (IVI = 28.78), Chrysopogon aucheri (IVI = 15.81), Aristida adscencionis (IVI = 13.84), and Dactyloctenium scindicum (IVI = 10.89). Cynodon dactylon was recorded to have the highest density (24.24 individual m−2) followed by Cenchures ciliaris (19.68 individual m−2) and Eragrostis cilianensi (18.18 individual m−2). An 83.33% frequency was observed in Cenchures ciliaris followed species Cynodon dactylon and Chrysopogon aucheri (66.67%) and Ocimum lamifolium (58.33%). The dominance distribution patterns of herb species in the enclosure areas were ranked as 5 herb layers of high dominance, 38 species of medium dominance and 12 herbs of least dominance (Table 2).

3.2.3. Diversity and Dominance (IVI) of Woody Species in the Open Grazing Areas

A total of 9 woody species with a 3.17 diversity value were recorded in the open grazing areas. The maximum IVI (58.13) value and the highest density (8.10 individual m−2) were recorded for Acacia busie. The co-dominating species were Acacia nilotica (IVI = 51.23), Acacia etbica (IVI = 51.23) and Acacia toritilis (IVI = 39.55). The minimum IVI (9.13) value and the lowest density (0.75 individual m−2) were recorded for Securinega virosa. Regarding the distribution patterns of woody species in the open grazing areas, two species were found to have high distribution patterns followed by five species with medium distribution and two species with the least distribution (Table 3).

3.2.4. Diversity and Dominance (IVI) of Woody Species in Enclosure Areas

A total of 7 woody species with a 2.39 diversity value were recorded in the enclosure areas. The maximum IVI distribution analysis of the woody species in the enclosure areas showed that the dominant species was Acacia nilotica with an IVI value of 94.45 and a 100% frequency. The co-dominant species were Acacia etbica (IVI = 88.07) and Acacia busie (IVI = 62.39). Woody species of Acacia bussei and Grewia ferruginea were recorded to have the highest and least distribution patterns, respectively (Table 4).

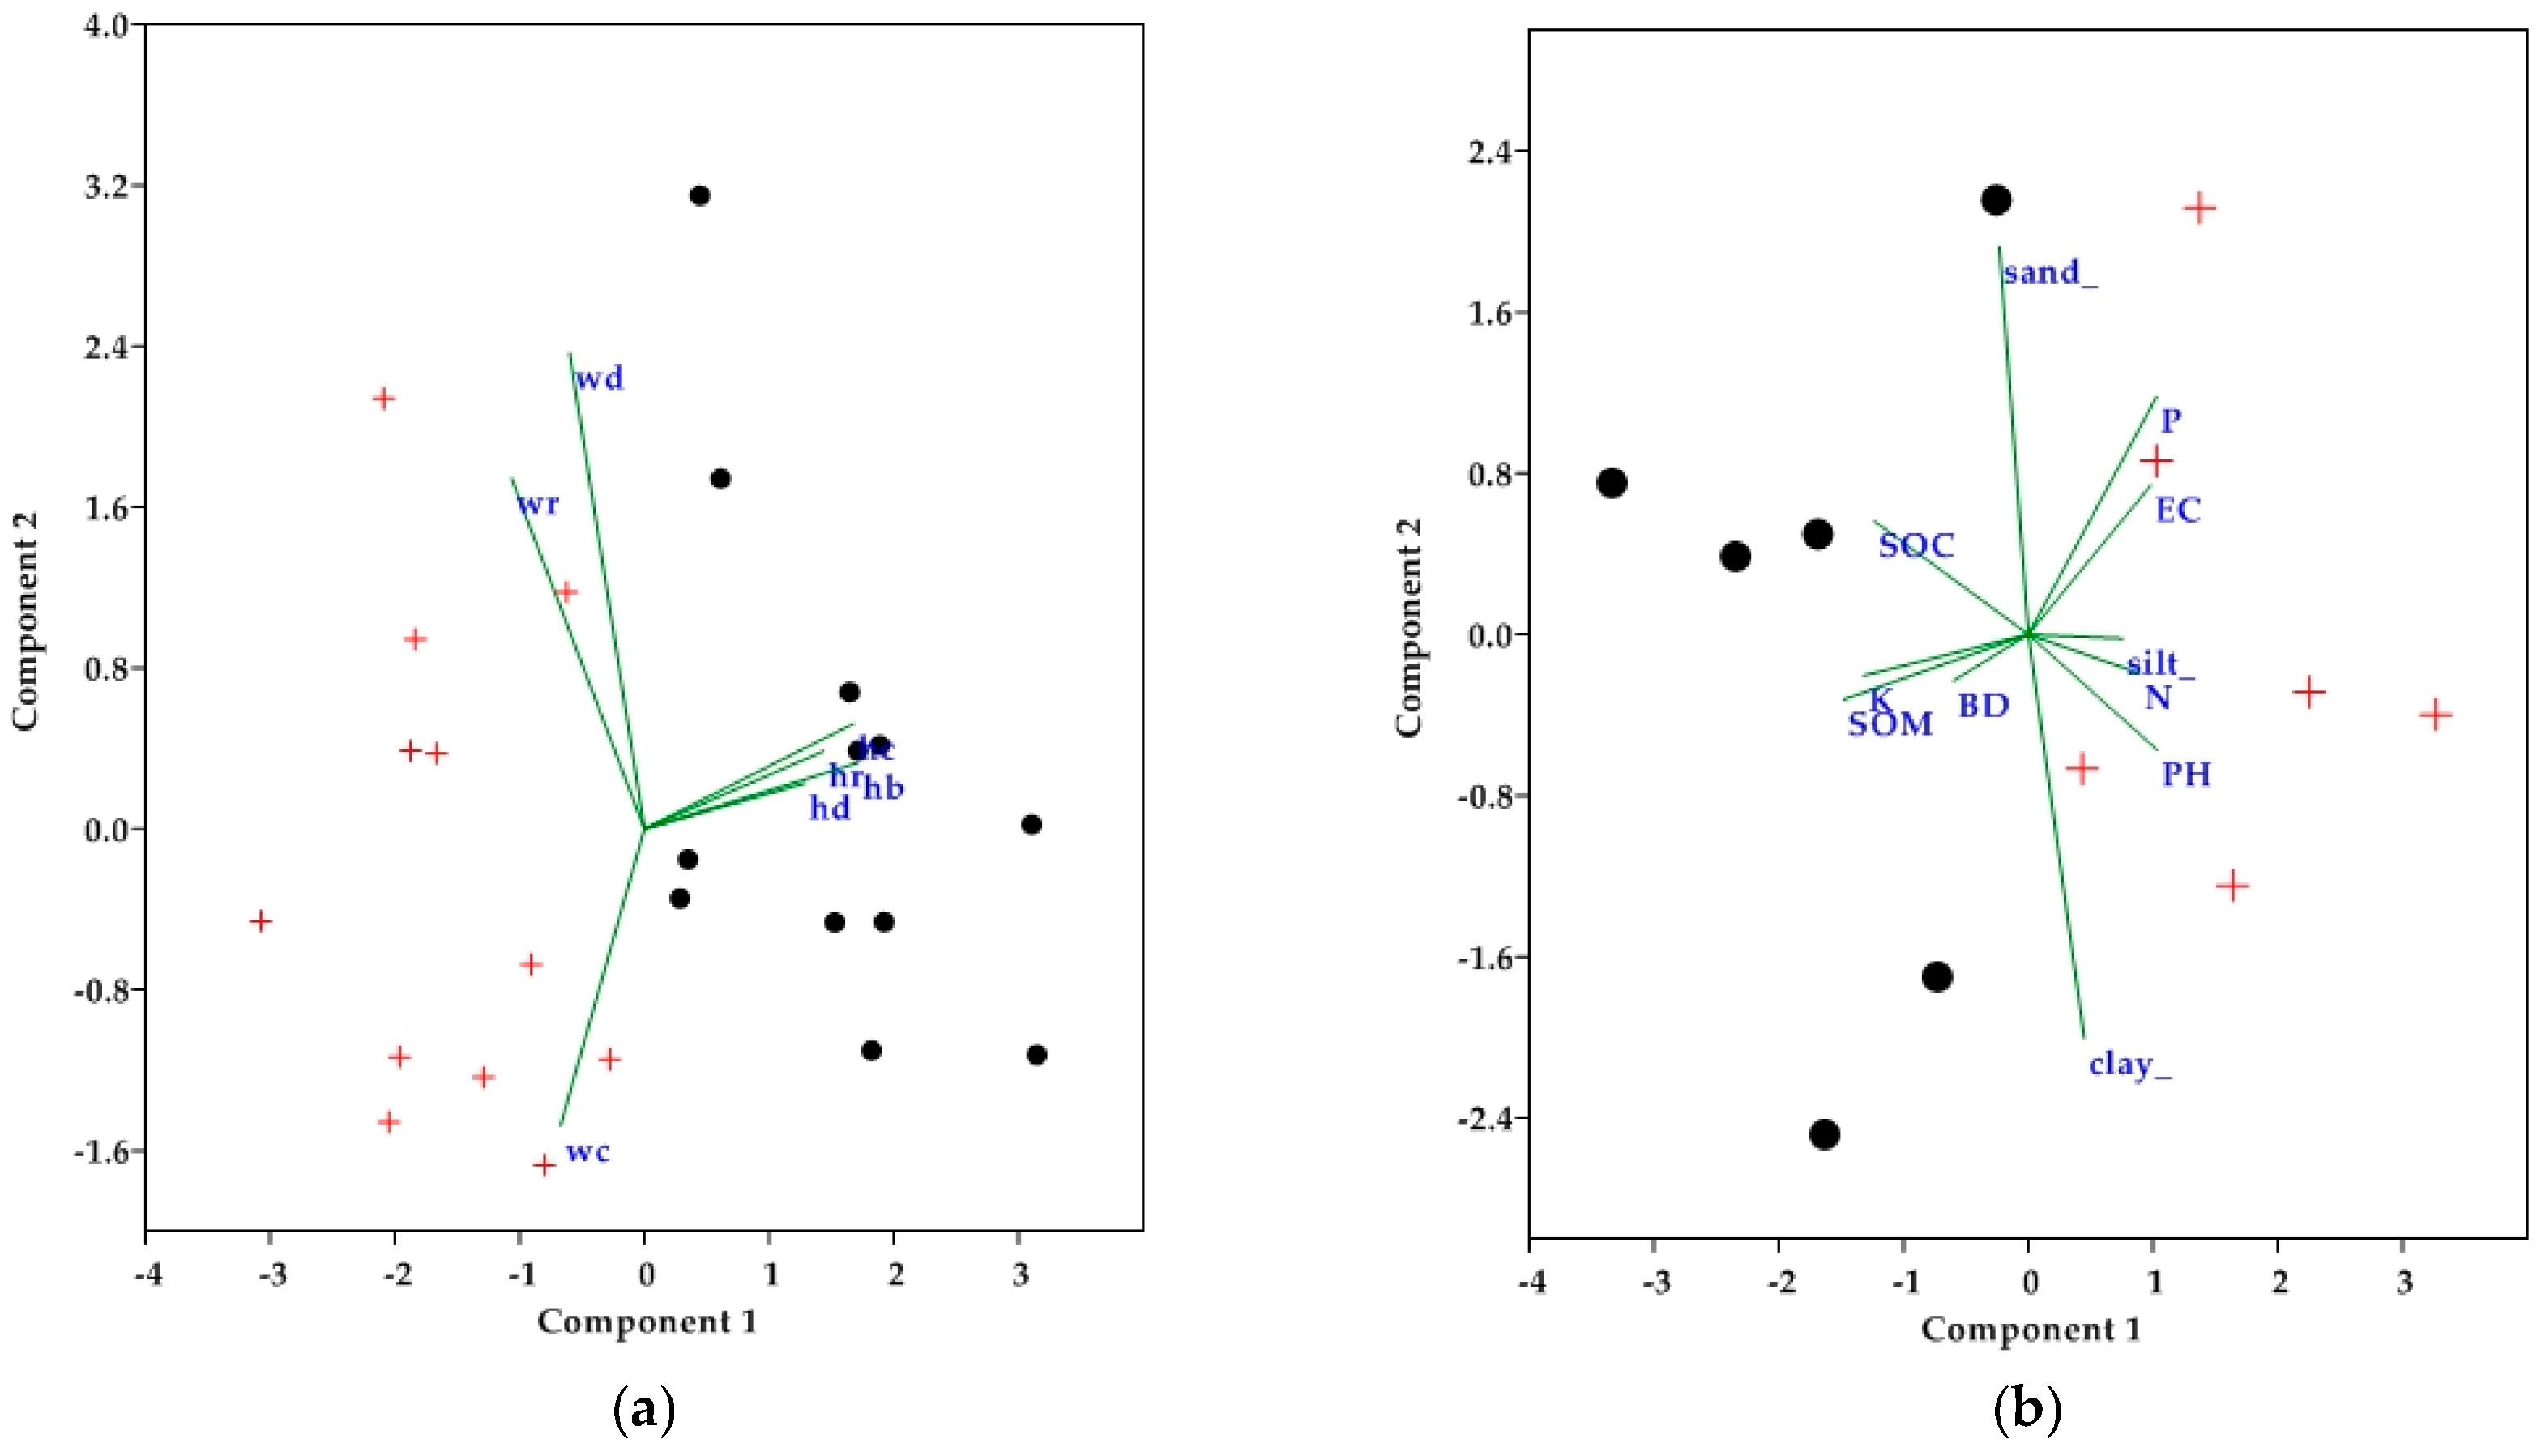
3.3. Vegetation Attributes Ordination and Analysis

The PCA correlation variance of herbs species diversity, richness, biomass, basal cover, and woody species basal cover, diversity and richness showed distinct separation (Figure 2) with principal component 1 accounting for 45.95% (eigenvalue = 3.21) and principal component 2 accounting for 20.89% (eigenvalue = 1.46) of the total explained variance in relation to the open grazing and enclosures areas.
Diversity of herbaceous species was found to be significantly higher (t = 2.2; p = 0.038) in the enclosure areas than in the open grazing areas. However, diversity of woody species was significantly higher (t = −2.42; p = 0.047) in the open grazing areas than in the enclosure areas (Table 1). The biomass of the herbaceous species above the ground was significantly different (t = 7.83; p = 0.000) between the enclosure areas and open grazing areas. The basal cover of herbaceous species was found to be significantly different (t = 17.00; p = 0.000) for the two management practices. Moreover, woody basal cover was also found to be significantly different (t = 2.49; p = 0.020). Both the biomass and basal area cover of the herbs in the enclosure areas was found to be more than twice that in the adjacent open grazing area (Table 5).
The species rarefaction curve of the species richness was found to be higher in the enclosure areas than in the open grazing areas. However, the trends of woody species richness were found to be greater in the open grazing than in the enclosure areas (Figure 3).

3.4. Soil Physico-Chemical Attribute Ordination and Analysis

Principal component analysis of soil physico-chemical attributes revealed distinct separation between the open grazing and enclosure areas with principal component 1 accounting for 59.77% (eigenvalue = 18. 63), principal component 2 accounting for 24.56% (eigenvalue = 7.65) and principal component 3 accounting for 11.39 (eigenvalue = 3.55). Moreover, PCA axis correlation coefficient of physico-chemical attributes across the management practices showed distinct separation (Figure 2) with principal component 1 accounting for 40.17% (eigenvalue = 4.8) and principal component 2 accounting for 16.77% (eigenvalue = 2.01).
Soil parameters of N, P, EC and pH were ordinated in the open grazing areas while the soil samples of organic matter (SOM) and organic carbon (SOC) were ordinated in the enclosure areas.
Moreover, from the measured soil attributes only soil samples K (t = 3.49; p = 0.006), pH (t = −3.57; p = 0.005), SOM (t = 5.31; p = 0.000) and SOC (t = 2.26; p = 0.047) were found to be significantly different between the open grazing and enclosure areas whereas the soil parameters N, P, EC, bulk density and soil texture (clay, sand, silt) were found to be insignificantly different across managements practices (Table 6).

4. Discussion

4.1. Species Phytosociological Characteristics

Analysis of IVI provides information about the social status of a species and can be recognized as patterns of association of dominant species in a community [41]. Analysis of IVI in the two management practices represented different combinations of species with different dominants and co-dominants. Eragorostis aspera, Eragrostis cilianensis, Cynodon dactylon, Tragus racemosus, and Cenchurus ciliaris were found to be the most dominant herb species in the open grazing areas while Cynodon dactylon, Eragrostis cilianensis, and Cenchurus ciliaris were found to be the highest IVI and density in the enclosure areas. Supporting the findings of Mandal and Joshi [20] on open grazing areas, the findings in the current study suggest that vegetation experiencing stresses from biotic pressure are under serious threat. However, some of the herb species in the open grazing areas have managed to survive. This could be attributable to their broad ecological amplitude and greater adaptability against biotic influences. In relation to this, McGranahan et al. [42] noted that grazing might be associated with variation in community composition within vegetation states. Vegetation structure and composition may be influenced by novel factors such as fire, herbivore, topography and past management practices that interact in a complex way to determine plant community architecture [43,44,45].
Variation of herb distribution in the enclosure areas may be attributed to the survival and reproduction of maximum species due to moderate level of species competition during early regeneration which has led to the domination of only a few species. This condition has affected the plant species which are susceptible to species’ inter-competition. Validating this finding, Grime [46] noted that with an increase in environmental stress, the species adapted to low levels of environmental stress lose their competitive advantage whereas those that are more resistant to environmental stress can increase in abundance. It is uncertain, however, the extent to which the smallest differences between samples of vegetation are environmentally determined and the extent to which they affect the chances of species establishing themselves first [47].
The herbaceous species’ dominant diversity curves followed a lognormal distribution in both management practices (Figure 4). The lognormal dominance–diversity curves indicate the heterogeneity of the species [48]. Lognormal hypothesis assumes that the importance of species is governed by the interactions between a large numbers of factors determining success in the niche hyperspace [36]. In connection to this, Whittaker [49] noted that the log-normal series describes the partitioning of realized niche space among various species and is the consequence of the evolution of a particular species’ diversity along the niche parameters which they exploit. Similar types of herb dominance–diversity curves have been reported in the forest ecosystem [50,51].
Dominance of a few species in both management areas indicated patterns of species distribution. The distribution of patterns (A/F ratio) for most of the species’ layers showed contiguous growth patterns followed by a clumped distribution pattern. According to Odum [18], contiguous distribution is the most common pattern in nature and is formed as a result of small but significant variations in the ambient environmental conditions. The current study also suggests that clumped distribution often occurs due to an uneven distribution of nutrients or other resources in the environment. Variations in the distribution pattern among sites and vegetation composition are associated with micro environmental and biotic factors [52]. Patterns of distribution depend both on the physicochemical nature of the environment and the biological peculiarities of the organisms [18].

4.2. Interaction of Management and Vegetation Attributes

The PCA correlation coefficient of the measured herbaceous vegetation across the management practices showed distinct variation with a greater value in the enclosures areas than in the open grazing areas. In the study area, continuous open grazing has caused a reduction in species richness, plant abundance, standing biomass and basal cover. This is attributed to the soil parameters and pressure of high and unregulated grazing on freely accessed pastures. The total variation explained by the soil parameters in multivariate tests was about 60%. This shows that there are other factors that influence the structure and composition of vegetation in the area. In line with this finding, Yayneshet et al. [23] reported that grazing throughout the year has consistently reduced the above ground biomass production capability of the grazed area. Similarly, Bilotta et al. [53] reported that heavy and uninterrupted grazing can cause a reduction in herbaceous vegetation and a sharp decline in the concentration of soil nutrients, thereby leading to defoliation and soil compaction. Since they consume aboveground biomass, herbivores reduce the amount of litter that falls on the soil surface. Excessive plant defoliation from over grazing damages plant tissues that, as a result, reduces the diversity of plant species and the percentage cover of the herbaceous vegetation [5].
The findings in the current study are in line with similar studies on the pastoral systems of Ethiopia which reported the existence of higher herbage mass and basal cover in the enclosure area [7,9]. The high diversity, richness and biomass measured in the enclosures might be attributable to increased litter accumulation, improved soil organic matter and other nutrients inside the enclosures [23,54]. According to Tessema et al. [5], higher soil nutrient contents under light grazing conditions are attributed mainly to larger basal cover and greater amounts of standing biomass. Increase in herbage mass in enclosure areas could be linked partly to a seasonal reduction in grazing pressure and partly to the subsequent accumulation of soil organic matter during the wet season resting period [54]. In the study area, a reduction in woody species richness inside the enclosure areas is attributed mainly to individual pastoralists’ management trends in enclosure areas. Most of the pastoralists in the study area do not prefer woody species in their enclosure areas. They frequently clear most of the shrubs and trees inside the enclosures by leaving a few species, which are used to shade their animals from direct hot sun. A low density of woody species has been shown to increase soil nutrient status and thus encourage grass-growing conditions [55,56]. The overall density threshold of woody species in terms of bush encroachment is estimated to be more than 2500 trees equivalent ha–1 [57]. However, measurement of the density and basal cover of woody species revealed that they were not large enough to be recognized as being in a woody-encroached state that substantially suppresses the herbaceous biomass. This indicates that the pastoralists in the study area are conscious of the potential threat of woody species and, because of this, they frequently clear most of the shrubs and trees that are not preferred by their livestock. This finding supports previous findings [10] that differences in the herbaceous biomass between enclosures and open-access areas may occur may be attributed more to grazing impacts than to the removal of woody species [10].

4.3. Soil Physico-Chemical Attributes

Soil nutrients K, SOM and SOC were significantly higher in the enclosure areas than in the open grazing areas. The higher soil nutrient contents inside enclosure areas are attributed mainly to the higher vegetation coverage and the role of increased biomass in nutrient cycling in enclosure areas, which result in higher litter input and improved content of organic matter in the soil. In line with this study, Reeder and Schuman [58] reported the existence of higher soil organic carbon in lightly grazed sites compared to heavily grazed ones. This happens due to an increase in above ground plant litter and annual forbs and grasses that enhance the formation and accumulation of SOM [59]. Among the soil properties, the total organic C is a sensitive soil quality indicator [60]. This means that within a narrow range of soil the organic C may serve as a suitable indicator of soil fertility [61]. The SOC fraction may offer further insight into soil fertility changes and the sustainability of land-use and management practices [62].
The soil samples from the open access communal grazing area showed a significantly higher pH value than those taken from the enclosure areas. Moreover, high concentrations of soil parameters like N, P, PH, EC and soil silt content were observed in the open grazing areas. Increase in the concentrations of total N and P under open grazing is probably due to the existence of high animal grazing that contributes to increasing animal dung, urine and defoliation of plants during grazing. Validating this finding, Yates et al. [63] reported that concentrations of soil nitrogen and the availability of phosphorous were significantly higher in heavily grazed rangelands. Complex spatial patterns of soil nutrients have been commonly presumed to develop over time as a result of the interactions of climate, parental material, vegetation type and topography [64]. In connection to this, Tefera et al. [60] reported that the rangelands of east Africa generally have a low level of soil fertility.

5. Conclusions

The findings in the current study generally show that grazing management practices have an effect on the dominance distribution, diversity, herb biomass and soil attributes of vegetation species in the Harishin rangelands of Somali Regional State, Ethiopia. The stress of unregulated grazing on open grazing areas is generally linked to the diminished diversity and abundance of herb species due to the dominance of a few species having greater adaptability against grazing influences. This is attributed to a reduction in standing biomass, basal cover and soil nutrients such as soil organic matter. It can be concluded that the establishment of enclosures has a positive effect in restoring the diversity, productivity and soil fertilities of rangeland vegetation. Since the findings of the current study area were based on small samples, the researcher calls for a more broad-based investigation to provide a stronger basis for characterizing the functioning of rangeland systems of the pastoral ecosystem.

Supplementary Materials

Supplementary data related to this article is available online at: www.mdpi.com/2073-445X/6/1/4/s1. Table S1. Attributes for herbaceous species in enclosures areas averaged for 12 plots used for analysing frequency, density, abundance, and Importance Value Index (IVI) in Harishin Rangelands of Ethiopia; Table S2. Attributes for herbaceous species in open grazing areas averaged for 12 plots used for analysing frequency, density, abundance, and Importance Value Index (IVI) in Harishin Rangelands of Ethiopia; Table S3. Attributes for woody species in enclosure areas in 12 plots used for analysing frequency, density, abundance, and Importance Value Index (IVI) in Harishin Rangelands of Ethiopia; Table S4. Attributes for woody species in open grazing areas in 12 plots used for analysing frequency, density, abundance, and Importance Value Index (IVI) in Harishin Rangelands of Ethiopia; Table S5. Attributes for Vegetation parameters used principal component analysis ordination and statistically compared from six plots in enclosures and open-access communal grazing areas of Harishin rangelands, Ethiopia; Table S6. Attributes for Soil physico-chemical parameters used principal component analysis ordination and statistically compared from twelve plots in enclosures and open-access communal grazing areas of Harishin rangelands, Ethiopia; Table S7. Herbaceous species relative dominance, relative frequency and relative density and IVI distribution analysis in open grazing areas of Harishin rangelands, Ethiopia; Table S8. Herbaceous species relative dominance, relative frequency and relative density and IVI distribution analysis in enclosure areas of Harishin rangelands, Ethiopia; Table S9. Woody species relative dominance, relative frequency and relative density and IVI distribution analysis species in enclosure areas of Harishin rangelands, Ethiopia; Table S10. Woody species relative dominance, relative frequency and relative density and IVI distribution analysis species in open grazing areas of Harishin rangelands, Ethiopia.

Acknowledgments

The author is grateful to Ethiopian Institution of Agricultural Research (EIAR) for covering the field and laboratory research costs. The author expresses his sincere thanks to Tessema Zewdu for sharing experience during preparation of this manuscript. I thank Abudurazak Abdilahi for his support in the identification of the names of field species and for his other assistances during data collection. The author would also like to acknowledge Jeylan Woliyie Hussein for his language correction helped enrich the manuscript significantly. Finally, the Associate editor and anonymous reviewers whose critical comments helped improve the manuscript are also highly appreciated.

Conflicts of Interest

The author declares no conflict of interest. The founding sponsors had no role in the design of the study; in the collection, analyses, or interpretation of data; in the writing of the manuscript, and in the decision to publish the results.

References

  1. Derner, J.D.; Boutton, T.W.; Briske, D.D. Grazing and ecosystem carbon storage in the North American Great plains. Plant Soil J. 2006, 280, 77–90. [Google Scholar] [CrossRef]
  2. Tennigkeit, T.; Wilkes, A. Carbon finance in rangelands: An assessment of the potential for carbon finance in rangelands. In Proceedings of the International Council for Research in Agroforestry, World Agroforestry Center, Kunming, China, 30 September 2008; p. 29.
  3. Rutherford, M.C.; Mucina, L.; Lotter, M.C.; Bredenkamap, G.J.; Simit, J.H.T.; Scott-Shaw, C.R.; Hoare, D.B.; Goodman, P.S.; Bezuidwnhout, H.; Scott, L.; et al. The Vegetation of South Africa, Lestho and Swaziland. Strelitzia 19; South Africa National Biodiversity Institute: Pretoria, South Africa, 2006; pp. 439–567. [Google Scholar]
  4. Coppock, D.L.; Tezera, S.; Desta, S.; Gebru, G. Achieving real development impact among pastoralists: Lessons from Ethiopia. In Proceedings of the IX International Rangeland Congress (IX IRC), Diverse Rangelands for a Sustainable Society, Rosario, Argentina, 2–8 April 2011; pp. 679–684.
  5. Tessema, Z.K.; de Boer, W.F.; Baars, R.M.T.; Prins, H.H.T. Changes in soil nutrients, vegetation structure and herbaceous biomass in response to grazing in a semiarid savanna in Ethiopia. J. Arid Environ. 2011, 75, 662–670. [Google Scholar] [CrossRef]
  6. Flintan, F.; Behnke, R.; Neely, C. Natural Resource Management in the Dry Lands in the Horn of Africa: Brief Prepared by a Technical Consortium Hosted by CGIAR in Partnership with the FAO Investment Centre, Technical Consortium Brief 1; International Livestock Research Institute: Nairobi, Kenya, 2013. [Google Scholar]
  7. Abule, E.; Snyman, H.A.; Smit, G.N. Rangeland evaluation in the middle of Ethiopia: I. Herbaceous vegetation cover. J. Arid Environ. 2007, 70, 253–271. [Google Scholar] [CrossRef]
  8. Kassahun, A.; Snyman, H.A.; Smit, G.N. Impact of rangeland degradation on pastoral production systems, livelihoods and perceptions of the Somali pastoralists in eastern Ethiopia. J. Arid Environ. 2008, 72, 1265–1281. [Google Scholar] [CrossRef]
  9. Angassa, A.; Sheleme, B.; Oba, G.; Treydte, A.C.; Linstödter, A.; Sauerborn, J. Savanna land use and its effect on soil characteristics in southern Ethiopia. J. Arid Environ. 2012, 81, 67–76. [Google Scholar] [CrossRef]
  10. Haftay, H.; Yayneshet, T.; Animut, G.; Treydte, C. Rangeland vegetation responses to traditional enclosure management in eastern Ethiopia. Rangel. J. 2013, 35, 29–36. [Google Scholar] [CrossRef]
  11. Napier, A.; Desta, S. Review of Pastoral Rangeland Enclosures in Ethiopia; Feinstein International Center, Tufts University: Medford, MA, USA, 2011. [Google Scholar]
  12. Fekadu, B. Exploring incentives for rangeland enclosures among pastoral and agro-pastoral households in eastern Ethiopia. Glob. Environ. Chang. 2009, 19, 494–502. [Google Scholar] [CrossRef]
  13. Hogg, R. Changing land use and resources conflict among Somali pastoralists in the Haud of South-east Ethiopia. In Pastoralists, Ethnicity and the State in Ethiopia; Hogg, R., Ed.; HAAN publishing: London, UK, 1997; pp. 105–122. [Google Scholar]
  14. Sugule, J.; Walker, R. Changing Pastorialism in the Ethiopian Somali National Regional State; South East Rangelands Project and UNDP Emergencies unit for Ethiopia: Addis Ababa, Ethiopia, 1998. [Google Scholar]
  15. Aerts, R.; Nyssen, J.; Haile, M. On the difference between “exclosures” and “enclosures” in ecology and the environment. J. Arid Environ. 2009, 73, 762–763. [Google Scholar] [CrossRef]
  16. Gairola, S.; Sharma, C.M.; Suyal, S.; Ghildiyal, S.K. Composition and diversity of five major forest types in moist temperate climate of the western Himalayas. For. Stud. China 2011, 13, 139–153. [Google Scholar] [CrossRef]
  17. Khoshoo, T.N. Plant Diversity in the Himalaya: Conservation and Utilization; Govind Ballabh Pant Institute of Himalayan Environment and Development: Almora, India, 1992. [Google Scholar]
  18. Odum, E.P. Fundamentals of Ecology, 3rd ed.; Saunders: Philadelphia, PA, USA, 1971. [Google Scholar]
  19. Warger, M.J.A.; Morrel, V.E. Plant species and plant communities: Some conclusion. In Proceedings of the International Symposium, Nijmegen, The Netherlands, 11–12 November 1976; pp. 167–175.
  20. Mandal, J.; Joshi, S.P. Analysis of vegetation dynamics and phytodiversity from three dry deciduous forests of Doon Valley, Western Himalaya, India. J. Asia Pac. Biodivers. 2014, 7, 292–304. [Google Scholar] [CrossRef]
  21. Brand, M.D.; Goetz, H. Vegetation of exclosures in Southwestern North Dakota. J. Range Manag. 1986, 39, 434–437. [Google Scholar] [CrossRef]
  22. Descheemaeker, K.; Raes, D.; Nyssen, J.; Poesen, J.; Haile, M.; Deckers, J. Changes in water flows and water productivity upon vegetation regeneration on degraded hill slopes in northern Ethiopia: A water balance modeling exercise. Rangel. J. 2009, 31, 237–249. [Google Scholar] [CrossRef]
  23. Yayneshet, T.; Eik, L.O.; Moe, S.R. The effects of exclosures in restoring degraded semi-arid vegetation in communal grazing lands in northern Ethiopia. J. Arid Environ. 2009, 73, 542–549. [Google Scholar] [CrossRef]
  24. Bakker, J.D.; Rudebusch, F.; Moore, M.M. Effects of long-term livestock grazing and habitat on understory vegetation. West. N. Am. Nat. 2010, 70, 334–344. [Google Scholar] [CrossRef]
  25. Allington, G.R.H.; Valone, T.J. Long-term livestock exclusion in arid grassland alters vegetation and soil. Rangel. Ecol. Manag. 2011, 64, 424–428. [Google Scholar] [CrossRef]
  26. Le Houérou, H.N.; Corra, M. Some browse plants of Ethiopia. In Browse in Africa: The Current State of Knowledge; International Livestock Centre for Africa: Addis Ababa, Ethiopia, 1980; pp. 109–114. [Google Scholar]
  27. Greig-Smith, P. Quantitative Plant Ecology, 3rd ed.; Blackwell Scientific: Oxford, UK, 1983. [Google Scholar]
  28. Hedberg, I.; Edwards, S. Flora of Ethiopia; The National Herbarium: Addis Ababa, Ethiopia, 1995. [Google Scholar]
  29. Lewis, J.; Freitas, F. Physical and Chemical Methods of Soil and Water Analysis; Food and Agriculture Organization (FAO): Rome, Italy, 1984; p. 275. [Google Scholar]
  30. Chopra, S.L.; Kanwar, K. Analytical Agricultural Chemistry; Kalyani University Publishers: New Delhi, India, 1976. [Google Scholar]
  31. Jackson, M.L. Soil Chemical Analysis; Prentice-Hall: Englewood Cliffs, NJ, USA, 1970; p. 498. [Google Scholar]
  32. Brady, N.C.; Weil, R.R. The Nature and Properties of Soil, 12th ed.; Print Ice Hall: Upper Saddle River, NJ, USA, 1999. [Google Scholar]
  33. Olsen, S.R. Estimation of Available Phosphorus in Soils by Extraction with Sodium Bicarbonate; United States Department of Agriculture (USDA): Washington, DC, USA, 1954; pp. 1–19.
  34. Gee, G.W.; Bauder, J.W. Particle size analysis by hydrometer: A simplified method for routine textural analysis and a sensitivity test ofmeasurement parameters. J. Soil Sci. 1979, 43, 1004–1007. [Google Scholar] [CrossRef]
  35. Blake, G.R.; Hartage, K.H. Bulk density. In Method of Soil Analysis, Part 1: Physical and Mineralogical Methods; Klute, A., Ed.; Soil Science Society of America, American Society of Agronomy: Madison, WI, USA, 1986; pp. 12–15. [Google Scholar]
  36. Whittaker, R.H. Communities and Ecosystems; Macmillan: London, UK, 1970; p. 158. [Google Scholar]
  37. Krebs, C.J. Ecological Methodology; University of British Colombia: Vancouver, BC, Canada, 1999. [Google Scholar]
  38. Jost, L. Entropy and diversity. Oikos 2006, 113, 363–375. [Google Scholar] [CrossRef]
  39. Hammer, O.; Harper, D.A.T.; Ryan, P.D. PAST: Paleontological statistics software package for education and data analysis. Palaeontola Electron. 2001, 4, 9. [Google Scholar]
  40. Nie, N.H.; Bent, D.H.; Hull, C.H. SPSS: Statistical Package for Social Sciences; McGraw-Hill: New York City, NY, USA, 1970. [Google Scholar]
  41. Parthasarathy, N.; Karthikeyan, R. Biodiversity and population density of woody species in a tropical evergreen forest in Courtallum reserve forest, Western Ghats, India. Trop. Ecol. 1997, 38, 297–306. [Google Scholar]
  42. McGranahan, D.A.; David, M.E.; Samuel, D.F.; James, R.M.; Diane, M.D. Multivariate analysis of rangeland vegetation and soil organic carbon describes degradation, informs restoration and conservation. Land 2013, 2, 328–350. [Google Scholar] [CrossRef]
  43. Banda, T.; Schwartz, M.W.; Caro, T. Woody vegetation structure and composition along a protection gradient in a miombo ecosystem of western Tanzania. For. Ecol. Manag. 2006, 230, 179–185. [Google Scholar] [CrossRef]
  44. Gandiwa, E.; Tupulu, N.; Zisadza-Gandiwa, P.; Muvengwi, J. Structure and composition of woody vegetation around permanent-artificial and phemeral-natural water points in northern Gonarezhou National Park, Zimbabwe. Trop. Ecol. 2012, 53, 169–175. [Google Scholar]
  45. Muposhi, V.K.; Ndlovu, M.; Gandiwa, E.; Muvengwi, J.; Muboko, N. Vegetation dynamics prior to wildlife reintroductions in southern Umfurudzi Park, Zimbabwe. J. Anim. Plant Sci. 2014, 24, 1680–1690. [Google Scholar]
  46. Grime, J.D. Control of species diversity in herbaceous vegetation. J. Environ. Manag. 1973, 1, 151–167. [Google Scholar]
  47. McNaughton, S.J.; Wolf, L.L. Dominance and the niche in ecological systems. Science 1970, 167, 131–139. [Google Scholar] [CrossRef] [PubMed]
  48. May, R.M. Patterns of species abundance and diversity. In Ecology and Evolution of Communities; Cody, M.L., Diamond, J.M., Eds.; Harvard University Press: Cambridge, MA, USA, 1975; pp. 81–120. [Google Scholar]
  49. Whittaker, R.H. Dominance and diversity in land plant communities. Science 1965, 147, 250–260. [Google Scholar] [CrossRef] [PubMed]
  50. Behera, S.K.; Misra, M.K. Floristic and structure of the herbaceous vegetation of four recovering forest stands in the Eastern Ghats of India. Biodivers. Conserv. 2006, 15, 2263–2285. [Google Scholar] [CrossRef]
  51. Tripathi, O.P.; Pandey, H.N.; Tripathi, R.S. Distribution, community characteristic and tree population structure of subtropical pine forest of Meghalaya, northeast India. Int. J. Ecol. Environ. Sci. 2004, 30, 207–214. [Google Scholar]
  52. Singhal, R.M.; Soni, S. Quantitative ecological analysis of some woody species of Mussoorie Himalayas. Indian For. 1989, 115, 327–336. [Google Scholar]
  53. Bilotta, G.S.; Brazier, R.E.; Haygarth, P.M. The impacts of grazing animals on the quality of soils, vegetation, and surface waters in intensively managed grasslands. Adv. Agron. 2007, 94, 237–250. [Google Scholar]
  54. Mekuria, W.; Veldkamp, E.; Haile, M.; Nyssen, J.; Muys, B.; Gebrehiwot, K. Effectiveness of exclosures to restore degraded soils as a result of overgrazing in Tigray, Ethiopia. J. Arid Environ. 2007, 69, 270–284. [Google Scholar] [CrossRef]
  55. Belsky, A.J.; Amundson, R.G.; Duxbury, J.M.; Riha, S.J.; Ali, A.R.; Mwonga, S.M. The effects of trees on their physical, chemical, and biological environment in a semi-arid savanna in Kenya. J. Appl. Ecol. 1989, 26, 1005–1024. [Google Scholar] [CrossRef]
  56. Treydte, A.C.; Looringh van Beeck, F.; Ludwig, F.; Heitkönig, I.M.A. Improved beneath-crown grass quality in South African savannas varying locally and over seasons. J. Veg. Sci. 2008, 19, 663–670. [Google Scholar] [CrossRef]
  57. Richter, C.G.F.; Snyman, H.A.; Smit, G.N. The influence of tree density on the grass layer of three semiarid savanna types of Southern Africa. Afr. J. Range Forage Sci. 2001, 18, 103–109. [Google Scholar] [CrossRef]
  58. Reeder, J.D.; Schuman, G.E. Influence of livestock grazing on C sequestration in semi-arid mixed-grass and short-grass rangelands. Environ. Pollut. 2002, 116, 457–463. [Google Scholar] [CrossRef]
  59. Han, G.; Hao, X.; Zhao, M.; Wang, M.; Ellert, B.H.; Willms, W.; Wang, M. Effect of grazing intensity on carbon and nitrogen in soil and vegetation in a meadow steppe in Inner Mongolia. Agric. Ecosyst. Environ. 2008, 125, 21–32. [Google Scholar] [CrossRef]
  60. Tefera, S.; Snyman, H.A.; Smit, G.N. Rangeland dynamics in southern Ethiopia: (1) Botanical composition of grasses and soil characteristics in relation to land-use and distance from water in semi-arid Borana rangelands. J. Environ. Manag. 2007, 85, 429–444. [Google Scholar] [CrossRef] [PubMed]
  61. Murage, E.W.; Karanja, N.K.; Smithson, P.C.; Woomer, P.L. Diagnostic indicator of soil quality in productive and non-productive smallholders’ fields of Kenya’s Central Highlands. Agric. Ecosyst. Environ. 2000, 79, 1–8. [Google Scholar] [CrossRef]
  62. Du Preez, C.C.; Snyman, H.A. Organic matter content of a soil in a semi-arid climate with long-standing veld conditions. Afr. J. Range Forage Sci. 1993, 19, 108–110. [Google Scholar] [CrossRef]
  63. Yates, C.J.; Norton, D.A.; Hobbs, R.J. Grazing effect on plant cover, soil in fragmented woodlands in southern-western Australia: Implications for restoration. Austral Ecol. 2000, 25, 36–47. [Google Scholar] [CrossRef]
  64. Wang, J.; Fu, B.; Qiu, Y.; Chen, L. Soil nutrients in relation to land-use and landscape position in the semi-arid small catchments on the Loess Plateau in China. J. Arid Environ. 2001, 48, 537–555. [Google Scholar] [CrossRef]
Figure 1. Map of Harishin Rangeland study site, Somali Regional State, Ethiopia.
Land 06 00004 g001
Figure 2. Principal component analysis correlation (% variance) diagram based on vegetation and soil physico-chemical attributes in Harishin rangelands of Ethiopia (open grazing area = filled plus shape; enclosure areas = dot shape ): (a) Vegetation attributes (hd = herbs diversity; hr = herbs richness; hb= herbs biomass; hc = herbs basal cover; wd = woody diversity; wr = woody richness; and wc = woody canopy cover); (b) Soil physico-chemical attributes (N = Nitrogen; P = Phosphorous; K = Potassium; SOM = Soil organic matter; SOC = Soil organic carbon; EC = Electric conductivity; BD= bulk density).
Land 06 00004 g002
Figure 3. Rarefaction curves of cumulative increase of vegetation species richness (Mean ± SD) at 95% confidence for both of the enclosure and open grazing management practices in Harishin rangelands, Ethiopia: (a) Herbaceous species richness; (b) Woody species richness.
Land 06 00004 g003
Figure 4. Herbaceous vegetation dominance–diversity curve based on IVI in Harishin rangelands of Ethiopia: (a) Communal open grazing areas; (b) Traditional private enclosure areas.
Land 06 00004 g004
Table 1. Herbaceous species distribution in open grazing areas of Harishin rangelands, eastern Ethiopia.
Species Scientific NameAbundanceDensityFrequencyA/FIVI
High Dominance Herbs
Eragorostis aspera67.7039.4958.331.1675.29
Eragrostis cilianensis43.3114.4433.331.3036.11
Cynodon dactylon9.775.7058.330.1715.82
Medium Dominance Herbs
Tragus racemosus7.833.9250.000.1612.30
Cenchurus ciliaris5.072.9658.330.0910.99
Panicum atrosanguineum4.892.4450.000.109.54
Tragus berteronianus3.901.9550.000.088.62
Hibiscus aponeurus4.972.0741.670.128.34
Eragrostis ciliaris8.642.1625.000.358.25
Crotalaria laburnifolia2.991.4950.000.067.76
Solanum incanum2.011.0150.000.046.85
Ocimum lamiifolium2.951.2341.670.076.63
Eragrostis superba7.081.1816.670.425.75
Chrysopogon aucheri4.811.2025.000.195.69
Solanum somalense2.560.8533.330.085.25
Dactyloctenium scindicum3.920.9825.000.165.09
Indigofera articulate5.920.9916.670.365.07
Aristida adscencionis3.780.9425.000.155.00
Heliotropium somalense1.830.6133.330.054.69
Gomphocarpus fruticosur5.000.8316.670.304.54
Sida sp.2.970.7425.000.124.46
Abutilon fruticasum4.250.7116.670.264.11
Heliotropium zeylonicum6.580.558.330.794.04
Ocimum urticifolium2.310.5825.000.094.02
Blepharis ciliaris1.670.4225.000.073.59
Sporobolus marginatus3.130.5216.670.193.46
Least Important Herbs
Aristida adoensis5.080.428.330.613.31
Balenites aegyptiaca5.080.428.330.613.31
Achyranthus aspera2.500.4216.670.153.10
Senna occidentalis0.440.1125.000.022.78
Eragrostis sp.3.750.318.330.452.66
Eragrostis schlueinfurthii3.580.308.330.432.58
Setaria verticillata3.500.298.330.422.54
Leucas microphylla0.670.1116.670.042.04
Parthenium hysterophrus2.420.208.330.292.01
Lactuca sativa1.830.158.330.221.72
Dactiloctenium aegyptium1.580.138.330.191.60
Eriachloa colonum0.580.058.330.071.11
A/F = abundance to frequency ratio; IVI = Importance Value Index.
Table 2. Herbaceous species distribution in enclosure areas of Harishin rangelands, eastern Ethiopia.
Species Scientific NameAbundanceDensityFrequencyA/FIVI
High Dominance Herbs
Cucumis ficiofolius0.830.078.330.1033.96
Eragorostis aspera10.142.5325.000.4133.75
Bothriochlea insulpta1.380.2316.670.0828.78
Chloris radiota4.351.4533.330.1317.29
Aristida adoensis22.331.868.332.6813.84
Medium Dominance Herbs
Dactyloctenium aegyptium22.331.868.332.6810.89
Ageratum conyzoides12.922.1516.670.777.42
Cynodon dactylon36.4124.2766.670.557.42
Leucas microphylla1.080.1816.670.067.4
Crotalaria albicaulis6.902.3033.330.216.8
Oxygonum atriplicifolium5.500.468.330.666.76
Enteropogon elegans1.000.088.330.126.62
Commicarpus verticillatus4.080.348.330.496.42
Flaveria terinervia0.670.068.330.086.27
Achyranthus aspera1.380.2316.670.086.21
Panicum atrosanguineum5.382.2441.670.135.67
Indigofera articulate2.830.248.330.345.4
Sonchus oleraceus1.080.098.330.135.3
Parthenium hysterophorus7.081.1816.670.435.15
Cenchurus ciliaris23.6319.6983.330.285.14
Tagetes minuta0.670.068.330.085.1
Panicum sp.16.501.388.331.984.08
Setaria acromelaena1.330.2216.670.084
Heliotropium somalense9.332.3325.000.373.68
Aristida adscencionis26.816.7025.001.073.64
Tephrosia emeroides6.641.6625.000.273.24
Crotalaria natalitia2.670.228.330.323.18
Ocimum lamiifolium3.151.8458.330.052.98
Setaria verticillata4.111.0325.000.162.63
Eragrostis cilianensis72.7218.1825.002.912.46
Ocimum urficifolium4.080.6816.670.252.39
Blepharis ciliaris0.880.1516.670.051.99
Verbesina encelioides0.500.048.330.061.99
Senna occidentalis1.210.2016.670.071.97
Chrysopogon aucheri14.769.8466.670.221.96
Hibiscus aspera2.580.228.330.311.96
Senna obtusifolia2.500.218.330.301.92
Launea intyybacea2.420.208.330.291.88
Abutilon fruticasum3.580.308.330.431.81
Asparagus asiaticus3.280.8225.000.131.8
Hypoestes forskafii2.330.198.330.281.59
Crotalaria laburnifolia7.672.5633.330.231.54
Hibiscus aponeurus6.001.0016.670.361.51
Least Important Herbs
Sansevieria abyssinica14.751.238.331.771.49
Sansevieria sp.2.500.218.330.301.49
Lactuca sativa7.331.8325.000.291.46
Hibiscus trionum4.080.348.330.491.44
Tephrosia interrupta4.790.8016.670.291.44
Sida sp.0.940.2425.000.041.06
Dactyloctenium scindicum10.145.0750.000.201.04
Tragus berteronionus2.330.198.330.281.04
Crotolaria radiota8.170.688.330.980.99
Eragrostis sp.5.750.488.330.690.94
Sporobolus marginatus2.821.1741.670.070.94
Tragus racemosus1.000.088.330.120.89
A/F = abundance to frequency ratio; IVI = Importance Value Index.
Table 3. Woody species distribution in open grazing areas of Harishin rangelands eastern Ethiopia.
Species Scientific NameAbundanceDensityFrequencyA/FIVI
Acacia busie8.1112.67750.1158.13
Acacia nilotica7.829.83750.151.23
Acacia etbica11.19.4258.330.1949.62
Acacia toritilis271.08251.0839.55
Acacia melifera3.696.558.330.0634.48
Acacia abyssinica22.441250.934.2
Acacia oerfota7.380.2516.670.4413.26
Balenites aegyptiaca0.191.58250.0110.41
Securinega virosa0.760.75250.039.13
A/F = abundance to frequency ratio; IVI = Importance Value Index.
Table 4. Woody species distribution in enclosure areas of Harishin rangelands, eastern Ethiopia.
Species Scientific NameAbundanceDensityFrequencyA/FIVI
Acacia nilotica10.1910.171000.194.44
Acacia etbica8.4512.7566.670.1388.06
Acacia bussei13.192.5858.330.2362.39
Acacia melifera3.581.1733.330.1124.22
Securinega virosa0.761.4216.670.0512.33
Acacia nubica1.310.3316.670.089.99
Grewia ferruginea0.760.3316.670.058.56
A/F = abundance to frequency ratio; IVI = Importance Value Index.
Table 5. Vegetation attributes (mean ± standard error) of enclosures and open-access communal grazing areas in Harishin rangelands, Ethiopia.
VariableEnclosureOpenTSig.2 Tailed
Herbs Diversity (Exp. (H’))6.55 + 0.544.51 + 0.752.20.038
Woody Diversity (Exp. (H’))2.39 + 0.263.17 + 0.26−2.420.047
Herbs Biomass (g/m2)383.61 + 24.68167.9984 + 12.267.830.000
Herbs Basal cover (%)85.70 + 1.6931.49 + 2.7017.000.000
Woody basal cover (/400 m2 )13.42 + 5.7631.23 + 4.192.490.020
H’ = Shannon-Weiner function
Table 6. Soil physico-chemical attributes (mean ± standard error) of enclosures and open access communal grazing areas in Harishin rangelands, Ethiopia.
VariableEnclosureOpenTSig.2 Tailed
Total N (Ppm)0.10 ± 0.010.16 ± 0.04−1.270.23
P mg/kg4.55 ± 0.836.93 ± 0.90−1.950.80
K2.09 ± 0.111.67 ± 0.043.490.006
PH7.43 ± 0.017.65 ± 0.01−3.570.005
SOM %2.46 ±0.11.58 ± 0.135.310.000
SOC %2.46 ± 0.101.00 ± 0.122.260.047
EC (mmhos/cm)0.16 ± 0.010.35 ± 0.09−2.030.063
Bulk density1.20 ± 0.031.2 ± 0.010.120.93
Clay %16.32 ± 1.5416.91 ± 1.23−0.290.777
Sand %47.63 ± 1.7346.93 ± 0.630.380.761
Silt %34.67 ± 0.8036.67 ± 0.71−1.830.092
N = Nitrogen; P = Phosphorous; K = Potassium; SOM = Soil organic matter; SOC = Soil organic carbon; EC = Electrical conductivity.

