
Landscape-Scale Disturbance: Insights into the Complexity of Catchment Hydrology in the Mountaintop Removal Mining Region of the Eastern United States

Abstract
:1. Introduction
Overview of Coal Mining and Hydrology
2. Methods
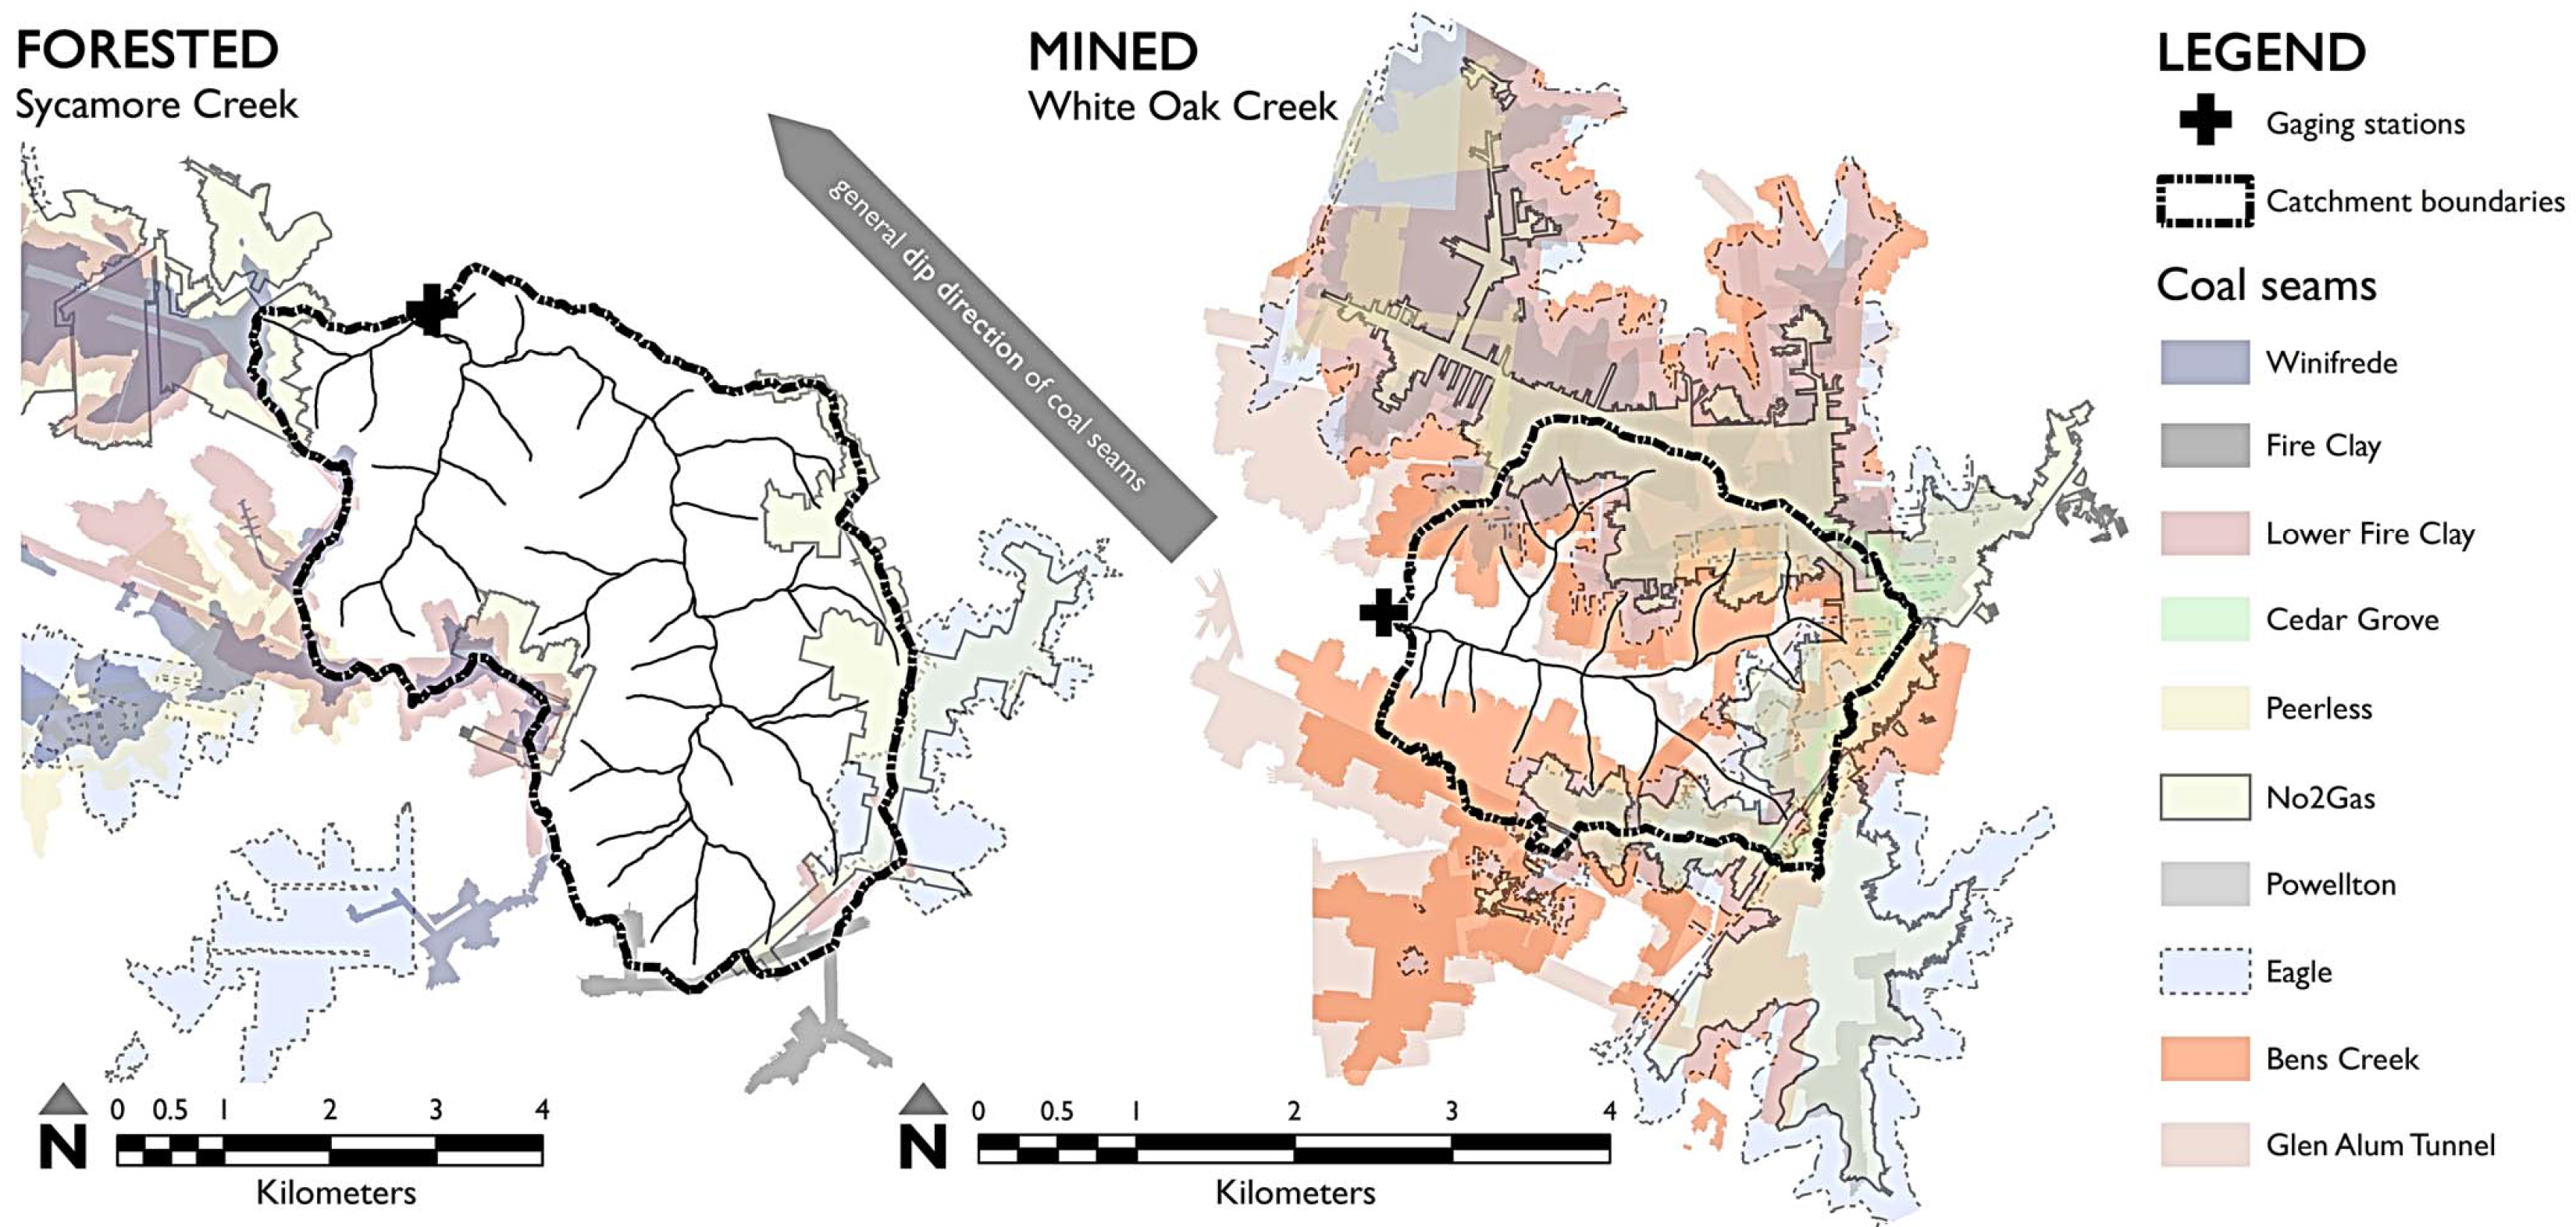
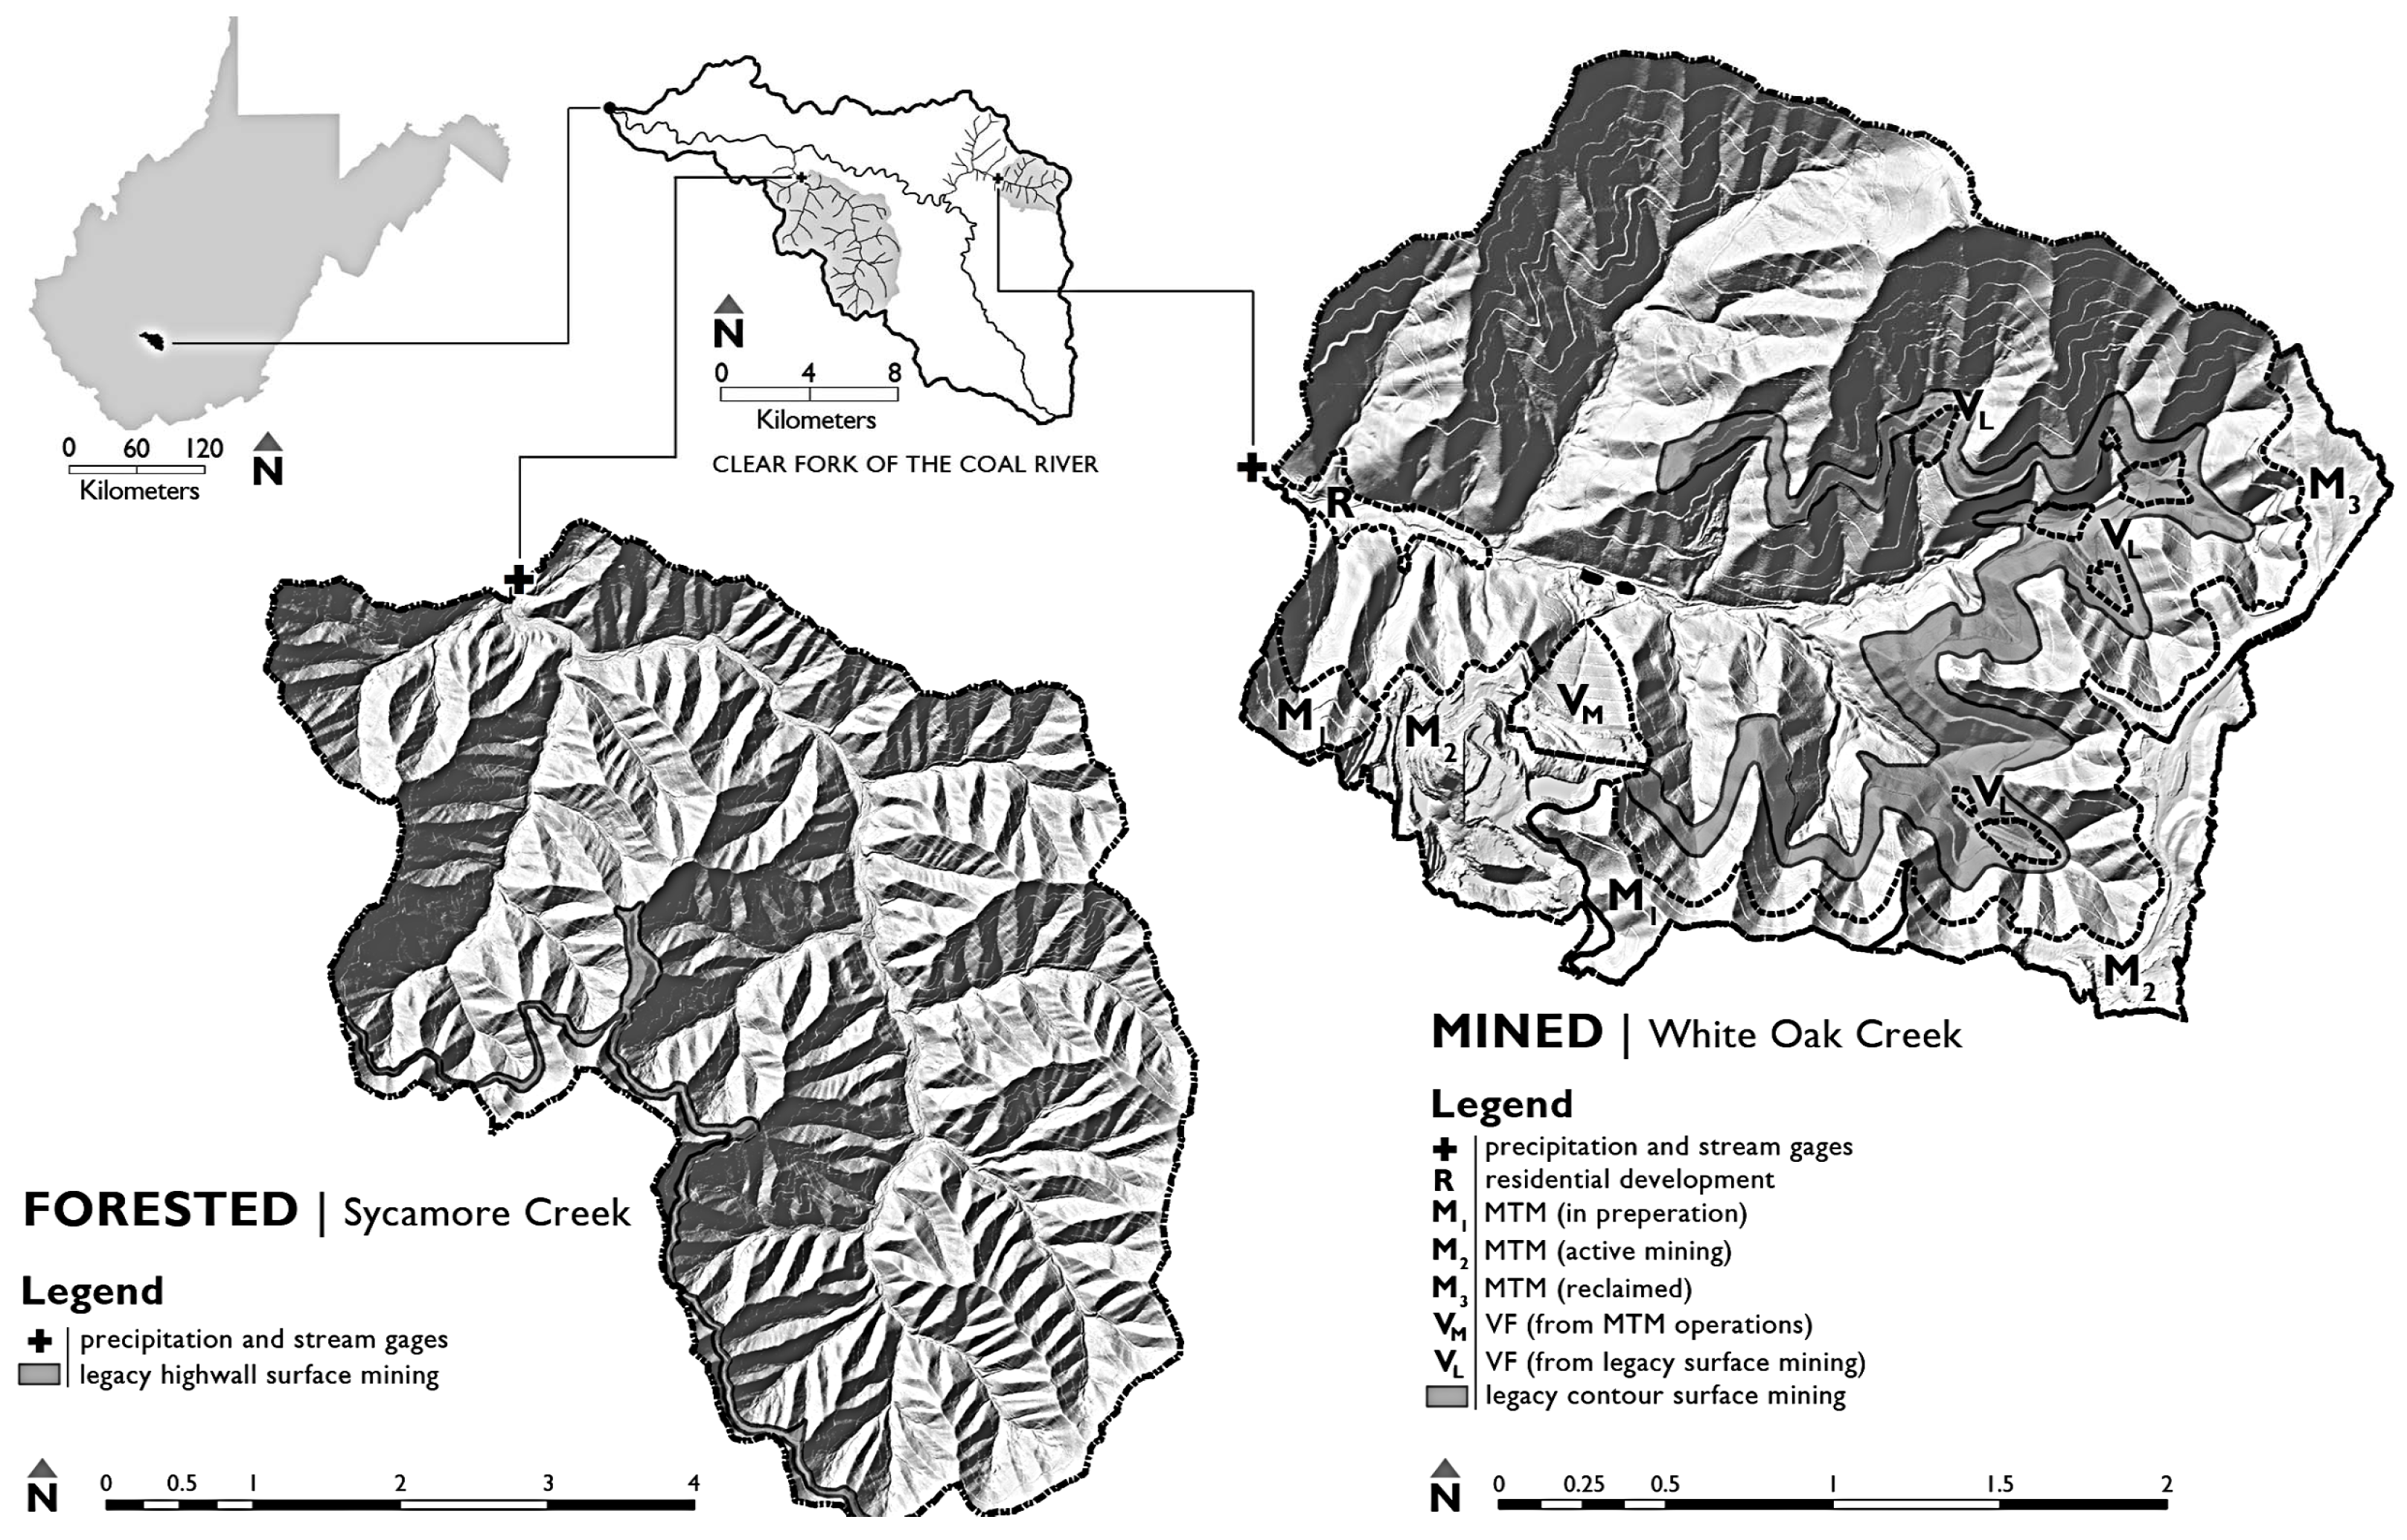
2.1. Study Area
2.2. Instrumentation, Data Collection and Analyses
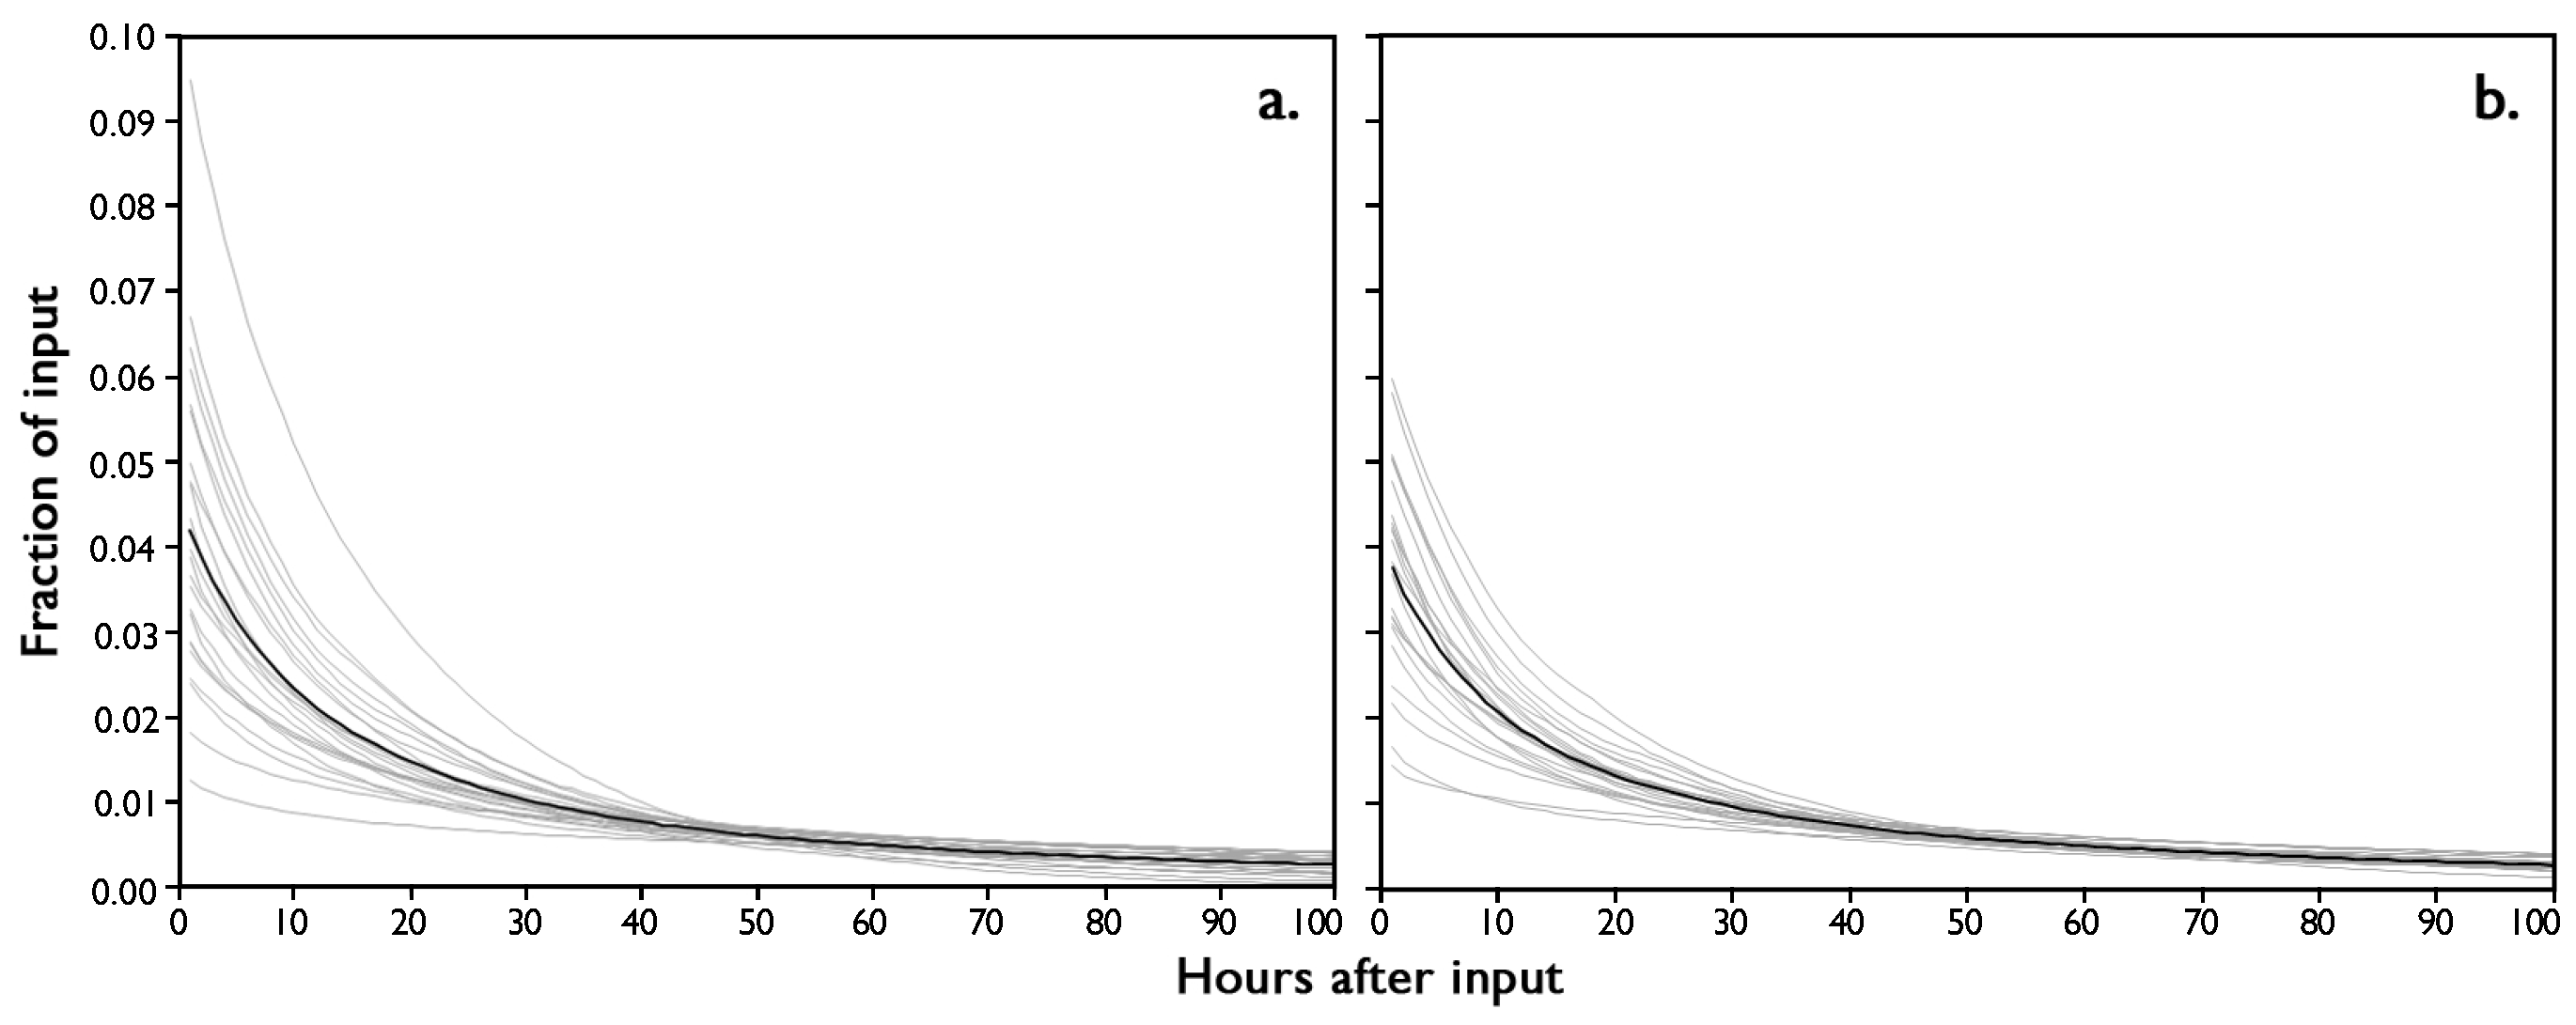
2.3. Hydrograph Separation and Response Time Modeling
3. Results
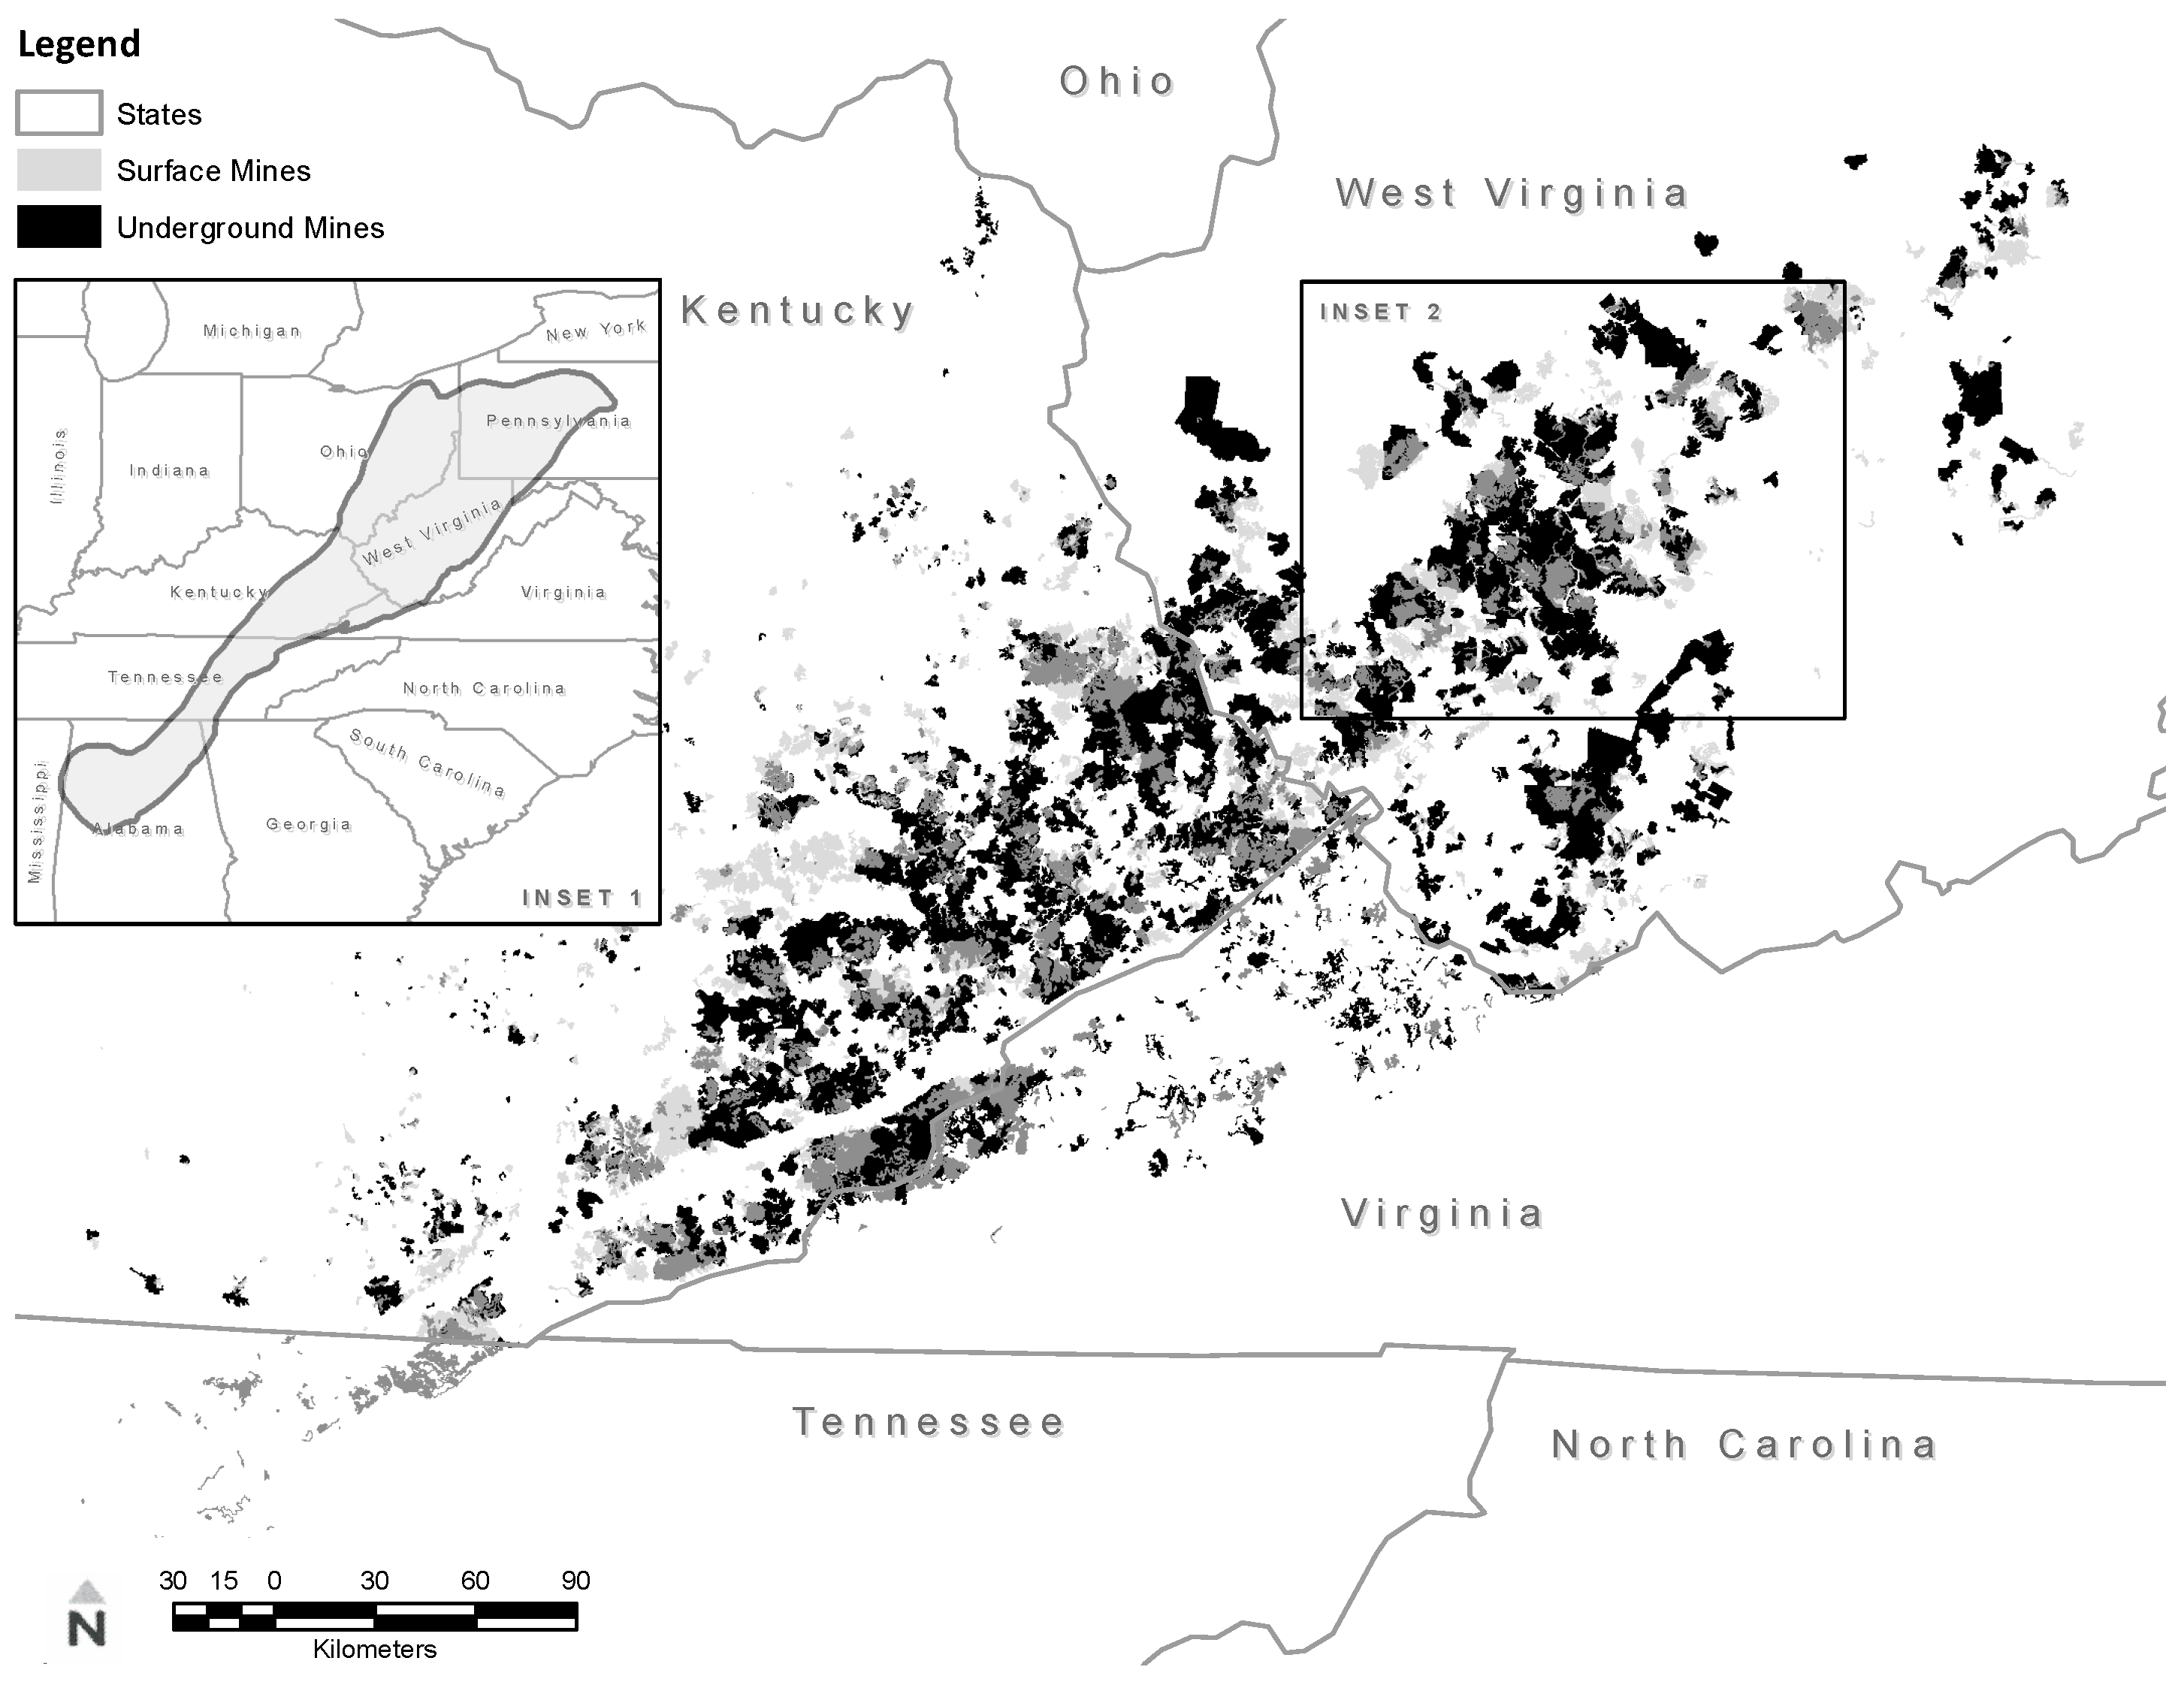
3.1. Extent of Underground Mining
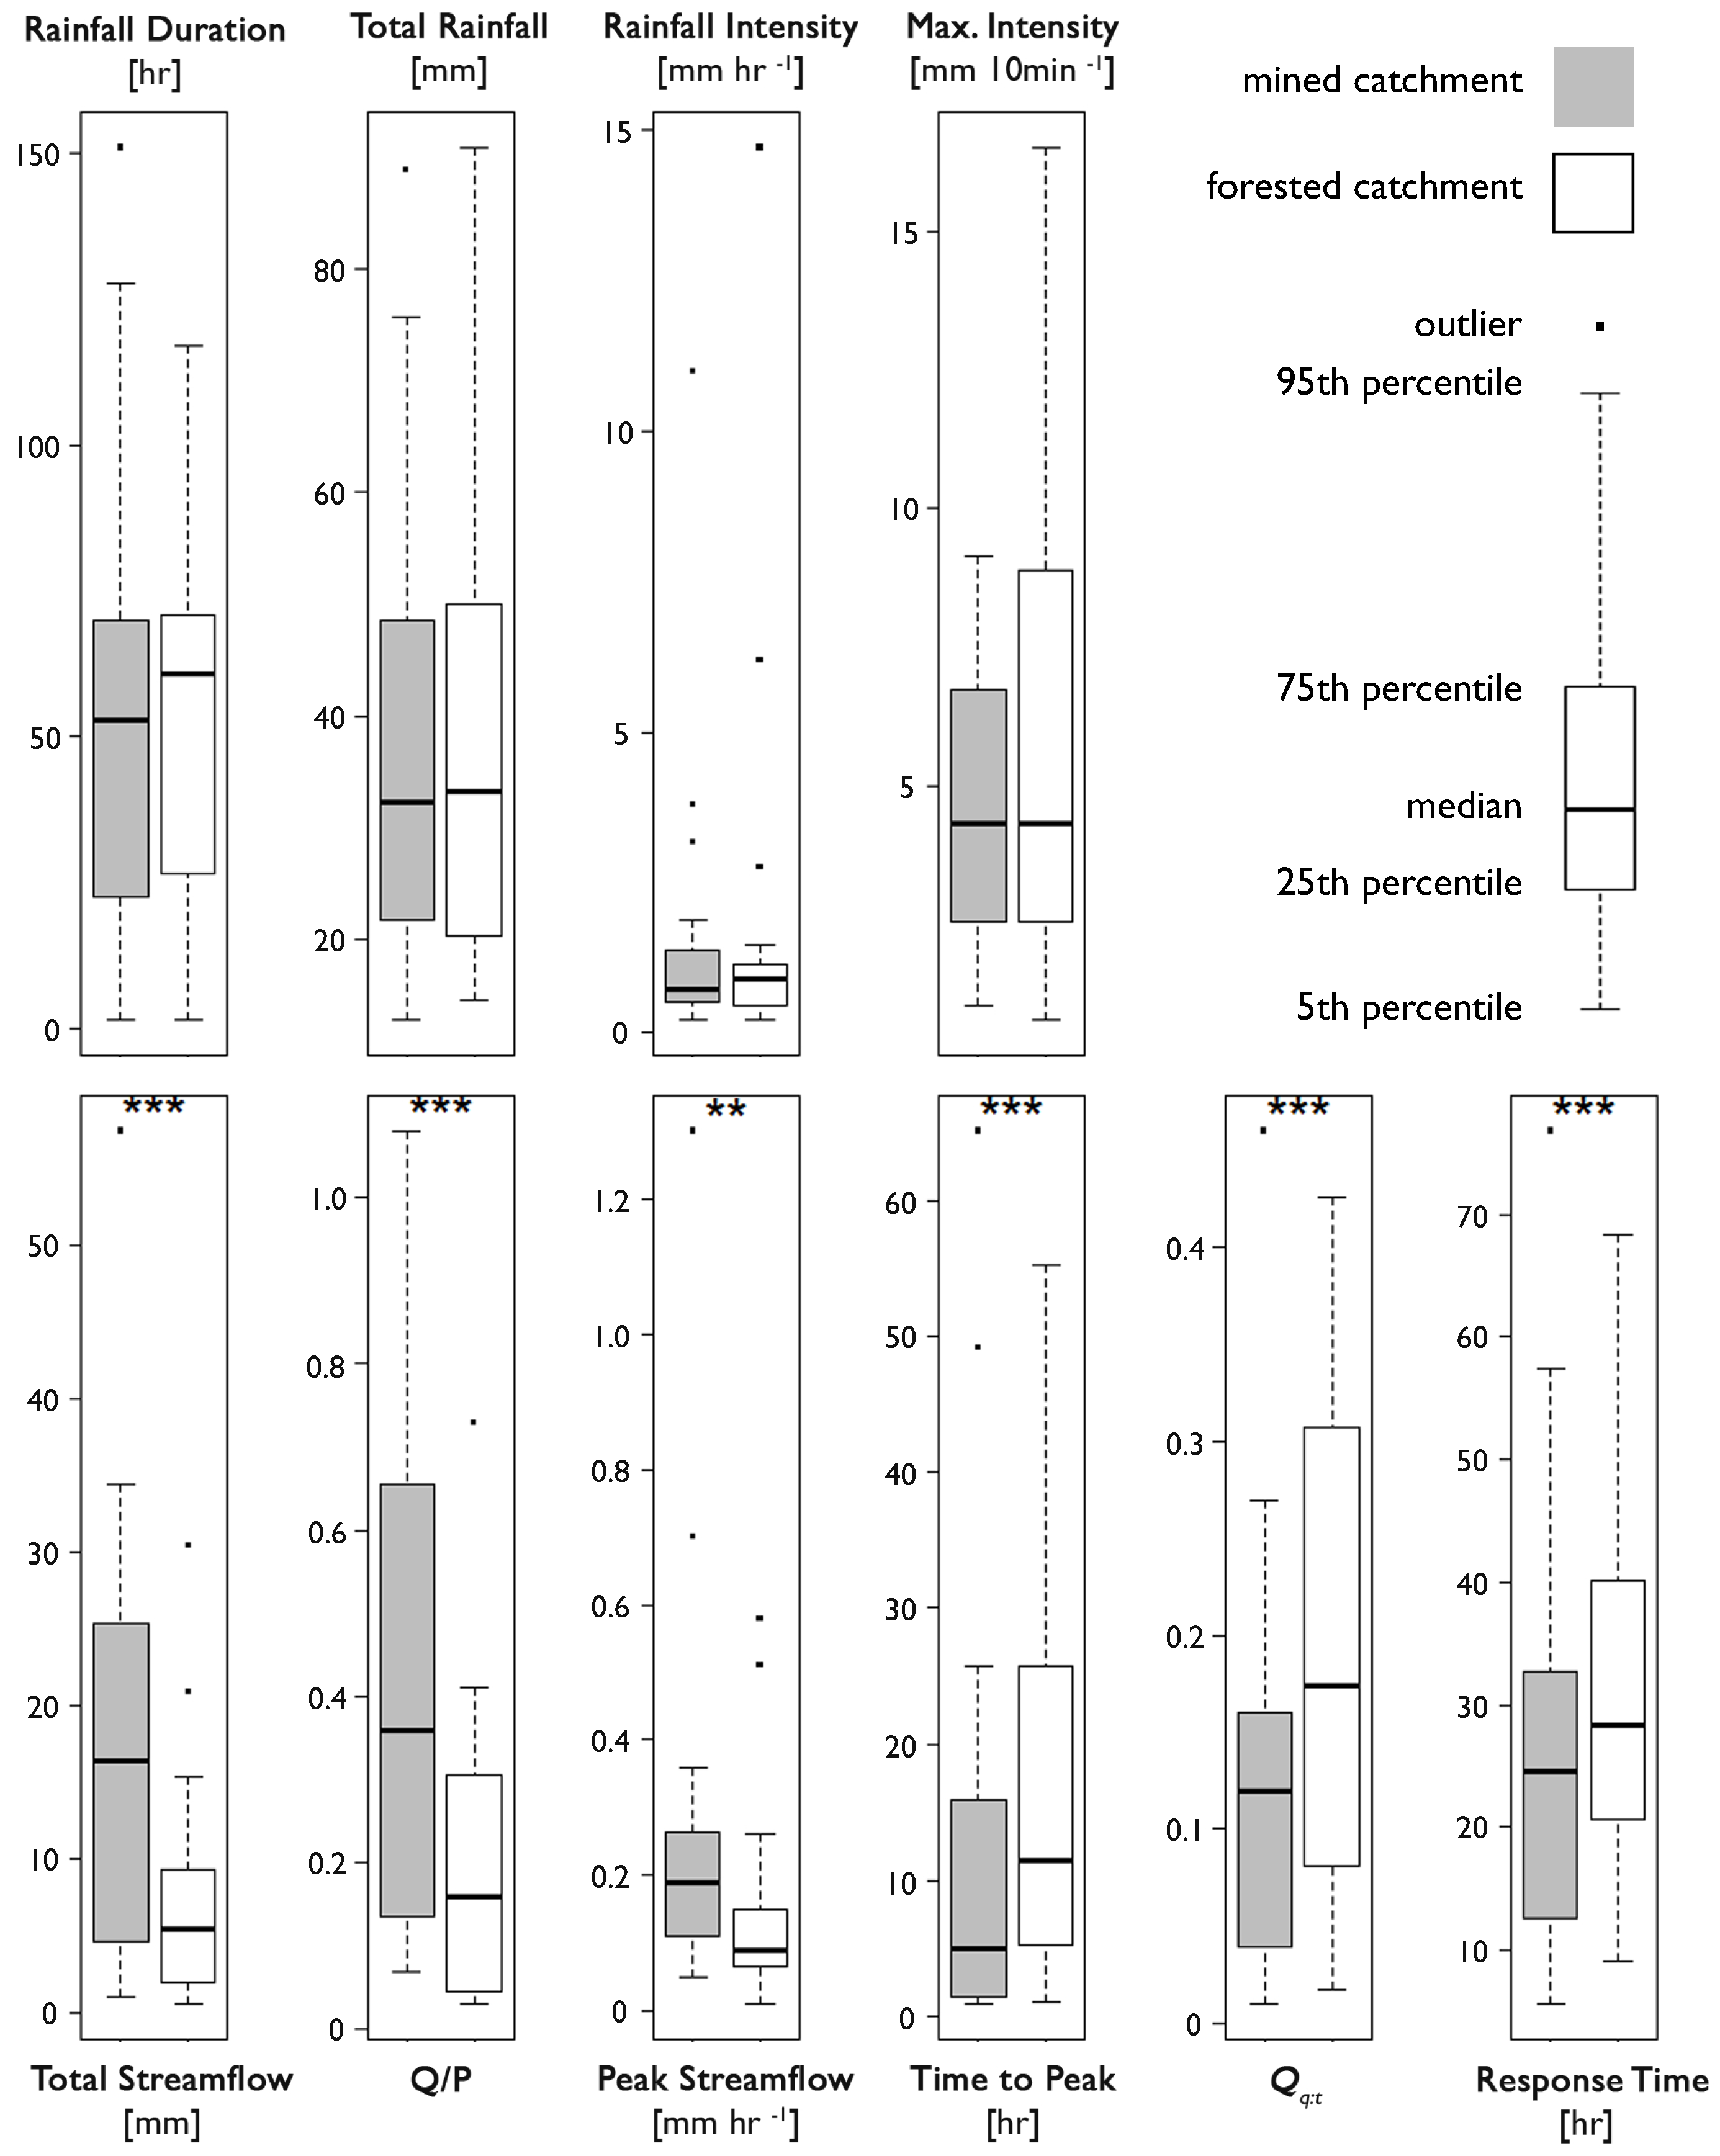
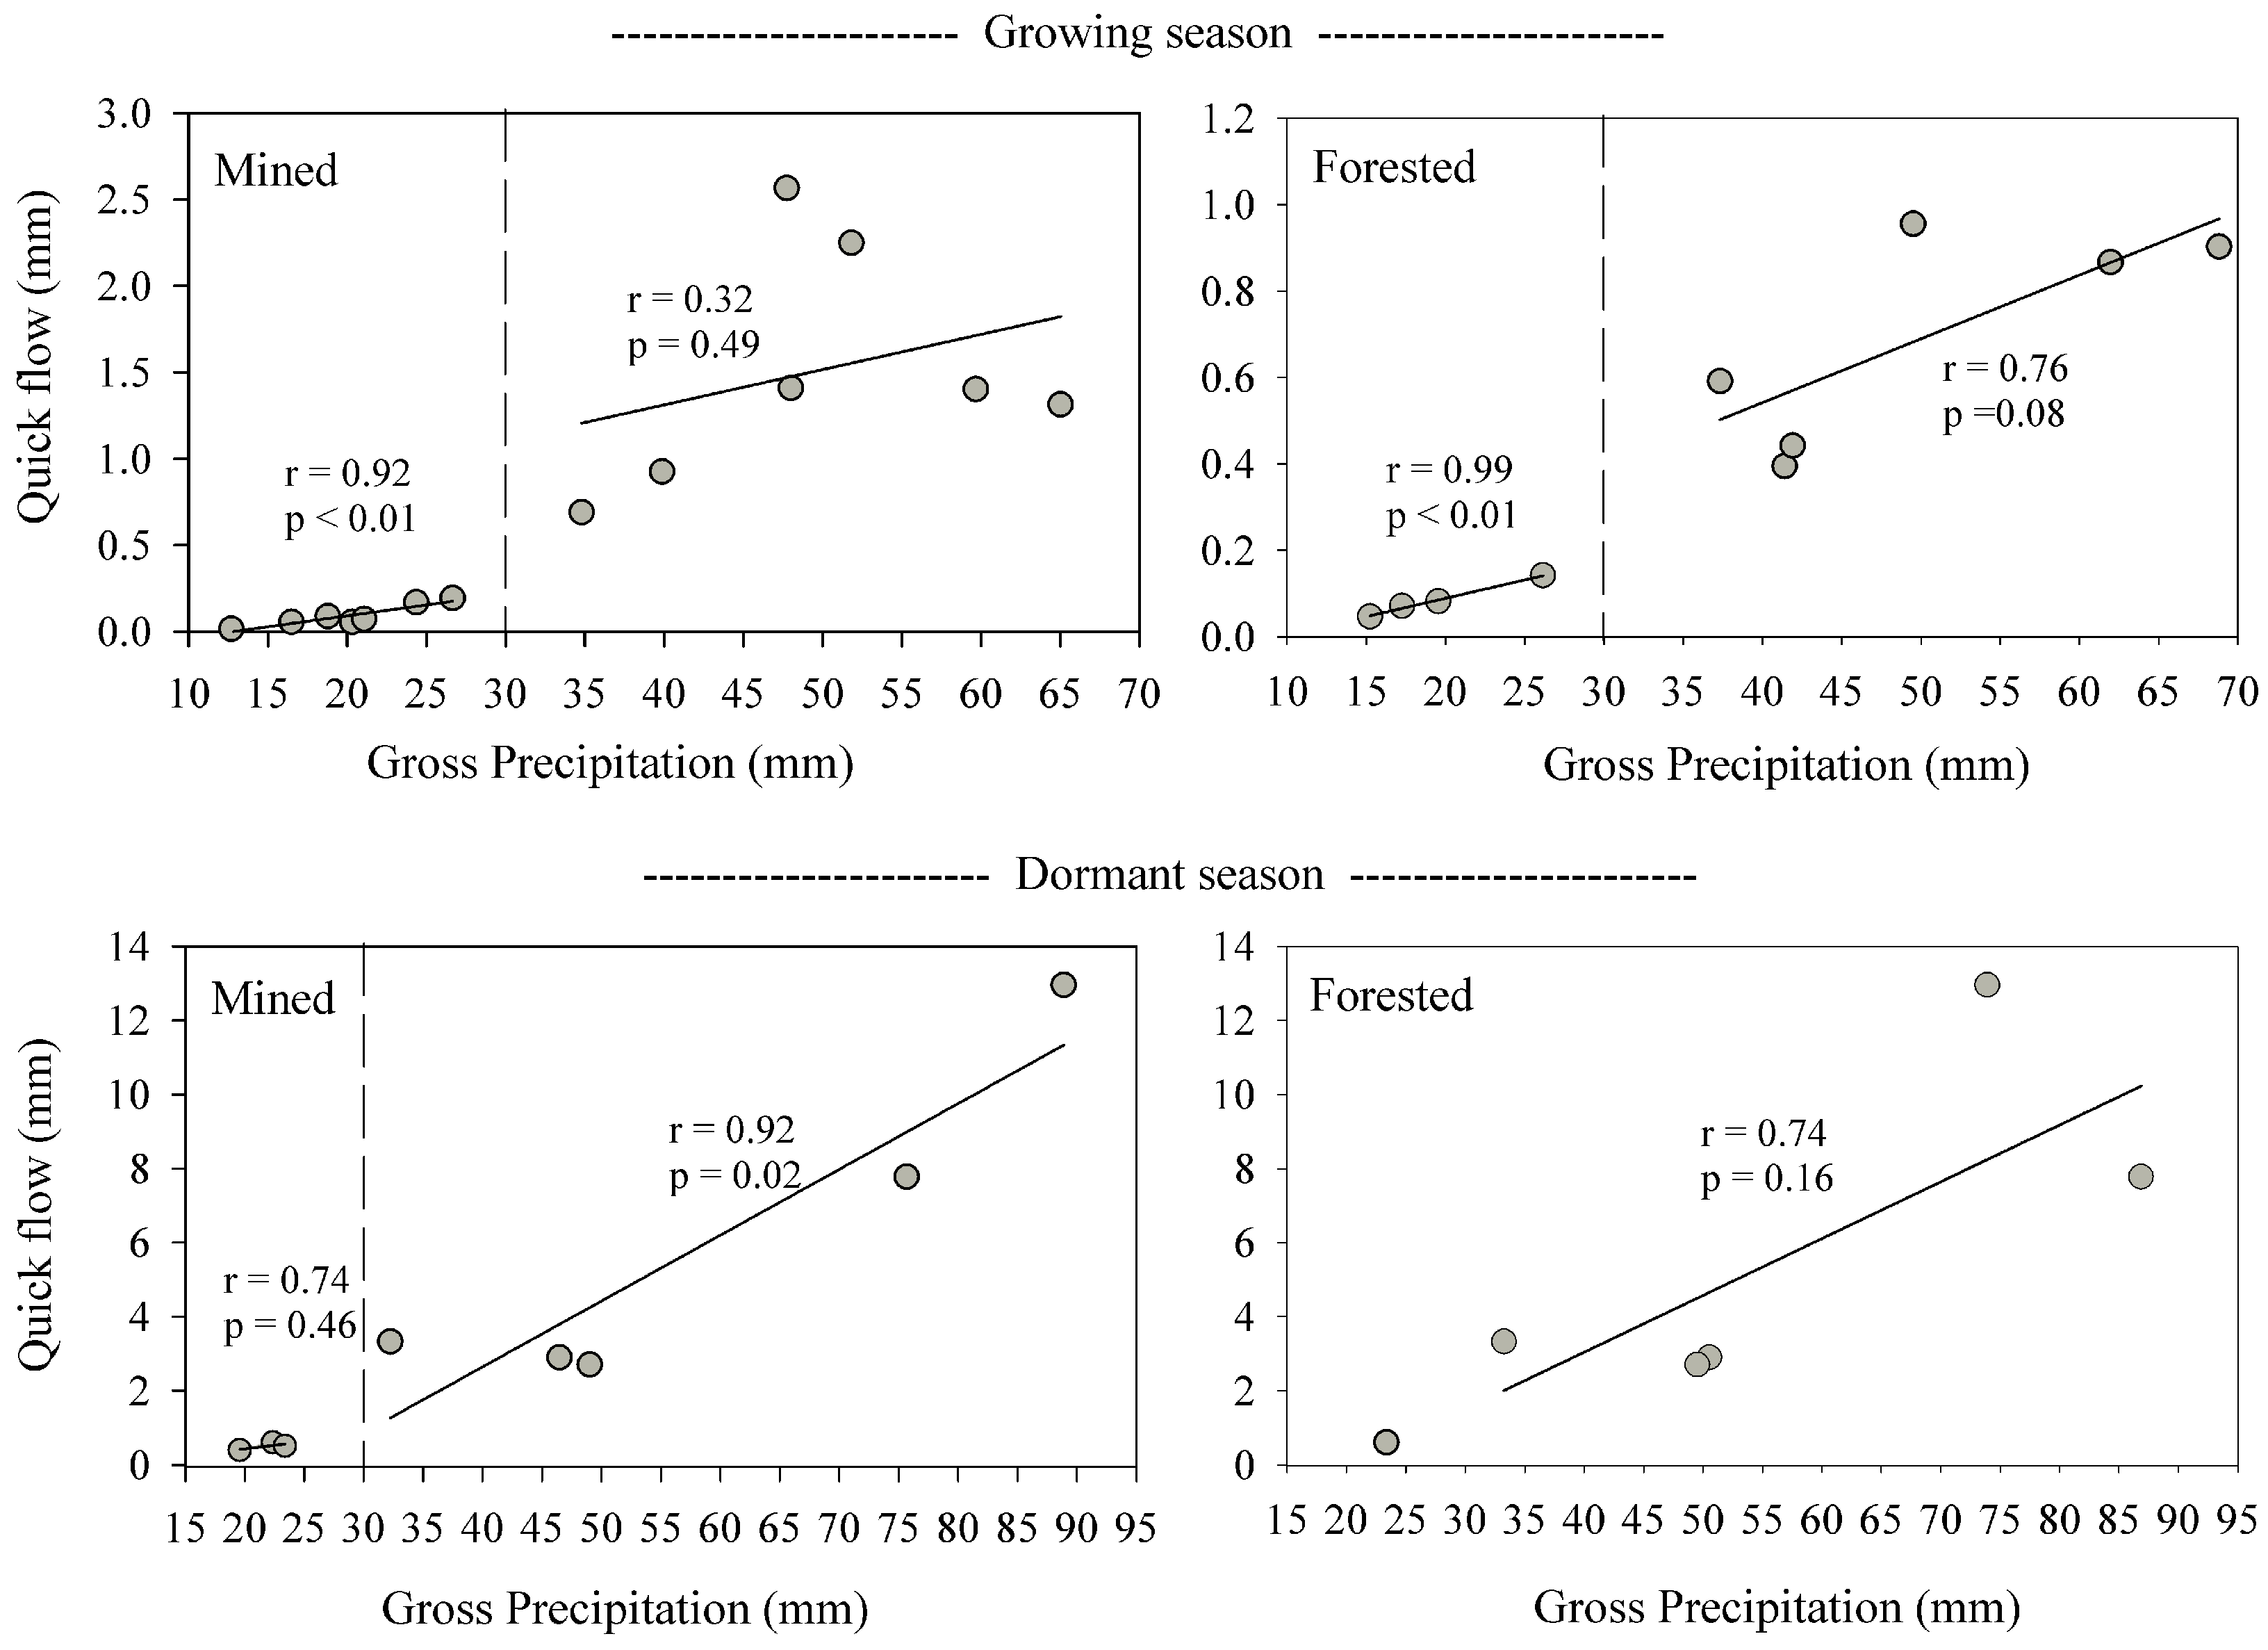
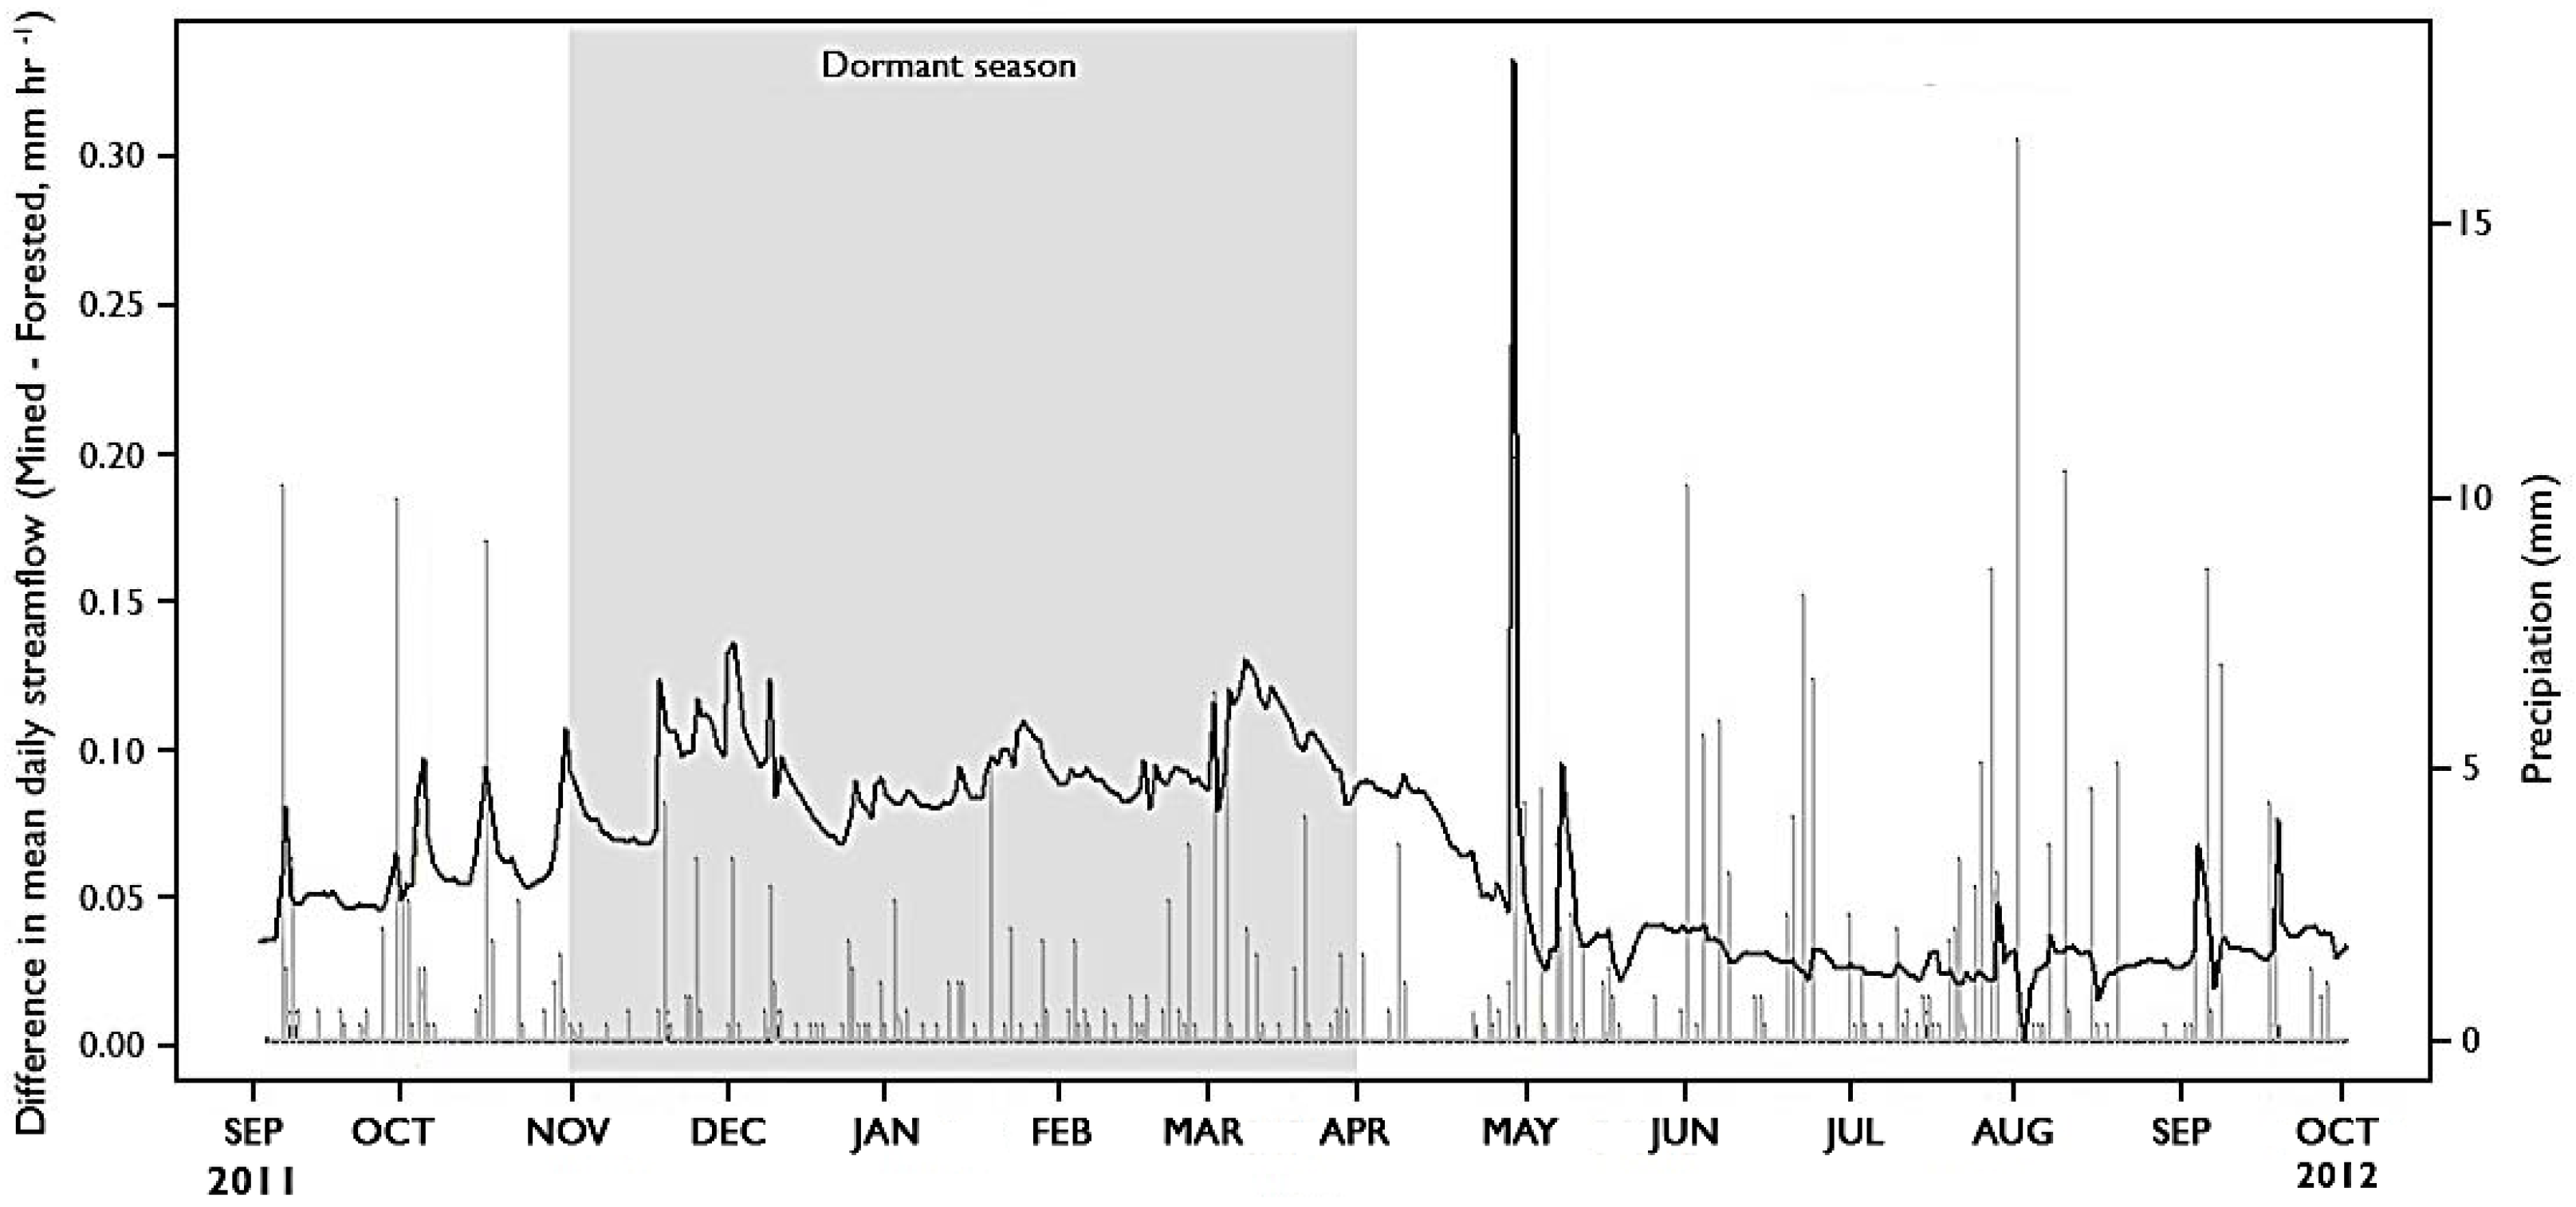
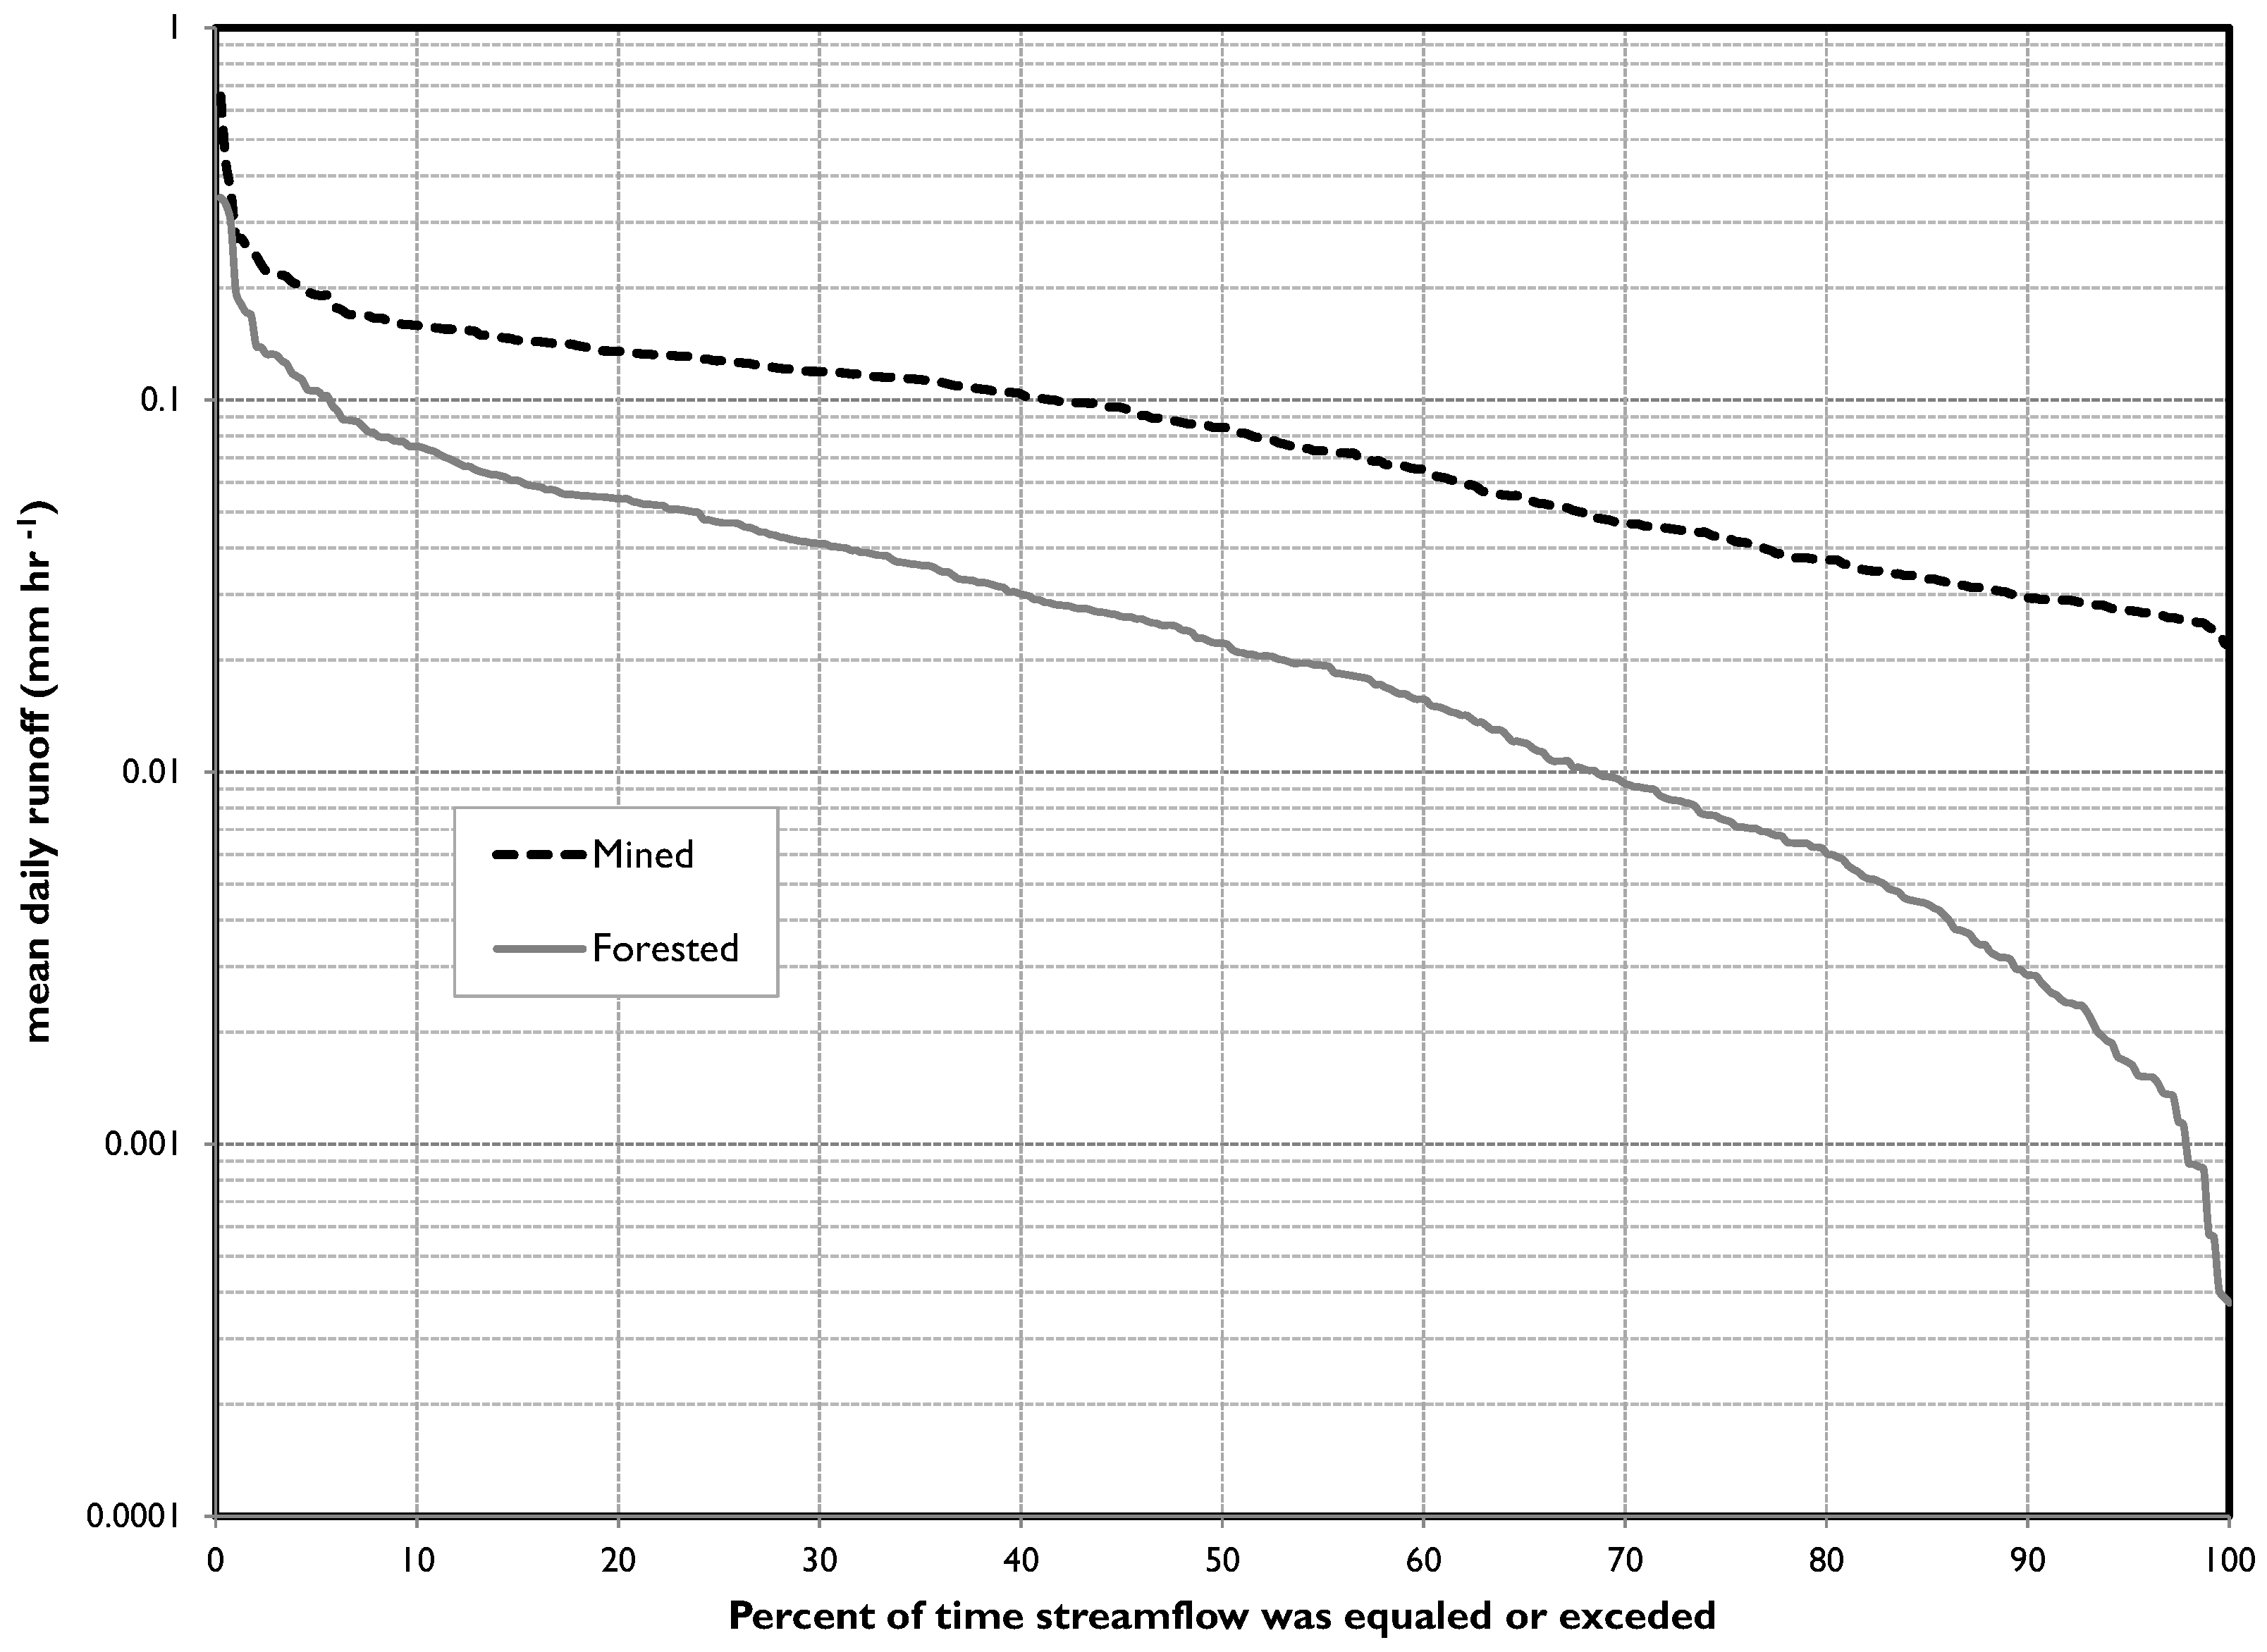
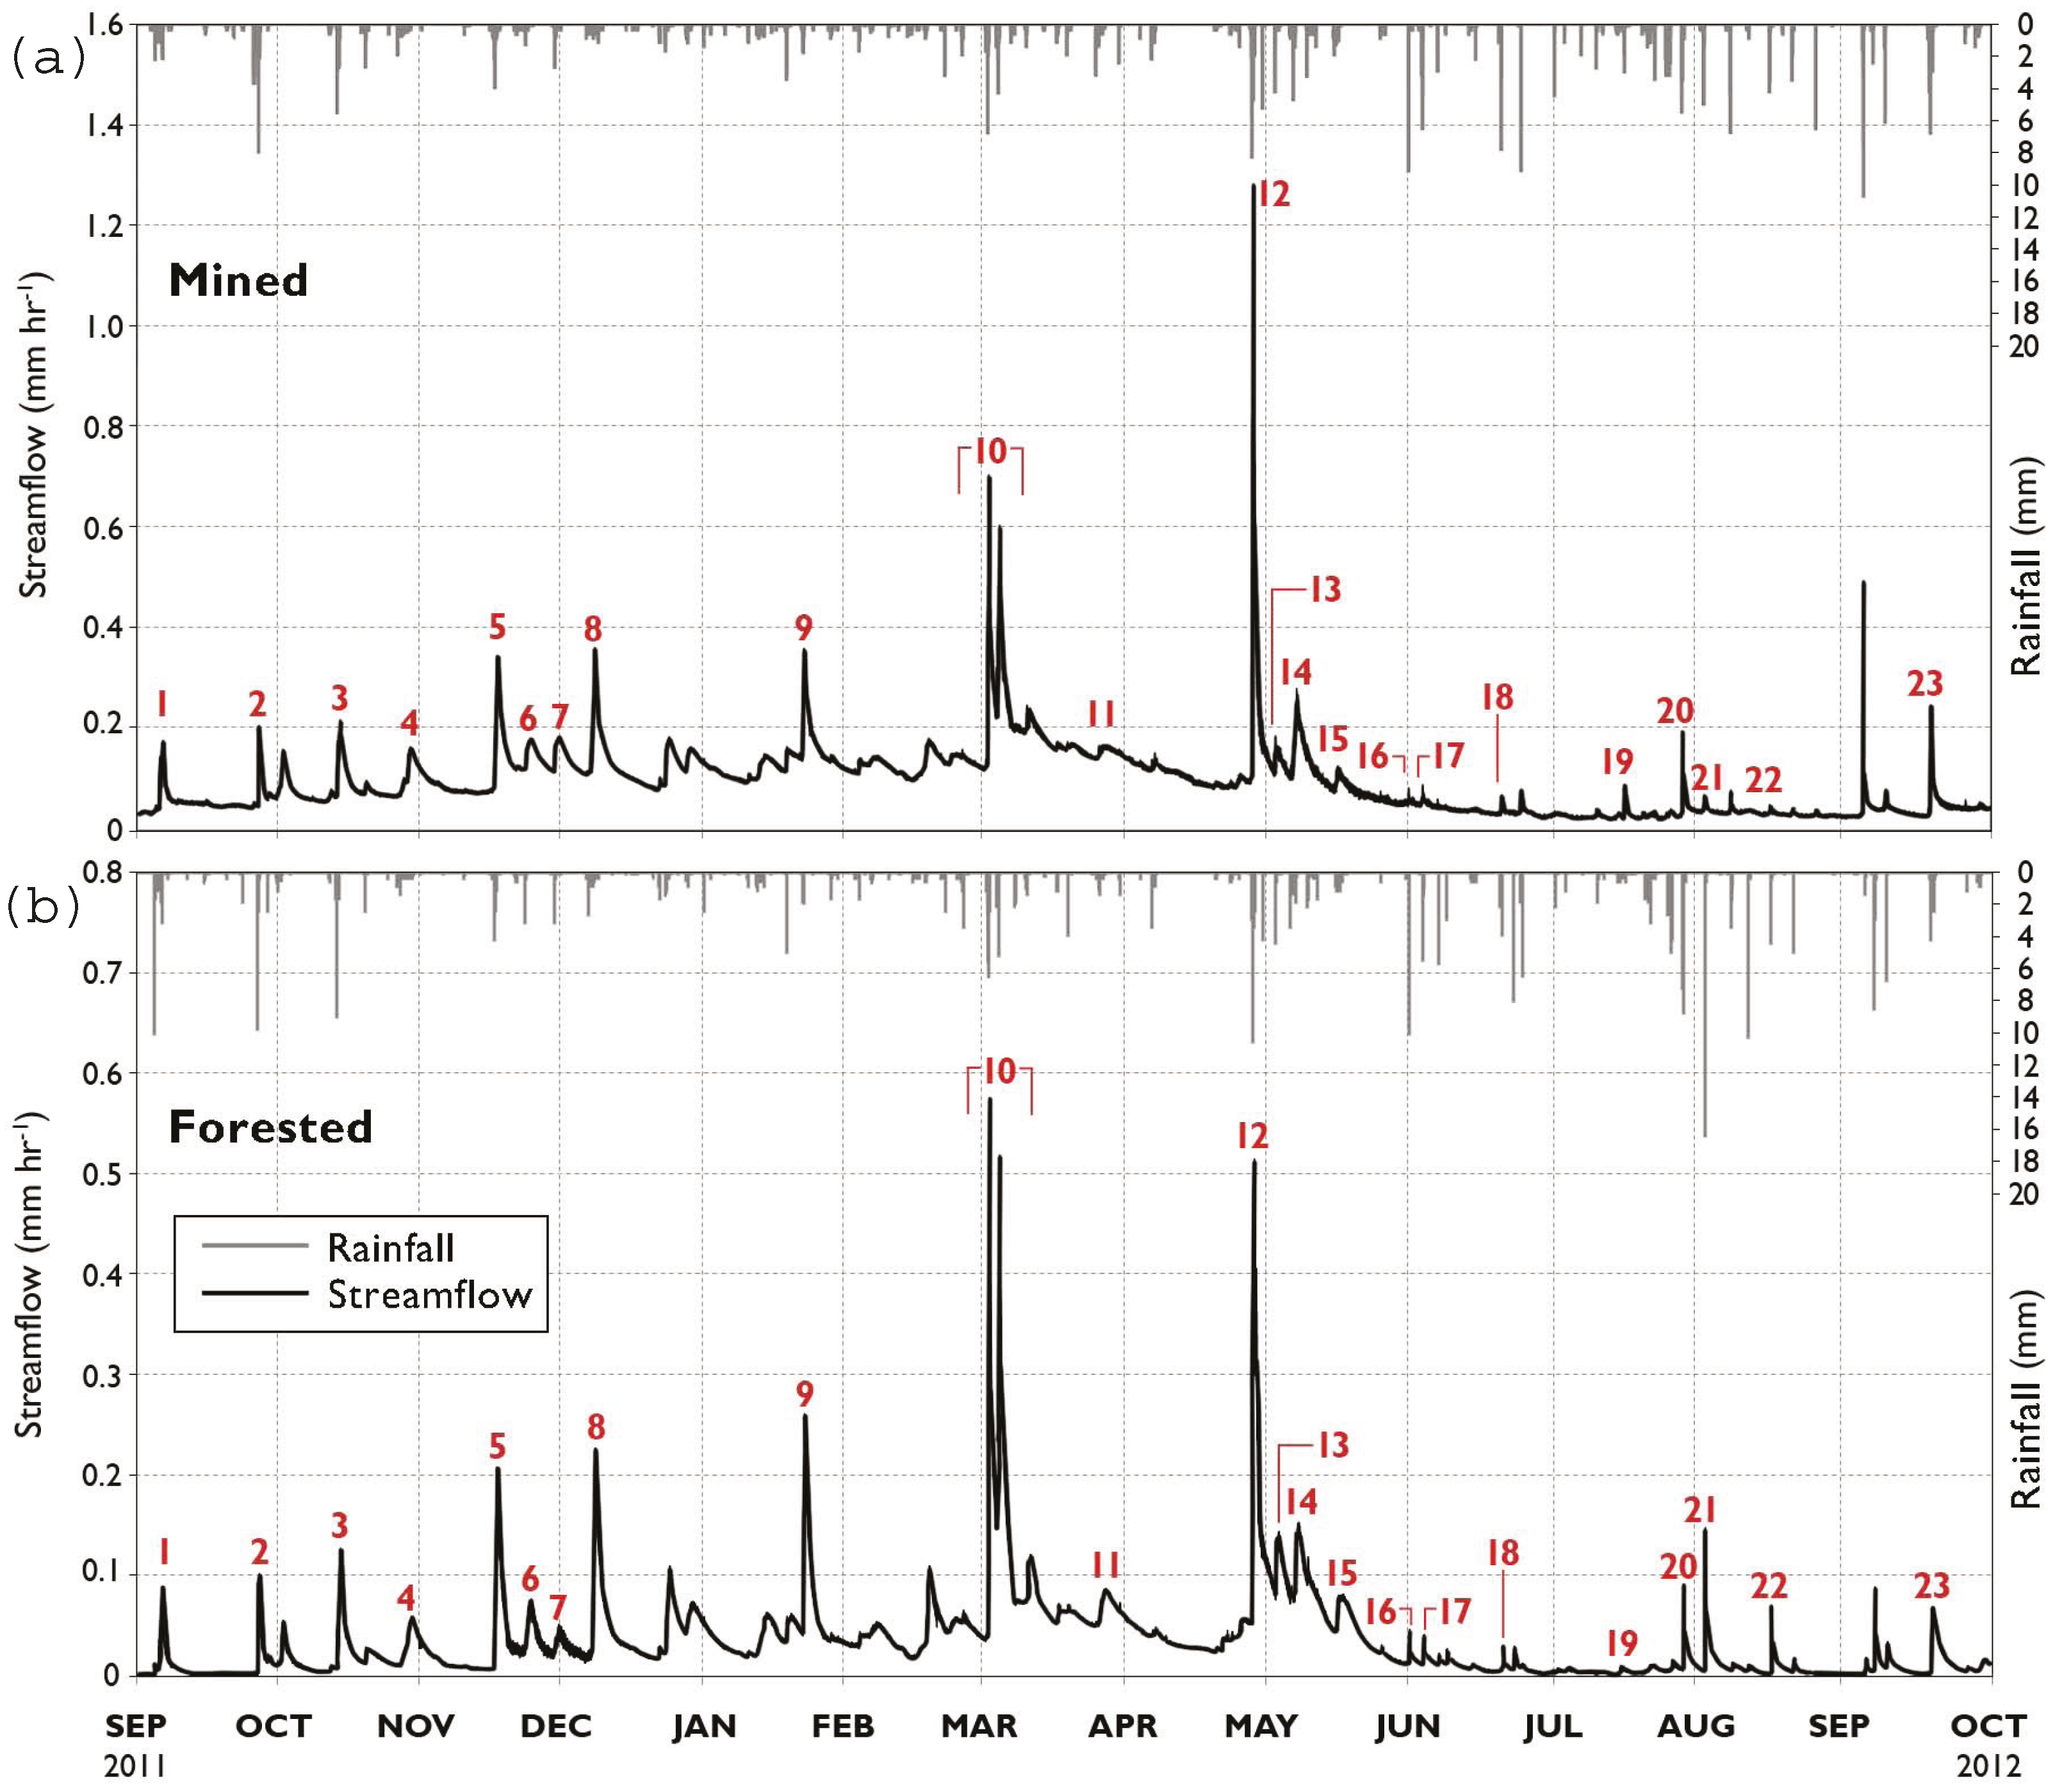
3.2. Rainfall-Runoff Relationships
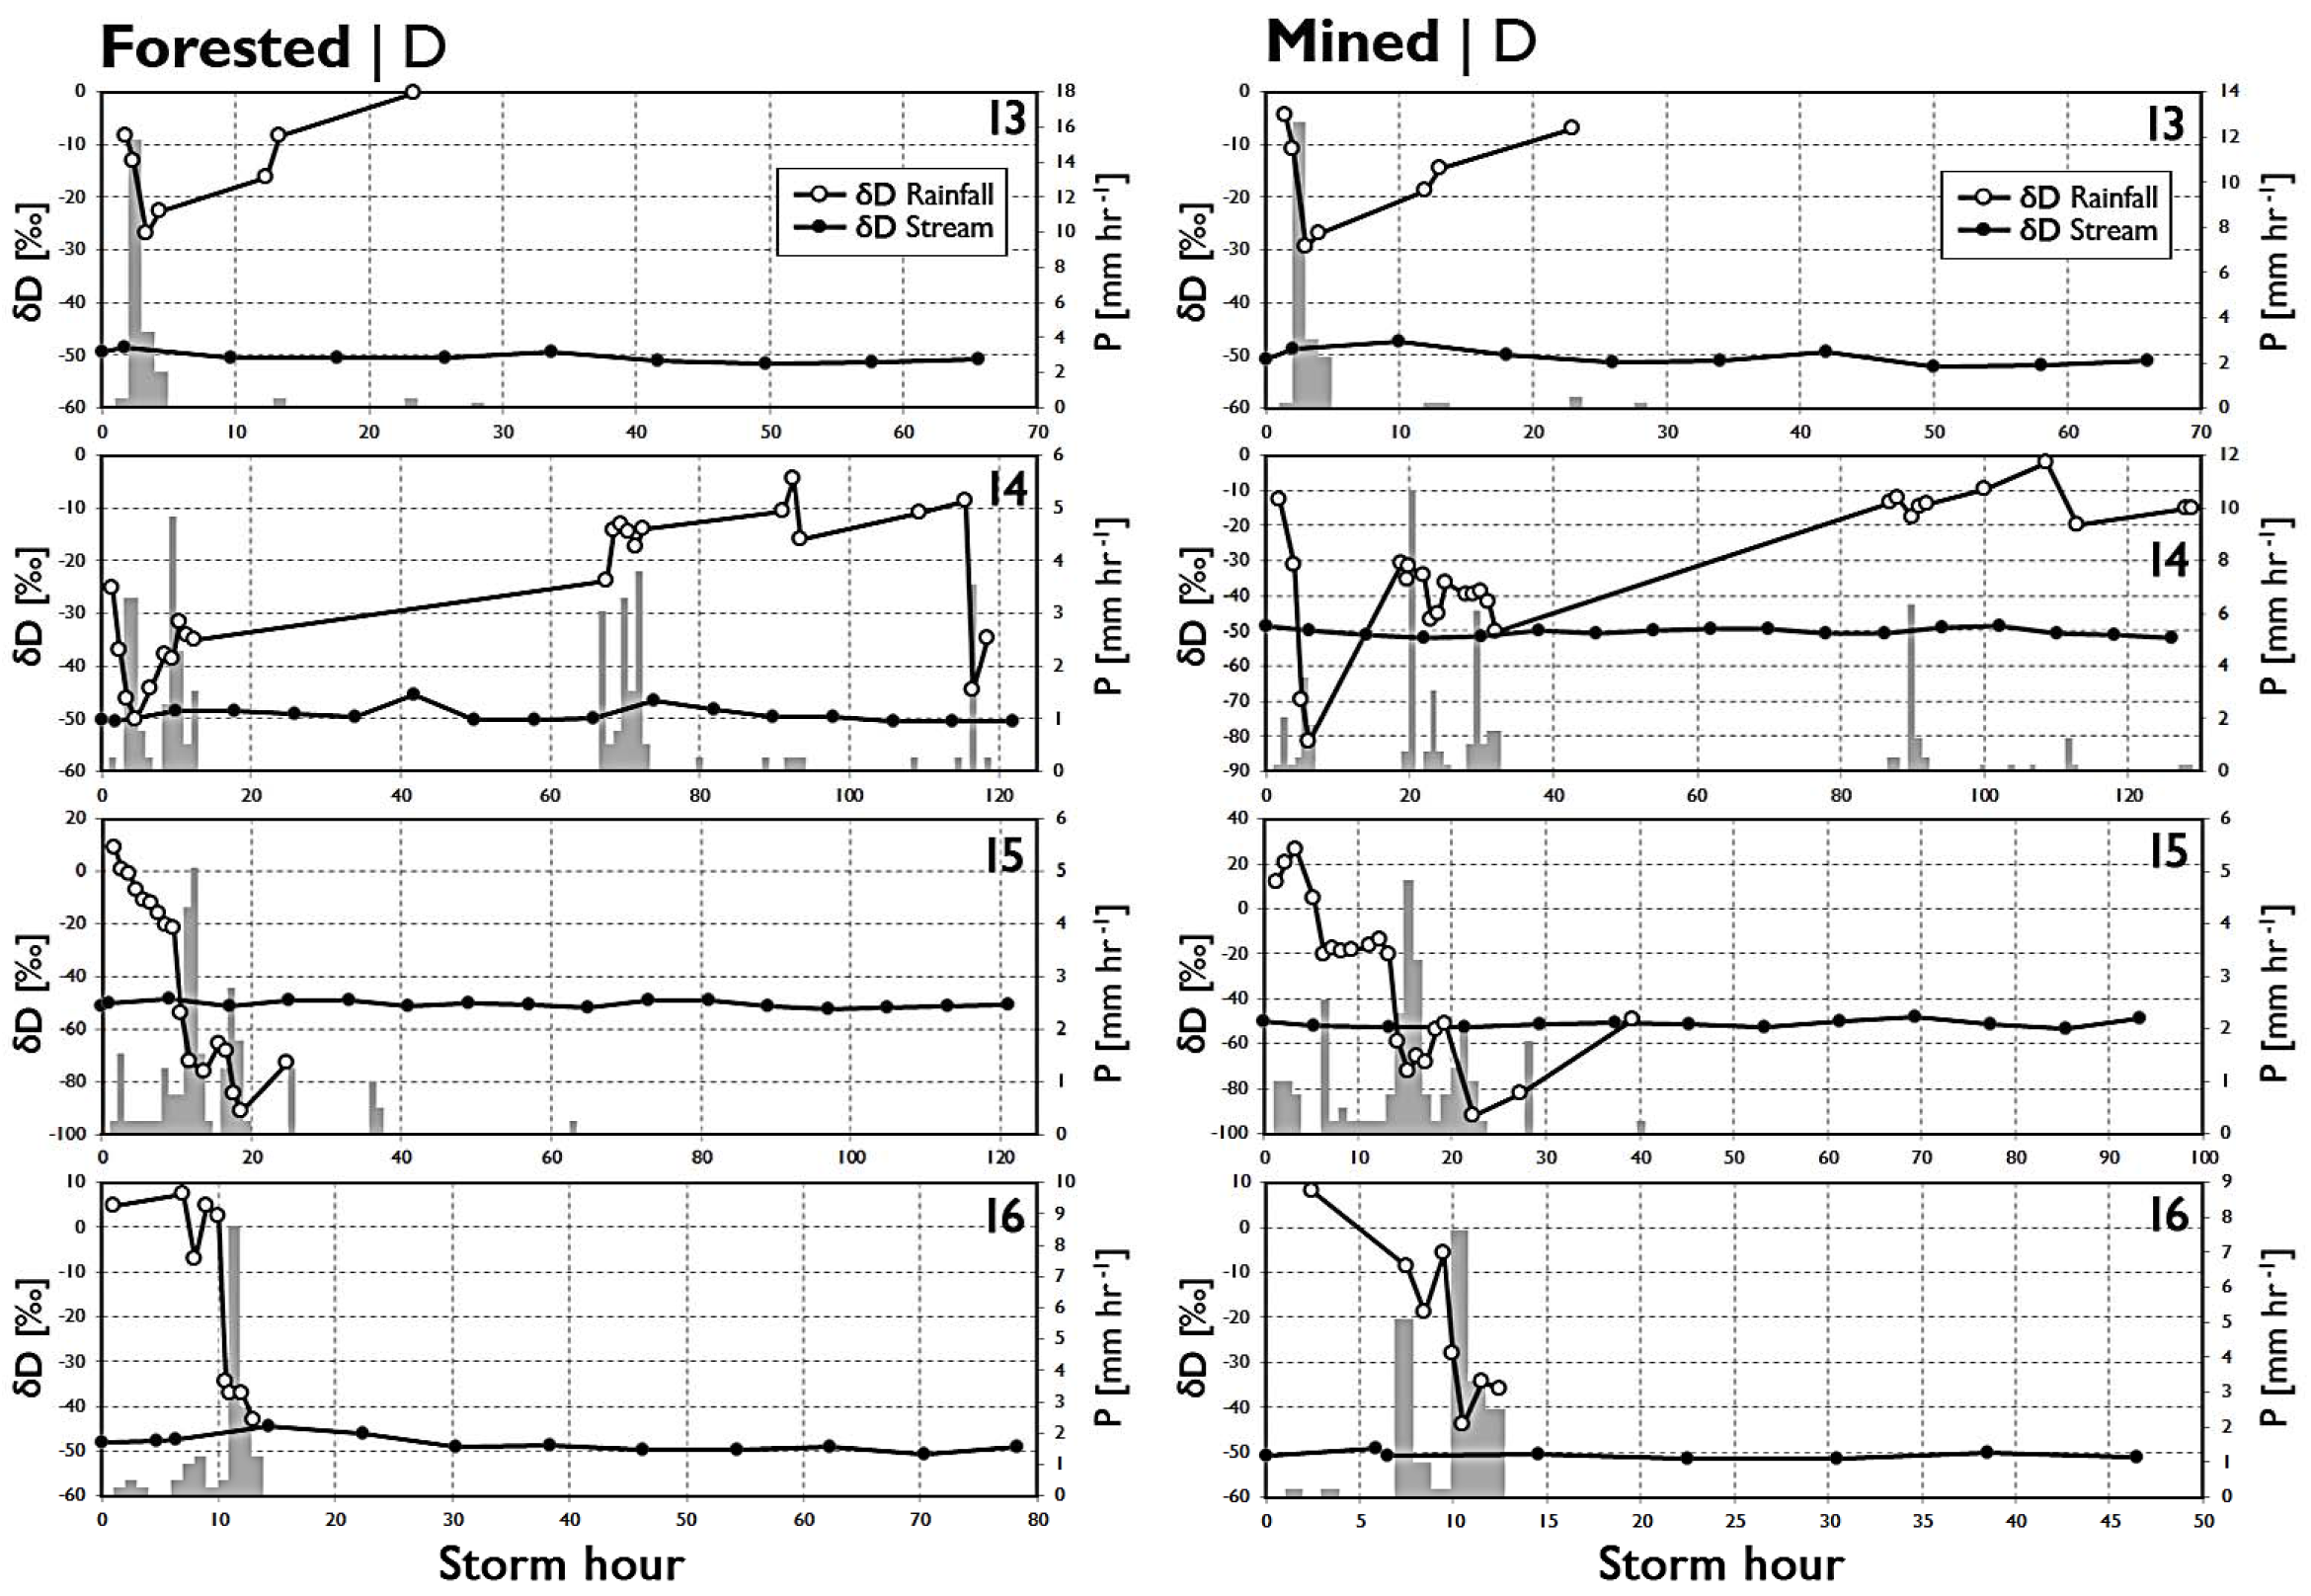
3.3. Runoff Modeling and Isotope Hydrograph Separation
4. Discussion
4.1. The Not-So-Clear Impacts of Mountaintop Removal Mining
4.2. Uncertain Role Valley Fills and Underground Mines
4.2.1. Valley Fills
4.2.2. Underground Mines
4.2.3. A Case for Threshold-Mediated Storm Responses
5. Implications and Conclusions
Acknowledgments
Author Contributions
Conflicts of Interest
References
- Ebel, B.A.; Mirus, B.B. Disturbance hydrology: Challenges and opportunities. Hydrol. Process. 2014, 28, 5140–5148. [Google Scholar] [CrossRef]
- Miller, A.; Zégre, N. Mountaintop removal mining and catchment hydrology. Water 2014, 6, 472–499. [Google Scholar] [CrossRef]
- Griffith, M.B.; Norton, S.B.; Alexander, L.C.; Pollard, A.I.; LeDuc, S.D. The effects of mountaintop mines and valley fills on the physicochemical quality of stream ecosystems in the central Appalachians: A review. Sci. Total Environ. 2012, 417–418, 1–12. [Google Scholar] [CrossRef] [PubMed]
- Merriam, E.R.; Petty, J.T.; Strager, M.P.; Maxwell, A.E.; Ziemkiewicz, P.F. Landscape-based cumulative effects models for predicting stream response to mountaintop mining in multistressor Appalachian watersheds. Freshw. Sci. 2015, 34, 1006–1019. [Google Scholar] [CrossRef]
- Wiley, J.B.; Brogan, F.D. Comparison of Peak Discharges Among Sites With and Without Valley Fills for the 8–9 July 2001, Flood in the Headwaters of Clear Fork, Coal River Basin, Mountaintop Coal-Mining Region, Southern West Virginia; Technical Report 03-133; U.S. Geological Survey: Reston, VA, USA, 2003.
- Lindberg, T.T.; Bernhardt, E.S.; Bier, R.; Helton, A.M.; Merola, R.B.; Vengosh, A.; Di Giulio, R.T. Cumulative impacts of mountaintop mining on an Appalachian watershed. Proc. Natl. Acad. Sci. USA 2011, 108, 20929–20934. [Google Scholar] [CrossRef] [PubMed]
- Bernhardt, E.S.; Lutz, B.D.; King, R.S.; Fay, J.P.; Carter, C.E.; Helton, A.M.; Campagna, D.; Amos, J. How many mountains can we mine? Assessing the regional degradation of central Appalachian rivers by surface coal mining. Environ. Sci. Technol. 2012, 46, 8115–8122. [Google Scholar] [CrossRef] [PubMed]
- Saylor, K.L. Land Cover Trends: Central Appalachians; U.S. Geological Survey: Reston, VA, USA, 2008.
- Townsend, P.A.; Helmers, D.P.; Kingdon, C.C.; McNeil, B.E.; Beurs, K.M.D.; Eshleman, K.N. Changes in the extent of surface mining and reclamation in the Central Appalachians detected using a 1976–2006 Landsat time series. Remote Sens. Environ. 2009, 113, 62–72. [Google Scholar] [CrossRef]
- EPA. The Effects of Mountaintop Mines and Valley Fills on Aquatic Ecosystems of the Central Appalachian Coalfield; Technical Report EPA/600/R-09/138F; US Environmental Protection Agency: Washington, DC, USA, 2011.
- Bonta, J. Challenges in conducting hydrologic and water quality research in drastically disturbed watersheds. J. Soil Water Conserv. 2005, 60, 121–133. [Google Scholar]
- Borchers, J.; Ehlke, T.; Mathes, M.; Downs, S. The Effects of Coal Mining on the Hydrologic Environmnet of Selected Stream Basins in Southern West Virginia; U.S. Geological Survey: Reston, VA, USA, 1991.
- McCormick, B.C.; Eshleman, K.N.; Griffith, J.L.; Townsend, P.A. Detection of flooding responses at the river basin scale enhanced by land use change. Water Resour. Res. 2009, 45. [Google Scholar] [CrossRef]
- Negley, T.L.; Eshleman, K.N. Comparison of stormflow responses of surface-mined and forested watersheds in the Appalachian Mountains, USA. Hydrol. Process. 2006, 20. [Google Scholar] [CrossRef]
- Phillips, J.D. Impacts of surface mine valley fills on headwater floods in eastern Kentucky. Environ. Geol. 2004. [Google Scholar] [CrossRef]
- Keene, T.; Skousen, J. Mine spoil reclamation with switchgrass for biofuel production. In Proceedings of the 2010 National Meeting of the American Society of Mining and Reclamation, Pittsburgh, PA, USA, 5–11 June 2010.
- Peng, S.S. Mountaintop removal controversy slows West Virginia Coal Mining. Min. Eng. 2000, 52, 53–58. [Google Scholar]
- Hartman, K.; Kaller, M.; Howell, J.; Sweka, J. How much do valley fills influence headwater streams? Hydrobiologia 2005, 532, 91–102. [Google Scholar] [CrossRef]
- Merriam, E.R.; Petty, J.T.; Merovich, G.T.; Fulton, J.B.; Strager, M.P. Additive effects of mining and residential development on stream conditions in a central Appalachian watershed. J. N. Am. Benthol. Soc. 2011, 30, 399–418. [Google Scholar] [CrossRef]
- McGuire, K.J.; McDonnell, J.J. Hydrological connectivity of hillslopes and streams: Characteristic time scales and nonlinearities. Water Resour. Res. 2010, 46, W10543. [Google Scholar] [CrossRef]
- McGlynn, B.; McDonnell, J.; Seibert, J.; Kendall, C. Scale effects on headwater catchment runoff timing, flow sources, and groundwater-streamflow relations. Water Resour. Res. 2004, 40. [Google Scholar] [CrossRef]
- Zipper, C.; Burger, J.; Skousen, J.; Angel, P.; Barton, C.; Davis, V.; Franklin, J. Restoring forests and associated ecosystem services on Appalachian coal surface mines. Environ. Manag. 2011, 47, 751–765. [Google Scholar] [CrossRef] [PubMed]
- Taylor, T.J.; Agouridis, C.T.; Warner, R.C.; Barton, C.D.; Angel, P.N. Hydrologic characteristics of Appalachian loose-dumped spoil in the Cumberland Plateau of eastern Kentucky. Hydrol. Process. 2009, 23. [Google Scholar] [CrossRef]
- Messinger, T. Comparison of Storm Response of Streams in Small, Unmined and Valley-Filled Watersheds, 1999–2001, Ballard Fork, West Virginia; Technical Report 02-4303; USGS: Reston, VA, USA, 2003.
- Bussler, B.H.; Byrnes, W.R.; Pope, P.E.; Chaney, W.R. Properties of minesoil reclaimed for forest land use. Soil Sci. Soc. Am. J. 1984, 48, 178–184. [Google Scholar] [CrossRef]
- Guebert, M.D.; Gardner, T.W. Macropore flow on a reclaimed surface mine: Infiltration and hillslope hydrology. Geomorphology 2001, 39, 151–169. [Google Scholar] [CrossRef]
- Chong, S.K.; Cowsert, P.T. Infiltration in reclaimed mined land ameliorated with deep tillage treatments. Soil Tillage Res. 1997, 44, 255–264. [Google Scholar] [CrossRef]
- Bonta, J.V.; Amerman, C.R.; Harlukowicz, T.J.; Dick, W.A. Impact of coal-surface mining on three Ohio watersheds - surface-water hydrology. J. Am. Water Resour. Assoc. 1997, 33, 907–917. [Google Scholar] [CrossRef]
- Ferrari, J.R.; Lookingbill, T.R.; McCormick, B.; Townsend, P.A.; Eshleman, K.N. Surface mining and reclamation effects on flood response of watersheds in the central Appalachian Plateau region. Water Resour. Res. 2009, 45. [Google Scholar] [CrossRef]
- Dickens, P.S.; Minear, R.A.; Tschantz, B.A. Hydrologic alteration of mountain watersheds from surface mining. J. Water Pollut. Control Fed. 1989, 61, 1249–1260. [Google Scholar]
- Wiley, J.B.; Evaldi, R.D.; Eychaner, J.H.; Chambers, D.B. Reconnaissance of Stream Geomorphology, Low Streamflow, and Stream Temperature in the Mountaintop Coal-Mining Region, Southern West Virginia, 1999–2000; U.S. Geological Survey: Reston, VA, USA, 2001.
- Green, J.; Passmore, M.; Childers, H. A Survey of the Condition of Streams in the Primary Region Of Mountaintop Mining/Valley Fill Coal Mining; US EPA: Washington, DC, USA, 2000.
- Zégre, N.P.; Maxwell, A.; Lamont, S. Characterizing streamflow response of a mountaintop-mined watershed to changing land use. Appl. Geogr. 2013, 39, 5–15. [Google Scholar] [CrossRef]
- Zégre, N.P.; Miller, A.J.; Maxwell, A.; Lamont, S.J. Multiscale analysis of hydrology in a mountaintop mine-impacted watershed. JAWRA J. Am. Water Resour. Assoc. 2014, 50, 1257–1272. [Google Scholar] [CrossRef]
- Puente, C.; Atkins, J.T. Simulation of Rainfall-Runoff Response in Mined and Unmined Watersheds in Coal Areas of West Virginia; Technical Report Water Supply Paper 2298; US Geological Survey: Reston, VA, USA, 1989.
- Hobba, W.J. Effects of Underground Mining and Mine Collapse on the Hydrology Of Selected Basins in West Virginia; Technical Report 4900012; US Geological Survey: Reston, VA, USA, 1981.
- Hawkins, J.W.; Dunn, M. Hydrologic characteristics of a 35-year-old underground mine pool. Mine Water Environ. 2007, 26, 150–159. [Google Scholar] [CrossRef]
- Cardwell, D.; Erwin, R.; Woodward, H. Geologic Map of West Virginia; 1:250,000; West Virginia Geological and Economic Survey: Morgantown, WV, USA, 1968. [Google Scholar]
- Ehlke, T.; Runner, G.; Downs, S. Hydrology of Area 9, Eastern Coal Province, West Virginia; Open-File Report 81-803; US Geological Survey: Reston, VA, USA, 1982.
- Adams, M.B.; Edwards, P.J.; Ford, W.M.; Schuler, T.M.; Thomas-Van Gundy, M.; Wood, F. Fernow Experimental Forest: Research History and Opportunities; USDA Forest Service: Washington, DC, USA, 2012.
- Kipp, J.A.; Dinger, J.S. Stress-relief fracture control of ground-water movement in the Appalachian plateaus. In Proceedings of the Fourth Annual Eastern Regional Groun Water Conference, Burlington, VT, USA, 14–16 July 1987; pp. 423–438.
- Wyrick, G.G.; Borchers, J.W. Hydrologic Effects of Stress-Relief Fracturing in an Appalachian Valley [West Virginia]; US Geological Survey: Reston, VA, USA, 1981.
- Smith, J.A.; Baeck, M.L.; Ntelekos, A.A.; Villarini, G.; Steiner, M. Extreme rainfall and flooding from orographic thunderstorms in the central Appalachians. Water Resour. Res. 2011, 47, W04514. [Google Scholar] [CrossRef]
- US Congress. Surface Mine Control and Reclamation Act; US Congress: Washington, DC, USA, 1977.
- Kozar, M.D.; McCoy, K.J.; Britton, J.Q.; Bascombe M. Blake, J. Hydrogeology, Groundwater Flow, and Groundwater Quality of an Abandoned Underground Coal-Mine Aquifer, Elkhorn Area, West Virginia; Technical Report Bulletin B-46; USGS: Reston, VA, USA, 2012.
- McColloch, J.S.; Richard D. Binns, J.; Bascombe M. Blake, J.; Clifford, M.T.; Gooding, S.E. West Virginia Mine Pool Atlas; Technical Report 036; West Virginia Department of Environmental Protection: Charleston, WV, USA, 2012.
- Turnipseed, D.; Sauer, V. Discharge Measurements at Gaging Stations; U.S. Geological Survey: Reston, VA, USA, 2010.
- Hudson, R.; Fraser, J. Introduction to Salt Dilution Gauging for Streamflow Measurement Part IV: The Mass Balance (or Dry Injection) Method. Streamline 2005, 9, 1–7. [Google Scholar]
- Hewlett, J.D.; Hibbert, A.R. Factors Affecting The Response Of Small Watersheds To Precipitation in Humid Areas; Pergamon Press: Oxford, UK, 1967. [Google Scholar]
- Jakeman, A.J.; Hornberger, G.M. How much complexity is warranted in a rainfall-runoff model? Water Resour. Res. 1993, 29, 2637–2649. [Google Scholar] [CrossRef]
- Nippgen, F.; McGlynn, B.L.; Marshall, L.A.; Emanuel, R.E. Landscape structure and climate influences on hydrologic response. Water Resour. Res. 2011, 47, W12528. [Google Scholar] [CrossRef]
- Heathcote, J.A.; Lloyd, J.W. Factors affecting the isotopic composition of daily rainfall at Driby, Lincolnshire. J. Climatol. 1986, 6, 97–106. [Google Scholar] [CrossRef]
- Matsuo, S.; Friedman, I. Deuterium content in fractionally collected rainwater. J. Geophys. Res. 1967, 72, 6374–6376. [Google Scholar] [CrossRef]
- McDonnell, J.J.; Bonell, M.; Stewart, M.K.; Pearce, A.J. Deuterium variations in storm rainfall: Implications for stream hydrograph separation. Water Resour. Res. 1990, 26, 455–458. [Google Scholar] [CrossRef]
- Craig, H. Isotopic variations in meteoric waters. Science 1961, 133, 1702–1703. [Google Scholar] [CrossRef] [PubMed]
- Sklash, M.G.; Farvolden, R.N. The role of groundwater in storm runoff. J. Hydrol. 1979, 43, 45–65. [Google Scholar] [CrossRef]
- Buttle, J. Isotope hydrograph separations and rapid delivery of pre-event water from drainage basins. Prog. Phys. Geogr. 1994, 18, 16–41. [Google Scholar] [CrossRef]
- Weiler, M.; McGlynn, B.L.; McGuire, K.J.; McDonnell, J.J. How does rainfall become runoff? A combined tracer and runoff transfer function approach. Water Resour. Res. 2003, 39. [Google Scholar] [CrossRef]
- Roa-García, M.C.; Weiler, M. Integrated response and transit time distributions of watersheds by combining hydrograph separation and long-term transit time modeling. Hydrol. Earth Syst. Sci. 2010, 14, 1537–1549. [Google Scholar] [CrossRef]
- Lyon, S.W.; Desilets, S.L.E.; Troch, P.A. Characterizing the response of a catchment to an extreme rainfall event using hydrometric and isotopic data. Water Resour. Res. 2008, 44, W06413. [Google Scholar] [CrossRef]
- McGuire, K.J.; McDonnell, J.J.; Weiler, M.; Kendall, C.; McGlynn, B.L.; Welker, J.M.; Seibert, J. The role of topography on catchment-scale water residence time. Water Resour. Res. 2005, 41. [Google Scholar] [CrossRef]
- Abbaspour, K.C.; Schulin, R.; van Genuchten, M.T. Estimating unsaturated soil hydraulic parameters using ant colony optimization. Adv. Water Resour. 2001, 24, 827–841. [Google Scholar] [CrossRef]
- Nash, J.; Sutcliffe, J. River flow forecasting through conceptual models. Part I: A discussion of principles. J. Hydrol. 1970, 10, 282–290. [Google Scholar] [CrossRef]
- Beven, K. Parameter Estimation and Predictive Uncertainty. In Rainfall-Runoff Modelling: The Primer; John Wiley and Sons, Ltd.: Chichester, UK, 2001. [Google Scholar]
- Pilgrim, D.H.; Cordery, I.; Baron, B.C. Effects of catchment size on runoff relationships. J. Hydrol. 1982, 58, 205–221. [Google Scholar] [CrossRef]
- Heerdegen, R.G.; Reich, B.M. Unit hydrographs for catchments of different sizes and dissimilar regions. J. Hydrol. 1974, 22, 143–153. [Google Scholar] [CrossRef]
- Post, D.A.; Jakeman, A.J. Relationships between catchment attributes and hydrological response characteristics in small Australian mountain ash catchments. Hydrol. Process. 1996, 10, 877–892. [Google Scholar] [CrossRef]
- Hewlett, J.D.; Pienaar, L. Design and analysis of the catchment experiment. In Proceedings of the Symposium on Use of Small Watersheds in Determining Effects of Forest Land Use on Water Quality, Lexington, KY, USA, 22–23 May 1973.
- Ritter, J.B.; Gardner, T.W. Hydrologic evolution of drainage basins disturbed by surface mining, central Pennsylvania. GSA Bull. 1993, 105, 101–115. [Google Scholar] [CrossRef]
- Bosch, J.M.; Hewlett, J.D. A review of catchment experiments to determine the effect of vegetation changes on water yield and evapotranspiration. J. Hydrol. 1982, 55, 3–23. [Google Scholar] [CrossRef]
- Stednick, J.D. Monitoring the effects of timber harvest on annual water yield. J. Hydrol. 1996, 176, 79–95. [Google Scholar] [CrossRef]
- Paybins, K.S. Flow Origin, Drainage Area, and Hydrologic Characteristics for Headwater Streams in the Mountaintop Coal-Mining Region of Southern West Virginia, 2000-01; Water-Resources Investigations Report 02-4300; U.S. Geological Survey: Reston, VA, USA, 2003.
- Messinger, T.; Paybins, K. Relations between Precipitation and Daily and Monthly Mean Flows in Gaged, Unmined and Valley-Filled Watersheds, Ballard Fork, West Virginia, 1999–2001; Technical Report WRi no.2003-4113; USGS: Reston, VA, USA, 2003.
- Ross, M.R.V.; McGlynn, B.L.; Bernhardt, E.S. Deep impact: Effects of mountaintop mining on surface topography, bedrock structure, and downstream waters. Environ. Sci. Technol. 2016, 50, 2064–2074. [Google Scholar] [CrossRef] [PubMed]
- Rozell, D.J.; Reaven, S.J. Water pollution risk associated with natural gas extraction from the marcellus shale. Risk Anal. 2012, 32, 1382–1393. [Google Scholar] [CrossRef] [PubMed]
- Demchak, J.; Skousen, J.; McDonald, L.M. Longevity of acid discharges from underground mines located above the regional water table. J. Environ. Qual. 2004, 33, 656–668. [Google Scholar] [CrossRef] [PubMed]
- Sklash, M.G. Environmental isotope studies of storm and snowmelt runoff generation. In Process Studies in Hillslope Hydrology; Anderson, M.G., Burt, T.P., Eds.; John Wiley and Sons: Chichester, UK, 1990; pp. 401–435. [Google Scholar]
- Sklash, M.G.; Farvolden, R.N. The use of environmental isotopes in the study of high-runoff episodes in streams. In Isotope Studies of Hydrologic Processes; Perry, E.C., Jr., Montgomery, C.W., Eds.; Northern Illinois University Press: Dekald, IL, USA, 1982; pp. 65–73. [Google Scholar]
- Spence, C. A paradigm shift in hydrology: Storage thresholds across scales influence catchment runoff generation. Geogr. Compass 2010, 4, 819–833. [Google Scholar] [CrossRef]
- Tromp-vanMeerveld, H.J.; McDonnell, J.J. Threshold relations in subsurface stormflow: 2. The fill and spill hypothesis. Water Resour. Res. 2006, 42. [Google Scholar] [CrossRef]
- Detty, J.M.; McGuire, K.J. Threshold changes in storm runoff generation at a till-mantled headwater catchment. Water Resour. Res. 2010, 46. [Google Scholar] [CrossRef]


| Catchment | A. | Surface Mining | Underground Mining | ||||||||||||
|---|---|---|---|---|---|---|---|---|---|---|---|---|---|---|---|
| B. | C. | D. | E. | F. | G. | H. | I. | ||||||||
| Station Location | Station Elevation | Catchment Area | Elevation Change | Mean Slope | Stream Length | Drainage Density | Legacy 1 | MTM 2 | Vally Fill Area / % Catchment Area 3 | Total Surface Mining Disturbance 4 | Catchment Area Undermined 5 | Underground Mines Contributing Area 6 | Catchment Area + Underground Mines Contributing Area 7 | Catchment Area Difference 8 | |
| (Lat/Long) | (m) | (km2) | (m) | [° (Std Dev)] | (km) | (km km−2) | [% (km2)] | [% (km2)] | [% (km2)] | [% (km2)] | [% (km2)] | (km2) | (km2) | (%) | |
| White Oak Creek (Mined) | 37°56.47′ | 475 | 6.5 | 516 | 55.6 (±19.2) | 21 | 3.3 | 10.4 (0.8) | 17.3 (1.1) | 2.9 (0.2) | 31 (2.1) | 84 (5.4) | 15.5 | 22 | 238 |
| −81°19.93′ | |||||||||||||||
| Sycamore Creek (Forested) | 37°56.47′ | 333 | 25.5 | 680 | 60.4 (±13.7) | 70 | 2.8 | 2.1 (0.5) | 0 | 0 | 0.5 (2.0) | 20 (5.2) | 20 | 45.5 | 80 |
| −81°26.01′ | |||||||||||||||
| Event | Event Start a | Mined Catchment | Forested Catchment | |||||||||||||||||
|---|---|---|---|---|---|---|---|---|---|---|---|---|---|---|---|---|---|---|---|---|
| Rainfall | Runoff | Rainfall | Runoff | |||||||||||||||||
| Duration | Depth | Intensity | Total Streamflow | Q/P | Peak Flow | Time-to-Peak c | Lag d | Qf/Q e | Duration | Depth | Intensity | Total Streamflow | Q/P | Peak Flow | Time-to-Peak c | Lag d | Qf/Q e f | |||
| Date | Time b | (hr) | (mm) | (mm hr−1) | (mm) | -- | (mm hr−1) | (hr) | (hr) | -- | (hr) | (mm) | (mm hr−1) | (mm) | -- | (mm hr−1) | (hr) | (hr) | -- | |
| 1 | 04 September 2011 | 1440 | 41.7 | 65.0 | 1.6 | 16.4 | 0.25 | 0.18 | 41.7 | 1.5 | 0.08 | 78.5 | 90.9 | 1.2 | 2.7 | 0.03 | 0.09 | 42.0 | 41.5 | -- |
| 2 | 26 September 2011 | 1510 | 12.7 | 48.0 | 3.8 | 5.2 | 0.11 | 0.21 | 4.7 | 1.2 | 0.27 | 10.0 | 62.0 | 6.2 | 2.1 | 0.03 | 0.10 | 10.3 | 6.7 | 0.42 |
| 3 | 11 October 2011 | 1930 | 55.8 | 51.8 | 0.9 | 17.3 | 0.33 | 0.22 | 57.5 | 15.5 | 0.13 | 55.7 | 49.5 | 0.9 | 5.5 | 0.11 | 0.13 | 61.7 | 20.0 | 0.17 |
| 4 | 26 October 2011 | 1130 | 68.3 | 34.8 | 0.5 | 34.4 | 0.99 | 0.17 | 65.2 | 65.2 | 0.02 | 65.8 | 30.7 | 0.5 | 6.9 | 0.23 | 0.06 | 73.5 | 55.3 | -- |
| 5 | 15 November 2011 | 0500 | 52.7 | 49.0 | 0.9 | 20.8 | 0.42 | 0.35 | 37.7 | 10.8 | 0.21 | 52.3 | 49.5 | 0.9 | 7.7 | 0.16 | 0.21 | 37.7 | 11.3 | 0.35 |
| 6 | 20 November 2011 | 1010 | 71.7 | 23.4 | 0.3 | 25.3 | 1.08 | 0.18 | 84.0 | 25.7 | 0.02 | 71.0 | 23.1 | 0.3 | 6.0 | 0.26 | 0.08 | 86.5 | 28.3 | -- |
| 7 | 29 November 2011 | 0020 | 34.8 | 22.4 | 0.6 | 20.1 | 0.90 | 0.19 | 20.8 | 18.8 | 0.03 | 34.5 | 16.8 | 0.5 | 3.7 | 0.22 | 0.05 | 24.3 | 23.0 | -- |
| 8 | 05 December 2011 | 1950 | 63.7 | 46.5 | 0.7 | 30.7 | 0.66 | 0.36 | 43.3 | 5.2 | 0.09 | 63.2 | 50.6 | 0.8 | 15.4 | 0.31 | 0.22 | 47.5 | 37.7 | 0.19 |
| 9 | 20 January 2012 | 1720 | 63.5 | 32.3 | 0.5 | 26.0 | 0.80 | 0.36 | 16.7 | 5.3 | 0.12 | 63.3 | 33.3 | 0.5 | 10.8 | 0.33 | 0.26 | 17.7 | 7.0 | 0.31 |
| 10 | 29 Feburary 2012 | 0450 | 151.0 | 88.9 | 0.6 | 57.5 | 0.65 | 0.70 | 17.8 | 5.0 | 0.23 | 70.5 | 73.9 | 1.0 | 30.4 | 0.41 | 0.58 | 17.5 | 7.3 | 0.43 |
| 11 | 23 March 2012 | 1320 | 127.7 | 27.2 | 0.2 | 25.5 | 0.94 | 0.17 | 49.2 | 49.2 | 0.00 | 50.8 | 17.8 | 0.3 | 13.0 | 0.73 | 0.09 | 53.7 | 34.8 | -- |
| 12 | 25 April 2012 | 1520 | 78.7 | 75.7 | 1.0 | 34.3 | 0.45 | 1.30 | 19.7 | 9.0 | 0.46 | 78.0 | 86.9 | 1.1 | 20.9 | 0.24 | 0.51 | 19.8 | 9.7 | 0.37 |
| 13 | 30 April 2012 | 2340 | 26.3 | 19.6 | 0.7 | 9.8 | 0.50 | 0.19 | 3.3 | 3.2 | 0.04 | 22.0 | 23.4 | 1.1 | 7.5 | 0.32 | 0.14 | 16.7 | 16.3 | 0.08 |
| 14 | 04 May 2012 | 2330 | 127.3 | 47.8 | 0.4 | 21.4 | 0.45 | 0.28 | 35.5 | 17.0 | 0.12 | 117.2 | 37.3 | 0.3 | 13.5 | 0.36 | 0.15 | 23.3 | 15.3 | 0.04 |
| 15 | 13 May 2012 | 1700 | 38.3 | 26.7 | 0.7 | 9.6 | 0.36 | 0.13 | 20.5 | 16.3 | 0.02 | 60.7 | 26.2 | 0.4 | 7.9 | 0.30 | 0.08 | 41.3 | 32.0 | 0.02 |
| 16 | 29 May 2012 | 1300 | 1.5 | 16.5 | 11.0 | 1.1 | 0.07 | 0.08 | 1.5 | 1.5 | 0.05 | 1.3 | 19.6 | 14.7 | 0.8 | 0.04 | 0.05 | 1.2 | 1.0 | 0.10 |
| 17 | 01 June 2012 | 0300 | 10.8 | 20.3 | 1.9 | 2.7 | 0.13 | 0.09 | 10.5 | 1.5 | 0.02 | 11.8 | 17.3 | 1.5 | 1.5 | 0.08 | 0.04 | 13.0 | 3.7 | 0.05 |
| 18 | 17 June 2012 | 2000 | 14.3 | 18.8 | 1.3 | 2.2 | 0.12 | 0.07 | 14.5 | 1.3 | 0.04 | 14.2 | 15.2 | 1.1 | 0.7 | 0.04 | 0.03 | 15.2 | 2.7 | 0.07 |
| 19 | 12 July 2012 | 2110 | 67.2 | 24.4 | 0.4 | 4.2 | 0.17 | 0.08 | 45.2 | 1.2 | 0.04 | 92.7 | 21.1 | 0.2 | 0.6 | 0.03 | 0.01 | 17.8 | 14.3 | -- |
| 20 | 26 July 2012 | 2050 | 95.7 | 39.9 | 0.4 | 5.8 | 0.14 | 0.20 | 2.3 | 1.3 | 0.16 | 15.0 | 41.4 | 2.8 | 1.9 | 0.05 | 0.09 | 4.2 | 2.5 | 0.21 |
| 21 | 31 July 2012 | 1500 | 6.7 | 21.1 | 3.2 | 1.8 | 0.08 | 0.07 | 5.5 | 2.7 | 0.04 | 114.2 | 68.8 | 0.6 | 3.1 | 0.04 | 0.15 | 1.8 | 1.7 | 0.29 |
| 22 | 14 August 2012 | 1500 | 18.8 | 12.7 | 0.7 | 1.4 | 0.11 | 0.05 | 2.8 | 0.8 | 0.01 | 70.3 | 14.5 | 0.2 | 1.4 | 0.10 | 0.07 | 4.2 | 2.0 | 0.15 |
| 23 | 17 September 2012 | 1410 | 41.7 | 59.7 | 1.4 | 11.7 | 0.20 | 0.25 | 13.7 | 0.8 | 0.12 | 31.0 | 41.9 | 1.4 | 3.5 | 0.08 | 0.07 | 15.7 | 8.0 | 0.13 |
| Average | 55.3 | 37.9 | 1.5 | 16.7 | 0.43 | 0.26 | 26.7 | 11.3 | 0.10 | 54.1 | 39.6 | 1.7 | 7.3 | 0.20 | 0.14 | 28.1 | 16.6 | 0.20 | ||
| Std. Dev. | 40.7 | 20.4 | 2.3 | 14.2 | 0.33 | 0.27 | 22.8 | 16.3 | 0.11 | 32.3 | 23.4 | 3.1 | 7.4 | 0.17 | 0.14 | 23.4 | 15.1 | 0.14 | ||
| Event | Mined Catchment | Forested Catchment | ||||||
|---|---|---|---|---|---|---|---|---|
| Two-Component (%/%) | TRANSEP (%/%) | Two-Component (%/%) | TRANSEP (%/%) | |||||
| δD | δ18O | δD | δ18O | δD | δ18O | δD | δ18O | |
| 2 | 39/61 | - a | - b,c | - b,c | - a | 68/32 | - b,c | - b,c |
| 5 | - a | - a | - b | - b | 19/81 | - a | - b | - b |
| 13 | - a | - a | - b | - b | - a | - a | - b | - b |
| 14 | - a | - a | - b | - b | - a | - a | - b | - b |
| 15 | - a | - a | - b | - b | - a | - a | - b | - b |
| 17 | - a | - a | - b | - b | - a | - a | - b | - b |
| 20 | 21/79 | 23/77 | 21/79 | 28/72 | 24/76 | 23/77 | 23/77 | 22/78 |
| d peak | 22/88 | 17/83 | 26/74 | 23/77 | 36/64 | 36/64 | 43/57 | 35/65 |
| 21 | 6/94 | 5/95 | - b | - b | 27/73 | 21/79 | - b | - b |
| 23 | - a | 30/70 | - b | - b | - b | - b | 16/84 | - b |
© 2016 by the authors; licensee MDPI, Basel, Switzerland. This article is an open access article distributed under the terms and conditions of the Creative Commons Attribution (CC-BY) license (http://creativecommons.org/licenses/by/4.0/).
Share and Cite
Miller, A.J.; Zégre, N. Landscape-Scale Disturbance: Insights into the Complexity of Catchment Hydrology in the Mountaintop Removal Mining Region of the Eastern United States. Land 2016, 5, 22. https://doi.org/10.3390/land5030022
Miller AJ, Zégre N. Landscape-Scale Disturbance: Insights into the Complexity of Catchment Hydrology in the Mountaintop Removal Mining Region of the Eastern United States. Land. 2016; 5(3):22. https://doi.org/10.3390/land5030022
Chicago/Turabian StyleMiller, Andrew J., and Nicolas Zégre. 2016. "Landscape-Scale Disturbance: Insights into the Complexity of Catchment Hydrology in the Mountaintop Removal Mining Region of the Eastern United States" Land 5, no. 3: 22. https://doi.org/10.3390/land5030022
APA StyleMiller, A. J., & Zégre, N. (2016). Landscape-Scale Disturbance: Insights into the Complexity of Catchment Hydrology in the Mountaintop Removal Mining Region of the Eastern United States. Land, 5(3), 22. https://doi.org/10.3390/land5030022