
“Nothing Is Like It Was Before”: The Dynamics between Land-Use and Land-Cover, and Livelihood Strategies in the Northern Vietnam Borderlands

Abstract
:
1. Introduction
2. Conceptual Framework: Land Change Science, Frontiers and Livelihood Diversification
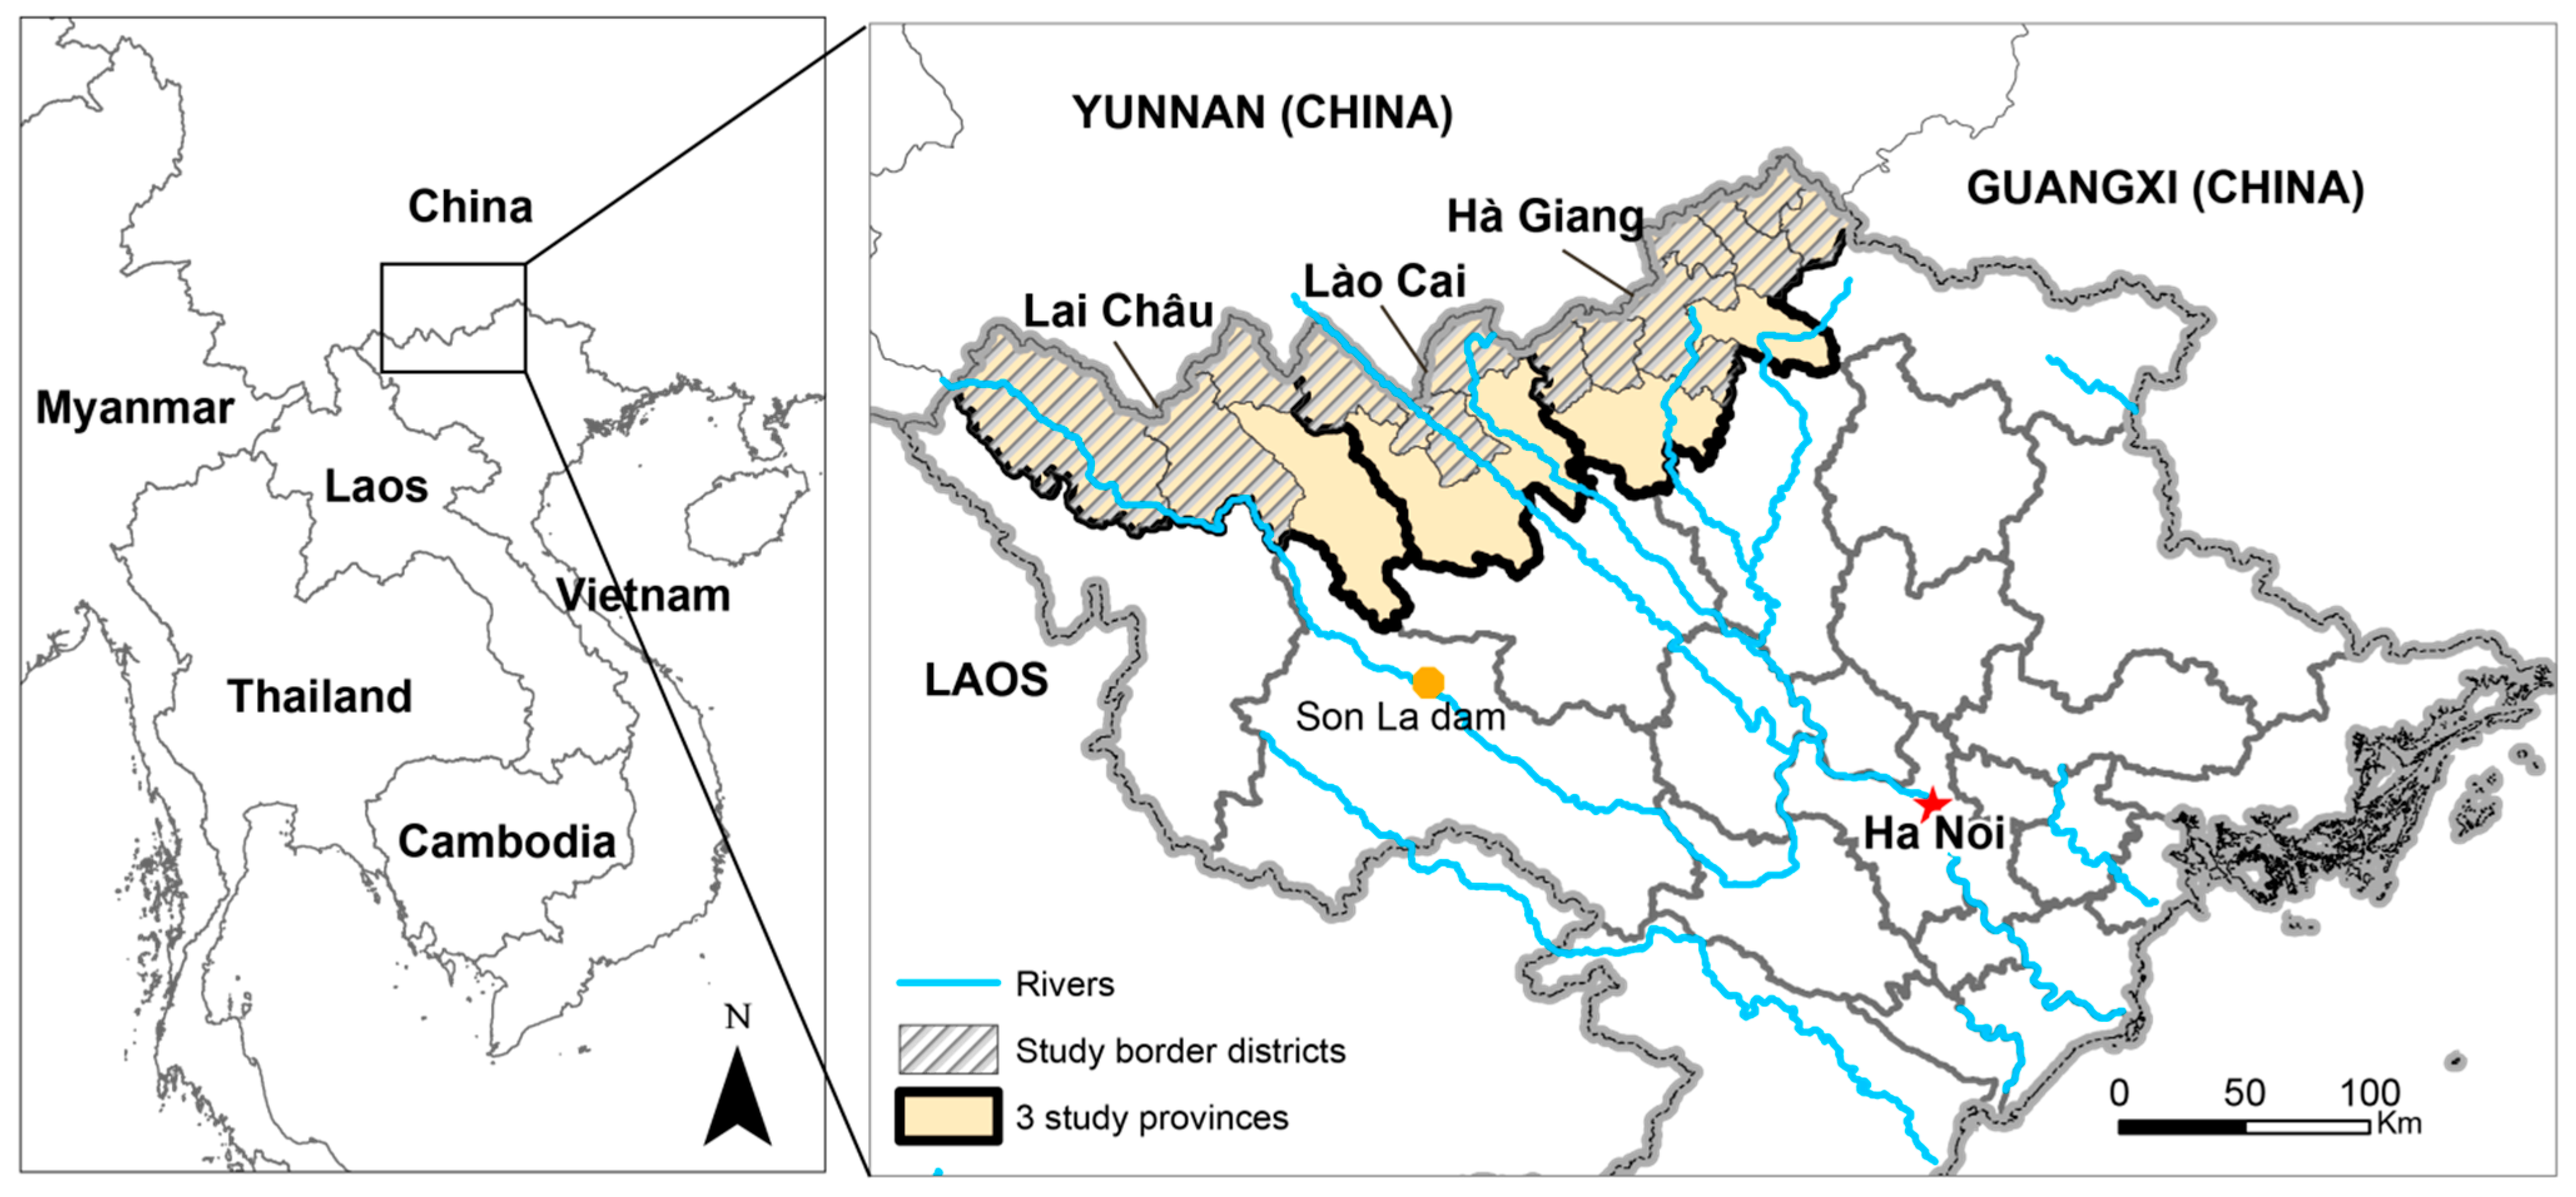
3. Context: Vietnam’s Northern Uplands
4. Methods
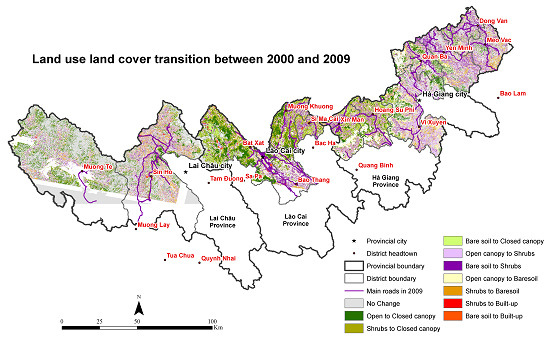
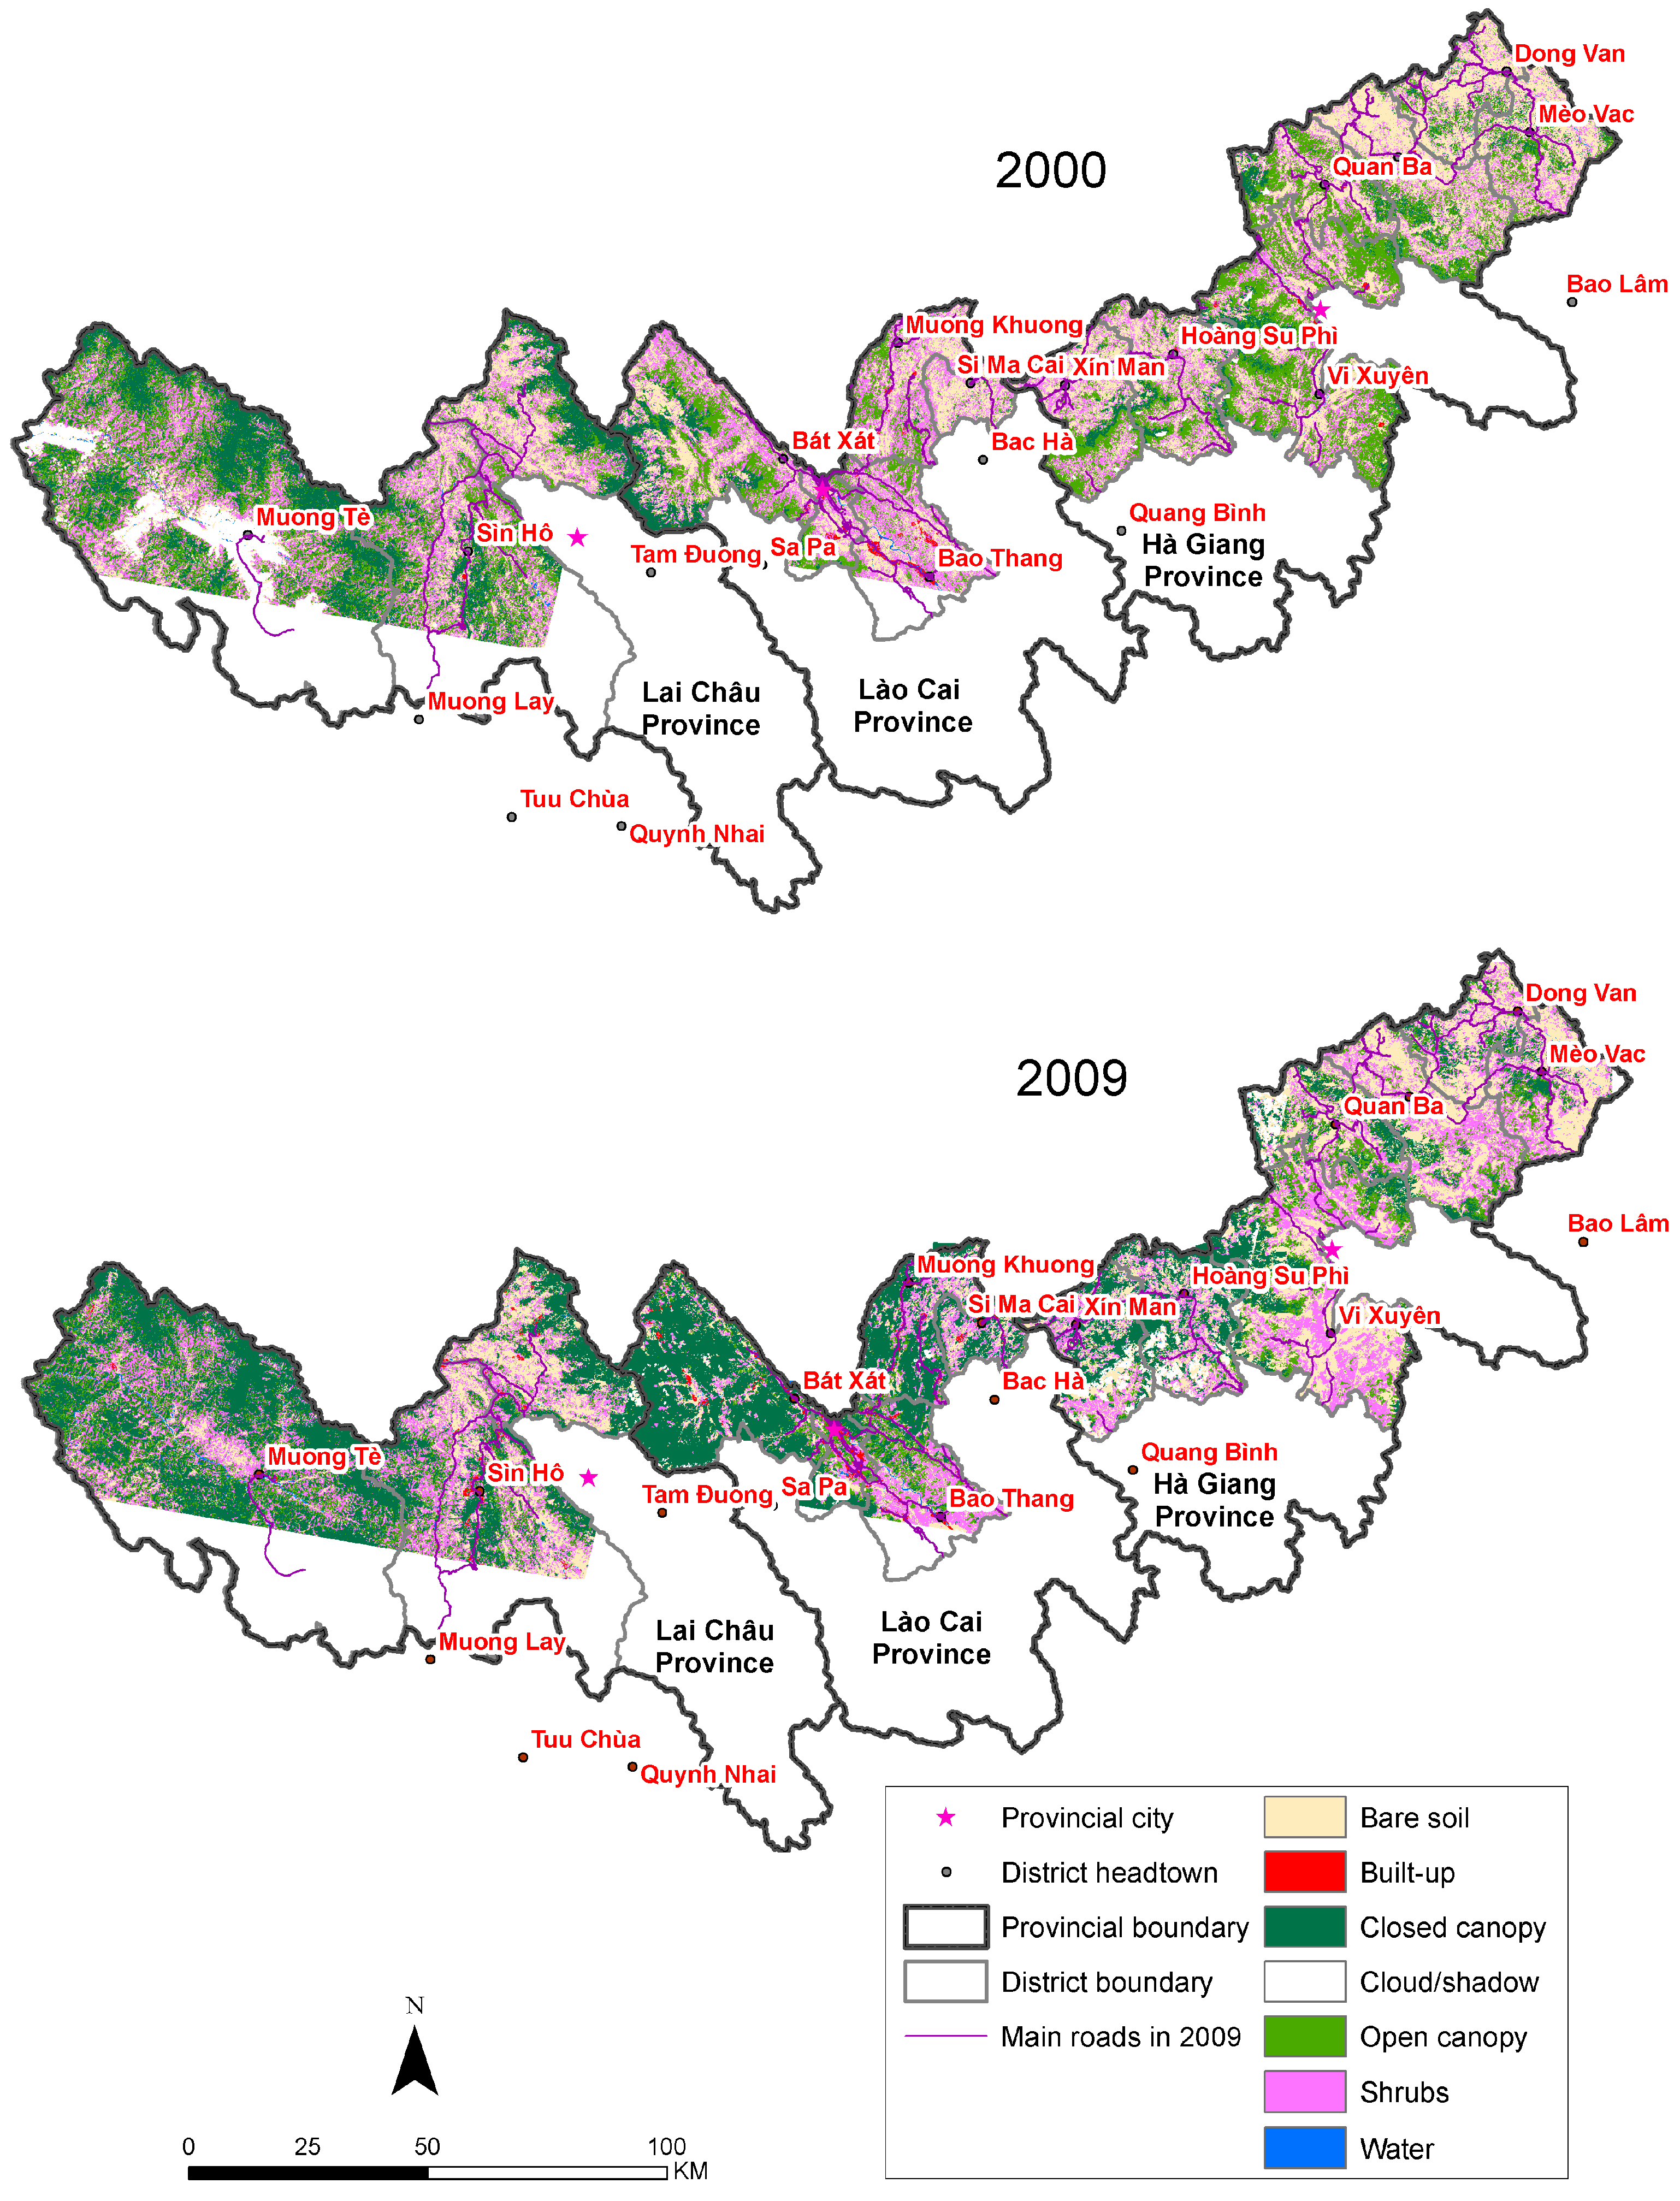
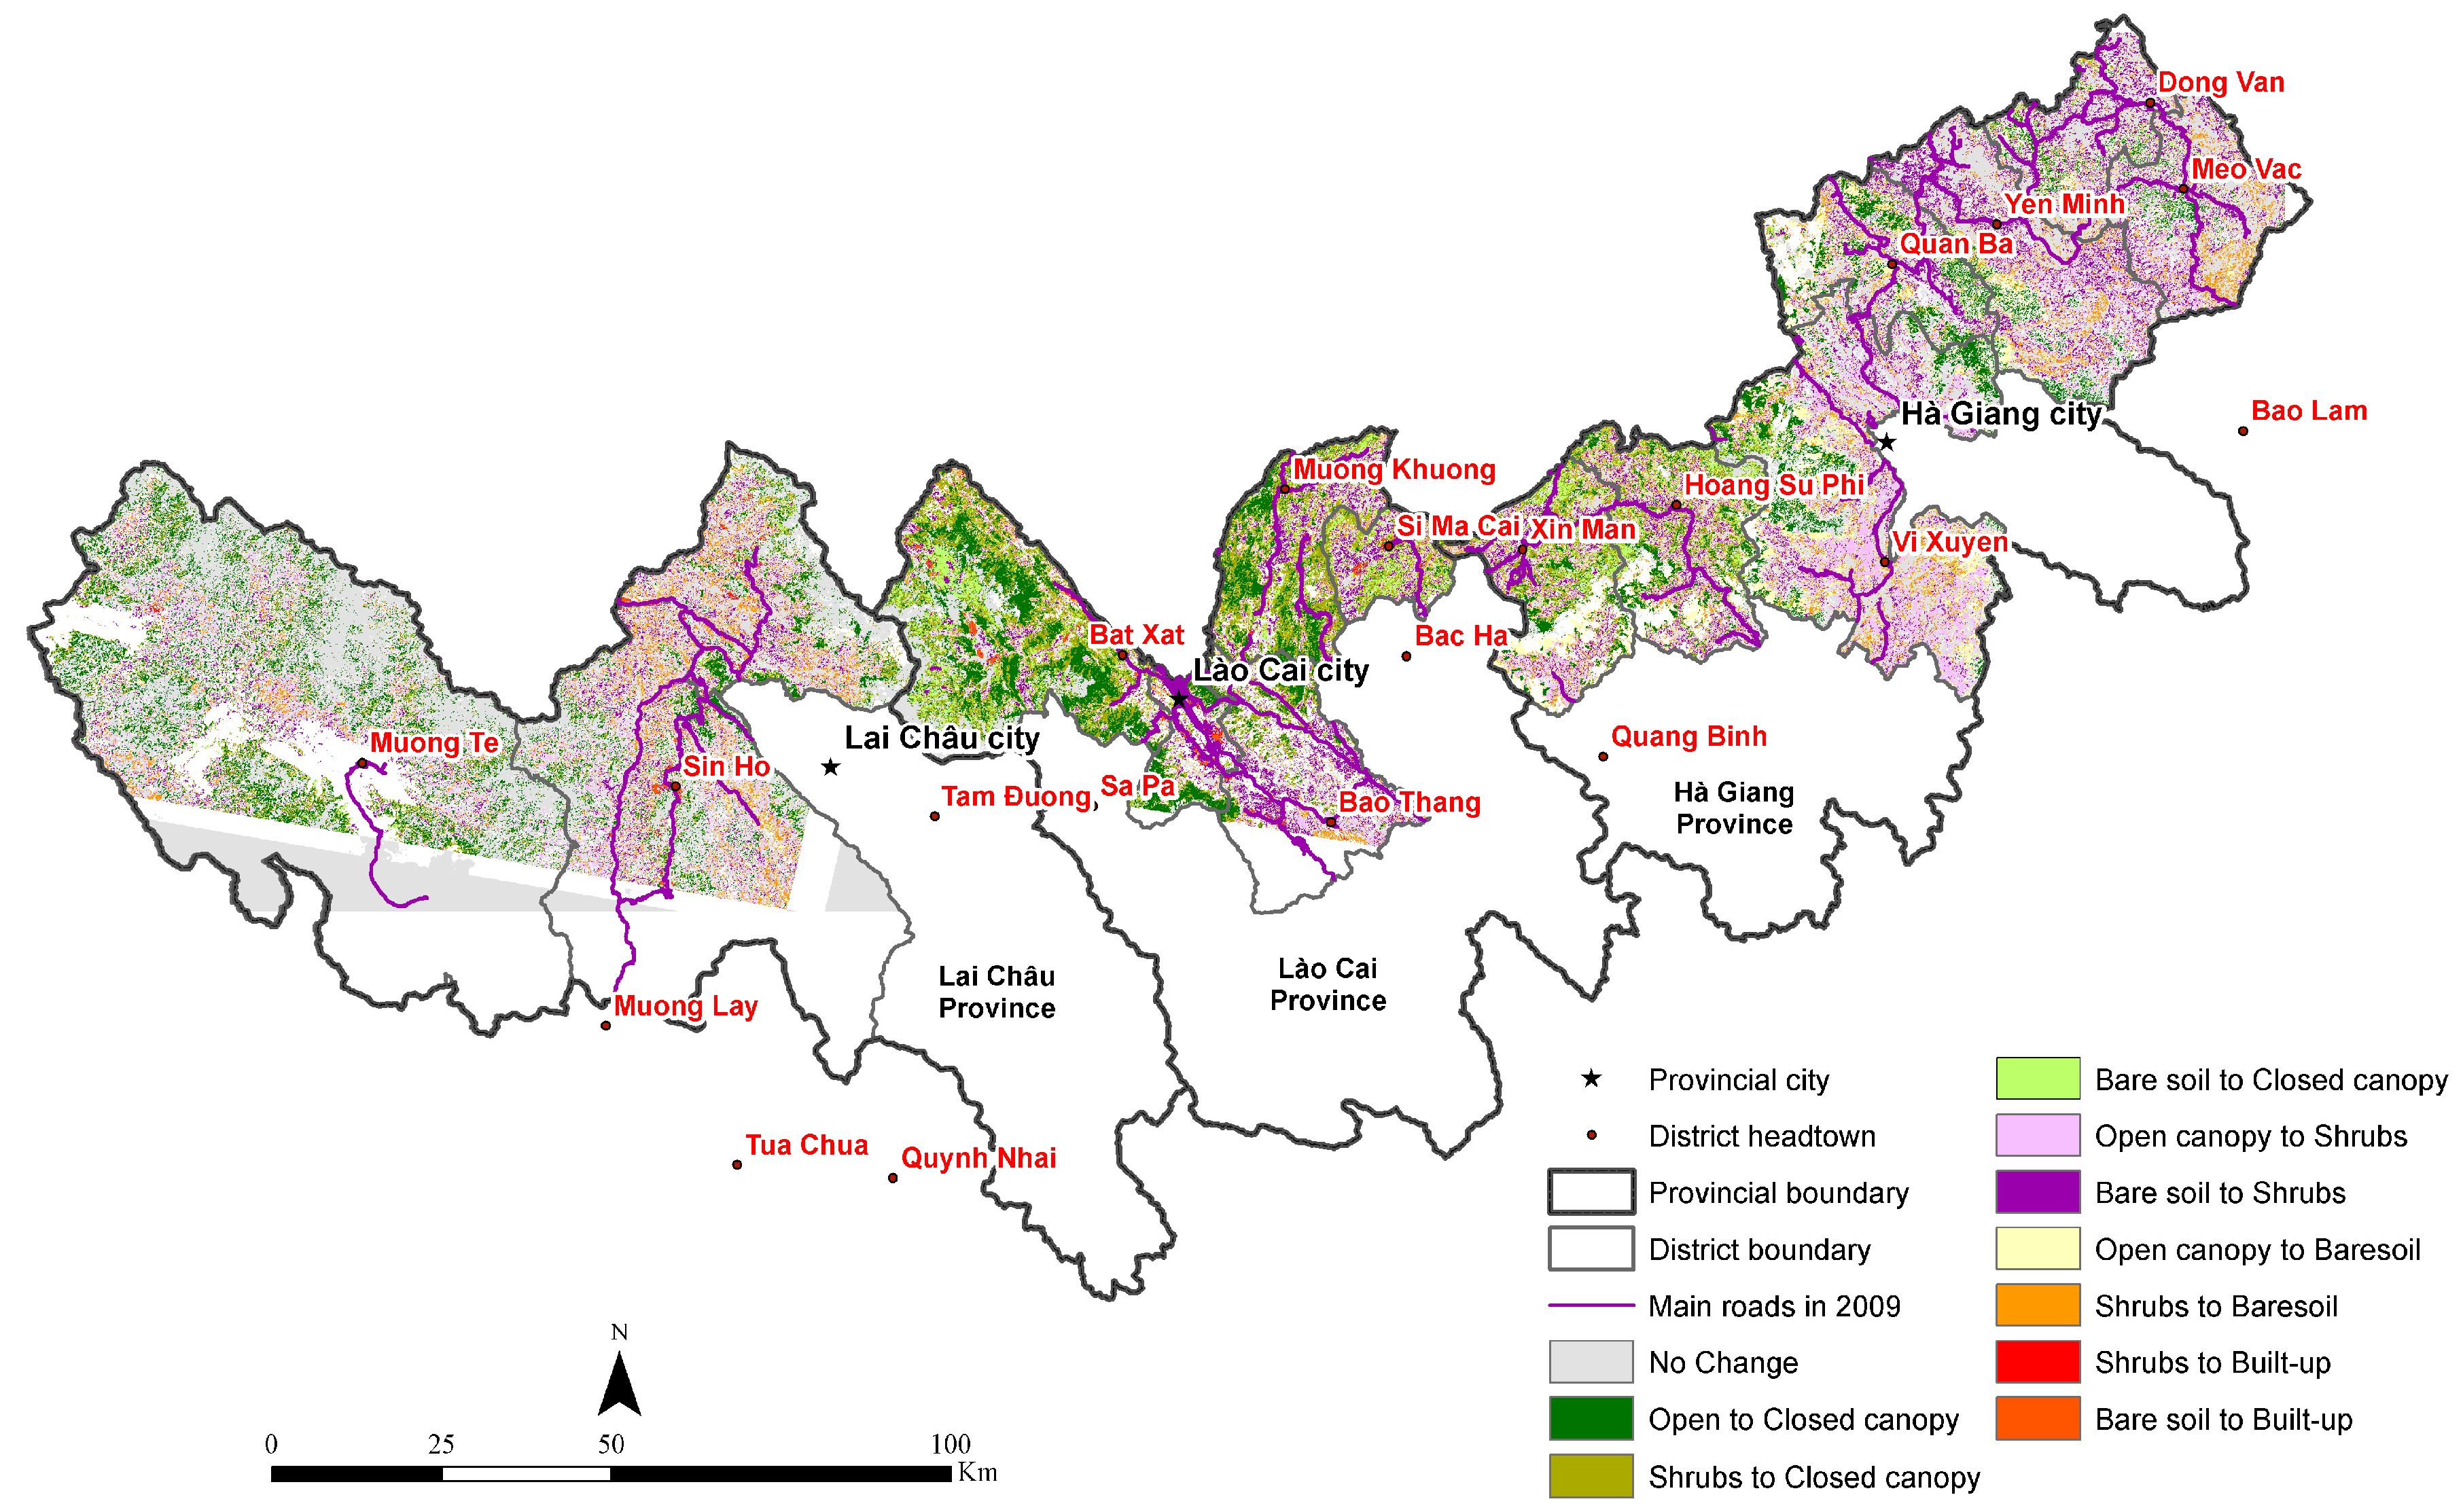
4.1. LULC and LULCC Mapping

| Province | Dates |
|---|---|
| Lai Châu | 2009 November 03 |
| 2000 November 02 | |
| Lào Cai | 2009 November 12 |
| 1999 December 27 | |
| Hà Giang | 2009 November 05 |
| 2000 November 04 |
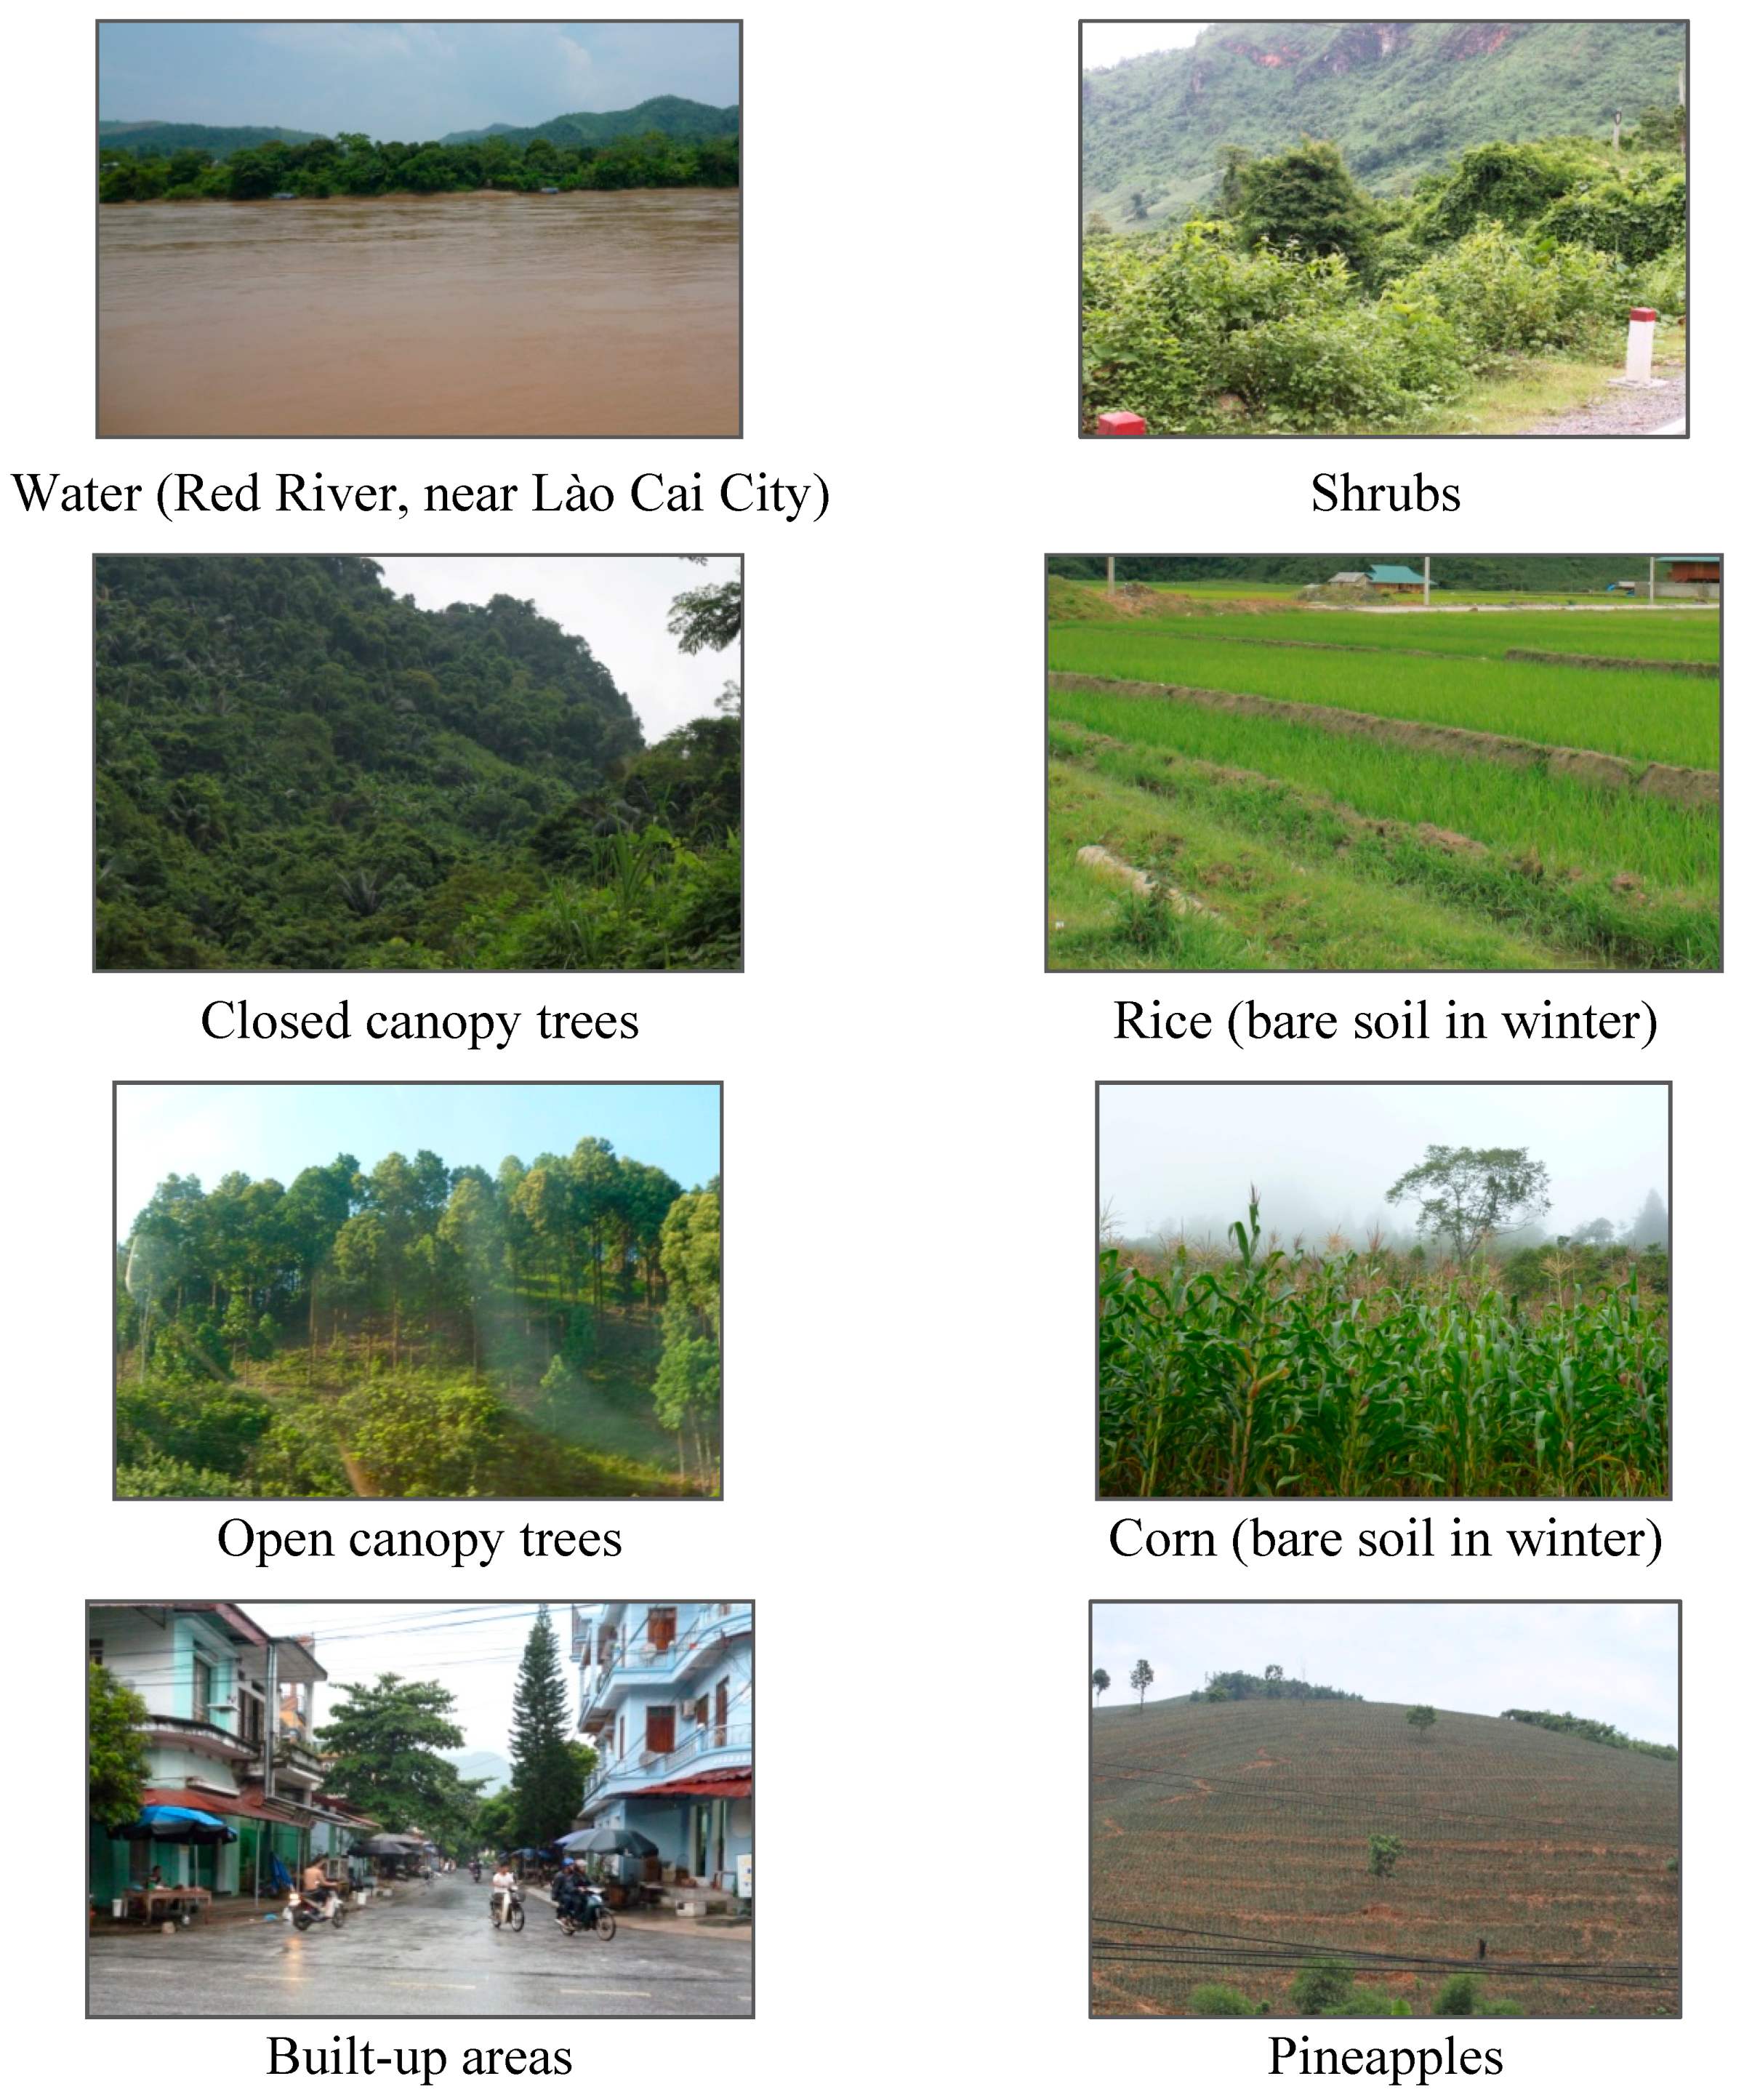
4.2. Assessing the LULC Mapping
| Ground Reference | Total | Producer Acc. (%) | |||||||
|---|---|---|---|---|---|---|---|---|---|
| Water | Closed Canopy | Open Canopy | Shrubs | Bare Soil | Built-Up | ||||
| Classification | Water | 16 | 0 | 0 | 0 | 1 | 2 | 19 | 84.21 |
| Closed canopy | 3 | 31 | 10 | 7 | 3 | 0 | 54 | 57.41 | |
| Open canopy | 0 | 1 | 23 | 8 | 2 | 2 | 36 | 63.89 | |
| Shrubs | 0 | 0 | 13 | 42 | 7 | 2 | 64 | 65.63 | |
| Bare soil | 3 | 0 | 3 | 10 | 109 | 11 | 136 | 80.15 | |
| Built-up | 0 | 0 | 1 | 3 | 15 | 37 | 56 | 66.07 | |
| Total | 22 | 32 | 50 | 70 | 137 | 54 | 365 | ||
| User Acc. (%) | 72.73 | 96.88 | 46.00 | 60.00 | 79.56 | 68.52 | |||

4.3. Computing LULCC
4.4. Qualitative Fieldwork
5. Results
| Land Cover | Area in 2000 (km2) | Area in 2009 (km2) | 2009–2000 Area Change (km2) | 2009–2000 Percent Change (%) | Annual Rate of Change (%/year) |
|---|---|---|---|---|---|
| Closed canopy | 1723.89 | 4161.03 | 2437.14 | 141.37 | 8.81 |
| Open canopy | 3281.12 | 1587.14 | −1693.98 | −51.63 | −7.26 |
| Shrubs | 3357.08 | 3033.28 | −323.80 | −9.65 | −1.01 |
| Bare soil | 3668.91 | 3141.54 | −527.37 | −14.37 | −1.55 |
| Built−up | 50.58 | 108.29 | 57.70 | 114.08 | 7.61 |
| Cloud shadow | 1068.04 | 918.51 | −149.53 | −14.00 | −1.51 |
| Water | 40.23 | 59.29 | 19.06 | 47.37 | 3.88 |
| Total | 13 189.86 | 13 009.07* |

| Province/District | Closed Canopy | Open Canopy | Shrubs | Bare Soil | Built-up | Cloud Shadow | Water | Absolute Change (km2)* | Absolute Change/Total Area** |
|---|---|---|---|---|---|---|---|---|---|
| Lai Châu Province | |||||||||
| Mường Tè | −30.54 | −75.52 | 3.90 | −243.95 | 7.22 | 852.15 | 0.35 | ||
| Sìn Hồ | 93.47 | 14.07 | 32.50 | −71.93 | −2.71 | 334.90 | 0.27 | ||
| Phong Thổ | 69.50 | −77.95 | −43.30 | 28.69 | 8.59 | 2.64 | 233.53 | 0.28 | |
| Lào Cai Province | |||||||||
| Bát Xát | 13.07 | 4.61 | 1191.66 | 1.13 | |||||
| Lào Cai City | 71.92 | −18.50*** | −27.74 | −47.02 | 17.76 | 0.65 | 2.94 | 185.89 | 0.87 |
| Bảo Thắng | 22.83 | −32.25 | −88.88 | −7.94 | 0.85 | −0.31 | 257.63 | 0.49 | |
| Mường Khương | −89.74 | 6.69 | 2.91 | 0.87 | 644.18 | 1.16 | |||
| Si Ma Cai | 91.42 | −6.96 | −18.21 | −73.69 | 5.74 | 0.26 | 1.25 | 197.27 | 0.85 |
| Hà Giang Province | |||||||||
| Xín Mần | −51.27 | −41.19 | 0.00 | 48.63 | 2.20 | 376.20 | 0.66 | ||
| Hoàng Su Phì | −62.59 | −52.84 | −0.99 | 43.73 | 1.12 | 422.37 | 0.67 | ||
| Vị Xuyên | −7.97 | 10.74 | −1.66 | 848.94 | 0.58 | ||||
| Quản Bạ | 74.81 | −3.97 | 11.60 | −0.35 | 36.86 | 1.28 | 211.76 | 0.39 | |
| Yên Minh | 22.00 | −68.72 | 94.37 | −47.10 | −0.69 | 0.00 | 0.11 | 232.98 | 0.30 |
| Đồng Văn | 28.76 | −11.20 | 37.74 | −61.65 | −0.22 | −0.01 | −0.48 | 140.05 | 0.31 |
| Mèo Vạc | 10.75 | −42.36 | 38.41 | −21.04 | 0.00 | 0.05 | −0.03 | 112.59 | 0.20 |
| In 1999 | |||||||||
|---|---|---|---|---|---|---|---|---|---|
| Cloud Shadow | Water | Closed Canopy | Open Canopy | Shrubs | Bare Soil | Built-up | Total | ||
| In 2009 | Cloud shadow | 506.81 | 1.52 | 110.40 | 142.63 | 93.13 | 61.92 | 0.87 | 917.28 |
| Water | 8.51 | 15.45 | 1.68 | 3.86 | 8.41 | 19.70 | 1.82 | 59.45 | |
| Closed canopy | 139.74 | 0.97 | 1 285.01 | 1 344.63 | 871.10 | 515.50 | 1.66 | 4 158.61 | |
| Open canopy | 98.04 | 1.73 | 115.34 | 650.42 | 472.50 | 245.52 | 3.21 | 1 586.76 | |
| Shrubs | 103.44 | 4.30 | 87.95 | 662.15 | 1 155.14 | 1 005.88 | 13.39 | 3 032.25 | |
| Bare soil | 66.78 | 14.72 | 114.72 | 456.69 | 723.57 | 1 744.98 | 18.33 | 3 139.79 | |
| Built-up | 2.58 | 1.61 | 0.98 | 6.08 | 24.66 | 61.06 | 11.29 | 108.27 | |
| Total | 925.90 | 40.31 | 1 716.09 | 3 266.45 | 3 348.51 | 3 654.56 | 50.58 | 13 002.40 | |

5.1. Examining the Underlying Relationships between LULCC and Livelihood Diversification
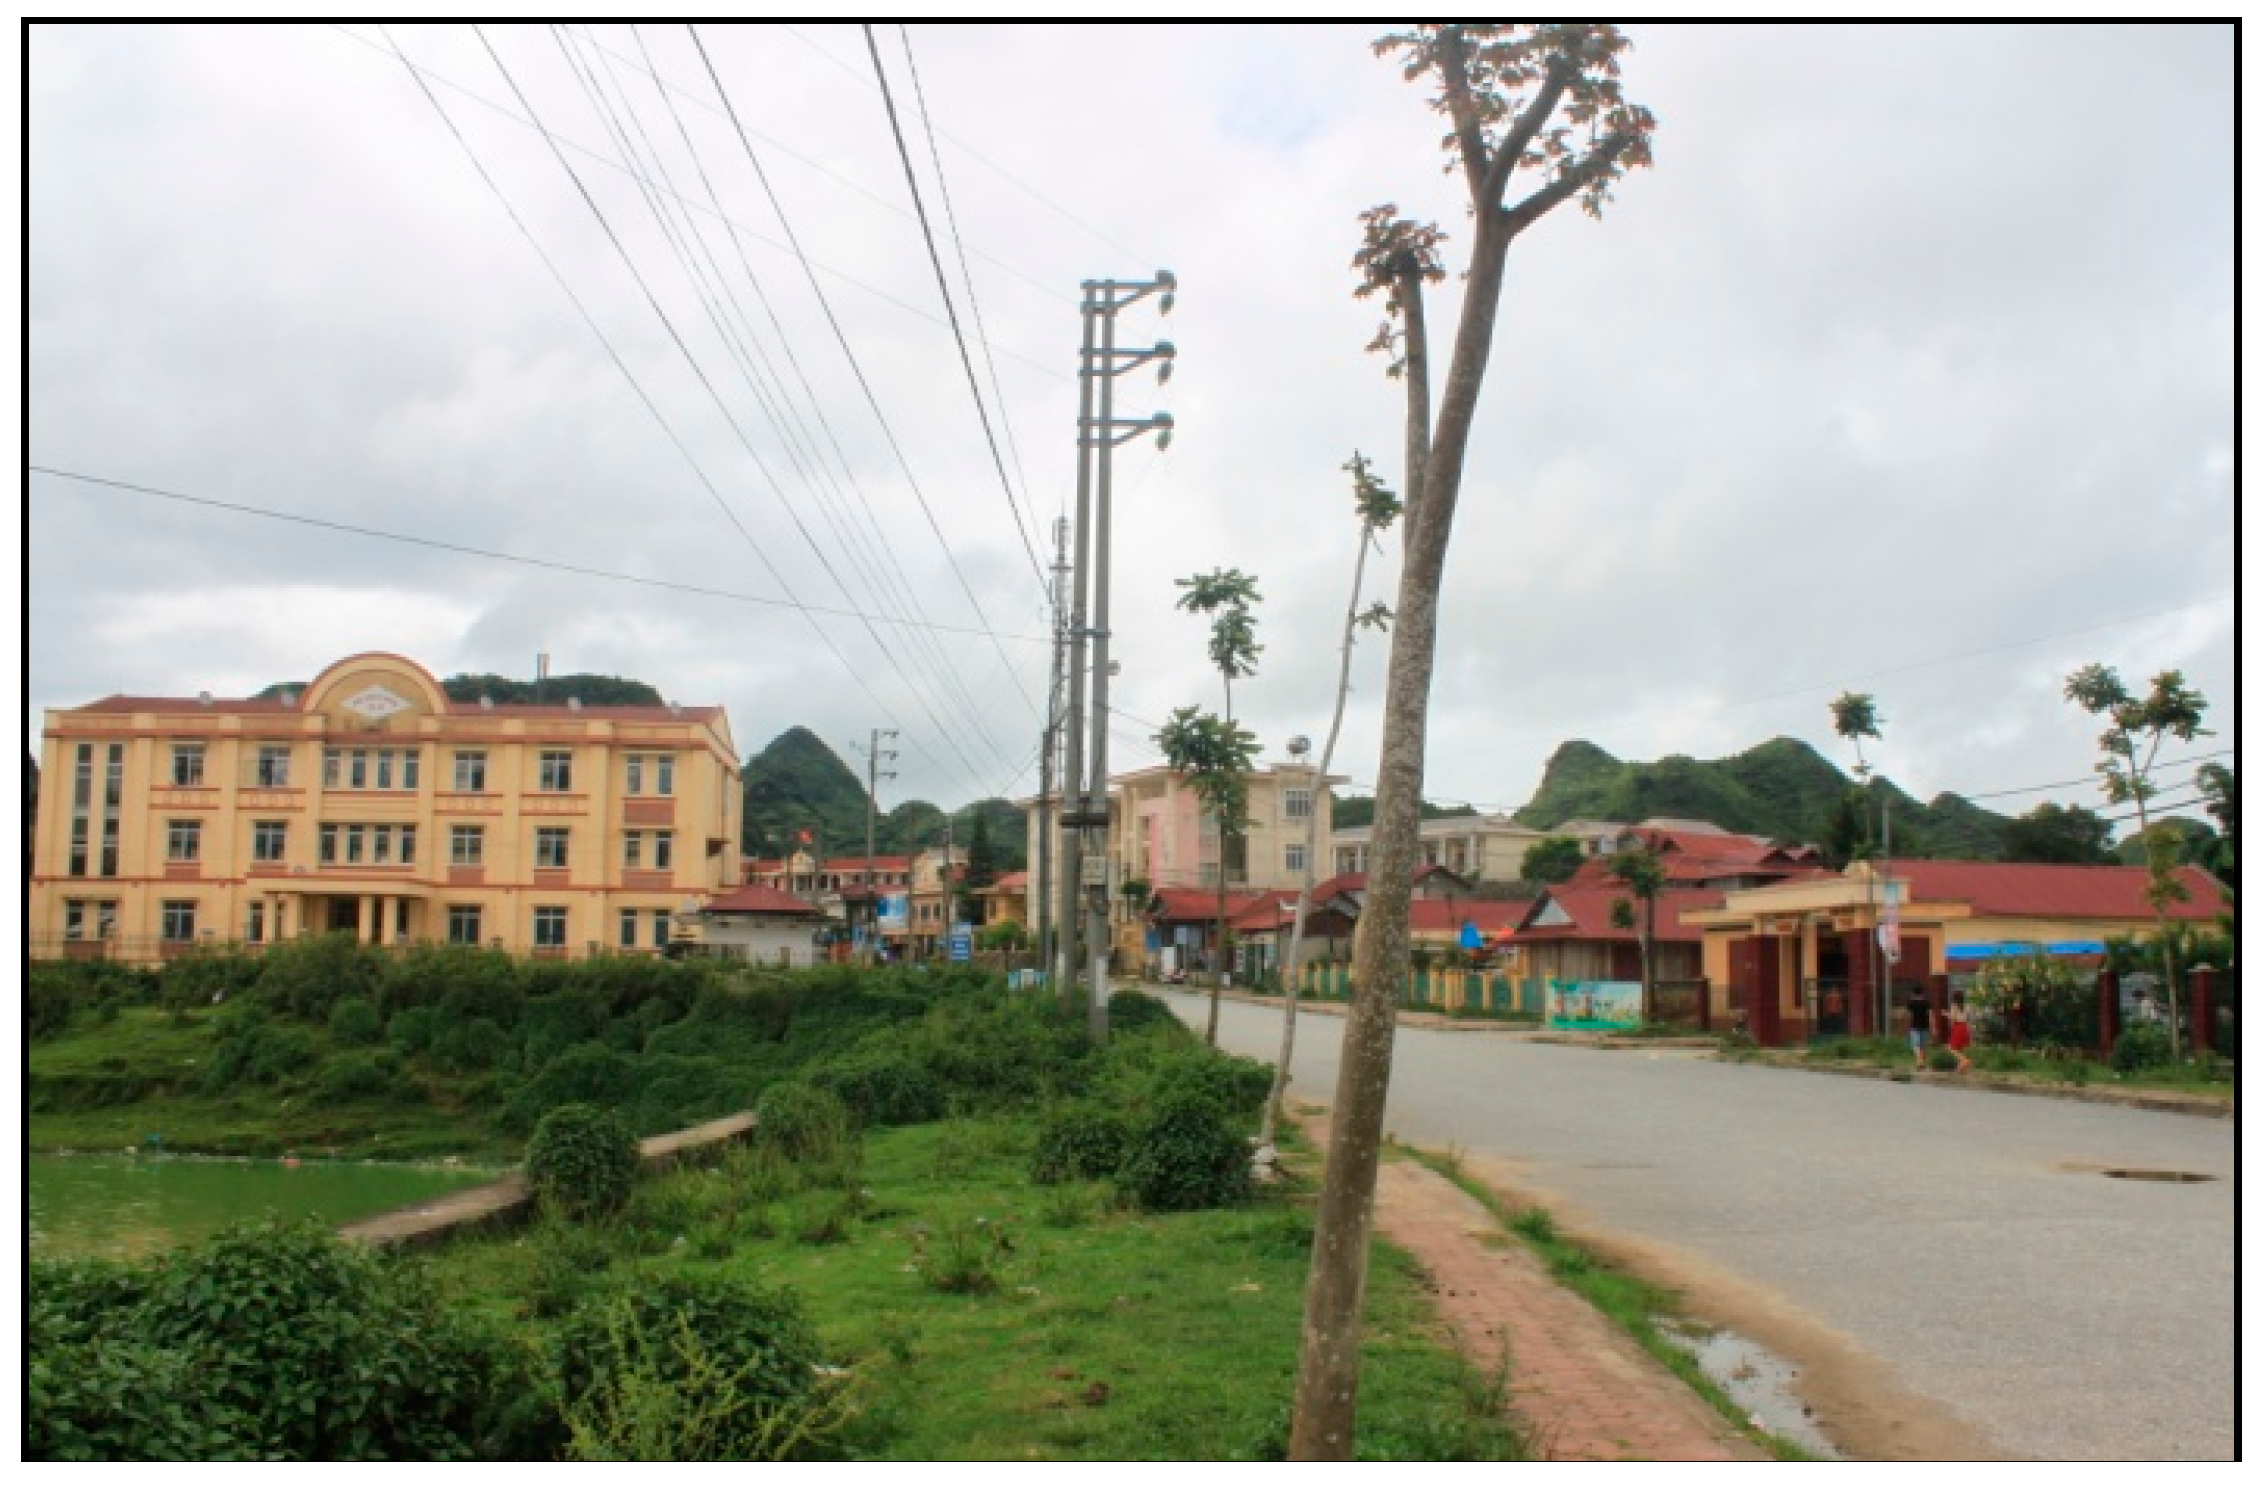
5.1.1. Urbanization in the Uplands and the Case of Lai Châu’s Changing Capitals

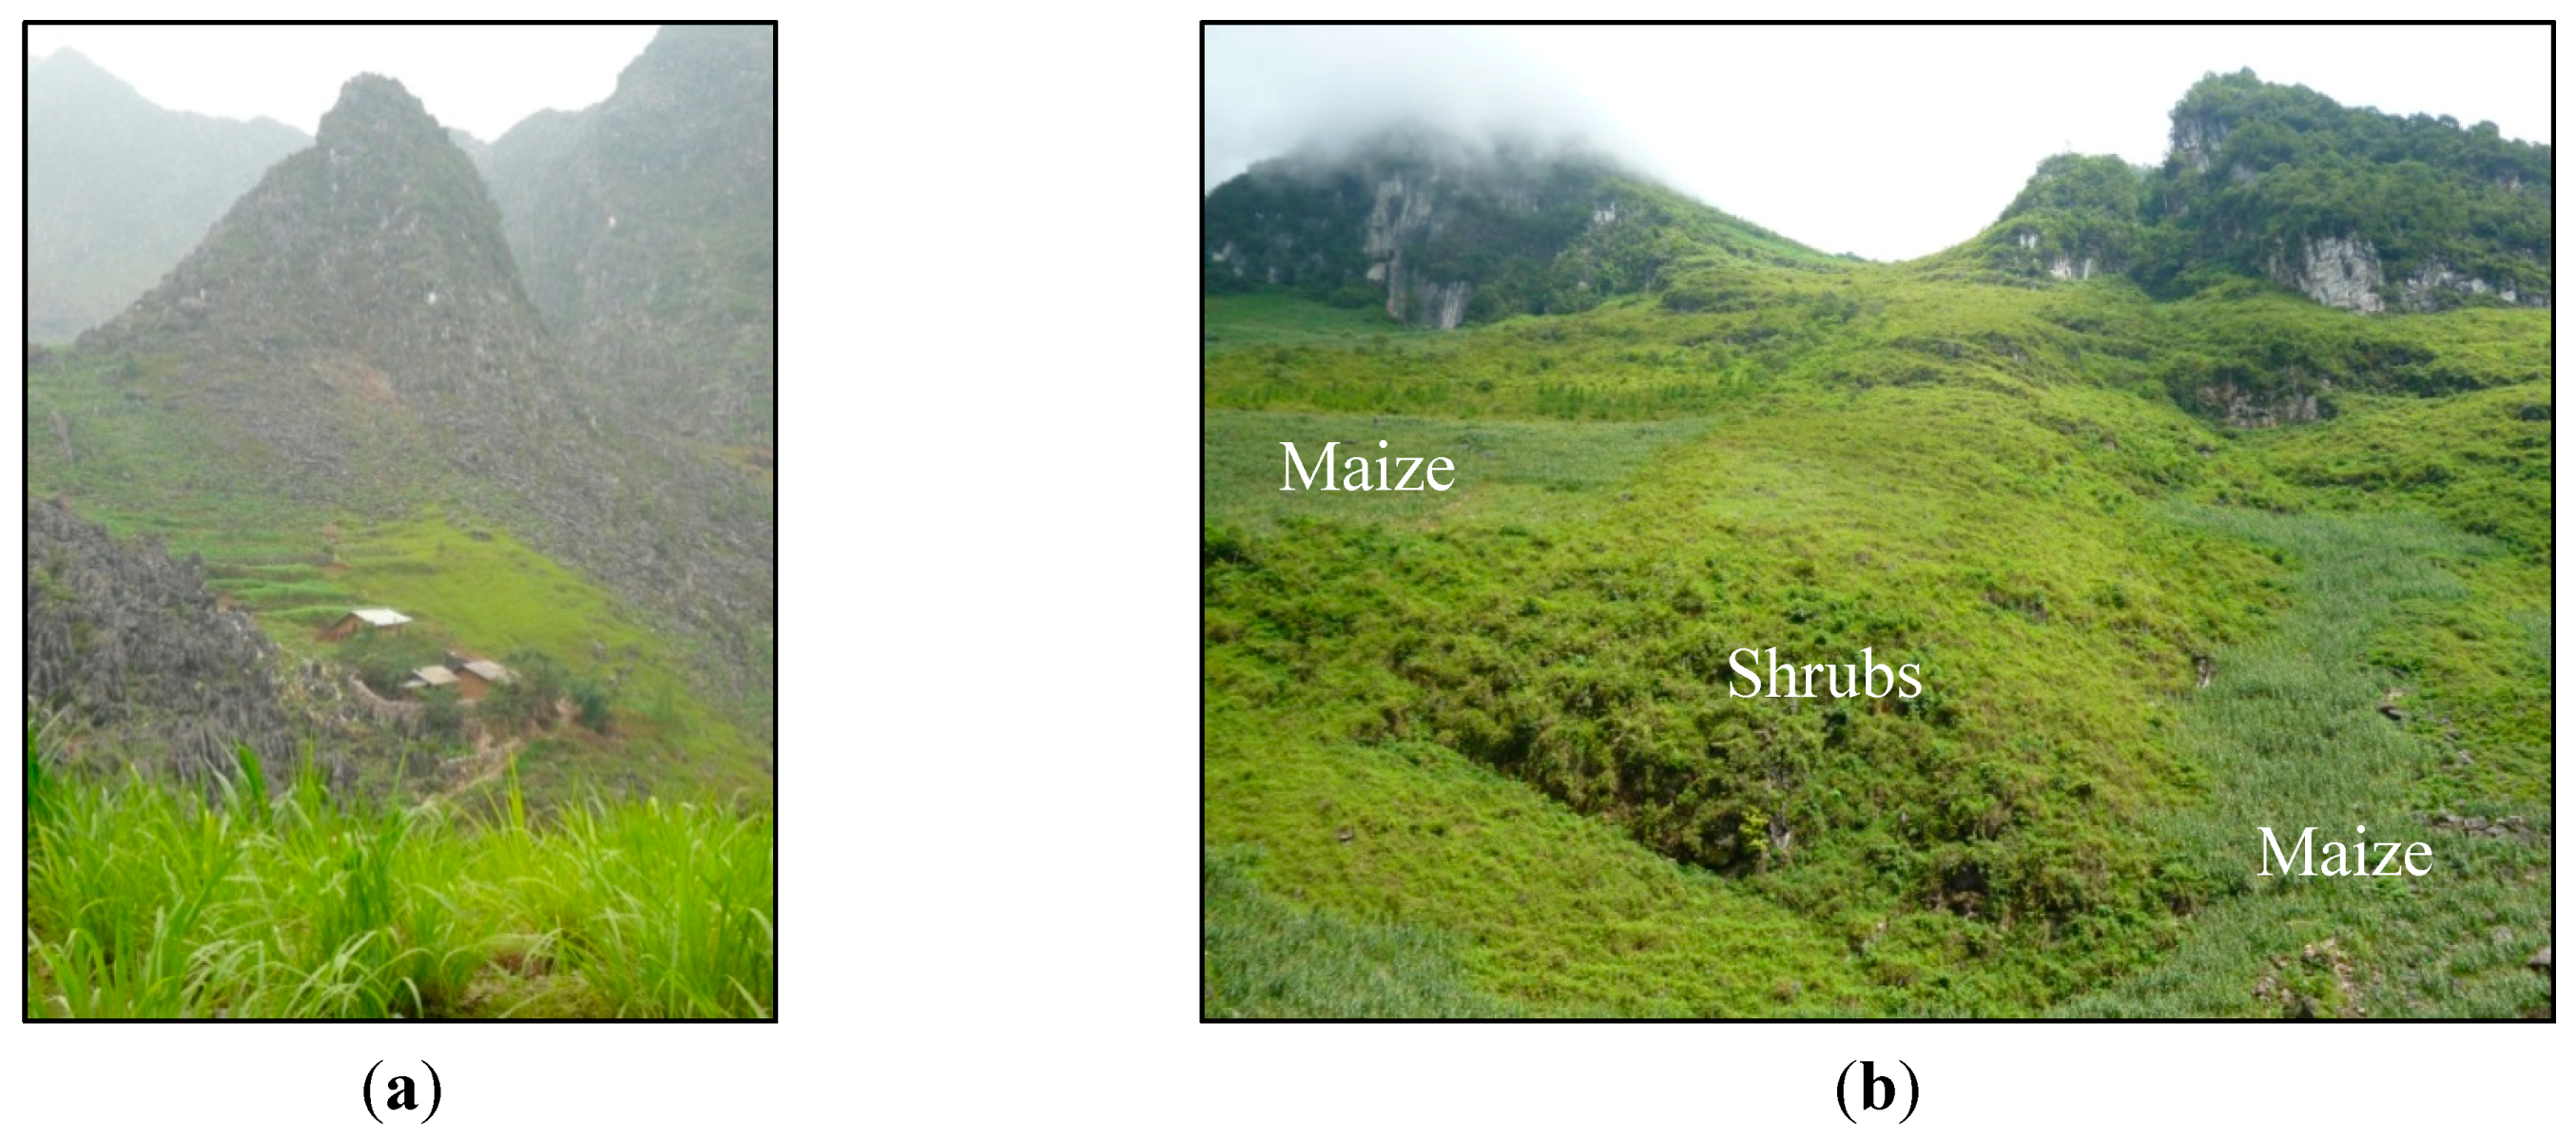
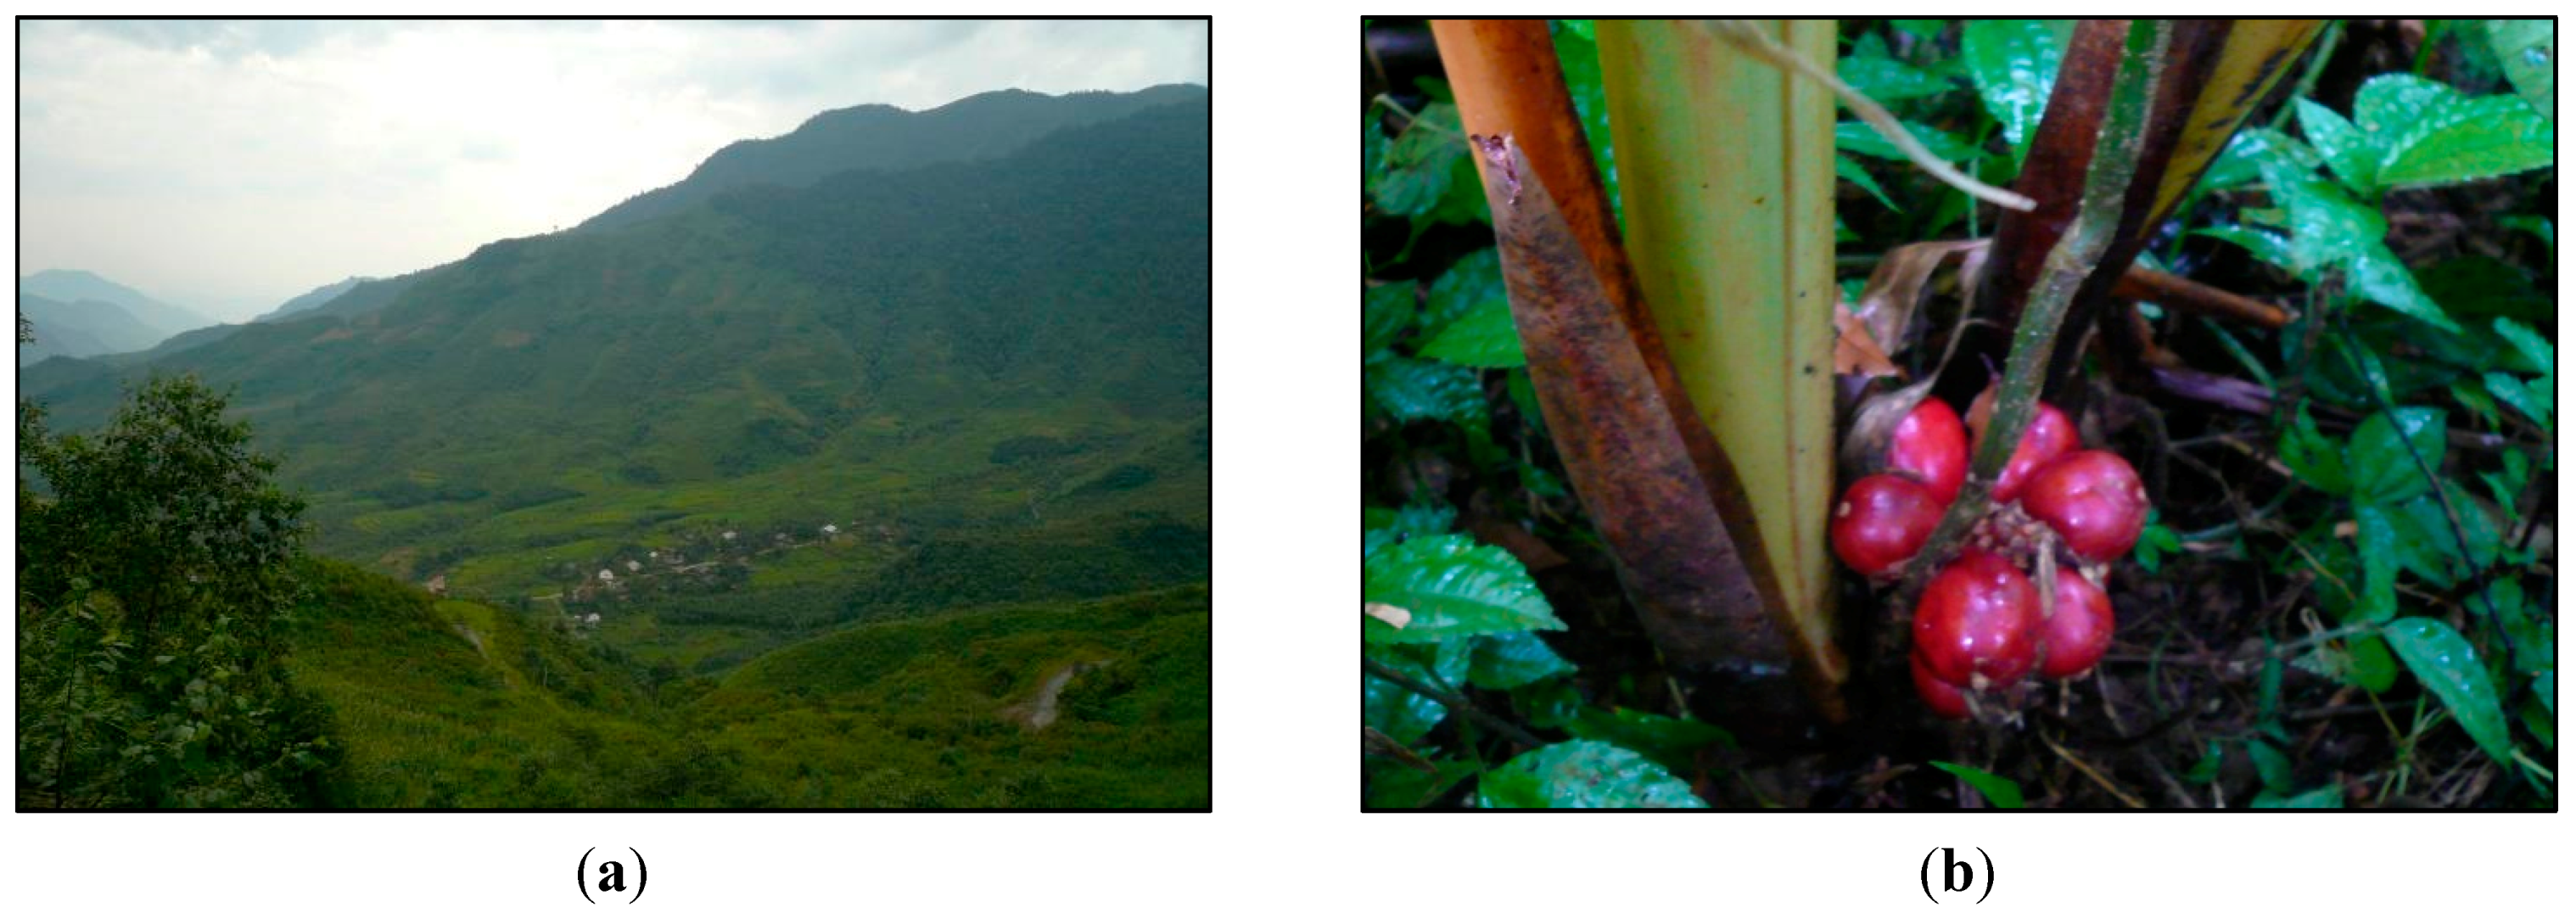
5.1.2. The Impacts of Increased Cash Needs on Closed Canopy Forest: The Case of Bát Xát District

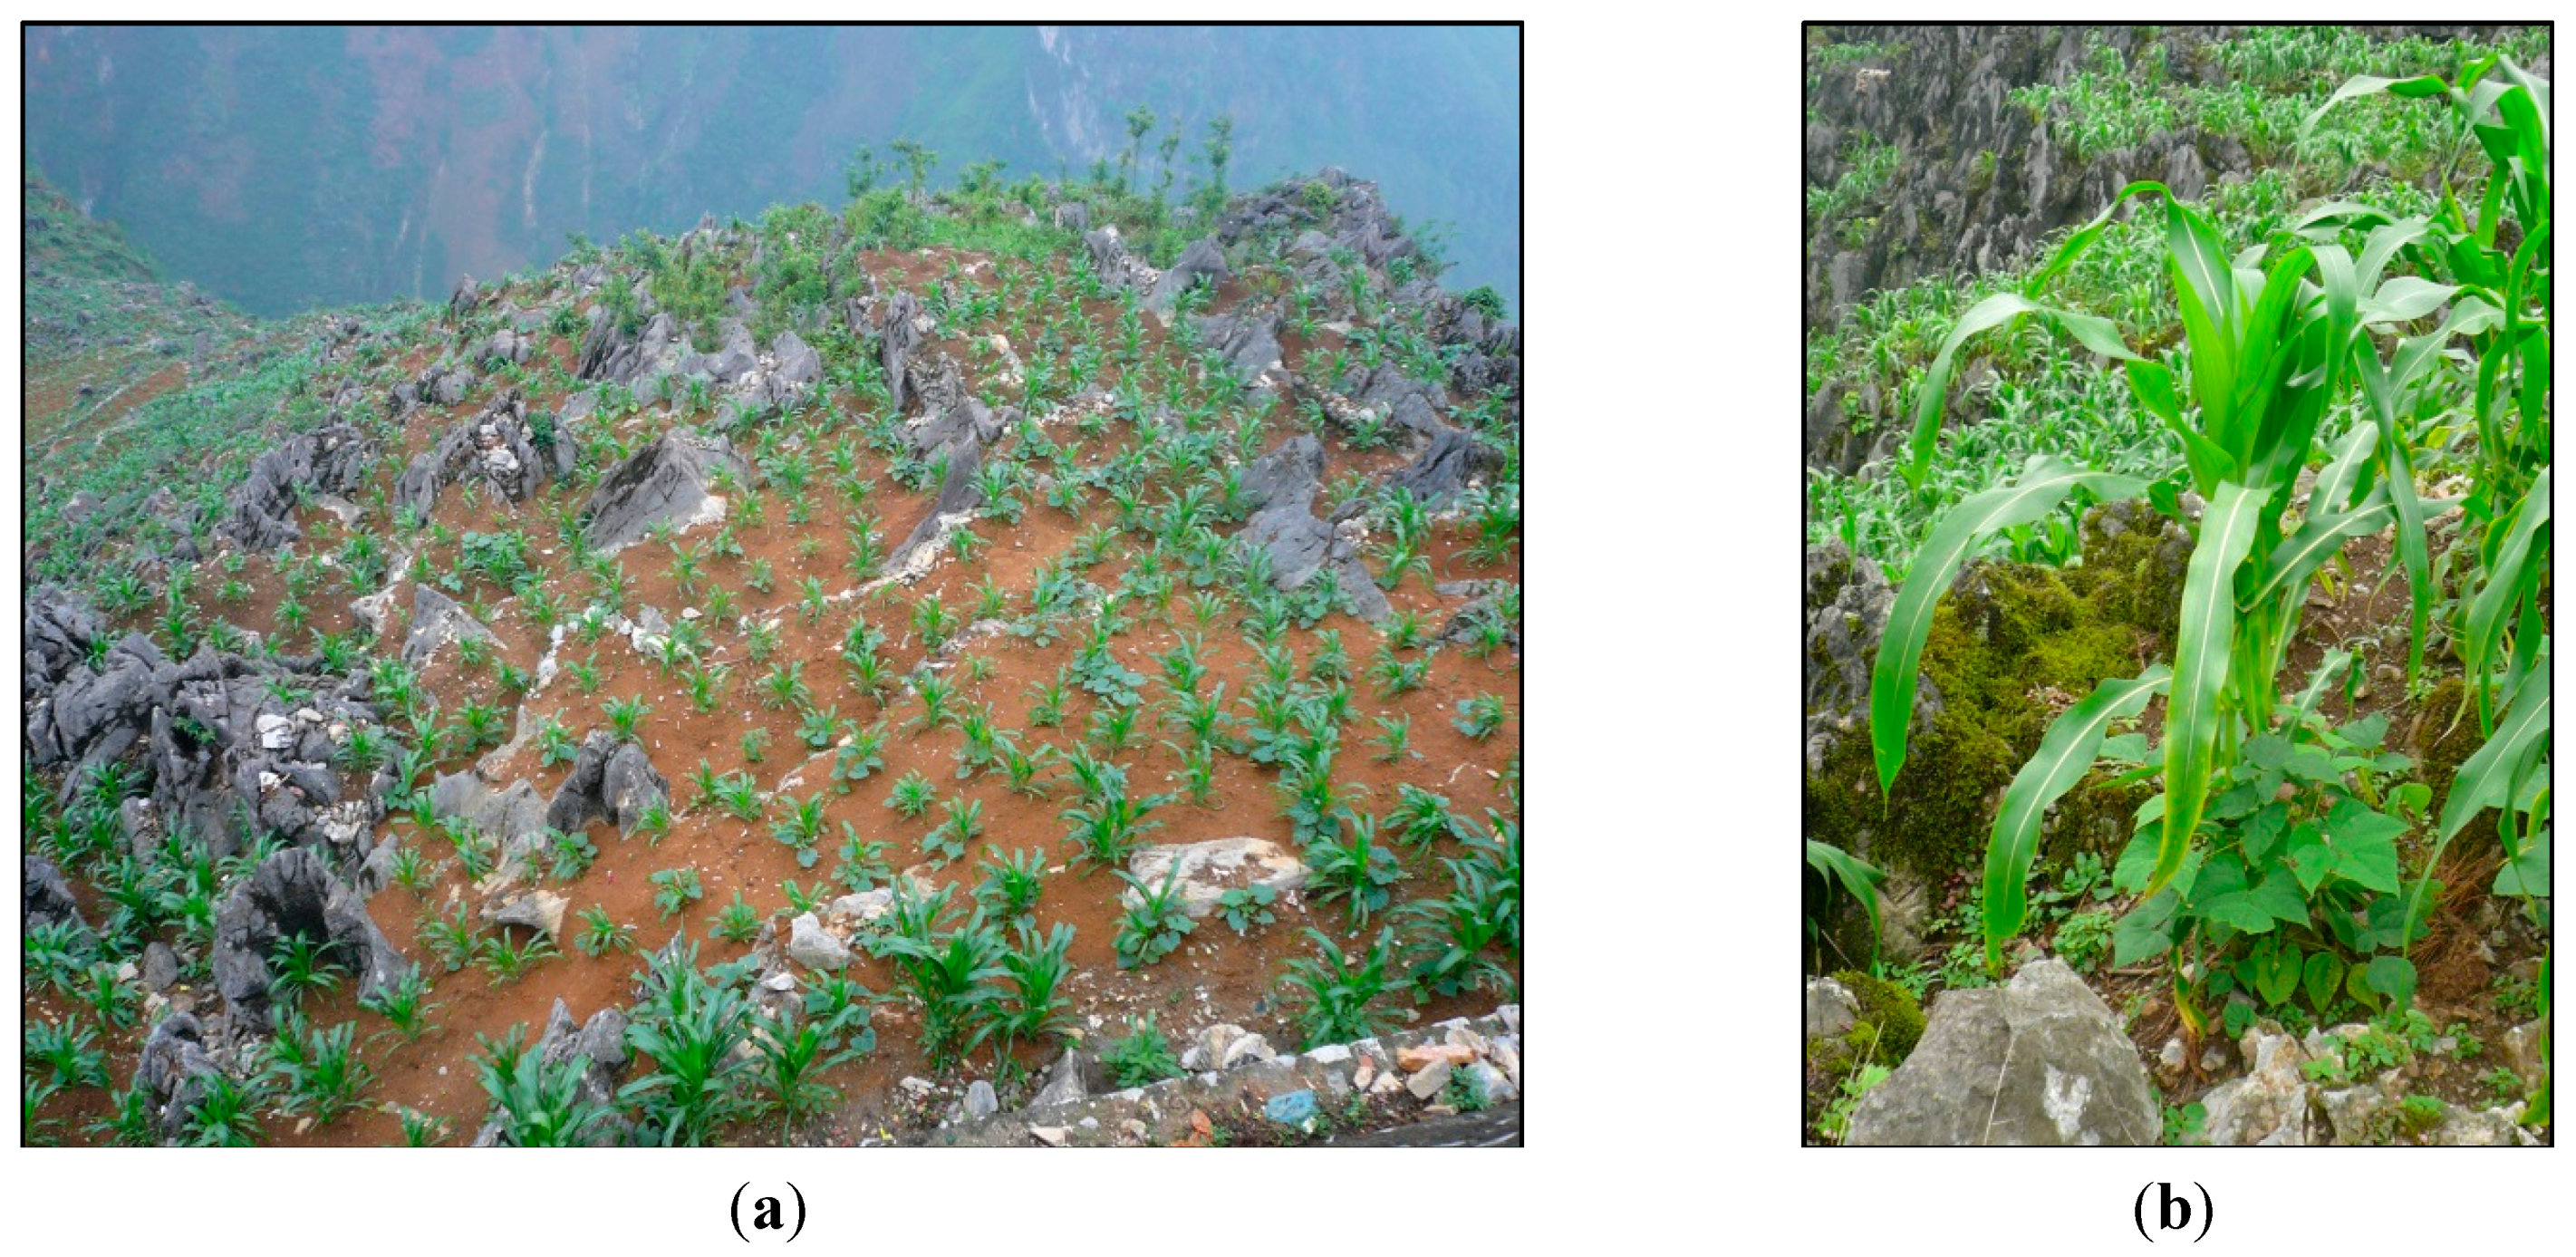
5.1.3. When Geomorphology Tests Livelihood Limits: Đồng Văn District, Hà Giang Province
6. Discussion: Market Integration, State Policies, and Land-Use Change
7. Conclusions
Acknowledgments
Author Contributions
Conflicts of Interest
References
- Fox, J.; Rindfuss, R.R.; Walsh, S.J.; Mishra, V. People and the Environment: Approaches for Linking Household and Community Surveys to Remote Sensing and GIS; Kluwer Academic: Boston, MA, USA, 2003. [Google Scholar]
- Castella, J.-C.; Manh, P.H.; Kam, S.P.; Villano, L.; Tronche, N.R. Analysis of village accessibility and its impact on land use dynamics in a mountainous province of northern Vietnam. Appl. Geogr. 2005, 25, 308–326. [Google Scholar]
- Jakobsen, J.; Rasmussen, K.; Leisz, S.; Folving, R.; Quang, N.V. The effects of land tenure policy on rural livelihoods and food sufficiency in the upland village of Que, North Central Vietnam. Agric. Syst. 2007, 94, 309–319. [Google Scholar] [CrossRef]
- Chi, V.K.; van Rompaey, A.; Govers, G.; Vanacker, V.; Schmook, B.; Hieu, N. Land transitions in northwest Vietnam: An integrated analysis of biophysical and socio-cultural factors. Hum. Ecol. 2013, 41, 37–50. [Google Scholar] [CrossRef]
- Jadin, I.; Vanacker, V.; Hoang, H.T.T. Drivers of forest cover dynamics in smallholder farming systems: The case of northwestern Vietnam. Ambio 2013, 42, 344–356. [Google Scholar] [CrossRef] [PubMed]
- Lambin, E.F.; Meyfroidt, P. Land use transitions: Socio-ecological feedback versus socio-economic change. Land Use Policy 2010, 27, 108–118. [Google Scholar] [CrossRef]
- Chhabra, A.; Geist, H.; Houghton, R.A.; Haberl, H.; Braimoh, A.K.; Vlek, P.L.G.; Patz, J.; Xu, J.; Ramankutty, N.; Coomes, O.; Lambin, E.F. Multiple impacts of Land use/cover change. In Land Use and Land Cover Change: Local Processes and Global Impacts; Geist, H., Lambin, E., Eds.; Springer: Berlin, Germany, 2006; pp. 71–116. [Google Scholar]
- Xu, J.; Fox, J.; Melick, D.; Fujita, Y.; Jintrawet, A.; Jie, Q.; Thomas, D.; Weyerhaeuser, H. Land use transition, livelihoods, and environmental services in Montane Mainland Southeast Asia. Mt. Res. Dev. 2006, 26, 278–284. [Google Scholar]
- Aspinall, R.J.; Hill, M.J. Land Use Change: Science, Policy and Management; CRC Press: Boca Raton, FL, USA, 2008. [Google Scholar]
- Makalle, A.M.P.; Obando, J.; Bamutaze, Y. Effects of land use practices on livelihoods in the transboundary sub-catchments of the Lake Victoria Basin. Afr. J. Environ. Sci. Technol. 2008, 2, 309–317. [Google Scholar]
- Scott, J. The Art of Not Being Governed: An Anarchist History of Upland Southeast Asia; Yale University Press: New Haven, CT, USA, 2009. [Google Scholar]
- Glassman, J. Bounding the Mekong: The Asian Development Bank, China, and Thailand; University of Hawai’i Press: Honolulu, HI, USA, 2010. [Google Scholar]
- Turner, S. Under the state’s gaze: Upland trading-scapes on the Sino-Vietnamese border. Singap. J. Trop. Geogr. 2013, 34, 9–24. [Google Scholar] [CrossRef]
- Trincsi, K.; Hien, P.T.T.; Turner, S. Between state-led policies and mountains: Land use land cover change of ethnic minorities in Vietnam’s borderlands. Land Use Policy 2014, 41, 484–497. [Google Scholar] [CrossRef]
- Turner, S.; Bonnin, C.; Michaud, J. Frontier Livelihoods. Hmong in the Sino-Vietnamese Borderlands; University of Washington Press: Seattle, WA, USA, 2015. [Google Scholar]
- Douglass, M.; DiGregorio, M.; Bunjamin, W.; Pichaya, V.; Taniguchi, K. Poverty: From basic needs to entitlements in Vietnam during urban transition. In New Challenges for Sustainable Development in Millennia; Liu, C.H., Yeh, J.-R., Huang, C.-H., Eds.; CIER Press: Taipei, Taiwan, 2003; pp. 127–174. [Google Scholar]
- Brannstrom, C.; Vadjunec, J.M. Notes for avoiding a missed opportunity in sustainability science: Integrating land change science and political ecology. In Land Change Science, Political Ecology, and Sustainability; Brannstrom, C., Vadjunec, J.M., Eds.; Routledge: London, UK, 2013; pp. 1–23. [Google Scholar]
- Gutman, G.; Janetos, A.C.; Justice, C.O.; Moran, E.F.; Mustard, J.F.; Rindfuss, R.R.; Skole, D.; Turner, B.L., II; Cochrane, M.A. Land Change Science Observing, Monitoring and Understanding Trajectories of Change on the Earth’s Surface; Kluwer Academic: Dordrecht, The Netherlands, 2004. [Google Scholar]
- Rindfuss, R.R.; Walsh, S.J.; Turner, B.L., II; Fox, J.; Mishra, V. Developing a science of land change: Challenges and methodological issues. Proc. Natl. Acad. Sci. USA 2004, 101, 13976–13981. [Google Scholar]
- Turner, B.L., II; Lambin, E.F.; Reenberg, A. The emergence of land change science for global environmental change and sustainability. Proc. Natl. Acad. Sci. USA 2007, 104, 20666–20671. [Google Scholar]
- Geist, H.J.; Lambin, E.F. Proximate causes and underlying driving forces of tropical deforestation: Tropical forests are disappearing as the result of many pressures, both local and regional, acting in various combinations in different geographical locations. BioScience 2002, 52, 143–150. [Google Scholar] [CrossRef]
- López-Carr, D.; Davis, J.; Jankowska, M.M.; Grant, L.; López-Carr, A.C.; Clark, M. Space versus place in complex human–natural systems: Spatial and multi-level models of tropical land use and cover change (LUCC) in Guatemala. Ecol. Model. 2012, 229, 64–75. [Google Scholar] [CrossRef] [PubMed]
- Alvarez, R.R., Jr. The Mexican–US border: The making of an anthropology of borderlands. Annu. Rev. Anthropol. 1995, 24, 447–470. [Google Scholar] [CrossRef]
- Giersch, C.P. Asian Borderlands: The Transformation of Qing China’s Yunnan Frontier; Harvard University Press: Cambridge, MA, USA, 2006. [Google Scholar]
- Baker, J. Small Town Africa: Studies in Rural-Urban Interaction; Seminar Proceedings No. 23; Nordic Africa Institute: Uppsala, Sweden, 1990. [Google Scholar]
- Bonnin, C.; Turner, S. At what price rice? Food security, livelihood vulnerability, and state interventions in upland northern Vietnam. Geoforum 2012, 43, 95–105. [Google Scholar]
- Walker, R.; Homma, A.K.O. Land use and land cover dynamics in the Brazilian Amazon: An overview. Ecol. Econ. 1996, 18, 67–80. [Google Scholar] [CrossRef]
- Carvalho, G.O.; Nepstad, D.; McGrath, D.; de Carmen Vera Diaz, M.; Santilli, M.; Barros, A.C. Frontier expansion in the Amazon: Balancing development and sustainability. Environ. Sci. Policy Sustain. Dev. 2002, 44, 34–44. [Google Scholar] [CrossRef]
- Moller-Jensen, L.; Knudsen, M.H. Patterns of population change in Ghana (1984–2000): Urbanization and frontier development. GeoJournal 2008, 73, 307–320. [Google Scholar] [CrossRef]
- Dillman, C.D. Urban growth along Mexico’s northern border and the Mexican national border program. J. Dev. Areas 1970, 4, 487–508. [Google Scholar]
- Kusakabe, K. The politics of “opening up”: Female traders on borderlands of Cambodia, Laos, Thailand and Burma (Myanmar). In On the Border of State Power: Frontier in the Greater Mekong Sub-Region; Gainsborough, M., Ed.; Routledge: Abingdon, UK, 2008; pp. 60–74. [Google Scholar]
- Anderson, J.B.; Gerber, J. Fifty Years of Change on the US-Mexico Border: Growth, Development, and Quality of Life; University of Texas Press: Austin, TX, USA, 2009. [Google Scholar]
- Coxhead, I.; Shively, G.; Shuai, X. Development policies, resource constraints, and agricultural expansion on the Philippine land frontier. Environ. Dev. Econ. 2002, 7, 341–363. [Google Scholar] [CrossRef]
- Jepson, W. Producing a modern agricultural frontier: Firms and cooperatives in eastern Mato Grosso, Brazil. Econ. Geogr. 2006, 82, 289–316. [Google Scholar] [CrossRef]
- Agergaard, J.; Fold, N.; Gough, K.V. Global–local interactions: Socioeconomic and spatial dynamics in Vietnam’s coffee frontier. Geogr. J. 2009, 175, 133–145. [Google Scholar] [CrossRef]
- Eilenberg, M. Frontier constellations: Agrarian expansion and sovereignty on the Indonesian-Malaysian border. J. Peasant Stud. 2014, 41, 157–182. [Google Scholar] [CrossRef]
- De Koninck, R. The theory and practice of frontier development: Vietnam’s contribution. Asia Pac. Viewp. 2000, 41, 7–21. [Google Scholar] [CrossRef]
- Lary, D. Introduction. In The Chinese State at the Borders; Lary, D., Ed.; UBC Press: Vancouver, BC, Canada, 2007; pp. 1–10. [Google Scholar]
- Tan, S.B.-H. The struggle to control land grabbing: State formation on the Central Highlands frontier under the First Republic of Vietnam (1954–63). In On the Borders of State Power: Frontiers in the Greater Mekong Sub-Region; Gainsborough, M., Ed.; Routledge: Abingdon, UK, 2008; pp. 50–66. [Google Scholar]
- Ellis, F. Rural Livelihoods and Diversity in Developing Countries; Oxford University Press: Oxford, UK, 2000. [Google Scholar]
- Scoones, I. Livelihoods perspectives and rural development. J. Peasant Stud. 2009, 36, 171–196. [Google Scholar] [CrossRef]
- Bebbington, A. Capitals and capabilities: A framework for analysing peasant viability, rural livelihoods, and poverty. World Dev. 1999, 27, 2020–2044. [Google Scholar] [CrossRef]
- Long, N. Development Sociology: Actor Perspectives; Routledge: London, UK, 2001. [Google Scholar]
- Sen, A. The Standard of Living; Cambridge University Press: Cambridge, UK, 1987. [Google Scholar]
- Turner, S. Making a living the Hmong way: An actor-oriented livelihoods approach to everyday politics and resistance in upland Vietnam. Ann. Assoc. Am. Geogr. 2012, 102, 403–422. [Google Scholar] [CrossRef]
- McCusker, B.; Carr, E. The co-production of livelihoods and land use change: Case studies from South Africa and Ghana. Geoforum 2006, 37, 790–804. [Google Scholar] [CrossRef]
- Rigg, J. Land, farming, livelihoods, and poverty: Rethinking the links in the rural South. World Dev. 2006, 34, 180–202. [Google Scholar] [CrossRef] [Green Version]
- General Statistics Office of Vietnam. The 2009 Vietnam Population and Housing Census: Completed Results; Central Population and Housing Census Steering Committee: Hanoi, Vietnam, 2010.
- Dien, K. Population and Ethno-demography in Vietnam; Silkworm: Chiang Mai, Thailand, 2002. [Google Scholar]
- MacKerras, C. Ethnic minorities in China. In Ethnicity in Asia; MacKerras, C., Ed.; RoutledgeCurzon: London, UK, 2003. [Google Scholar]
- Michaud, J. Historical Dictionary of the Peoples of the Southeast Asian Massif; Scarecrow Press: Lanham, MD, USA, 2006. [Google Scholar]
- Leisz, S.J.; Ha, N.T.T.; Yen, N.T.B.; Lam, N.T.; Vien, T.D. Developing a methodology for identifying, mapping and potentially monitoring the distribution of general farming system types in Vietnam’s northern mountain region. Agric. Syst. 2005, 85, 340–363. [Google Scholar] [CrossRef]
- Corlin, C. Hmong and the land question in Vietnam: National policy and local concepts of the environment. In Hmong/Miao in Asia; Tapp, N., Michaud, J., Culas, C., Lee, G.Y., Eds.; Silkworm: Chiang Mai, Thailand, 2004; pp. 295–320. [Google Scholar]
- World Bank. Vietnam Development Report 2008: Social Protection; World Bank: Washington, DC, USA, 2008. [Google Scholar]
- Sikor, T. Forest policy reform in Vietnam: From state to household forestry. In Stewards of Vietnam’s Upland Forests; Poffenberger, M., Ed.; Asian Forestry Network: Berkley, CA, USA; Hanoi, Vietnam, 1998; pp. 18–38. [Google Scholar]
- McElwee, P. Reforesting “bare hills” in Vietnam: Social and environmental consequences of the 5 Million Hectare Reforestation Program. Ambio 2009, 38, 325–333. [Google Scholar] [CrossRef] [PubMed]
- McElwee, P. Becoming socialist or becoming Kinh? Government policies for ethnic minorities in the Socialist Republic of Vietnam. In Civilizing the Margins: Southeast Asian Government Policies for the Development of Minorities; Duncan, C., Ed.; Cornell University Press: Ithaca, NY, USA, 2004; pp. 182–213. [Google Scholar]
- Hardy, A. Red Hills: Migrants and the State in the Highlands of Vietnam; Nordic Institute of Asian Studies Monographs: Copenhagen, Denmark, 2005. [Google Scholar]
- Clement, F.; Amezaga, J.M. Linking reforestation policies with land use change in northern Vietnam: Why local factors matter. Geoforum 2008, 39, 265–277. [Google Scholar] [CrossRef]
- Castella, J.C.; Boissau, S.; Thanh, N.H.; Novosad, P. Impact of forestland allocation on land use in a mountainous province of Vietnam. Land Use Policy 2006, 23, 147–160. [Google Scholar] [CrossRef]
- Clement, F.; Orange, D.; Williams, M.; Mulley, C.; Epprecht, M. Drivers of afforestation in Northern Vietnam: Assessing local variations using geographically weighted regression. Appl. Geogr. 2009, 29, 561–576. [Google Scholar] [CrossRef]
- Meyfroidt, P.; Lambin, E.F. The causes of the reforestation in Vietnam. Land Use Policy 2008, 25, 182–197. [Google Scholar] [CrossRef]
- Sikor, T. The allocation of forestry land in Vietnam: Did it cause the expansion of forests in the northwest? For. Policy Econ. 2001, 2, 1–11. [Google Scholar] [CrossRef]
- Müller, D.; Munroe, D.K. Tradeoffs between rural development policies and forest protection: Spatially explicit modeling in the Central Highlands of Vietnam. Land Econ. 2005, 81, 412–425. [Google Scholar] [CrossRef]
- Leisz, S.J. Dynamics of land cover and land use changes in the upper Ca river basin of Nghe An, Vietnam. Southeast Asian Stud. 2009, 47, 287–308. [Google Scholar]
- Dao, M.T.; Kono, Y.; Yanagisawa, M.; Leisz, S.J.; Kobayashi, S. Linkage of forest policies and programs with land cover and land use changes in the Northern mountain region of Vietnam: A village-level case study. Southeast Asian Stud. 2009, 47, 244–262. [Google Scholar]
- Pham, T.T.H.; Turner, S.; Trincsi, K. Applying a systematic review to land use land cover change in northern upland Vietnam: The missing case of the borderlands. Geogr. Res. 2015. [Google Scholar] [CrossRef]
- Cuc, L.T.; Rambo, T. Bright Peaks, Dark Valleys. Bright Peaks, Dark Valleys: A Comparative Analysis of Environmental and Social Conditions and Development Trends in Five Communities in Vietnam’s Northern Mountain Region; The National Political Publishing House: Hanoi, Vietnam, 2001. [Google Scholar]
- Greene, J.C. Mixed Methods in Social Inquiry; Jossey-Bass: San Francisco, CA, USA, 2007. [Google Scholar]
- Meyfroidt, P.; Lambin, E.F. Forest transition in Vietnam and its environmental impacts. Glob. Change Biol. 2008, 14, 1319–1336. [Google Scholar] [CrossRef]
- Anderson, J.R. A Land Use and Land Cover Classification System for Use with Remote Sensor Data; US Government Printing Office: Arlington, VA, USA, 1976.
- Hurni, K.; Hett, C.; Epprecht, M.; Messerli, P.; Heinimann, A.A. Texture-based land cover classification for the delineation of a shifting cultivation landscape in the Lao PDR using landscape metrics. Remote Sens. 2013, 5, 3377–3396. [Google Scholar] [CrossRef]
- Cassidy, L.; Binford, M.; Southworth, J.; Barnes, G. Social and ecological factors and land-use land-cover diversity in two provinces in Southeast Asia. J. Land Use Sci. 2010, 5, 277–306. [Google Scholar] [CrossRef]
- Baatz, M.; Hoffman, C.; Willhauck, G. Progressing from object-based to object-oriented image analysis. In Object-Based Image Analysis: Spatial Concepts for Knowledge-Driven Remote Sensing Applications; Blaschke, T., Lang, S., Hay, G.J., Eds.; Springer: Berlin, Germany, 2008; pp. 29–42. [Google Scholar]
- Dorren, L.K.A.; Maier, B.; Seijmonsbergen, A.C. Improved Landsat-based forest mapping in steep mountainous terrain using object-based classification. For. Ecol. Manag. 2003, 183, 31–46. [Google Scholar] [CrossRef]
- Vieira, M.A.; Formaggio, A.R.; Rennó, C.D.; Atzberger, C.; Aguiar, D.A.; Mello, M.P. Object based image analysis and data mining applied to a remotely sensed Landsat time-series to map sugarcane over large areas. Remote Sens. Environ. 2012, 123, 553–562. [Google Scholar] [CrossRef]
- Puyravaud, J.P. Standardizing the calculation of the annual rate of deforestation. For. Ecol. Manag. 2003, 177, 593–596. [Google Scholar] [CrossRef]
- People’s Committee of Lào Cai. Quy hoạch tổng thể phát triển kinh tế - xã hội tỉnh Lào Cai đến năm 2020 [The 2020 Lào Cai economic development plan], 2008. Available online: http://laocai.gov.vn/thongtinktxh/dinhhuongphattrien/quyhoachphattrienktxh/Trang/634046199107564190.aspx (accessed on 27 September 2015).
- Socialist Republic of Vietnam. Của Chính Phủ Số 36/2000/Nđ-Cp Ngày 18 Tháng 8 Năm 2000 Về Việc Điều Chỉnh Địa Giới Hành Chính Huyện Bắc Hà Để Tái Lập Huyện Si Ma Cai, Tỉnh Lào Cai [Decree No. 36/2000 / ND-CP of August 18, 2000 of the Government on the adjustment of administrative boundaries of Bắc Hà district to reestablish Si Ma Cai District, Lào Cai Province], 2000. Available online: http://thuvienphapluat.vn/archive/Nghi-dinh/Nghi-dinh-36-2000-ND-CP-dieu-chinh-dia-gioi-hanh-chinh-huyen-Bac-Ha-de-tai-lap-huyen-Si-Ma-Cai-tinh-Lao-Cai-vb46707t11.aspx (accessed on 27 September 2015).
- Socialist Republic of Vietnam. Nghị định số 42/2009/NĐ-CP. Về việc phân loại đô thị [Decree 42/2009/ND-CP 7th May, 2009 on the grading of urban centers], 2009. Available online: http://www.moj.gov.vn/vbpq/en/_layouts/printeng.aspx?id=10670 (accessed on 27 September 2015).
- Socialist Republic of Vietnam. Về Việc Điều Chỉnh Địa Giới Hành Chính Để Thành Lập Đơn Vị Hành Chính Cấp Xã, Cấp Huyện Thuộc Tỉnh Lai Châu [Adjustments of administrative boundaries to establish Administrative Units at the commune and district Levels, Lai Châu Province], 2012. Available online: http://thuvienphapluat.vn/archive/Nghi-quyet-71-NQ-CP-nam-2012-dieu-chinh-dia-gioi-hanh-chinh-de-thanh-lap-don-vi-vb150870.aspx (accessed on 27 September 2015).
- General Statistics Office of Vietnam. Socio-economical Statistical Data of 63 Provinces and Cities; Statistical Publishing House: Hanoi, Vietnam, 2009.
- General Statistics Office of Vietnam. The 1999 Vietnam Population and Housing Census: Completed Results; Central Population and Housing Census Steering Committee: Hanoi, Vietnam, 2000.
- Bui, T.M.H.; Schreinemachers, P.; Berger, T. Hydropower development in Vietnam: Involuntary resettlement and factors enabling rehabilitation. Land Use Policy 2013, 31, 536–544. [Google Scholar] [CrossRef]
- International Rivers Network. Planned Dams in Vietnam, 2001. Available online: http://www.internationalrivers.org/de/resources/planned-dams-in-vietnam-4079 (accessed on 27 September 2015).
- Socialist Republic of Vietnam. Về Việc Thành Lập Thị Xã Lai Châu Và Thành Lập Thị Trấn Thuộc Các Huyện Tam Đường, Phong Thổ, Tỉnh Lai Châu [On the establishment of the township of Lai Châu and district headtowns of Tam Đường, Phong Thổ, Lai Châu province], 2004. Available online: http://thuvienphapluat.vn/archive/Nghi-dinh/Nghi-dinh-176-2004-ND-CP-thanh-lap-thi-xa-Lai-Chau-va-thanh-lap-thi-tran-thuoc-cac-huyen-Tam-Duong-Phong-Tho-tinh-Lai-Chau-vb5530t11.aspx (accessed on 27 September 2015).
- VietnamNews. PM Okays Establishment of Lai Châu City. 30 December 2013. Available online: http://vietnamnews.vn/domestic-press-highlights/249576/pm-okays-establishment-of-lai-chau-city.html (accessed on 27 September 2015).
- Resettlement Problems Put Hydro-Plant behind Schedule. VietnamNews. 21 August 2014. Available online: http://vietnamnews.vn/society/259092/resettlement-problems-put-hydro-plant-behind-schedule.html (accessed on 27 September 2015).
- General Statistics Office of Vietnam. Results of the 2006 Rural, Agricultural and Fishery Census; Statistical Publishing House: Hanoi, Vietnam, 2007.
- Turner, S. “Forever Hmong”: Ethnic minority livelihoods and agrarian transition in upland northern Vietnam. Prof. Geogr. 2012, 64, 540–553. [Google Scholar] [CrossRef]
- Novellino, D. Indigenous highlands in transition: The case of Hà Giang Province in northern Vietnam. Land Reform: Land Settl. Coop. Bull. 2000, 2, 94–107. [Google Scholar]
- Kyeyune, V. Yielding to High Yields: Hybrid Maize and Food Security in Hà Giang Province, Northern Vietnam. Master’s Thesis, McGill University, Montreal, Canada, 2014. [Google Scholar]
- Duncan, C. Civilizing the Margins. Southeast Asian Government Policies for the Development of Minorities; Cornell University Press: Ithaca, NY, USA, 2004. [Google Scholar]
- Socialist Republic of Vietnam. Hiến Pháp Nước Cộng Hòa Xã Hội Chủ Nghĩa Việt Nam (Sửa Đổi) [The Constitution of the Socialist Republic of Vietnam (Amended)]; Socialist Republic of Vietnam: Hanoi, Vietnam, 2013. [Google Scholar]
- Turner, S.; Michaud, J. Imaginative and adaptive economic strategies for Hmong livelihoods in Lào Cai Province, northern Vietnam. J. Vietnam. Stud. 2008, 2, 154–186. [Google Scholar] [CrossRef]
- Alther, C.; Castella, J.C.; Novosad, P.; Rousseau, E.; Hieu, T.T. Impact of accessibility on the range of livelihood options available to farm households in mountainous areas of northern Viet Nam. In Doi Moi in the Mountains: Land Use Changes and Farmers’ Livelihood Strategies in Bac Kan Province, Vietnam; Castella, J.C., Quang, D.D., Eds.; The Agricultural Publishing House: Hanoi, Vietnam, 2001; pp. 121–146. [Google Scholar]
- Evans, G.; Hutton, C.; Eng, K.K. Where China Meets Southeast Asia: Social and Cultural Change in the Border Regions; St Martin’s Press: New York, NY, USA, 2000. [Google Scholar]
- Meyfroidt, P.; Vu, T.P.; Hoang, V.A. Trajectories of deforestation, coffee expansion and displacement of shifting cultivation in the Central Highlands of Vietnam. Glob. Environ. Change 2013, 23, 1187–1198. [Google Scholar]
- Zhang, B.Q. 云南省边境口岸物流发展状况分析: 以河口口岸为例 [Analyzing logistics development at border crossing points in Yunnan: A case study on Hekou Border Crossing Point]. J. Manag. 2014, 27, 48–52. [Google Scholar]
- Geoghegan, J.; Pritchard, L., Jr.; Ogneva-Himmelberger, Y.; Roy Chowdhury, R.; Sanderson, S.; Turner, B.L., II. “Socializing the pixel” and “pixelizing the social” in land-use and land-cover change. In People and Pixels. Linking Remote Sensing and Social Science; Liverman, D., Moran, E.F., Rindfuss, R.R., Stern, P.C., Eds.; National Academy Press: Washington, DC, USA, 1998; pp. 51–69. [Google Scholar]
- Kull, C.A. Politicizing land use change in highland Madagascar: Struggles with air photo analyses and conservation agendas. In Land Change Science, Political Ecology, and Sustainability; Brannstrom, C., Vadjunec, J.M., Eds.; Routledge: London, UK, 2013; pp. 66–83. [Google Scholar]
- Turner, S. Red Stamps and Gold Stars. Fieldwork Dilemmas in Upland Socialist Asia; UBC Press: Vancouver, BC, Canada, 2013. [Google Scholar]
- Oxfam. Growing a Better Future: Expanding Rights and Choices for Small-scale Farmers in Viet Nam, Brochure; Oxfam: Hanoi, Vietnam, 2012. [Google Scholar]
- Mackenzie, C.A.; Christensen, J.; Turner, S. Advocating beyond the academy: Dilemmas of communicating relevant research results. Qual. Res. 2015, 15, 105–121. [Google Scholar] [CrossRef]
- 1These years correspond with the last two national censuses completed for Vietnam (1999 and 2009), and the most unobstructed satellite images available. They also cover a dynamic time in the contemporary political and economic history of the uplands.
- 2An increasing number of young ethnic minority women have been trafficked to China to become wives for rural farmers there. A common kidnapping approach is for a young man—often from the same ethnicity and posing as a friend of a friend—to lure a young woman to Lào Cai City on his motorbike ‘to have fun’; she is then abducted and taken over the border (interviews with Hmong and Yao youth, 2009, 2014).
- 3In 2004–2005, when former Lai Châu Province was split into Lai Châu and Điện Biên, former Lai Châu Town was renamed Mường Lay Town, now part of the new province of Điện Biên. Most of this town is now under the reservoir for the Sơn La dam.
© 2015 by the authors; licensee MDPI, Basel, Switzerland. This article is an open access article distributed under the terms and conditions of the Creative Commons Attribution license (http://creativecommons.org/licenses/by/4.0/).
Share and Cite
Turner, S.; Pham, T.-T.-H. “Nothing Is Like It Was Before”: The Dynamics between Land-Use and Land-Cover, and Livelihood Strategies in the Northern Vietnam Borderlands. Land 2015, 4, 1030-1059. https://doi.org/10.3390/land4041030
Turner S, Pham T-T-H. “Nothing Is Like It Was Before”: The Dynamics between Land-Use and Land-Cover, and Livelihood Strategies in the Northern Vietnam Borderlands. Land. 2015; 4(4):1030-1059. https://doi.org/10.3390/land4041030
Chicago/Turabian StyleTurner, Sarah, and Thi-Thanh-Hiên Pham. 2015. "“Nothing Is Like It Was Before”: The Dynamics between Land-Use and Land-Cover, and Livelihood Strategies in the Northern Vietnam Borderlands" Land 4, no. 4: 1030-1059. https://doi.org/10.3390/land4041030
APA StyleTurner, S., & Pham, T.-T.-H. (2015). “Nothing Is Like It Was Before”: The Dynamics between Land-Use and Land-Cover, and Livelihood Strategies in the Northern Vietnam Borderlands. Land, 4(4), 1030-1059. https://doi.org/10.3390/land4041030