Article

Detection of Shoreline and Land Cover Changes around Rosetta Promontory, Egypt, Based on Remote Sensing Analysis

1
Department of Environmental Engineering, Egypt-Japan University of Science and Technology (E-JUST), New Borg El-Arab, Alexandria 21934, Egypt
2
Department of Mechanical and Environmental Informatics, Tokyo Institute of Technology, Ookayama 2-12-1-W8-13, Meguro-Ku, Tokyo 152-8552, Japan
3
Coastal Research Institute, Alexandria 21514, Egypt
*
Author to whom correspondence should be addressed.
These authors contributed equally to this work.
Land 2015, 4(1), 216-230; https://doi.org/10.3390/land4010216
Submission received: 28 December 2014 / Revised: 5 February 2015 / Accepted: 27 February 2015 / Published: 17 March 2015
(This article belongs to the Special Issue A Land Use Perspective of the Safeguarding Coastal Areas)

Abstract

:
Rosetta Promontory, Egypt has been suffering from a continuous erosion problem. The dramatic retreatment was observed during the last century. It is basically due to the construction of Aswan High Dam in 1964, which reduced the flow and sediment discharges. In this paper, four Landsat images (two Thematic Mapper and two Enhanced Thematic Mapper) covering the period from 1984 to 2014 were used. These Landsat images were radio-metrically and geometrically corrected, and then, multi-temporal post-classification analysis was performed to detect land cover changes, extracting shoreline positions to estimate shoreline change rates of the Nile delta coast around Rosetta Promontory. This method provides a viable means for examining long-term shoreline changes. Four categories, including seawater, developed (agriculture and urban), sabkhas (salt-flat), and undeveloped areas, were selected to evaluate their temporal changes by comparing the four selected images. Supervised classification technique was used with support vector machine algorithm to detect temporal changes. The overall accuracy assessment of this method ranged from 97% to 100%. In addition, the shoreline was extracted by applying two different techniques. The first method is based on a histogram threshold of Band 5, and the other uses the combination of histogram threshold of Band 5 and two band ratios (Band2/Band4 and Band2/Band5). For land cover change detection from 1984 to 2014, it was found that the developed area that increased by 9% although the land in the study area has been contracted by 1.6% due to coastal erosion. The shoreline retreat rate has decreased more than 70% from 1984 to 2014. Nevertheless, it still suffers from significant erosion with a maximum rate of 37 m/year. In comparison to ground survey and different remote sensing techniques, the established trend of shoreline change extracted using histogram threshold was found to be closely consistent with these studies rather than combining band ratio with histogram threshold.

1. Introduction

Coastal zone monitoring is an important task in sustainable development and environmental protection. Land use and land cover changes have become a central component in current strategies for managing natural resources and monitoring environmental changes [1]. Therefore, detection and measurement of terrain and land cover changes for coastal zones is an important task in environmental monitoring, since shoreline variations have a direct impact on economic development and land management [2,3]. Similar to other delt as worldwide, the Nile Delta has been experiencing significant shoreline erosion due to natural and anthropogenic factors. This change from a zone of accumulation to one of depletion is attributed primarily to the construction of seven barrages along the Nile, from Aswan to the lower Delta, Aswan Low Dam in 1902 and the Aswan High Dam (AHD) in 1964 [4,5]. The barrages and dams have a marked control on the magnitude of peak discharges from the river and have virtually eliminated sediment delivery to the coast since its construction. The actual quantity of Nile surplus reaching the Mediterranean annually after construction of AHD amounts to 2.5–4 km3. Almost all of this water passes through the northern delta lakes and other land effluents connected to the sea, instead of flowing through the main Nile branches.
Remote Sensing plays an important role in spatial data acquisition from an economic perspective [6]. Optical images are simple to interpret and easily obtainable. Furthermore, absorption of infrared wavelength of water and its strong reflectance by vegetation and soil make such images an ideal combination of mapping the spatial distribution of land and water. Therefore, the images containing visible and infrared band shave been widely used for coast line mapping [7].
Accurate and up-to-date information on shoreline changes positions can help researchers in a large range of coastal studies such as the erosion-accretion aspects, coastal defense designing, prediction of shoreline future positions, vulnerable areas, coastal protection, and sustainable coastal resources management [8,9,10,11].Change detection is the process of identifying differences in the state of a feature or a phenomenon by observing it at different times [12]. The advantages of using remote sensing may include the large ground coverage of satellite images, the multiple spectral information, the temporal resolution of satellite data, the digital format of the images and the extending long period of the satellite data archives [13].
There are several techniques for change detection using digital images that have been implemented to monitor coastal area, see [12,14]. Change detection of satellite data ranges from visual comparison to complex image processing schemes. Common change detection techniques include simple band ratio, principal component analysis, vegetation index algorithms, and others. Major data sources include MSS, TM, ETM, Systeme Pourl’Observation de la Terre (SPOT), moderate resolution imaging spectroradiometer (MODIS), advanced very high resolution radiometer (AVHRR), and other sensors [15]. Post classification change detection is a famous technique applied to address thematic changes in satellite data. The advantage of using this approach is its applicability to data from different sensors with a high degree of confidence [16]. In addition, post-classification comparison proved to be an effective technique, because datasets from two or more dates are independently classified, thereby minimizing problems arising from atmospheric correction and/or sensor degradation [17]. In order to analyze the coastal processes and develop predictive models, rates of shoreline changes are required [18]. Analysis of different remote sensing images, including Landsat MSS, TM, ETM+ and Spot satellite along parts of the Nile Delta has identified areas of erosion followed by beach accretion [18,19,20,21,22,23]. Numerous studies were carried out to evaluate the shoreline change along Rosetta Promontory. For example, a previous study [24] reported that Rosetta Promontory lost 14.7 km2 between 1909 and 1988. In addition, MSS data was used to monitor the shoreline at Rosetta Promontory between 1972 and 1987 in [21]. They concluded that Rosetta Promontory was subjected to both degradation and aggradation processes. Also, changes in the shoreline of the Nile Delta were assessed based on a field survey for beach profile at 65 positions along the coastline of the Nile Delta. Consequently, the results evaluated the average annual rate of shoreline retreatment along the Rosetta Promontory to be as much as 106 m/year between 1971 and 1990 [25].
Moreover, the changes in Nile Delta coastline during the period between 1984 and 1991 from three TM images were detected using region growing image segmentation algorithm technique [23]. Hence, the results revealed that Rosetta Promontory experienced a rapid rate of change during the period 1984–1991, which was estimated to be 113.8 mannually during this period.
In addition, the detailed temporal variations for the advances and retreats of the shoreline between 1500 and 2000 were diagramed [26], and it was concluded that the shoreline retreat at Rosetta was estimated to be 20 m/year from 1941 to 1964. This rate accelerated to 120 m/year after 1964 until 1990 as a result of the construction of the Aswan High Dam. Moreover, the change occurred at Rosetta Promontory until 2008 was studied in [
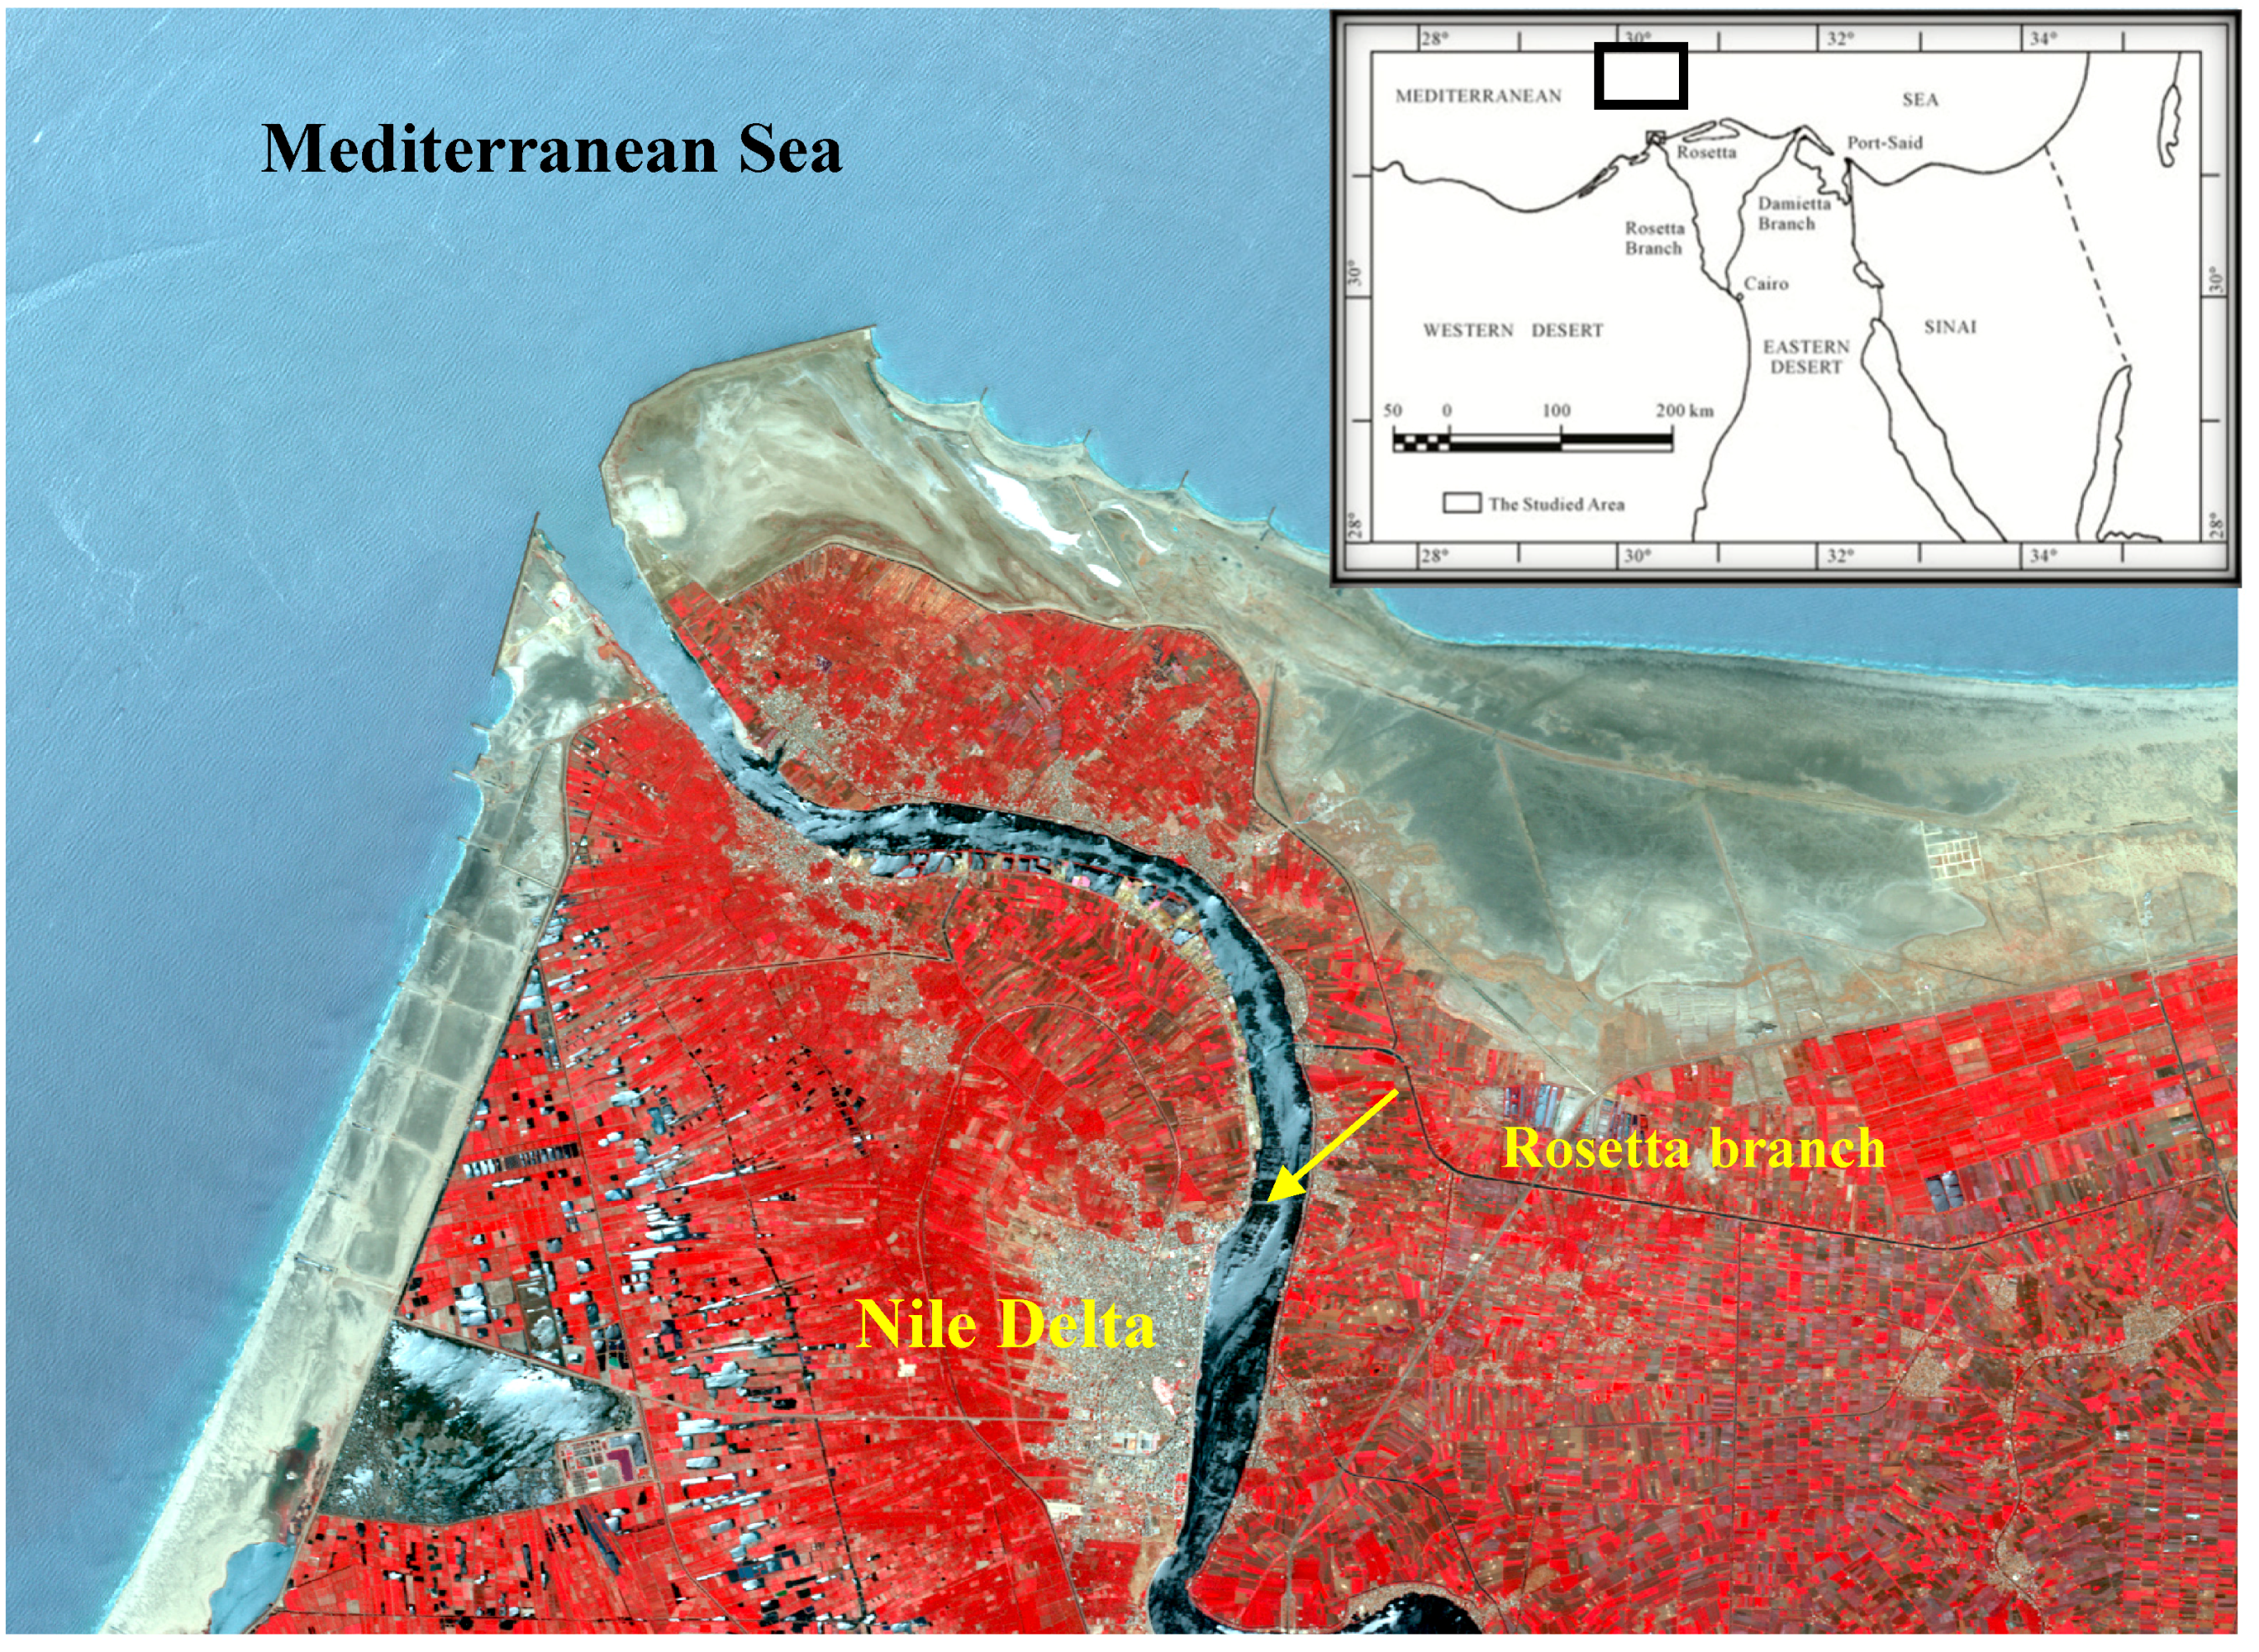
15]; taking into account the impact of the constructed coastal protection measures upon erosion/accretion patterns. In this study, four Landsat satellite images with 5–9 years apart are used in a post-classification analysis to map the changes, which occurred at Rosetta Promontory due to coastal erosion.
The main objective of the recent study is to investigate the erosion/accretion areas, patterns, and its rates along the Rosetta Promontory through employing shoreline extraction techniques, and compare erosion rates with those collected from previous studies. Furthermore, land cover change detection is performed to address the impact of the shoreline variations on the economic development and land management.

2. Materials and Methods

2.1. Study Site

The study area of Rosetta Promontory lies on the northwestern Nile delta coast and extends about 16 km east, 13 km west, 4 km north, and 11 km south referenced to the tip of the promontory (Figure 1). The promontory is one of the most important areas for monitoring beach erosion, since it is used for transportation, agriculture, and fishing activities. The environmental problem represented in sedimentation inside the inlet, and the continuous erosion that began after the construction of the Aswan High Dam [4,27,28].
Figure 1. Study area, Rosetta Promontory at the terminal of Rosetta branch, SPOT image, 2012.
Land 04 00216 g001

2.2. Dataset

The image data was acquired at unequal intervals between 1984 and 2014, covering a time span of 30 years. The images have been acquired in summer season and in good quality, with no effective clouds. Four satellite images were acquired as shown in Table 1: two from the Landsat TM (30 m spatial resolution) acquired in 1984 and 1990; two Landsat ETM (30 m spatial resolution) acquired in 2005 and 2014. All image scenes were subjected to image processing using ENVI software version 4.8.
Table 1. Details of the satellite images used in this study.
Acquired DateSpacecraftID/SensorPath/RowPixel Size (m)Coordinate System/DatumZone
26 August 1984Landsat_5/TM177/3830UTM/WGS 8436
3 August 1990Landsat_4/TM177/3830UTM/WGS 8436
13 September 2005Landsat_7/ETM177/3830UTM/WGS 8436
4 July 2014Landsat_7/ETM177/3830UTM/WGS 8436
Assessing the impacts of the shoreline changes in the land cover pattern entails developing a geo-database for the study area and delineating the shorelines at different points of time. Ageo-database for the study area was built based on a digital topographic map for the study area scale 1:50,000 sheet no. NH36-M1d (Rosetta).

2.3. Image Pre-Processing

Firstly, all images were checked against any defects such as striping. The images of 2005, and 2014 already had gaps in all bands. Then, gaps were filled for the two images as shown in Figure 2. All images were clipped to include our study area. After that, all images were corrected geometrically and radiometrically.
Figure 2. (A) Landsat image (2005) before striping removal; and (B) after striping removal.
Land 04 00216 g002

2.3.1. Geometric Correction

According to the metadata documentation, the TM, and ETM+ images used in this study are ortho-rectified products. They are indeed in the World Geodetic System (WGS84) datum and the Universal Transverse Mercator (UTM) projection system. The assessment of the geometric quality of the images by superimposing linear objects such as (road intersections, prominent geomorphologic features and river channels) permitted to observe significant discrepancies in the images. So, it was better to geo-reference all images sets using digital topographic maps (1:50,000) to rectify all satellite images [11,15].
Using ENVI 4.8 software, the topographic map in a digital format produced in 1993 was firstly geo-referenced and rectified to a common UTM coordinate system. It was used as a base map to geo-reference the Landsat image acquired in 1990 through image to map referencing. Then, the Landsat TM image in 1990 was considered as the master image that was utilized to register the other images through image-to-image registration. A total of at least 20 ground control points (GCP) was examined and matched with all images. These points included: road intersections, prominent geomorphologic features and river channels. After rectification, the route mean square error (RMSE) was found not to exceed 0.5 pixels, revealing a high geometric matching of the images. The RMSE could be defined as the deviations between GCP and GP location as predicted by the fitted-polynomial and their actual locations. Figure 3 shows the distribution of the ground control points on the Landsat image in 1990.
Figure 3. (A) Landsat image (1990) after clipping; (B) distribution of ground control points at the image(1990); and (C) a rectified digitized road map considered as the base map to geo-reference Landsat (1990), then the Landsat image (1990) was used as the master image for the other images.
Land 04 00216 g003

2.3.2. Radiometric Correction

To achieve an accurate radiometric correction, first, the atmospheric scattering correction was performed on the images using the dark-object subtraction method to correct any atmospheric interference caused by haze, dust or smoke [11]. Then, the current radiometric correction was implemented in one step using radiometric correction tool in ENVI software, which combines the sun and view angle effects, and the sensor calibration with the atmospheric correction. The needed parameters (offset/gain, sun elevation, and satellite viewing angles) are included with the Landsat metadata documentation.

2.4. Image Classification

One of the most important applications of satellite remote sensing is to detect changes in land cover to discern those areas on digital images that change features of interest between two or more dates [1]. Training well-known sites based on the field trips and spectral signatures of land and water in the region was used to identify each class. To make a suitable classification, all the spectral bands within the TM and ETM images (1984, 2005 and 2014) except the thermal bands have been utilized in the classification process.
The supervised classification by support vector machine algorithm was implemented in the classification of the three images into four land cover classes which are recognized as follows; seawater, developed areas (agriculture, urban), sabkhas, and undeveloped areas. The classified images were then refined using 3 × 3 majority/minority analysis to remove odd pixels in the classified matrix and reduce noise in the output maps.

2.5. Shoreline Extraction

Shoreline delineation through remote sensing techniques relies on the varied spectral behavior or spectral response of water and other land surfaces at different wavelengths. Generally, water bodies absorb most of the radiation in near-infrared and mid-infrared regions of the spectrum. Hence, the reflectance of water is almost equal to zero in these wavelengths; meanwhile, the reflectance of various land covers in both regions is higher than water.
According to this concept, coastline can be extracted from a single band image, since the reflectance of water is nearly equal to zero in the reflective infrared bands. This can be achieved through estimating histogram threshold for one of the infrared bands of the TM or ETM+ imagery [2].According to the histogram threshold technique, water bodies can be separated from other land covers and shoreline is consequently delineated from Band 5 (mid-infrared) in TM and ETM+ images. However, such a method individually is not quite accurate in determining the shoreline; since the threshold value separating land and water could be any value at this transition zone and consequently is not easily identified from the histogram [2].
Another technique is to use band ratio method, which simultaneously uses two conditions of Band2/Band4 and Band2/Band5 for producing binary image 1[29]. Then, binary imageno.2 was developed later by using histogram threshold based on band 5. After that, the image no 3 was produced by multiplying the last two base images. Finally, the last stage includes converting raster to vector in order to extract the shoreline.
In this study, the previous two techniques were used to compare the present results with the previous studies. The first is to apply only the histogram threshold of Band5. The second technique is to employ a combination of the histogram threshold of Band5 and two band ratios (Band2/Band4 and Band2/Band5) as shown in Figure 4. After developing the final binary image, it is processed in ArcGIS 10.1 (ESRI, RedLands, CA, USA) to display erosion/accretion patterns and calculate the annual retreatment rate along the shoreline at Rosetta Promontory.

3. Results and Analysis

3.1. Land Cover Classification, and Change Detection

The accuracy assessment of all land cover maps ranged from 0.97 to 1.0 for the producer and user accuracies as well as for the overall accuracy. The areas were computed for the land cover types in each of the classified images shown in Figure 5 in square kilometers. Table 2 shows descriptions for the land cover types used for the analysis of the study area.
Figure 4. Flow chart for extracting coastline from Landsat images using threshold histogram, and a combination of threshold histogram with band ratios.
Land 04 00216 g004
It is illustrated from the results that, seawater area has increased from 121.8 km2 in 1984 to 126.4 km2 in 2014. In another meaning, the eroded land during this period is about the difference between the two areas. In addition, the developed area (agriculture and urban) increased by 9%, which led to a decrease in the undeveloped area through advancing towards the sea. On the other hand, the sabkhas areas cover decreased due to the agriculture extension on both sides of the promontory, and also due to the construction of the coastal protection measures in front of the promontory.
Figure 5. Landuse supervised-classification for the different Land-sat images 1984, and 2014.
Land 04 00216 g005
Table 2. Area and percentage of change of different land cover classes of 1984 and 2014 classified images.
ClassesArea %Area(km2)Area Change %
1984201419842014(1984–2014)
1. Seawater43.9%45.5%121.8126.41.6%
2. Developed26.8%35.8%74.799.29%
3. Sabkhas7.8%4.7%21.613−3.1%
4. Undeveloped21.4%14.1%59.539−7.3%

3.2. Shoreline Extraction

After geometric and radiometric correction of the images, a final binary image was obtained by applying the two techniques mentioned previously in Figure 4. The comparison of the shoreline at different dates shows that the shoreline has retreated considerably between 1984 and 2014 due to the erosion process as illustrated in Figure 6. The retreat of the shoreline has stopped after the seawater became directly in contact with the seawalls at the eastern and western side of the promontory, which is because the seawalls were constructed inland.
Figure 7 shows the final binary images produced from the histogram threshold method, which separates land and water based on an accurate selection of the threshold value of the water reflectance. This step results in masking the land cover with all of its categories. The binary images were processed in ArcGIS10.1 software to extract the shoreline. Firstly, each image was converted from raster to vector (feature class) with two main polygon features; water and land. Secondly, the two polygon layers were overlaid to estimate shoreline erosion/accretion pattern sand areas in each period time 1984–1990, 1990–2005, and 2005–2014 as shown in Figure 8. Table 3 and Table 4 illustrate the eroded/accreted areas, and the net change using the two different techniques.
Figure 6. Shoreline changes in Rosetta Promontory between 1984 and 2014.
Land 04 00216 g006
Figure 7. The classified binary images for (A) 1984, and (B) 2014 for Rosetta Promontory.
Land 04 00216 g007
Table 3. Accreted and eroded areas at Rosetta Promontory between 1984 and 2014 using histogram threshold of Band 5.
DateArea (m2)Rate (km2/yr)Net of Change (km2/yr)
ErosionAccretionErosionAccretion
1984–19902,316,379.4660,115.70.390.110.28
1990–20054,217,649.41,214,363.10.280.080.20
2005–20141,841,526.9535,936.40.20.060.14
Figure 8. The post-classification change detection image, for (A) 1984–1990, (B) 1990–2005 and (C) 2005–2014 at Rosetta Promontory.
Land 04 00216 g008
Table 4. Accreted and eroded areas at Rosetta Promontory between 1984 and 2014 using combination of histogram threshold of Band 5 and Band ratio (B2/B5), (B2/B4).
DateArea (m2)Rate (km2/yr)Net of Change (km2/yr)
ErosionAccretionErosionAccretion
1984–19902,668,693.5736,974.60.440.120.32
1990–20054,939,785.91,204,332.30.330.080.25
2005–20141,798,655.8563,6520.20.060.14
It was found that the period from 1984 to 1990 was accompanied by significant erosion (0.43 km2/year).The seawalls in front of the promontory were not constructed yet. To reduce the erosion impacts at the Rosetta Promontory, two dolos seawalls (4 tons) were constructed between 1989 and 1991 on both sides of the Rosetta Nile branch mouth. The western and eastern seawalls were constructed inland extending alongshore to a length of 1.5 and 3.5 km, respectively. The seawalls stand 6.75 m above MSL, and vary in width from 48 to 70 m. Over the period 1990–1995, erosion continued in front of the seawalls until it reached the seawall in 2005, hence the retreatment vanished. Eroded areas vary spatially between eastern and western side of the promontory. It is clear that eroded areas at the eastern tip of the promontory are much larger than the western one. The erosion was basically at the tip of the promontory during the period 1984–2005, while it seems to be insignificant at the tip of the promontory after that due to the existence of seawalls. Then, the erosion extended to the down drift of the seawall. Although five groins were constructed in 1998 to stop the erosion created down drift of the eastern seawall, erosion continued in this area and extended eastward. From 2005 to 2010, nine groins were built at the down drift of the western seawall to stop erosion created at the end of the western seawall, nevertheless up till now, it has insignificant effect.
In conclusion, it was found that land in the study area contracted by 1.6% from 1984 to 2014 due to coastal erosion and the developed area increased about 9%. Even if the shoreline retreat decreased by more than 70% from 1984 to 2014, it still suffers from quite dramatic erosion with a maximum rate that reaches 37 m/year downdrift of the eastern seawalls. In comparison with ground survey and different remote sensing techniques, the established trend of shoreline change extracted using the histogram threshold method was found to be closely consistent with its results rather than combining band ratio with histogram threshold. This is clear by comparing the results of the two applied methods in Table 5 and Table 6 along with the results of the previous studies in Table 7.
Table 5. Maximum retreat of the shoreline at Rosetta Nile branch promontory through 1984 to 2014 using histogram threshold of Band 5.
DateMaximum Retreat (m)Annual Retreat (m/yr)
1984–1990770.8123.5
1990–2005785.852.4
2005–201433537.2
Table 6. Maximum retreat of the shoreline at Rosetta Nile branch promontory through 1984 to 2014 using combination of histogram threshold of Band 5 and Band ratio (B2/B5), (B2/B4).
DateMaximum Retreat (m)Annual Retreat (m/yr)
1984–1990784130.67
1990–200582454.9
2005–201433537.2
Table 7. Comparison between previous studies and the present one.
ResearchTime PeriodAnnual Retreat (m/yr)The Used Technique
[23]1984–1990113.8Image segmentation technique
[30]1984–1991128False color composite technique
1991–1995136
1995–1997125
1997–200080
[31]1984–199099.0Supervised classification using max. likelihood classifier(MLC)
1990–200855.0
Present study1984–1990123.5Histogram threshold
1990–200552.4
2005–201437.2

4. Conclusions

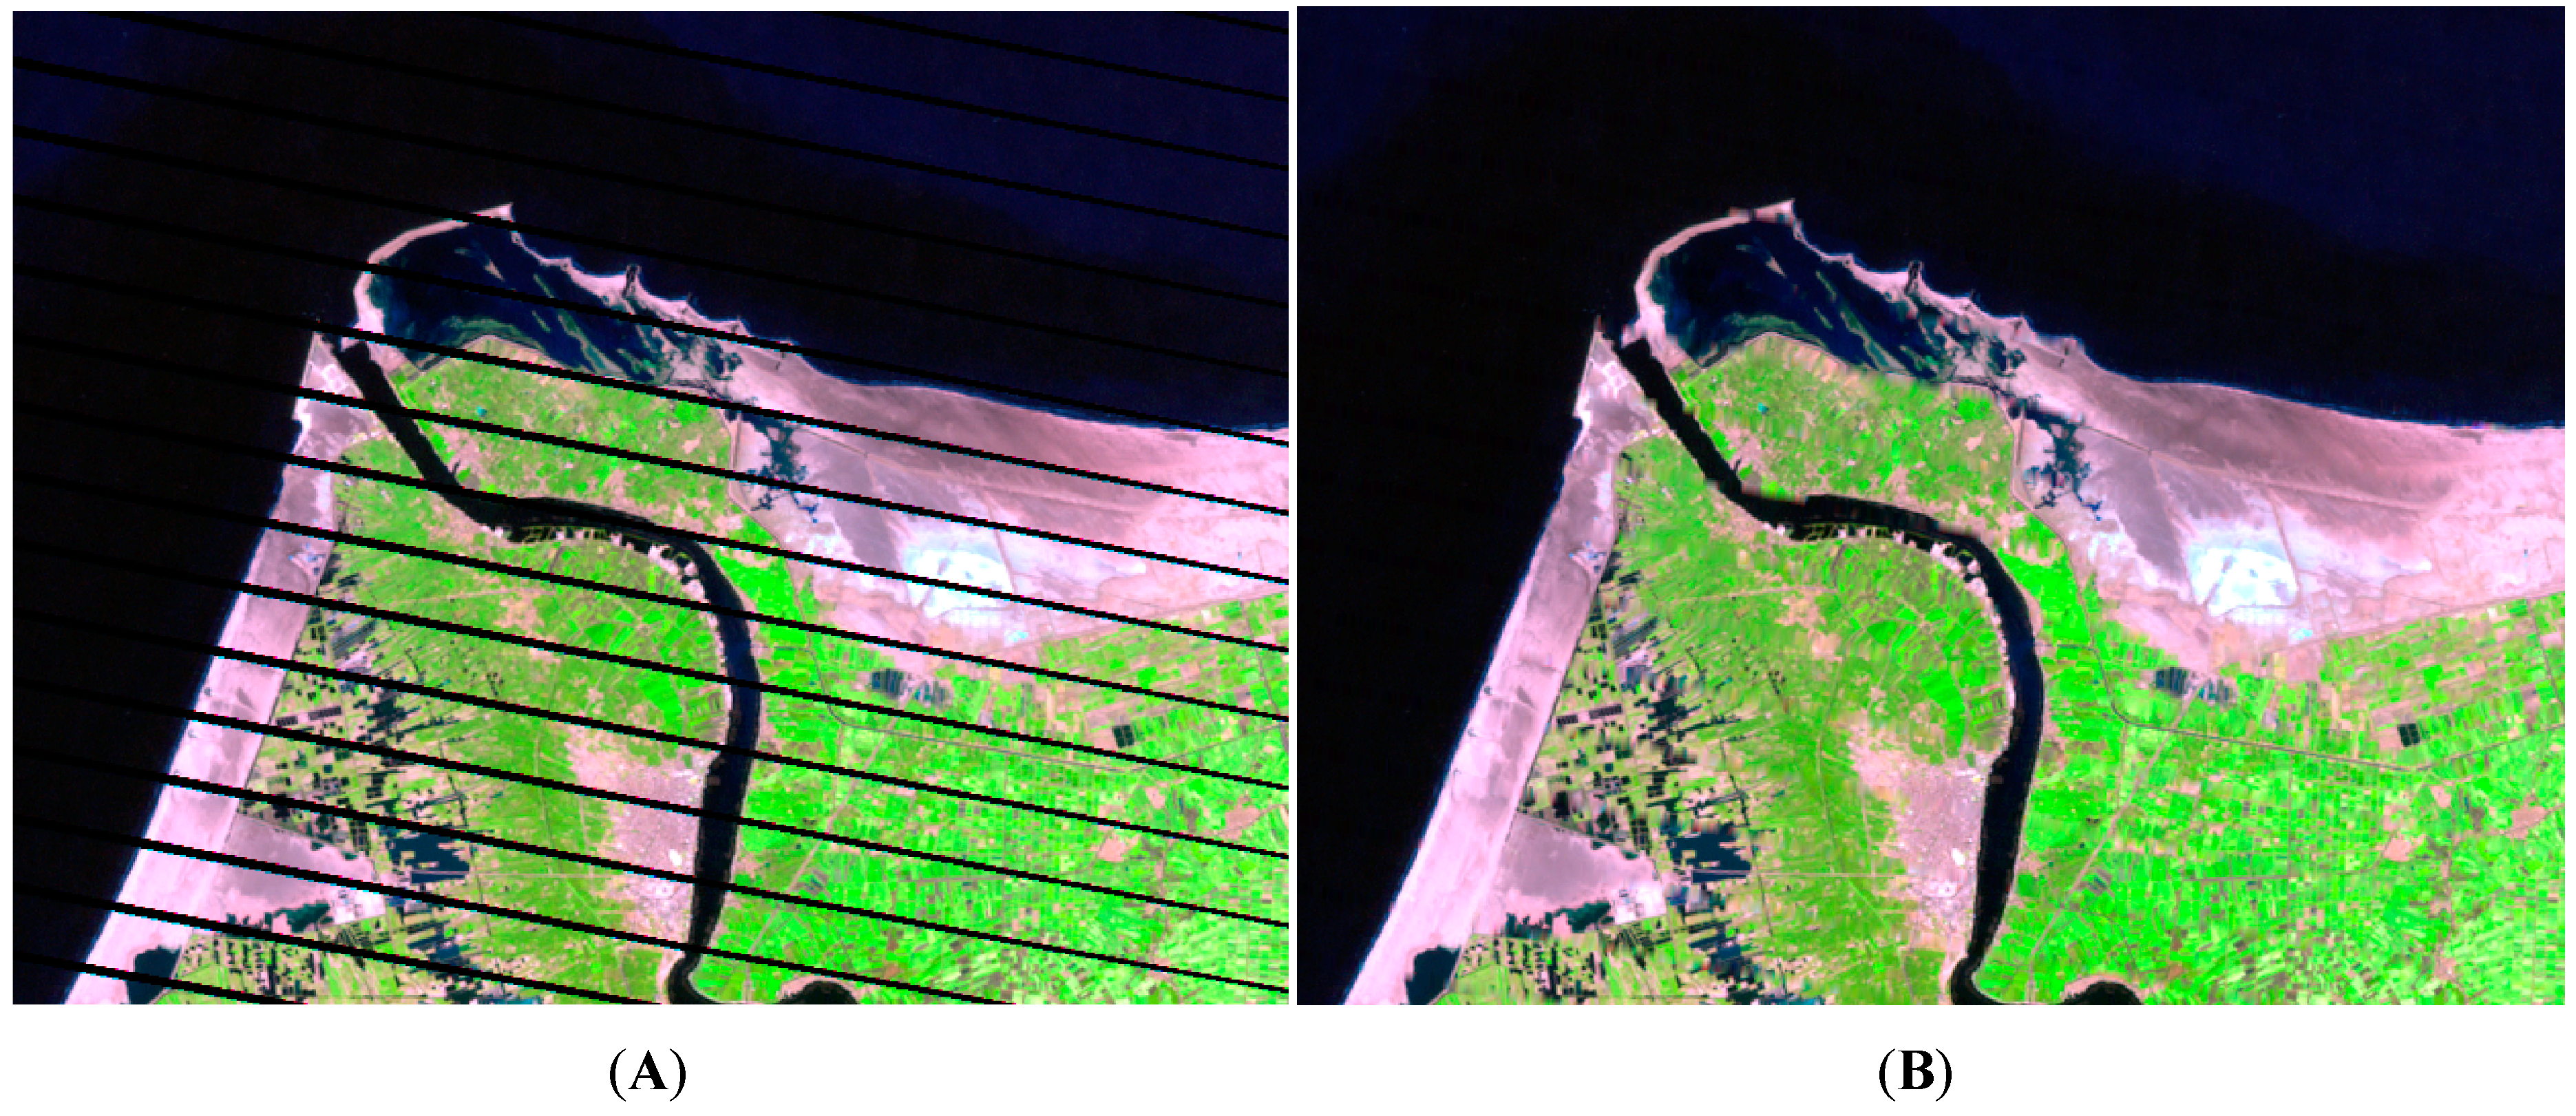
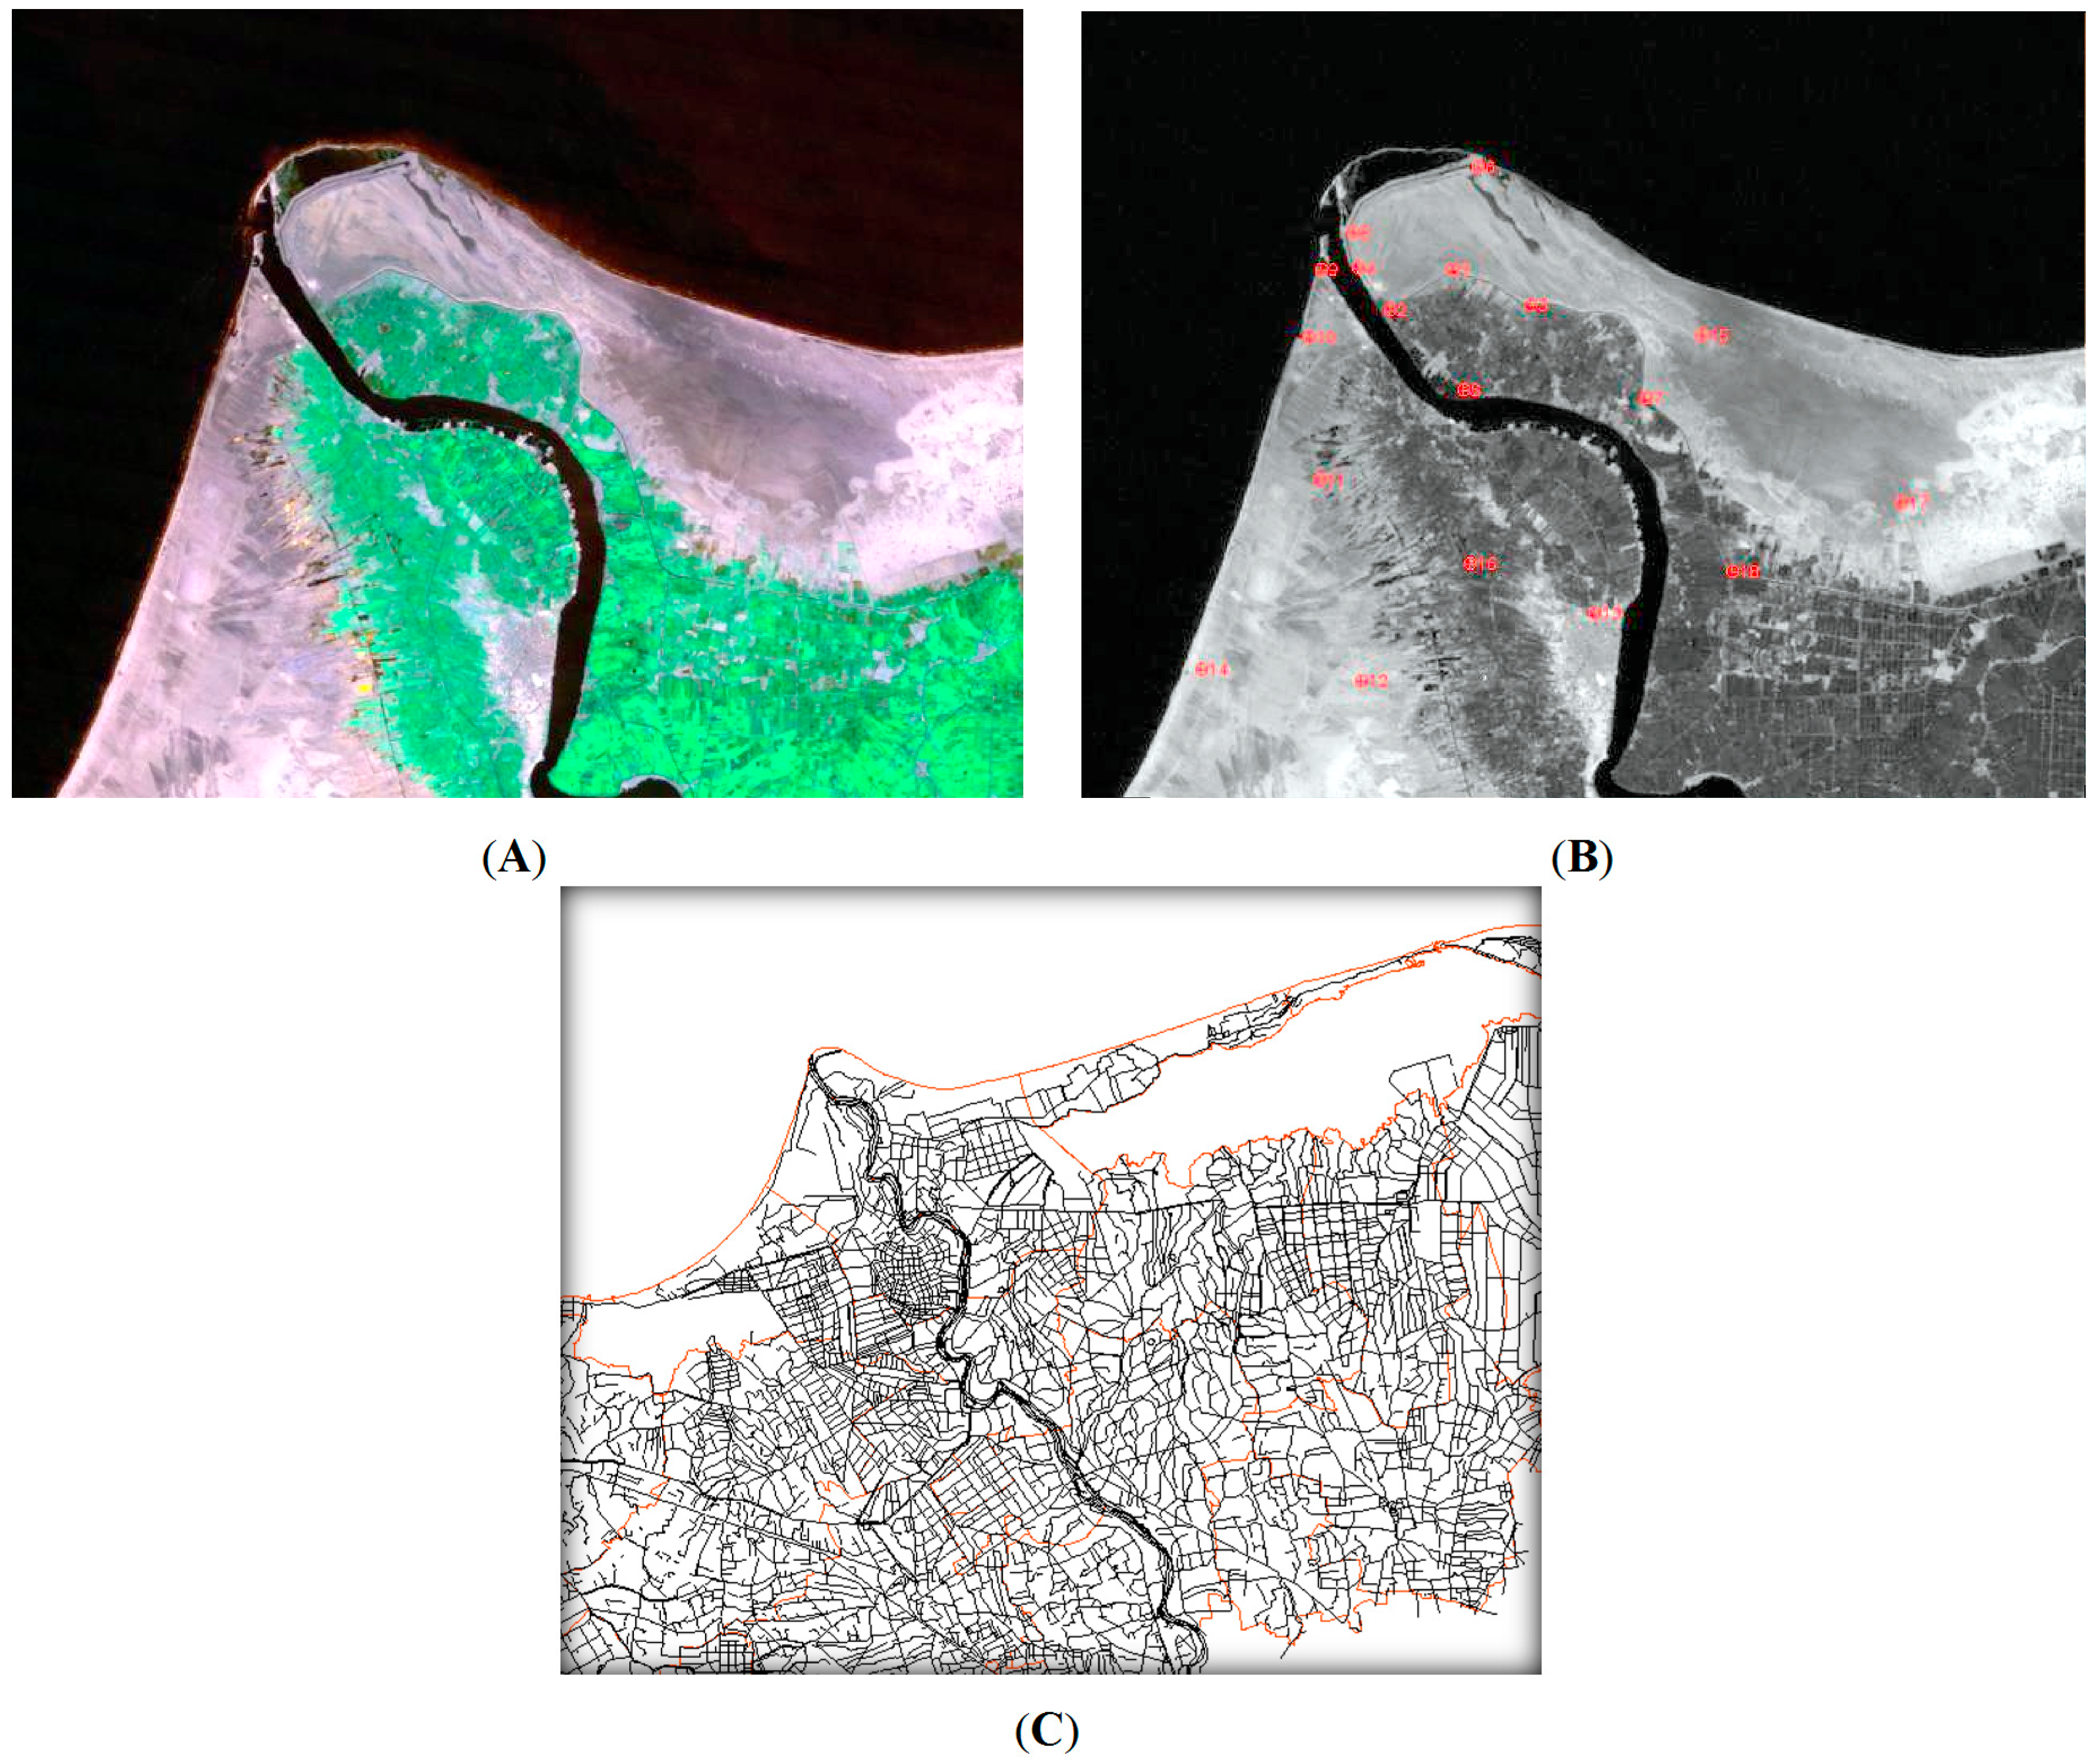
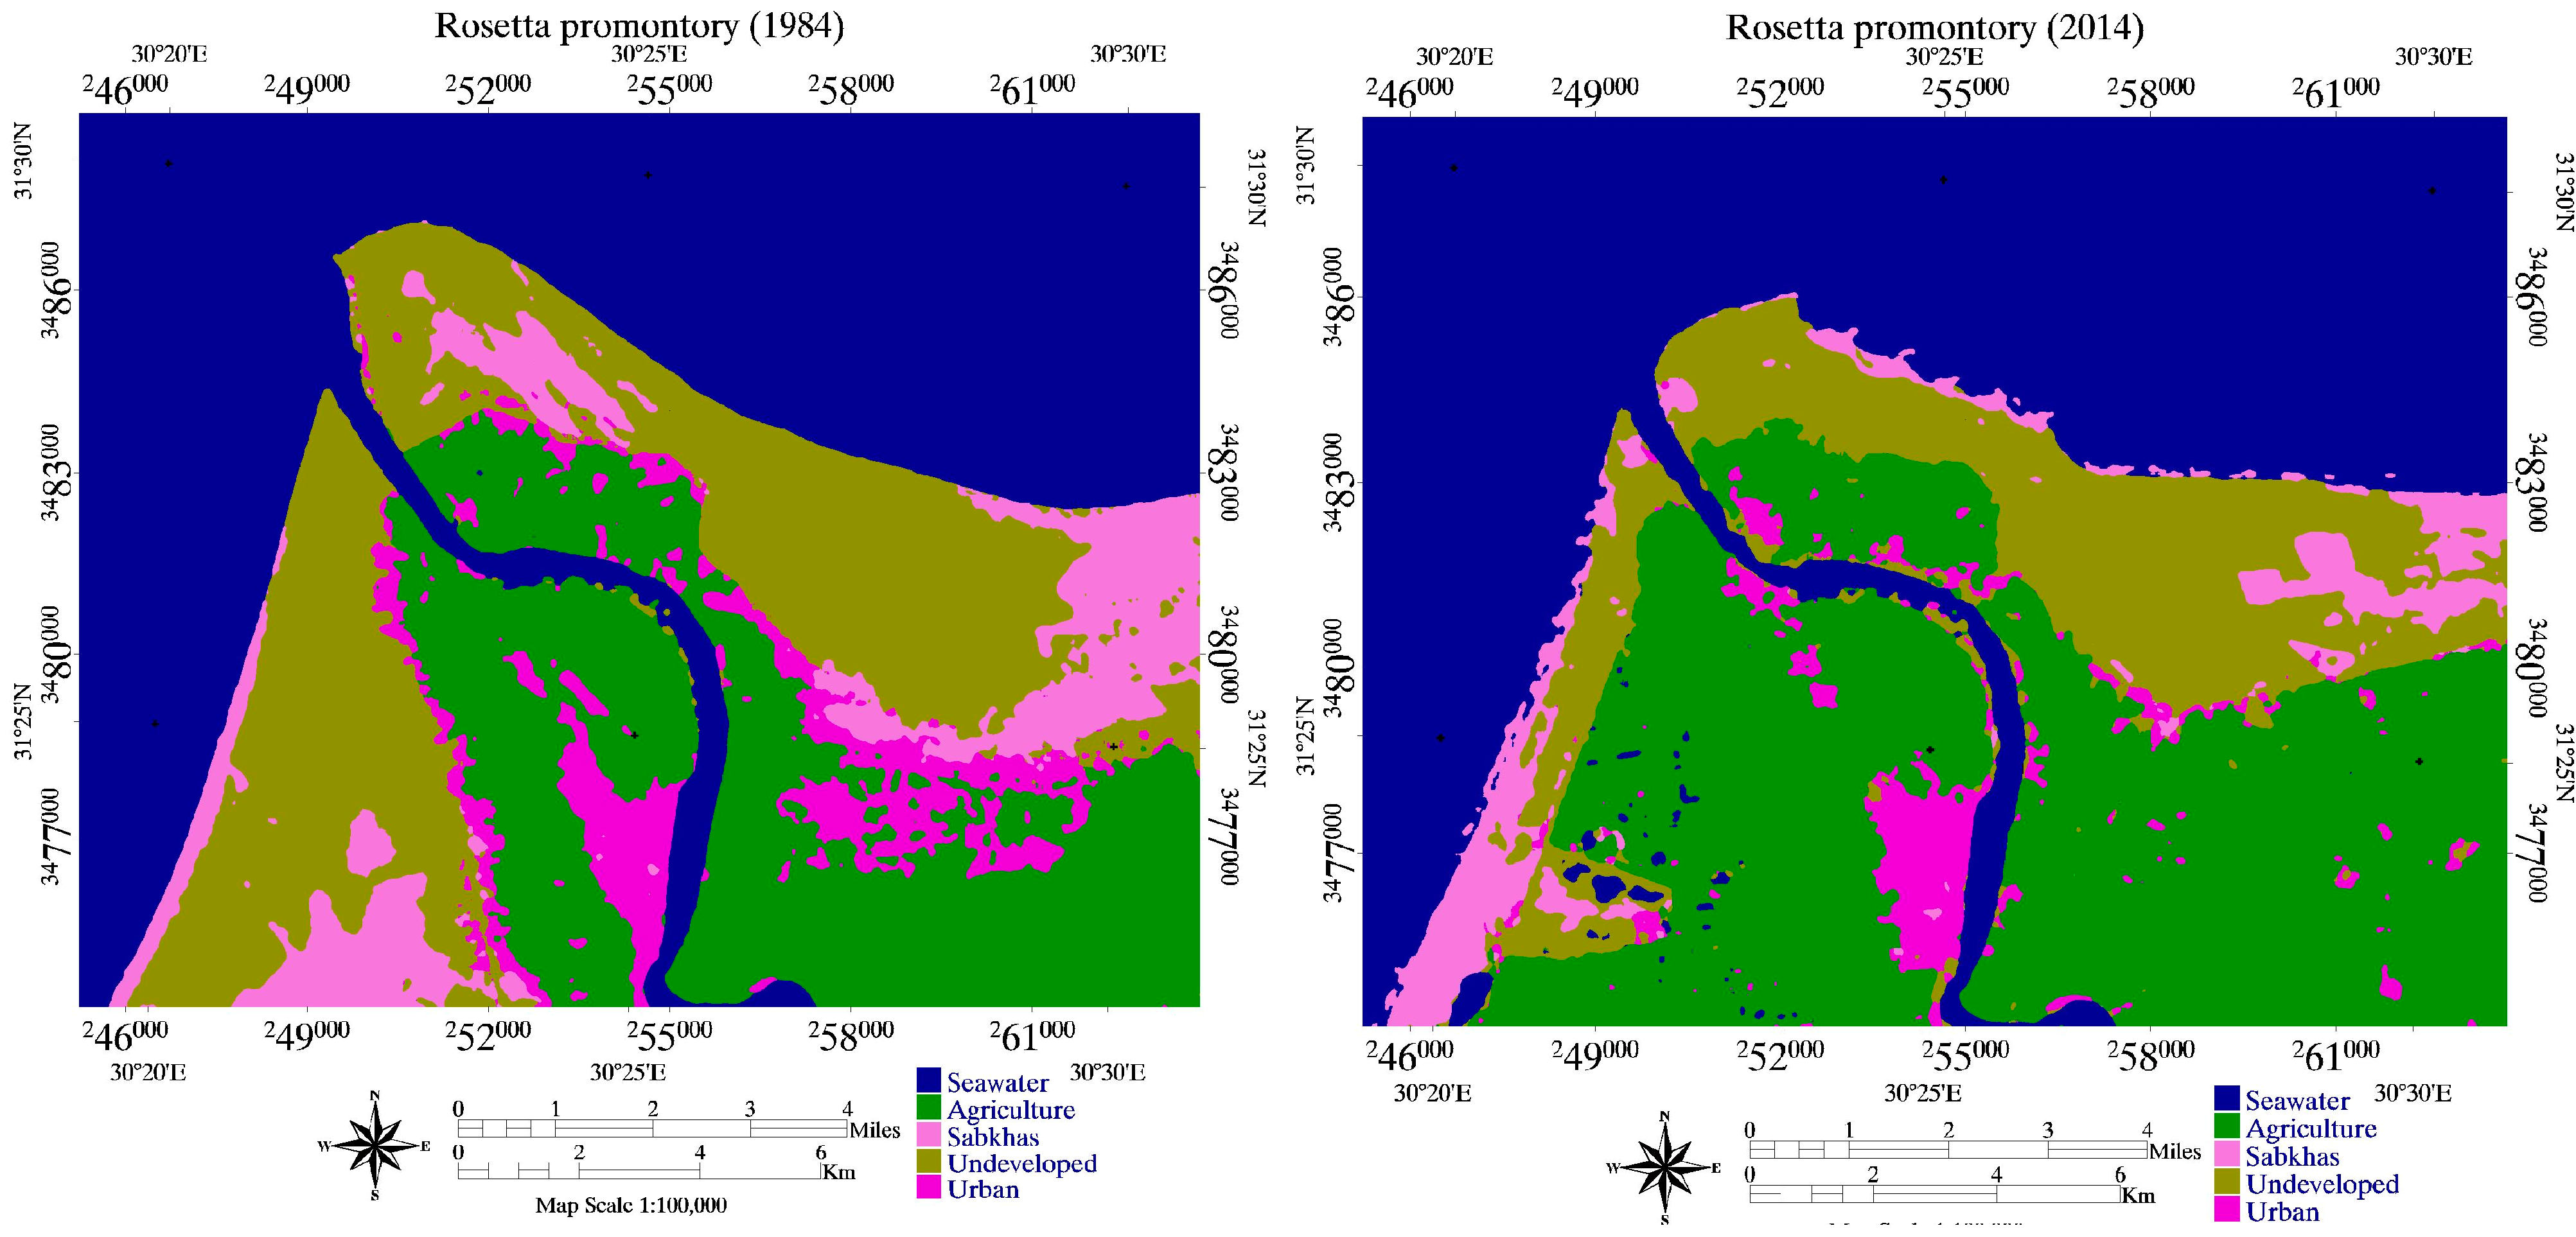
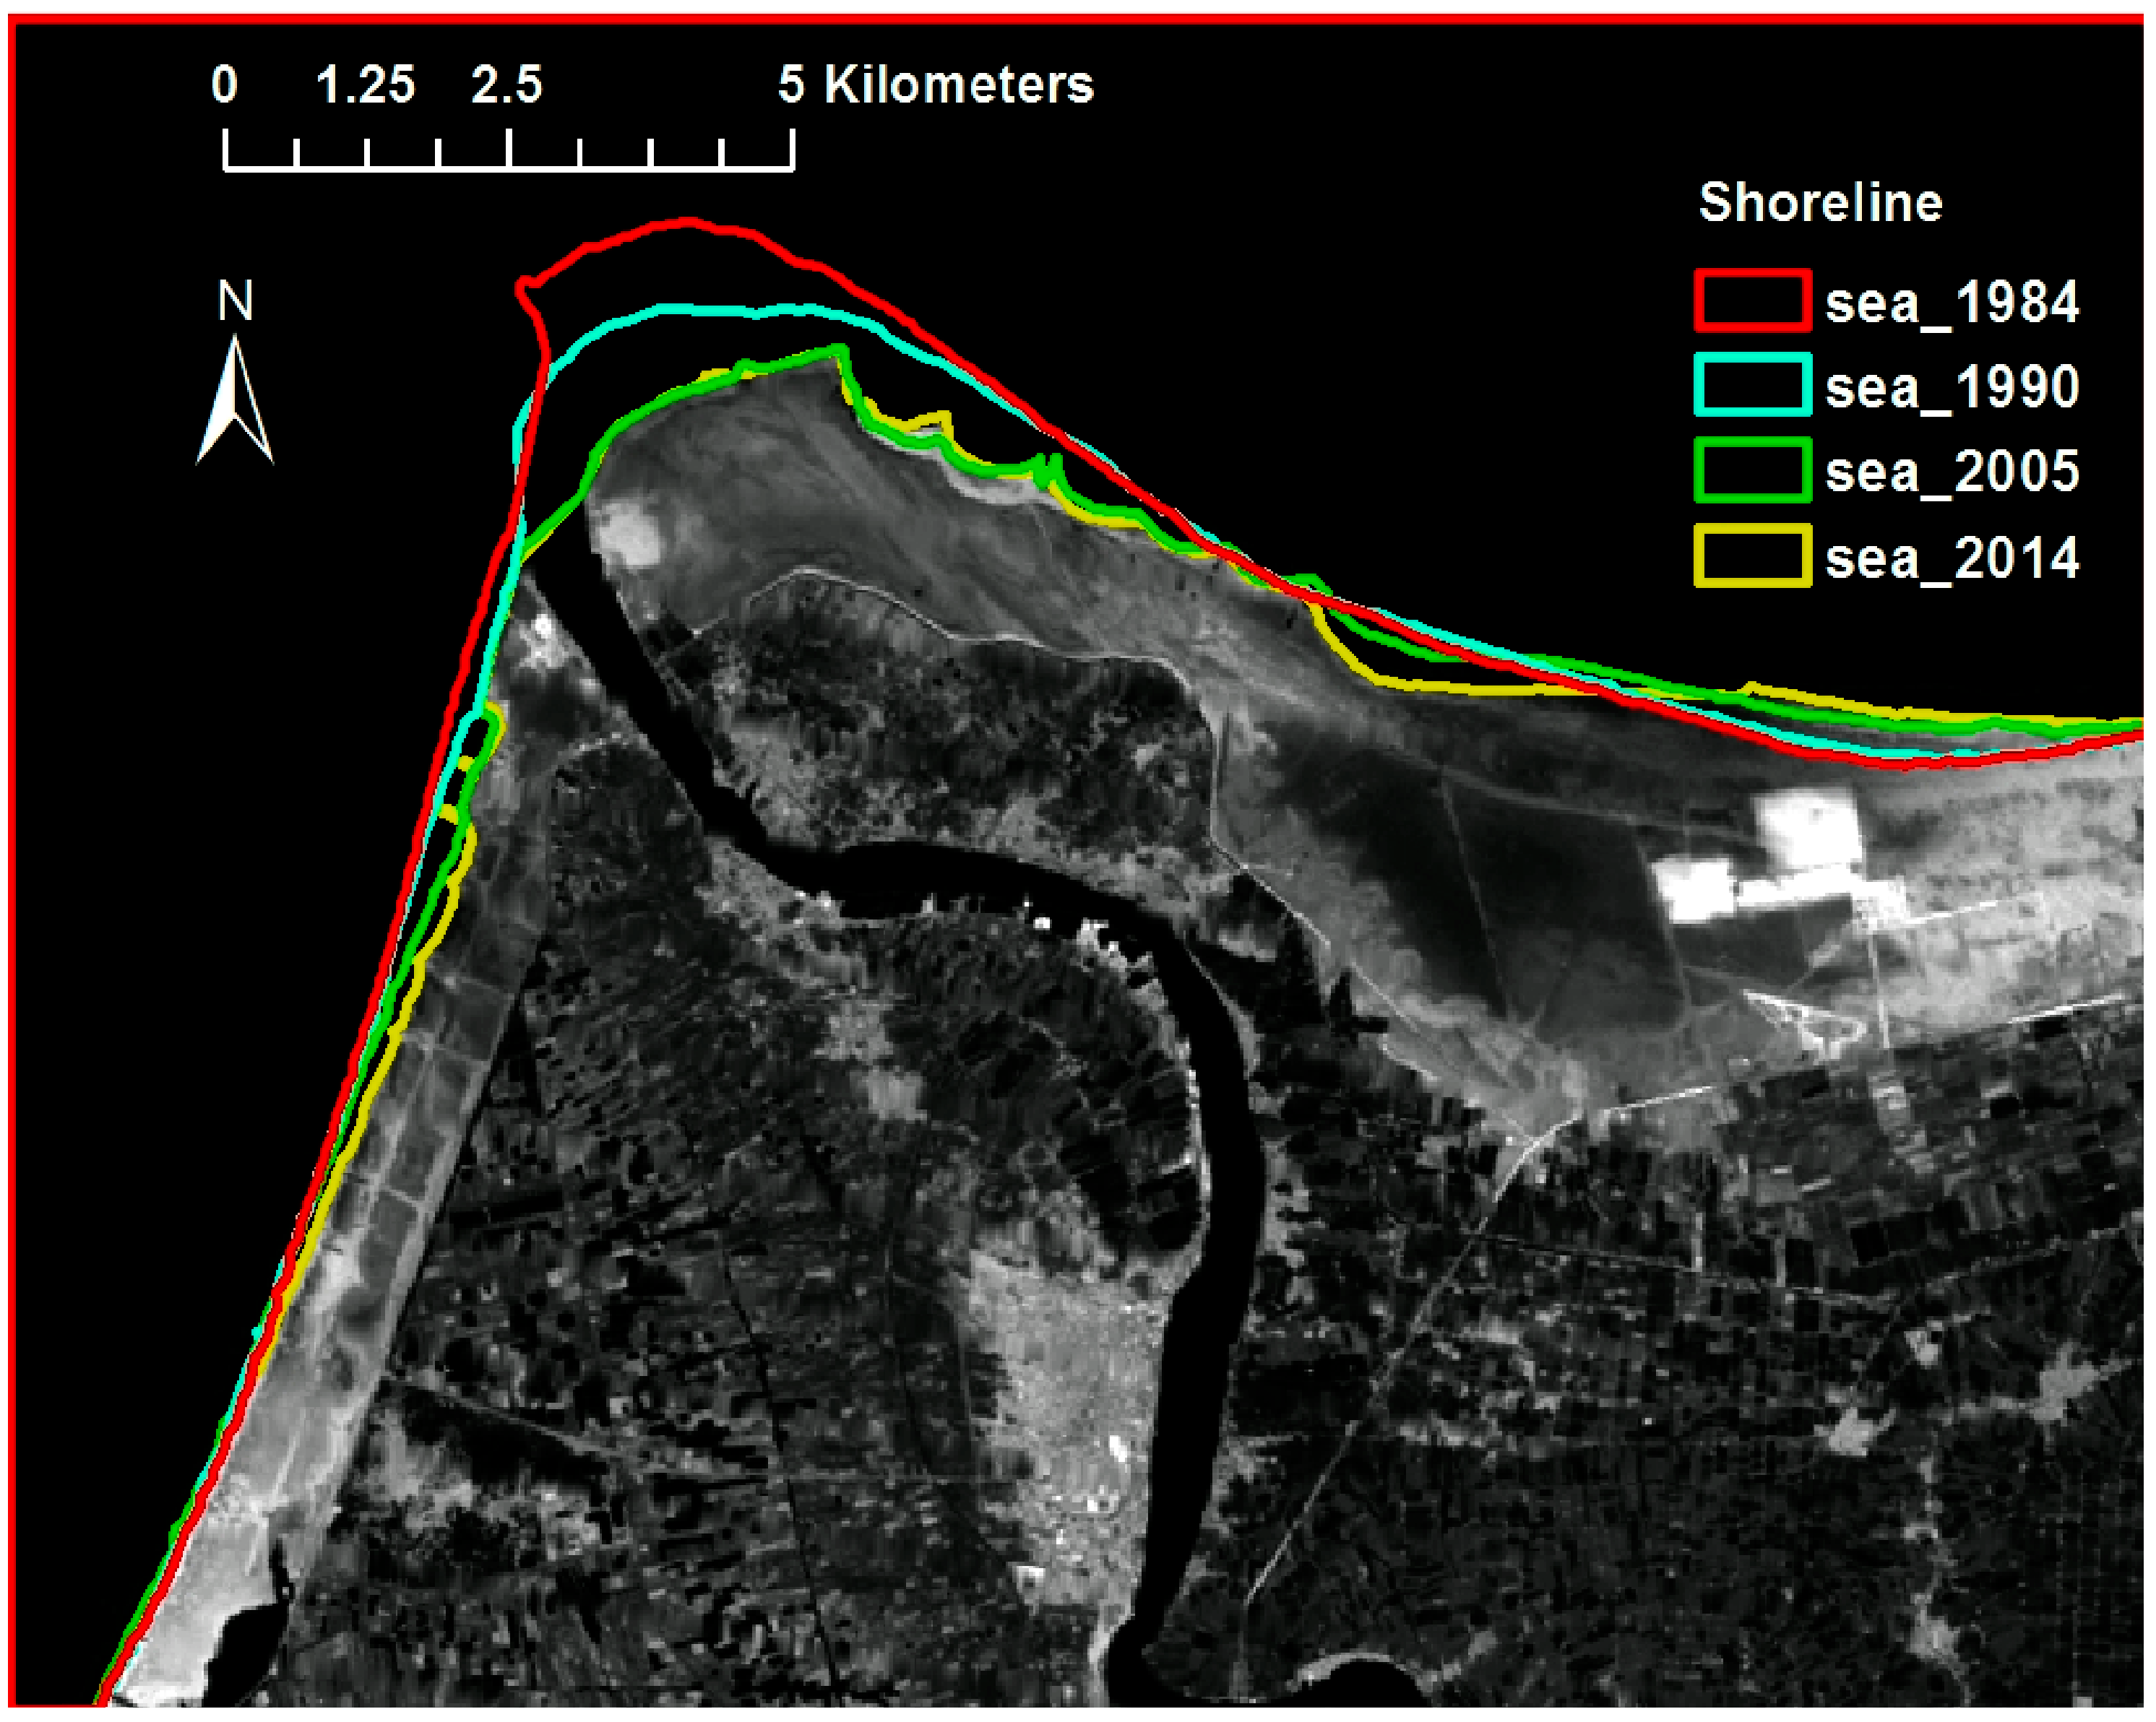
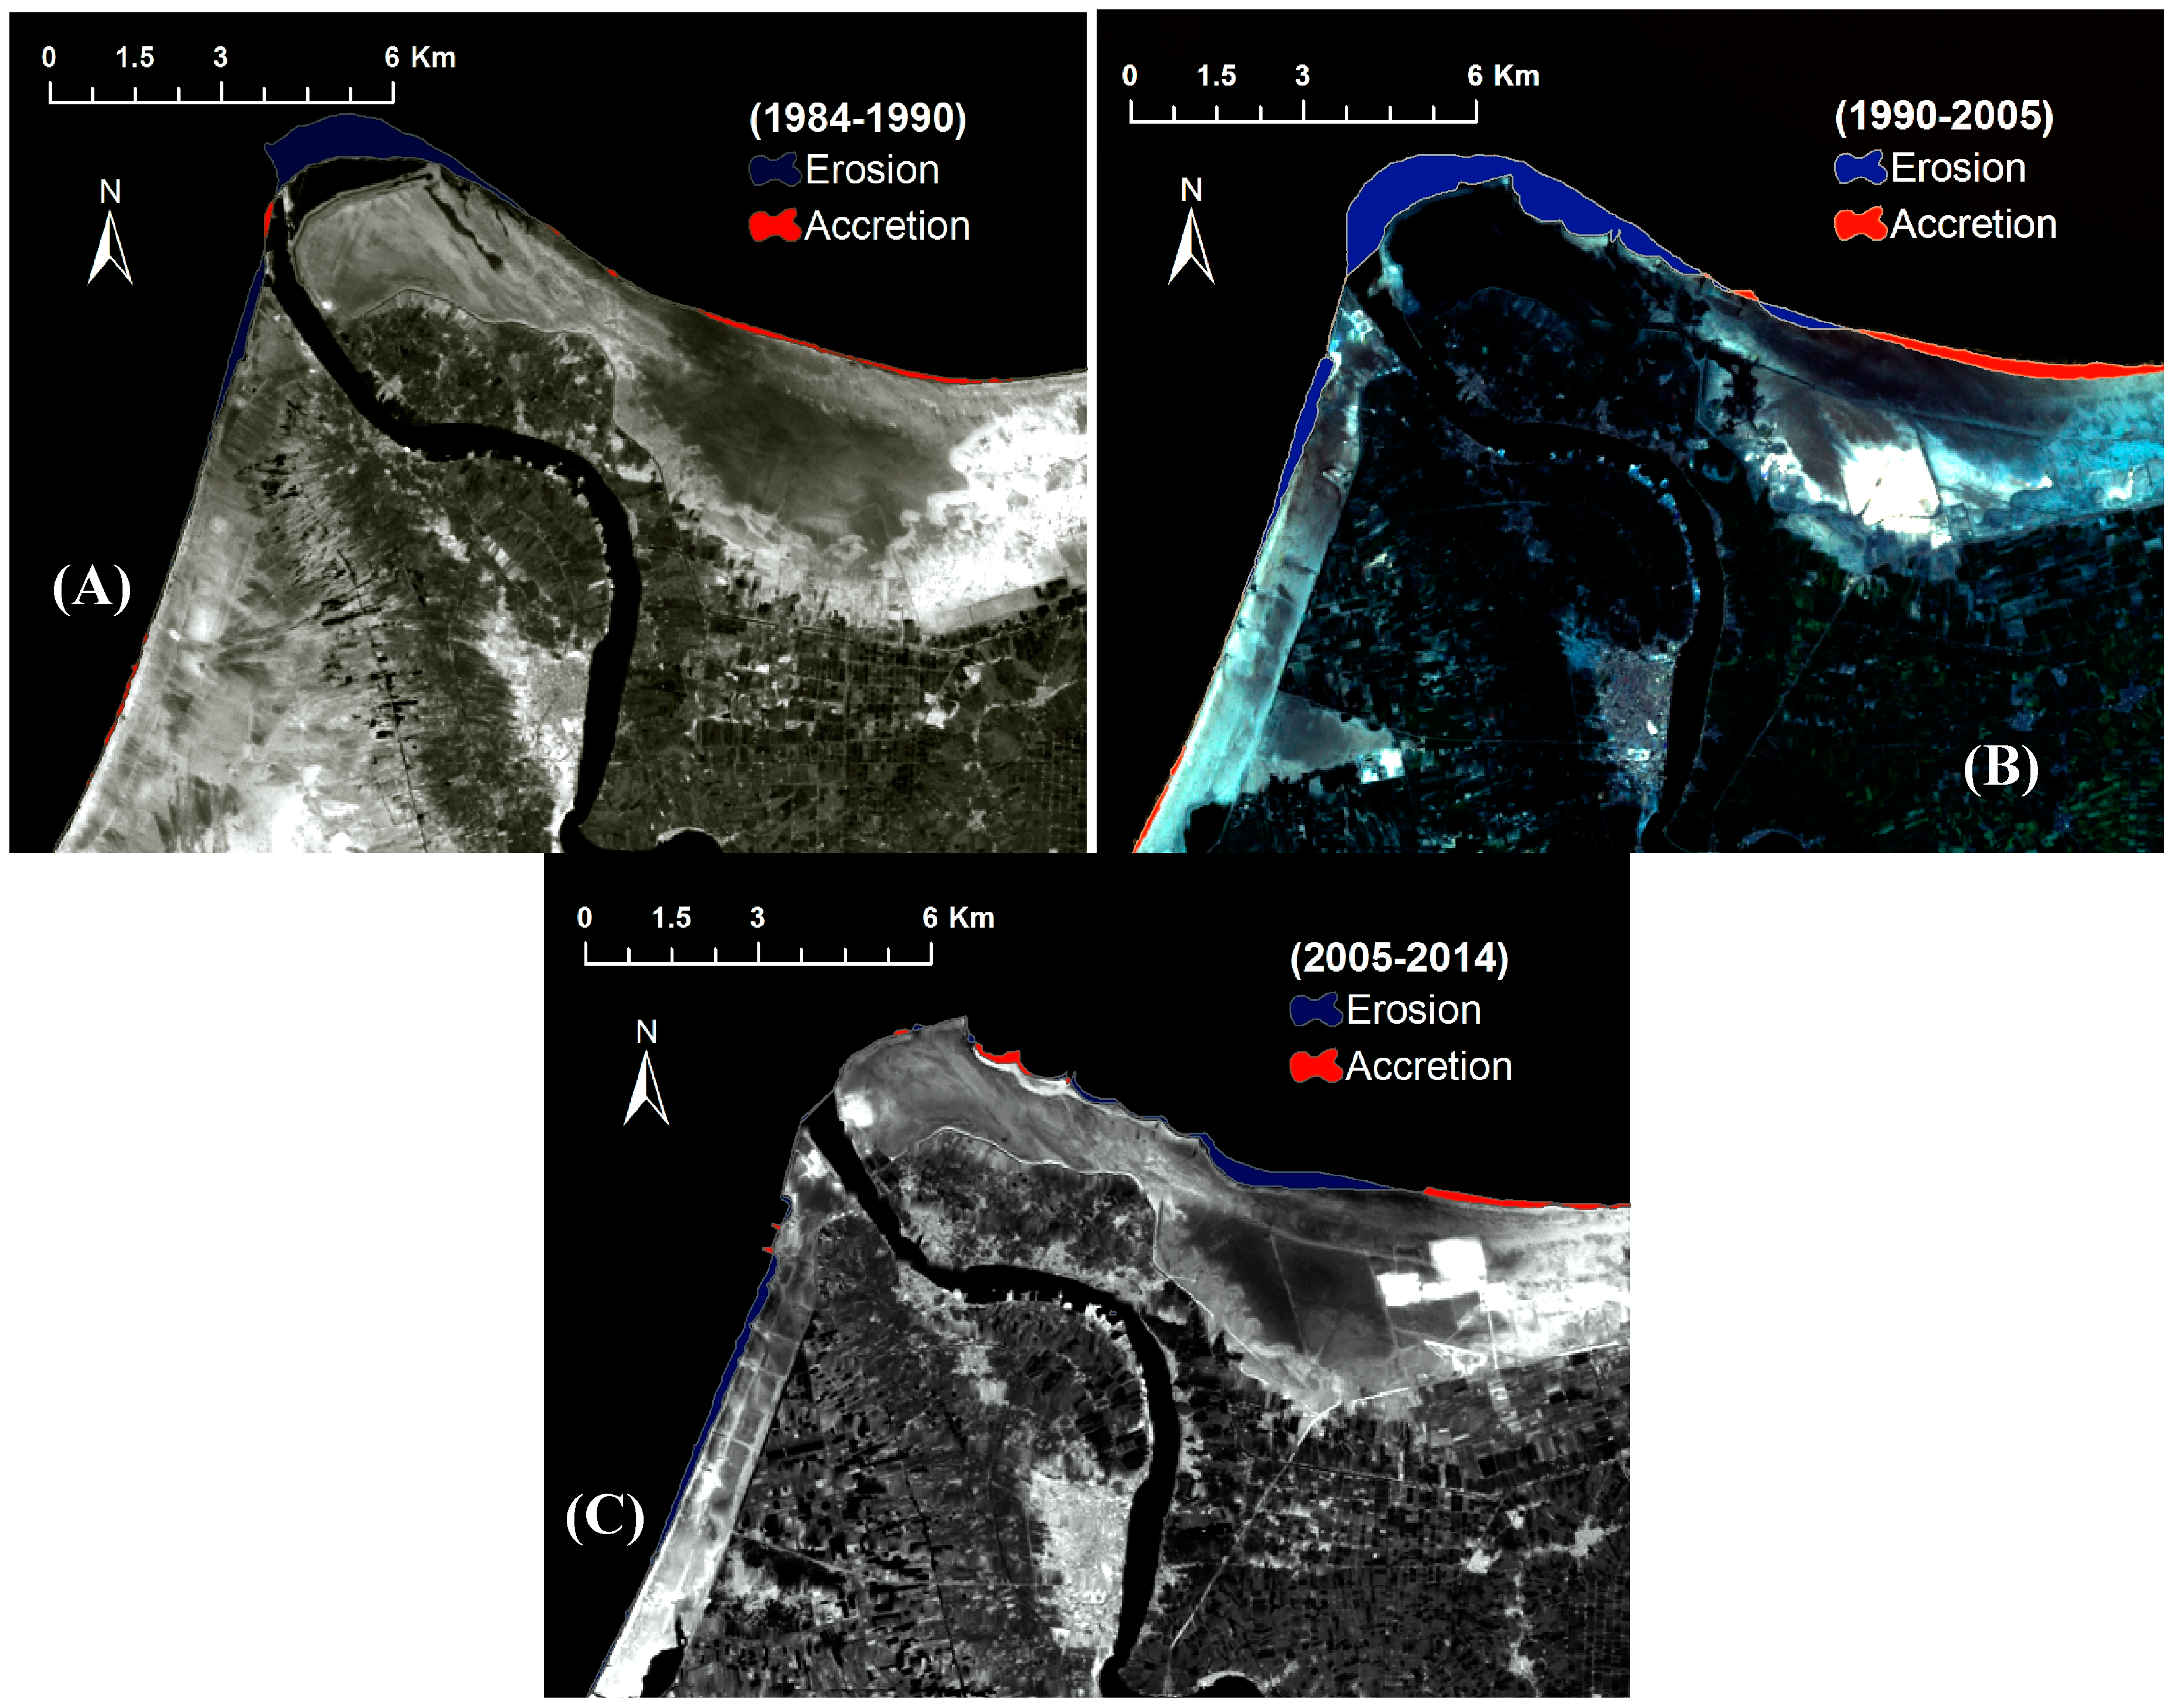
Shoreline and land cover changes have been investigate da long Rosetta Promontory of the Nile using Landsat images representing 30 years period, acquired in 1984, 1990, 2005, and 2014. This data was geo-referenced by a digital topographic map, and then corrected geometrically, and radio-metrically. Land cover changes were detected through supervised classification. It was found that within the last 30 years, 1.6% of the promontory area was eroded, 9%was developed, and 3.1%of wetland areas changed to agricultural land.
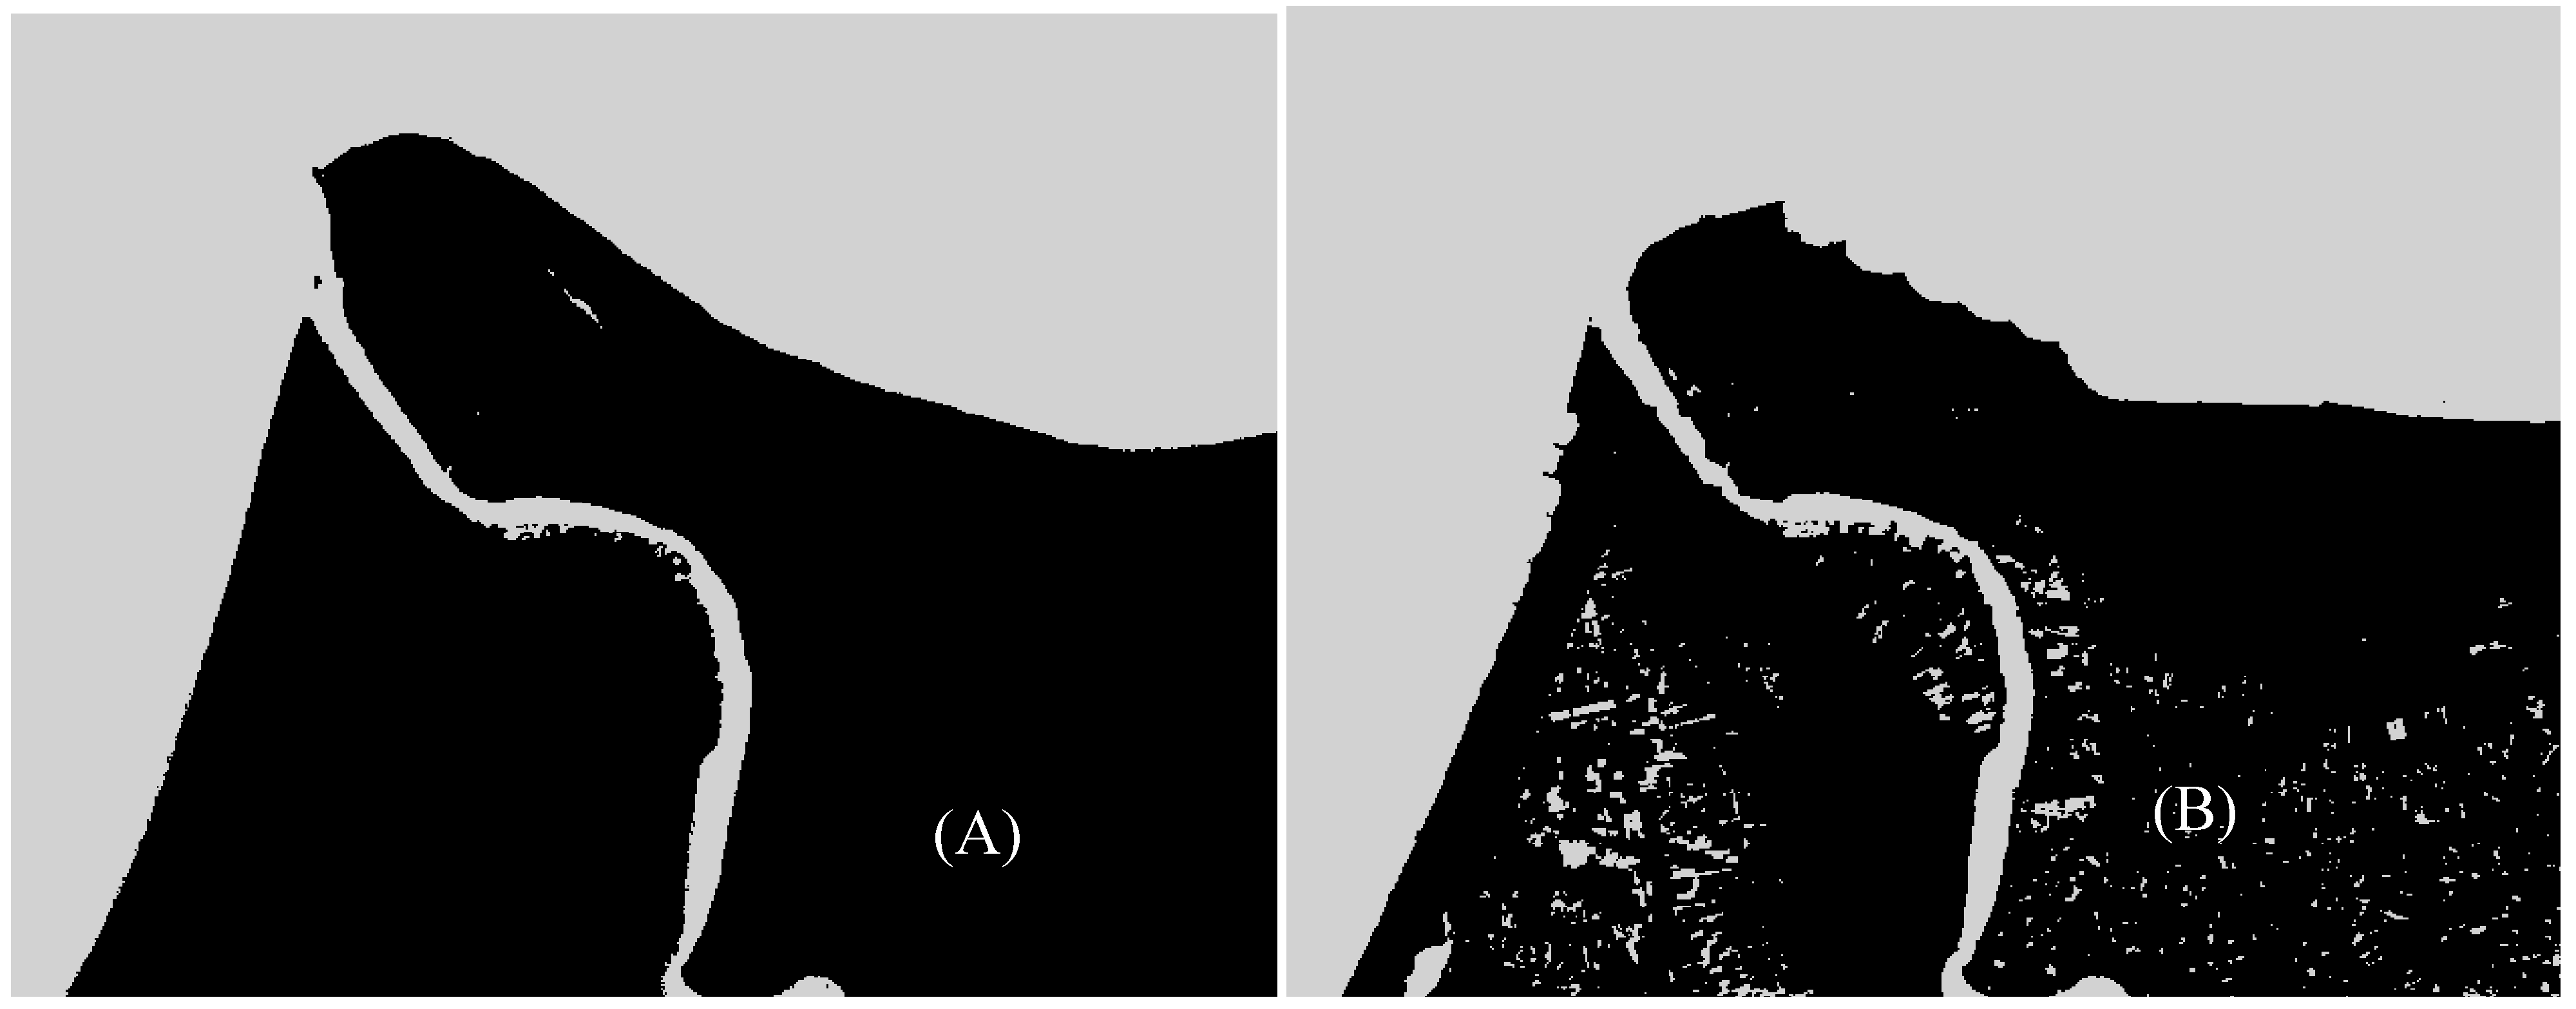
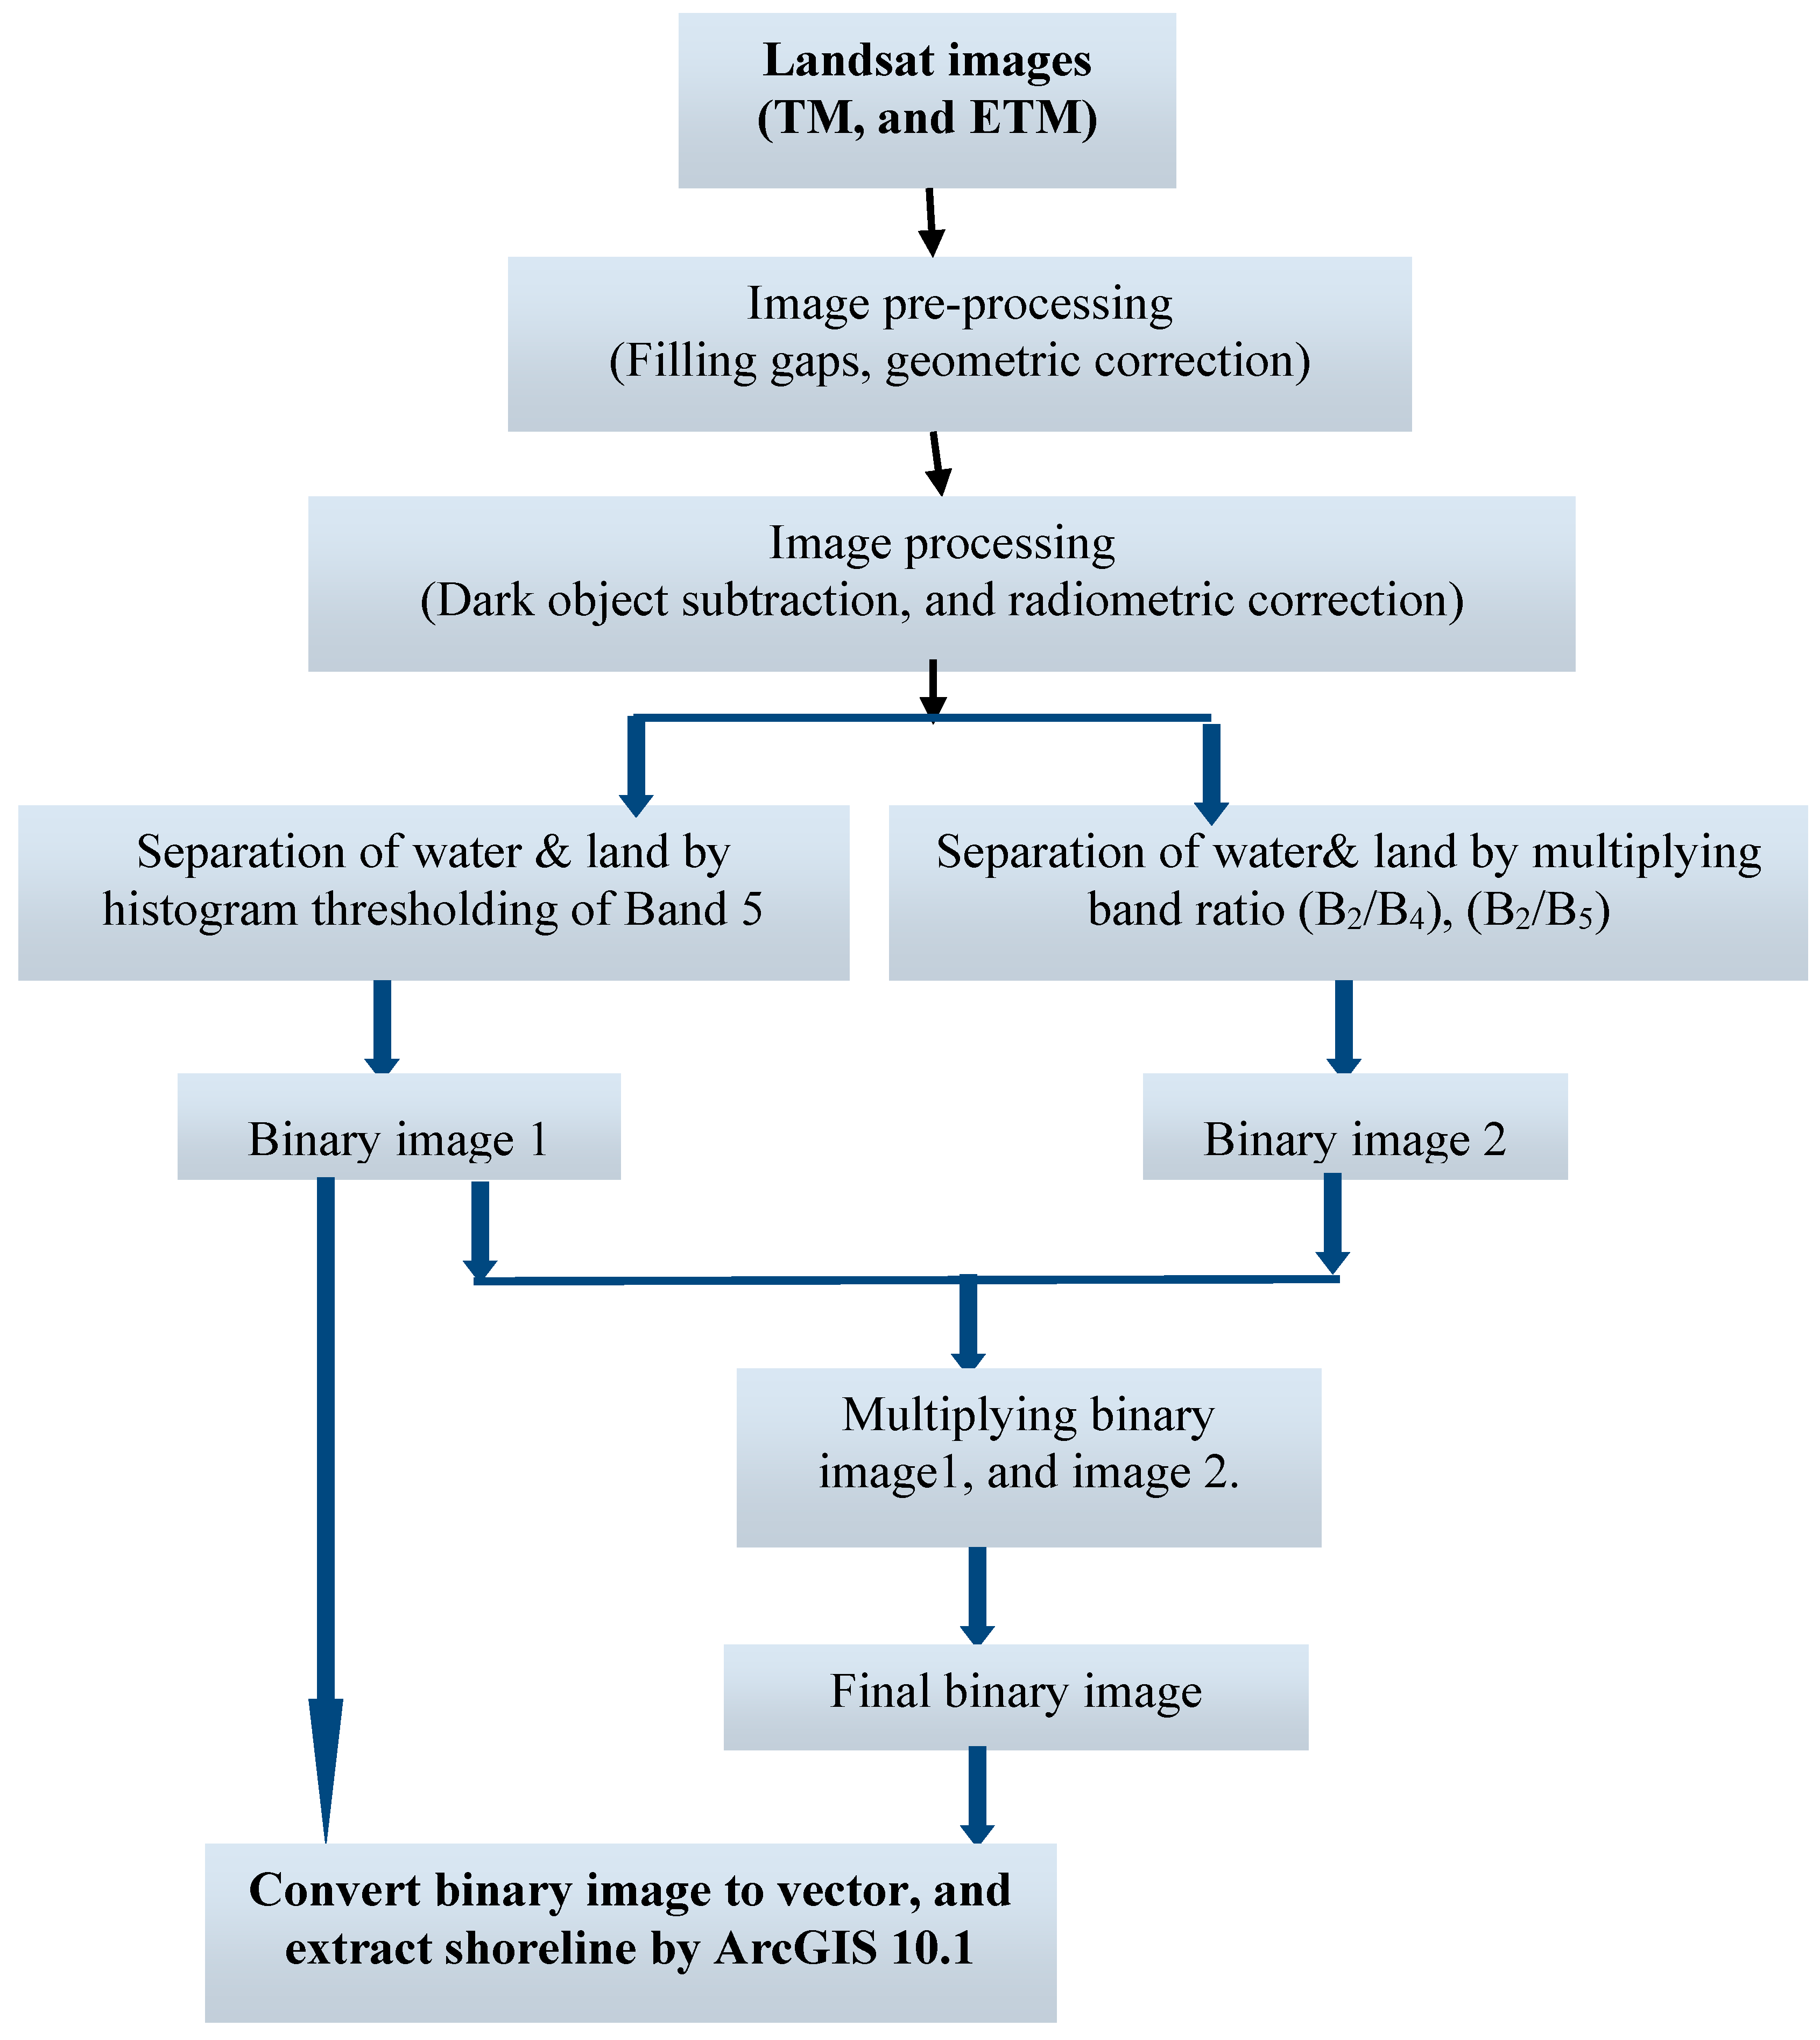
Changes in shoreline positions from 1984 to 2014 were estimated by two different techniques. The first is the histogram threshold of band 5 and the other one is a combination of his to gram threshold and band ratio (b2/b4, and b2/b5). The annual retreatment of the shoreline was evaluated by comparing present results to those from the previous studies. The results show that the coastal protection work within Rosetta Promontory succeeded to decrease the maximum shoreline retreat from 124 m/year to 37 m/year during the period from 1984 to 2014. On the other hand, it is clear that more studies should be done to stabilize and reach the sustainable development of Rosetta Promontory.

Acknowledgments

The first author would like to thank Egyptian Ministry of Higher Education (MoHE) for granting him the PhD scholarship. Also, thanks and appreciation is due to Egypt-Japan University of Science and Technology (E-JUST) and JICA for their support and for offering the tools needed for this research. This work was partially supported by JSPS “Core-to-Core Program, B. Asia-Africa Science Platforms”.

Author Contributions

This paper is a part of the PhD Thesis of the first author under the supervision of the rest of authors.

Conflicts of Interest

The authors declare no conflict of interest.

References

  1. Muttitanon, W.; Tripathi, N.K. Land use/land cover changes in the coastal zone of Ban Don Bay, Thailand using Landsat 5 TM data. Int. J. Remote Sens. 2005, 26, 2311–2323. [Google Scholar] [CrossRef]
  2. Ghorbanali, A.; Nouri, N. Coastline change detection using remote sensing 1. Int. J. Environ. Sci. Technol. 2007, 4, 61–66. [Google Scholar] [CrossRef]
  3. Chen, L.C. Detection of shoreline changes for tideland areas using multi-temporal satellite images. Int.J. Remote Sens. 1998, 19, 3383–3397. [Google Scholar] [CrossRef]
  4. El Sayed, W.R.; Ali, M.A.; Iskander, M.; Fanos, M. Evolution of Rosetta Promontory the Period from 1500 to 2005, Egypt. Available online: http://www.medcoast.net/modul/index/menu/MEDCOAST-07/207 (accessed on 9 March 2015).
  5. Dewidar, K.; Frihy, O.E. Pre- and post-beach response to engineering hard structures using Landsat time-series at the northwestern part of the Nile delta, Egypt. J. Coast. Conserv. 2008, 11, 133–142. [Google Scholar] [CrossRef]
  6. Alesheikh, A.A.; Ghorbanali, A.; Talebzadeh, A. Generation the Coastline Change Map for Urmia Lake by TM and ETM+ Imagery. Available online: https://scholar.google.com.eg/scholar?hl=en&q=Generation+the+coastline+change+map+for+Urmia+Lake&btnG=&as_sdt=1%2C5&as_sdtp= (accessed on 9 March 2015).
  7. De Witt, H.; Feng, W. Semi-Automated Construction of the Louisiana Coastline Digital Land-Water Boundary Using Landsat TM imagery. Available online: https://scholar.google.com.eg/scholar?lookup=0&q=Semi-Automated+construction+of+the+Louisiana+coastline+digital+land-water+Boundary+using+landsat+TM+imagery&hl=en&as_sdt=0,5 (accessed on 9 March 2015).
  8. Szmytkiewicz, M.; Biegowski, J.; Kaczmarek, L.M. Coastline changes nearby harbour structures: Comparative analysis of one-line models versus field data. Coast. Eng. 2000, 40, 119–139. [Google Scholar] [CrossRef]
  9. Maiti, S.; Bhattacharya, A. Shoreline change analysis and its application to prediction: A remote sensing and statistics based approach. Mar. Geol. 2009, 257, 11–23. [Google Scholar] [CrossRef]
  10. Davidson, M.A.; Lewis, R.P.; Turner, I. Forecasting seasonal to multi-year shoreline change. Coast. Eng. 2010, 57, 620–629. [Google Scholar] [CrossRef]
  11. Louati, M.; Saïdi, H.; Zargouni, F. Shoreline change assessment using remote sensing and GIS techniques: A case study of the Medjerda delta coast, Tunisia. Arab. J. Geosci. 2014. [Google Scholar] [CrossRef]
  12. Singh, A. Review article digital change detection techniques using remotely-sensed data. Int. J. Remote Sens. 1989, 10, 989–1003. [Google Scholar] [CrossRef]
  13. El-Asmar, H.M.; Hereher, M.E. Change detection of the coastal zone east of the Nile Delta using remote sensing. Environ. Earth Sci. 2010, 62, 769–777. [Google Scholar] [CrossRef]
  14. Lu, D.; Mausel, P.; Brondizio, E.; Moran, E. Change detection techniques. Int. J. Remote Sens. 2004, 25, 2365–2401. [Google Scholar] [CrossRef]
  15. Hereher, M.E. Mapping coastal erosion at the Nile Delta western promontory using Landsat imagery. Environ. Earth Sci. 2011, 64, 1117–1125. [Google Scholar] [CrossRef]
  16. Song, C.; Woodcock, C.E.; Seto, K.C.; Lenney, M.P.; Macomber, S.A. Classification and change detection using Landsat TM data: When and how to correct atmospheric effects? Remote Sens. Environ. 2001, 75, 230–244. [Google Scholar] [CrossRef]
  17. Shalaby, A.; Tateishi, R. Remote sensing and GIS for mapping and monitoring land cover and land-use changes in the northwestern coastal zone of Egypt. Appl. Geogr. 2007, 27, 28–41. [Google Scholar] [CrossRef]
  18. Frihy, O.; Nasr, S.M.; El Hattab, M.M.; El Raey, M. Remote sensing of beach erosion along the Rosetta promontary, northwestern Nile delta, Egypt. Int. J. Remote Sens. 1994, 15, 1649–1660. [Google Scholar] [CrossRef]
  19. Klemas, V.; Abdel-Kader, A.M.F. Remote Sensing of Coastal Processes with Emphasis on the Nile Delta. Available online: http://agris.fao.org/agris-search/search.do?recordID=US8245535 (accessed on 9 March 2015).
  20. Smith, S.E.; Abdel-Kader, A. Coastal erosion along the Egyptian delta. J. Coast. Res. 1988, 4, 245–255. [Google Scholar]
  21. Blodget, H.W.; Taylor, P.T.; Roark, J.H. Shoreline changes along the Rosetta-Nile Promontory: Monitoring with satellite observations. Mar. Geol. 1991, 99, 67–77. [Google Scholar] [CrossRef]
  22. El-Raey, M.; Nasr, S.M.; El-Hattab, M.M.; Frihy, O.E. Change detection of Rosetta promontory over the last forty years. Remote Sens. 1995, 16, 825–834. [Google Scholar] [CrossRef]
  23. White, K.; El Asmar, H.M. Monitoring changing position of coastlines using Thematic Mapper imagery, an example from the Nile Delta. Geomorphology 1999, 29, 93–105. [Google Scholar] [CrossRef]
  24. El-Fishawi, N.M. Coastal erosion in relation to sea level changes, subsidence and river discharge, Nile Delta coast. Acta Miner. Petrogr. 1989, 30, 161–171. [Google Scholar]
  25. Frihy, O.E.; Komar, P.D. Long-term shoreline changes and the concentration of heavy minerals in beach sands of the Nile Delta, Egypt. Mar. Geol. 1993, 115, 253–261. [Google Scholar] [CrossRef]
  26. Elsayed, M.A.; Mahmoud, S.M. Groins system for shoreline stabilization on the east side of the Rosetta Promontory, Nile Delta coast. J. Coast. Res. 2007, 23, 380–387. [Google Scholar] [CrossRef]
  27. Masria, A.; Negm, A.M.; Iskander, M.M.; Saavedra, O.C. Numerical simulation of constructing jetties to Stabilize Rosetta Inlet, Egypt. In Proceedings of the Seventeenth International Water Technology Conference, Istanbul, Turkey, 5–7 November 2013.
  28. Masria, A.; Negm, A.M.; Iskander, M.M.; Saavedra, O.C. Numerical investigation of the impact of jetties on accretion problem at Rosetta Promontory, Egypt. Int. J. Environ. Sci. Dev. 2014. [Google Scholar] [CrossRef]
  29. Niya, A.K.; Alesheikh, A.A.; Soltanpor, M.; Kheirkhahzarkesh, M.M. Shoreline change mapping using remote sensing and GIS. Int. J. Remote Sens. Appl. 2013, 3, 102–107. [Google Scholar]
  30. Ahmed, M.H. Multi-Temporal Conflict of the Nile Delta Coastal Changes, Egypt. Available online: http://paginas.fe.up.pt/eurocoast/littoral2002/comm.html (accessed on 16 March 2015).
  31. Hereher, M.E. Sand movement patterns in the western Desert of Egypt: An environmental concern. Environ. Earth Sci. 2010, 59, 1119–1127. [Google Scholar] [CrossRef]

