3.3.1. Soil Types
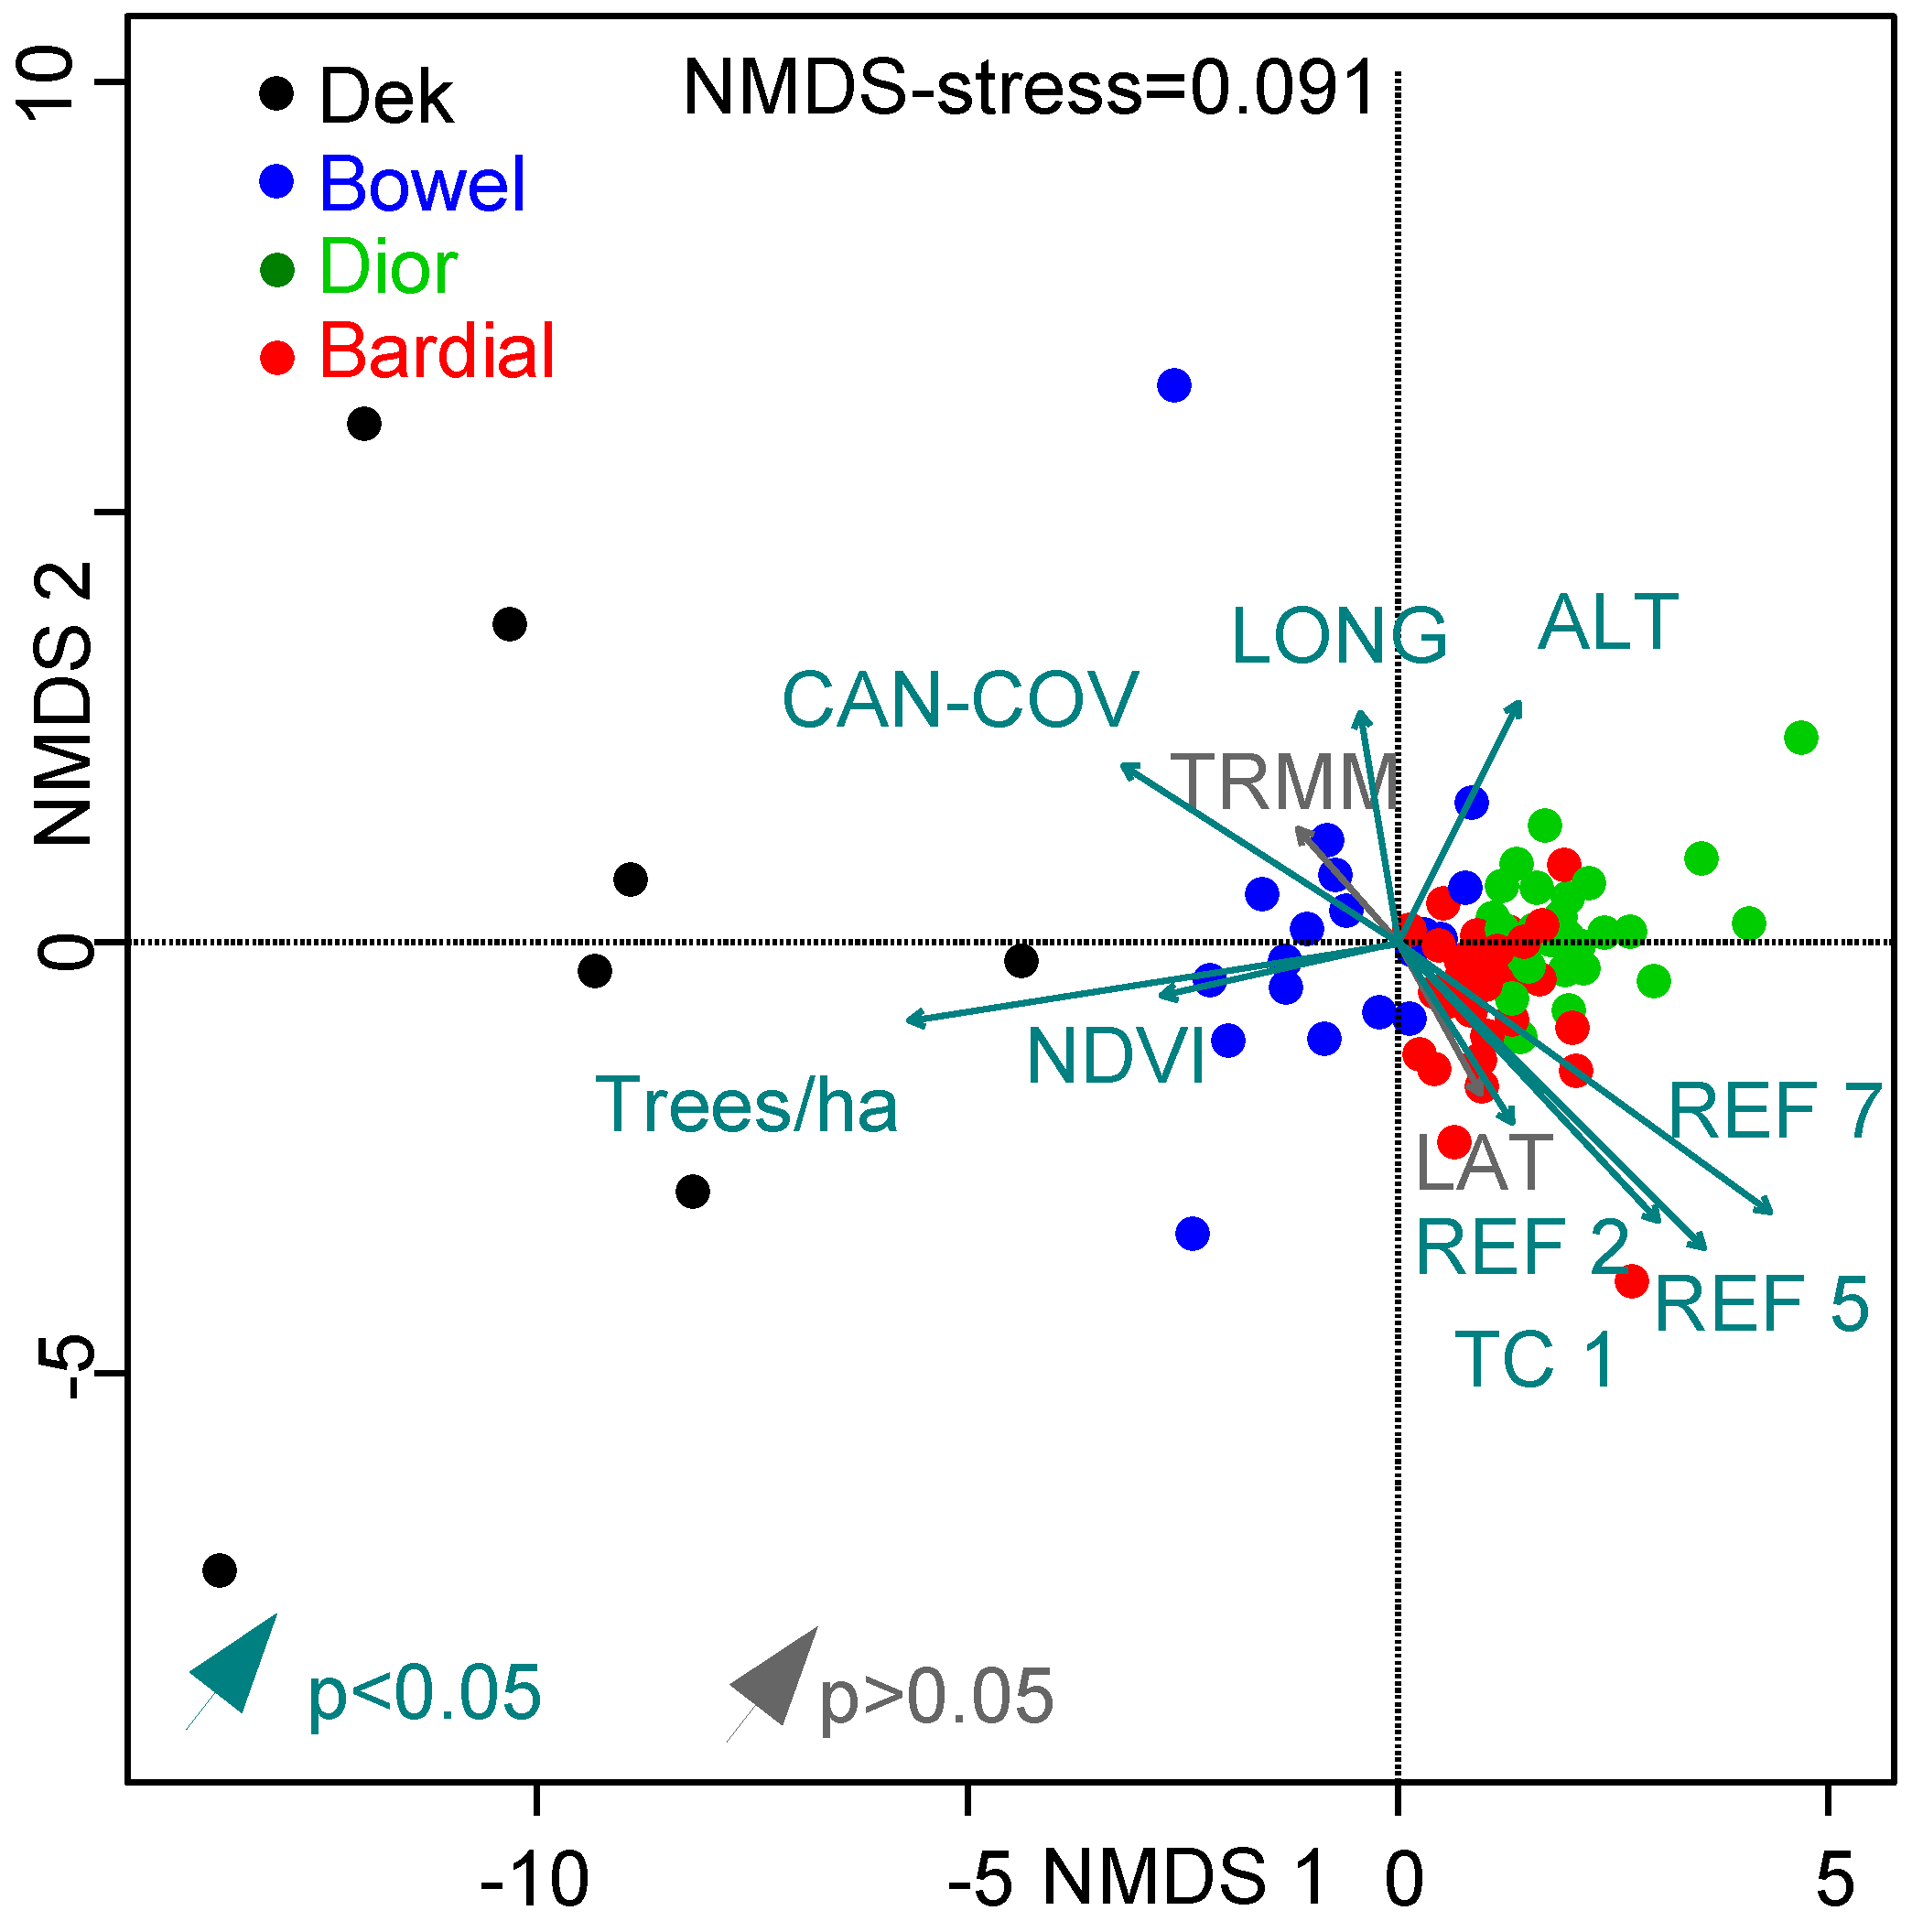
The NMDS confirmed the results of the soil clustering by grouping the sites in the same manner (see
Figure 4). Several significant predicting variables are identified. No evidence of a significant relationship between TRMM rainfall (
= 0.045)/northing (
= 0.06) and the soil properties can be verified at a confidence level of 10%. Both variables point into opposite directions, indicating that rainfall considerably decreases further north. On the contrary, Landsat’s bands 5 (
= 0.37), 7 (
= 0.42), as well as its TC brightness (
= 0.29) are highly significant (
0.01) and point in the direction of the Arenosol sites
Dior and
Bardial, as does band 2 (
= 0.09;
0.05). This can be explained by the low woody coverage of these soils and therefore the high spectral reflectance of the soil properties. NDVI (
= 0.12), canopy cover (
= 0.24) and especially trees/ha (
= 0.48) are significant (
0.05) and point in the direction of
Dek and
Bowel soils. Except from degraded sites, which are placed near the coordinate origin, these sites have a high vegetation density. In addition, significant (
0.05) relationships between easting (
= 0.1)/altitude (
= 0.14) and the soil types are observed.
Table 2.
Soil parameters classified according to the 4 clustered soil types derived from field and laboratory measurements. Mean value, range [min–max] and standard deviation are provided.
Table 2.
Soil parameters classified according to the 4 clustered soil types derived from field and laboratory measurements. Mean value, range [min–max] and standard deviation are provided.
| Parameter | Dek | Bowel | Dior | Bardial |
|---|
| Samples n | 7 | 19 | 28 | 30 |
| pH (H0) | 5.73 [4.4–8] 1.35 | 6.17 [5.3–8.1] 0.58 | 5.44 [4.9–6.4] 0.33 | 6.13 [5.3–7.4] 0.43 |
| Humus (%) | 1.56 [1.14–1.9] 0.25 | 0.62 [0.38–0.97] 0.21 | 0.34 [0.19–0.44] 0.06 | 0.39 [0.24–0.68] 0.1 |
| N (%) | 0.14 [0.12–0.18] 0.02 | 0.08 [0.05–0.11] 0.02 | 0.06 [0.04–0.08] 0.01 | 0.06 [0.04–0.09] 0.01 |
| CN | 6.8 [5.4–8.1] 0.9 | 4.5 [3–6] 0.9 | 3.4 [1.6–5.8] 0.9 | 3.7 [2.2–5.3] 0.8 |
| P (mg/kg) | 0.21 [0.1–0.5] 0.12 | 0.22 [0.01–1.1] 0.28 | 0.24 [0.04–0.62] 0.17 | 0.48 [0.0–3.2] 0.71 |
| CECpot (cmol/kg) | 9.04 [5.3–21] 5.61 | 2.56 [1.51–4.5] 0.8 | 1.33 [1–1.9] 0.23 | 2.05 [1.1–4.3] 0.84 |
| BS (%) | 97.8 [95.4–99.8] 1.71 | 97.8 [95.5–99.6] 1.2 | 92.7 [78.8–98] 3.75 | 97.5 [95.2–99.6] 1.25 |
| Ca (cmol/kg) | 6.26 [2.75–15.87] 4.68 | 1.6 [0.81–3.32] 0.67 | 0.67 [0.4–1.1] 0.16 | 1.22 [0.63–2.5] 0.5 |
| Mg (cmol/kg) | 1.83 [1.1–4.4] 1.16 | 0.51 [0.25–0.83] 0.16 | 0.24 [0.13–0.36] 0.05 | 0.44 [0.2–1.08] 0.23 |
| K (cmol/kg) | 0.5 [0.34–0.65] 0.11 | 0.18 [0.09–0.27] 0.05 | 0.12 [0.08–0.2] 0.03 | 0.16 [0.06–0.28] 0.05 |
| FC (% vol) | 19 | 22 | 8 | 8 |
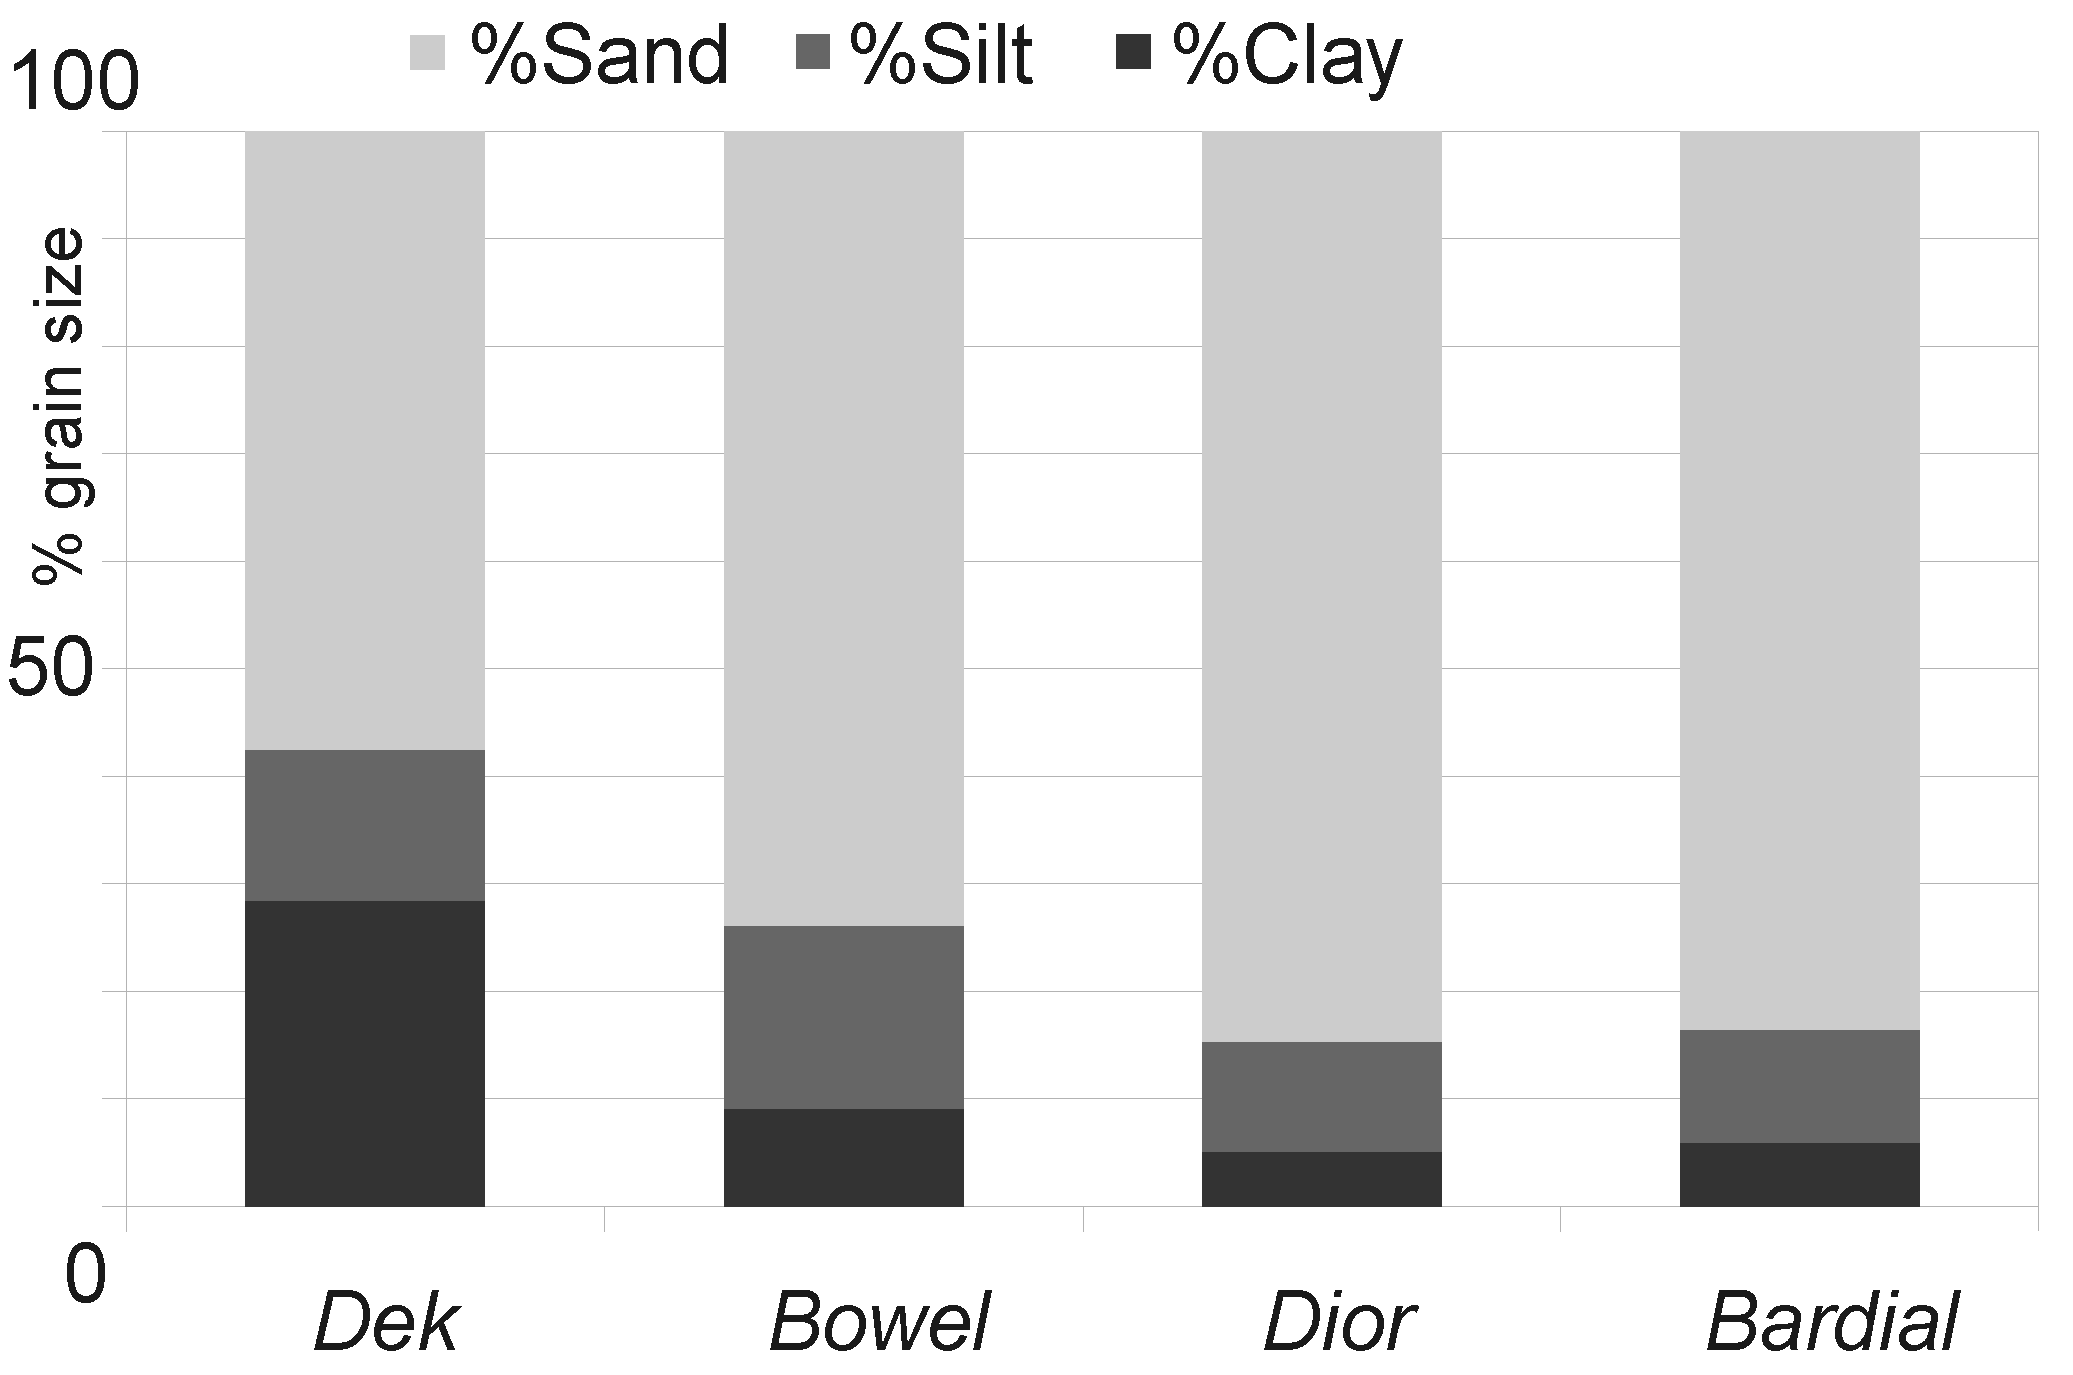
| Sand (%) | 53 [32–65] 10 | 71 [57–81] 7 | 86 [79–92] 4 | 85 [77–93] 4 |
| Clay (%) | 26 [16–38] 7 | 9 [4–20] 4 | 5 [3–9] 1 | 6 [3–10] 2 |
| Stability (3–8) | 7.4 [6–8] 0.8 | 6.1 [5–8] 0.9 | 4.8 [3–7] 1 | 4.9 [3–7] 1.1 |
Figure 4.
NMDS-ordination with grouped test sites (according to 28 soil parameters) and fitted variables. REF 2, 5, 7: Landsat reflectance June; TC: Tasseled Cap brightness; ALT: altitude; CAN-COV: canopy cover; TRMM: annual rainfall; LONG: longitude; LAT: latitude. The arrows show significant relationships between the soil samples and fitted variables by pointing into the respective direction. A longer arrow means a stronger relation.
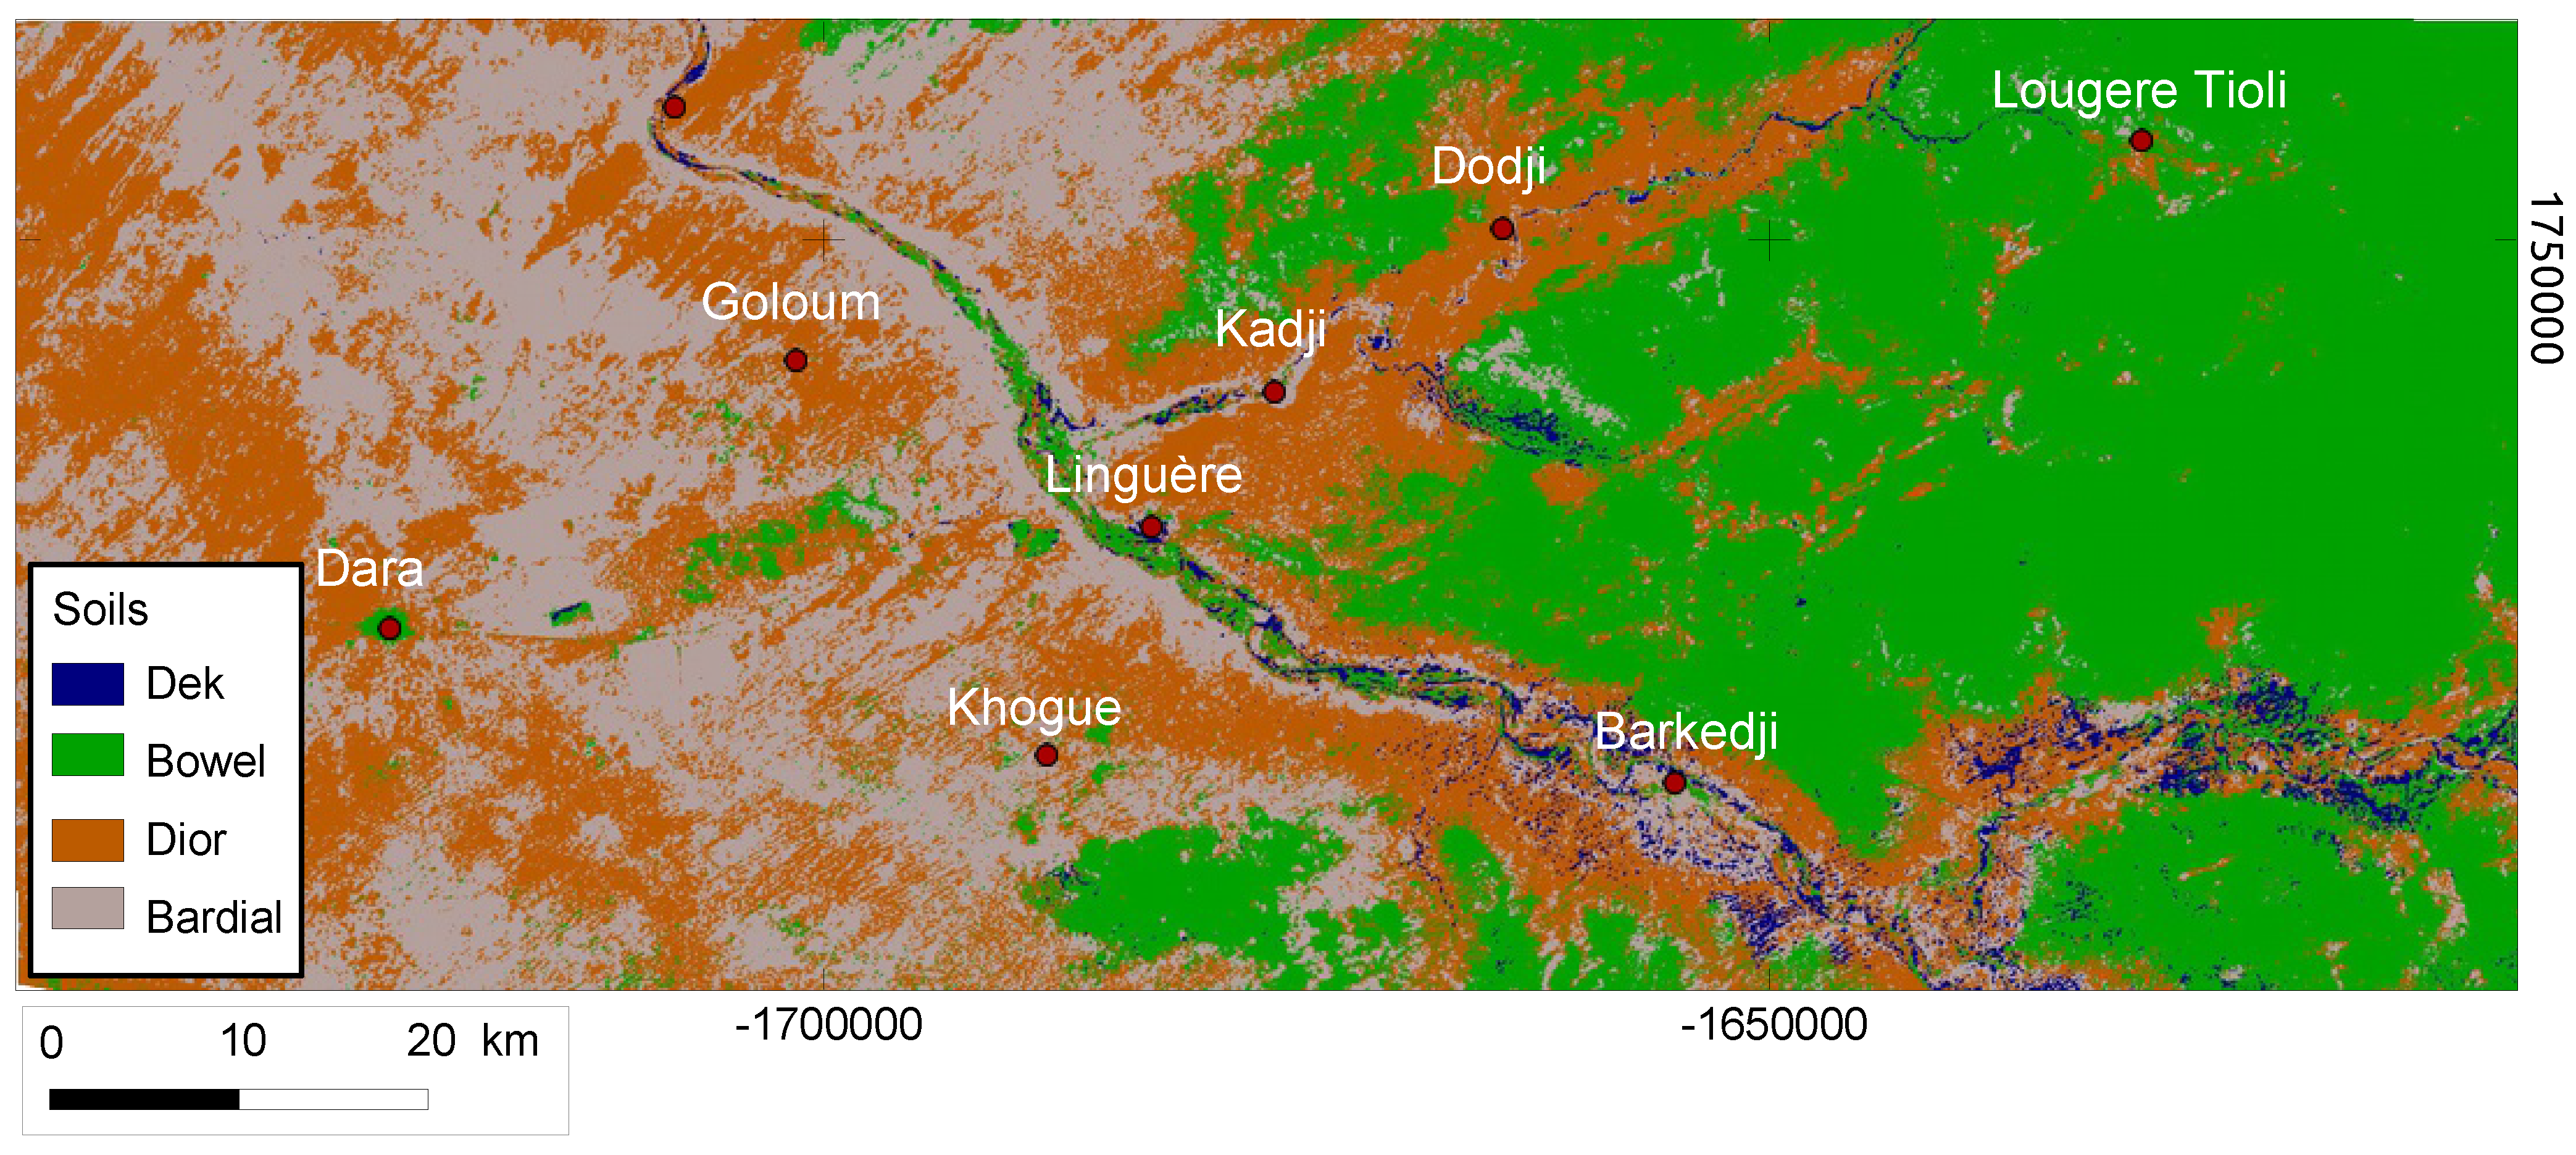
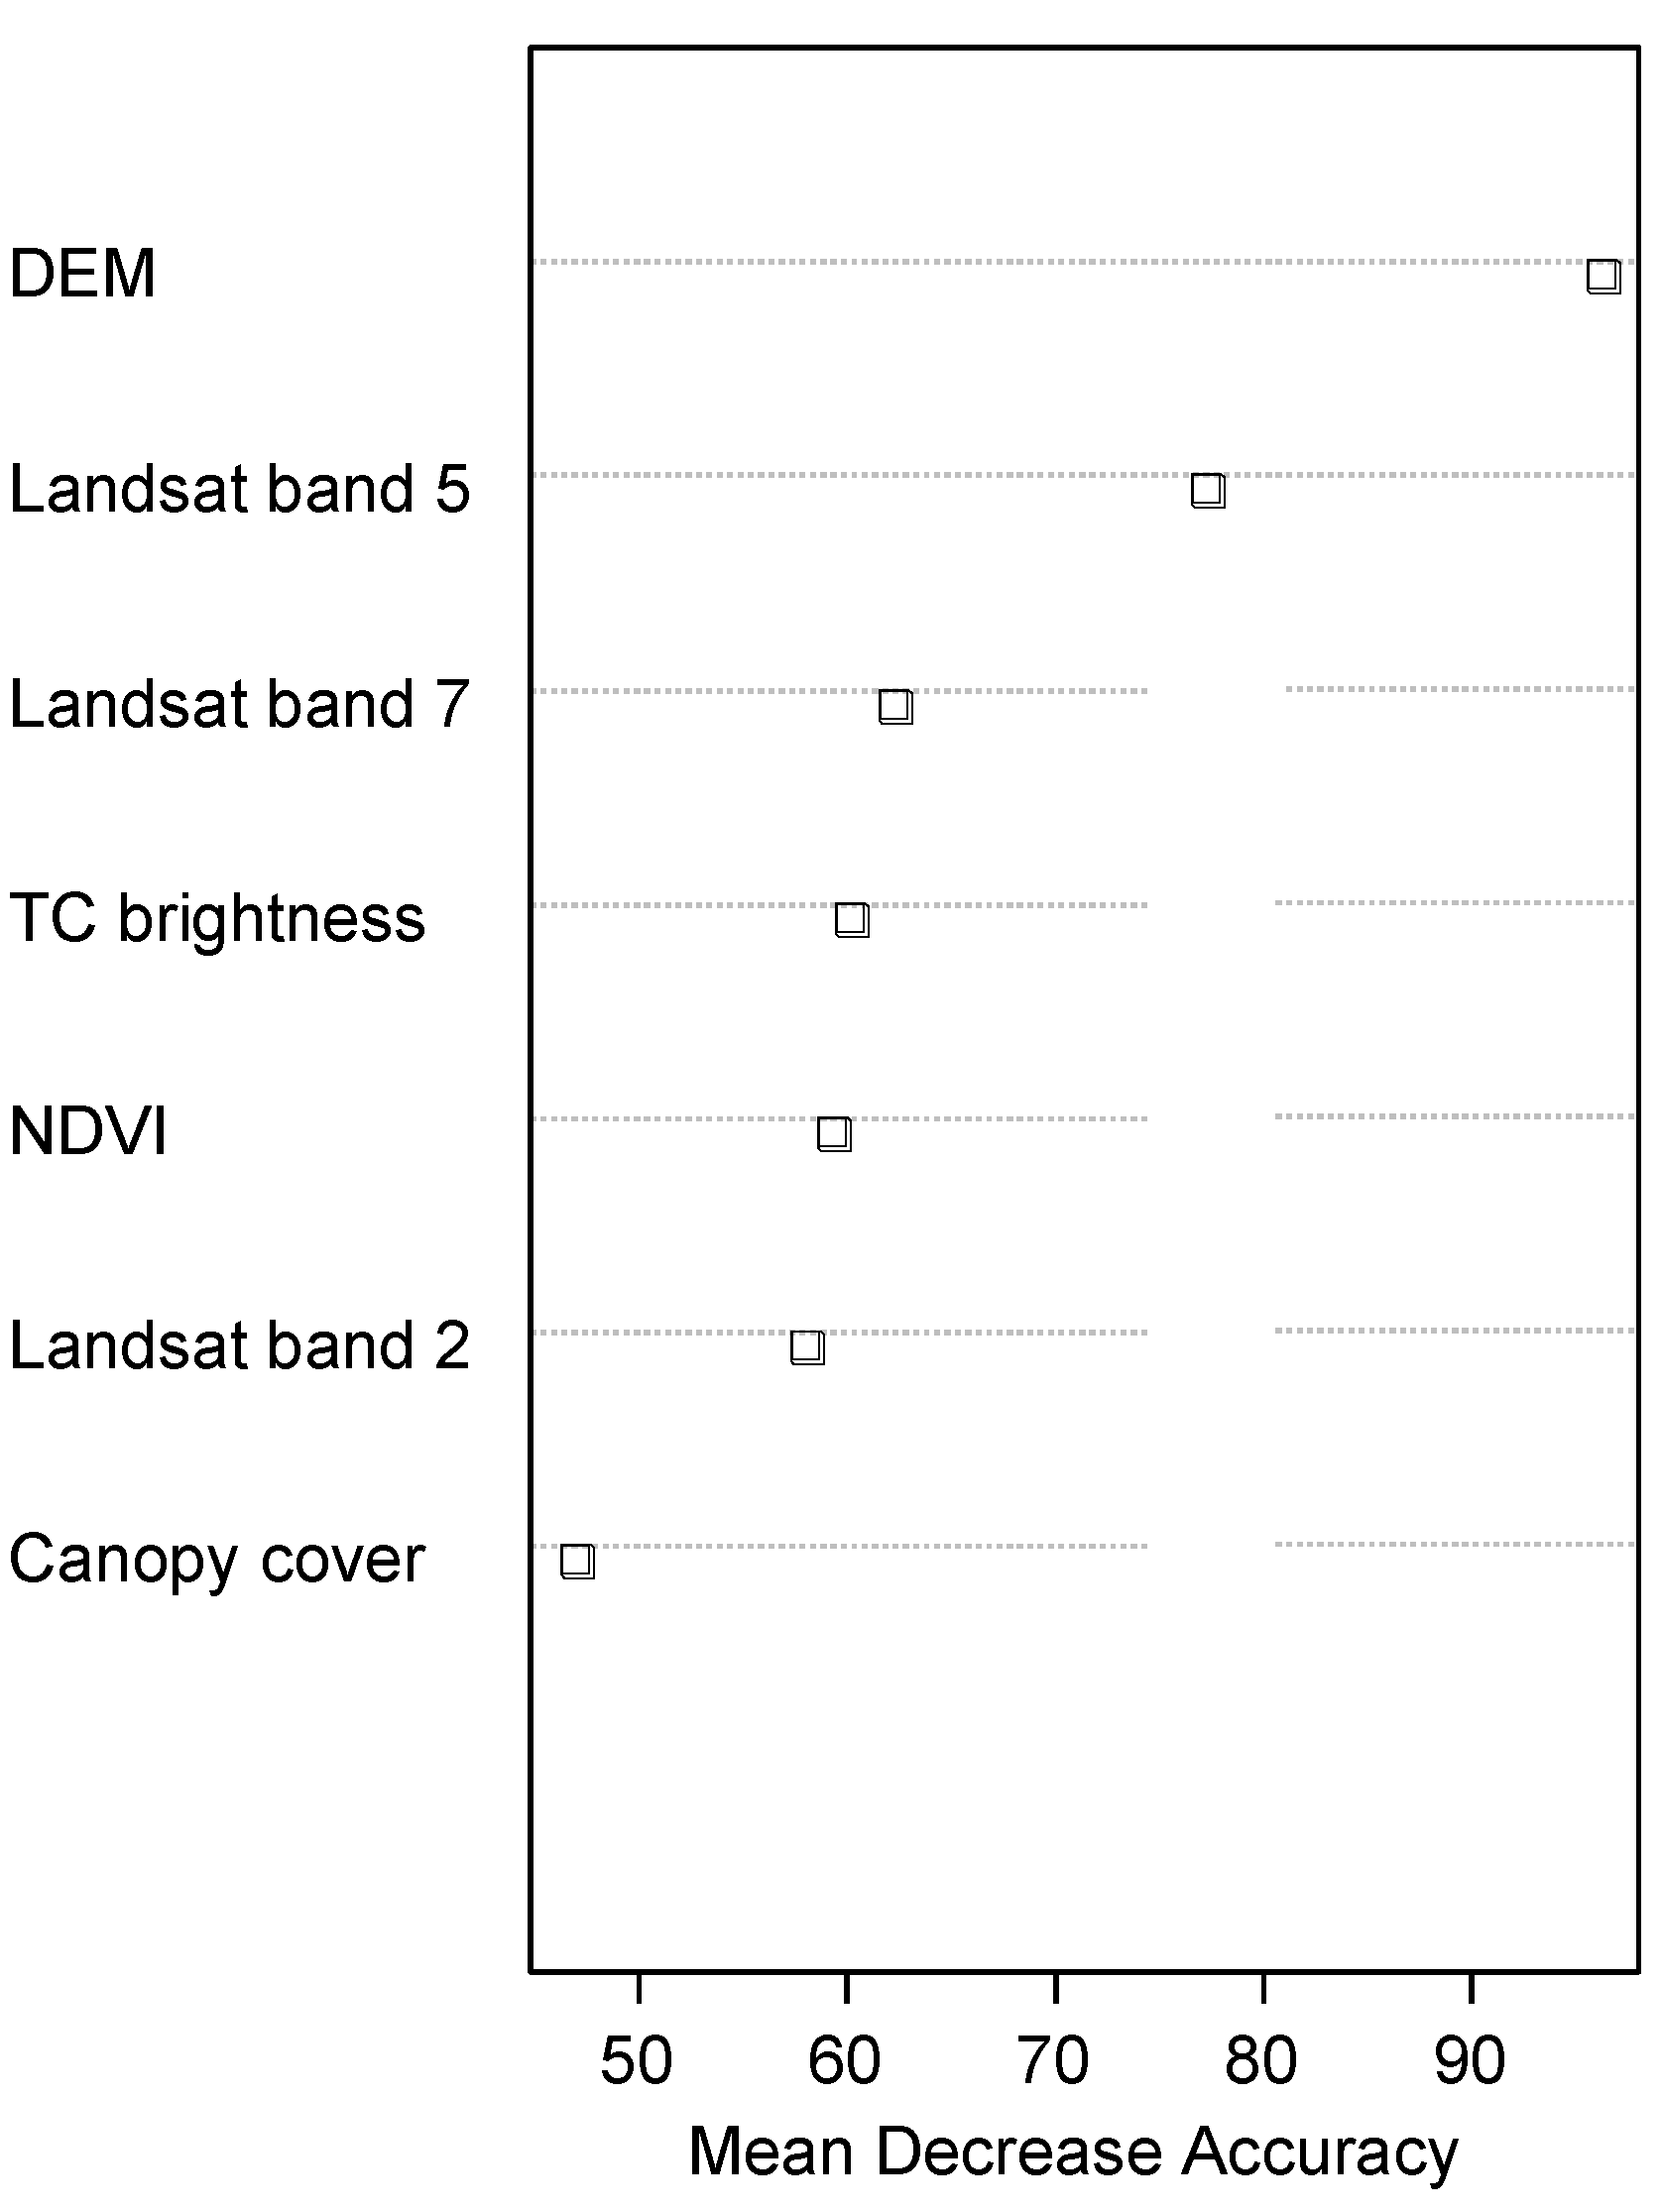
Figure 5 shows the result of the 4 soil types modeled with Random Forest
via 84 test sites and 6 significant (
0.05) variables (DEM; Landsat bands 2, 5, 7; TC brightness; NDVI). Despite being significant, easting was excluded from modeling because a visual comparison showed that including the variable causes a loss of important details. In contrast to the NMDS which uses values averaged over the test sites (about 2 ha), Random Forest works pixel-wise at a resolution of 30 m. The model’s variable importance plot identifies the DEM as the most important input parameter, followed by Landsat’s bands 5 and 7 (see
Figure A1). Canopy cover is the least important variable and therefore excluded in the modeling process. The OOB confusion matrix attests a high model quality with an error rate of 7.3% (see
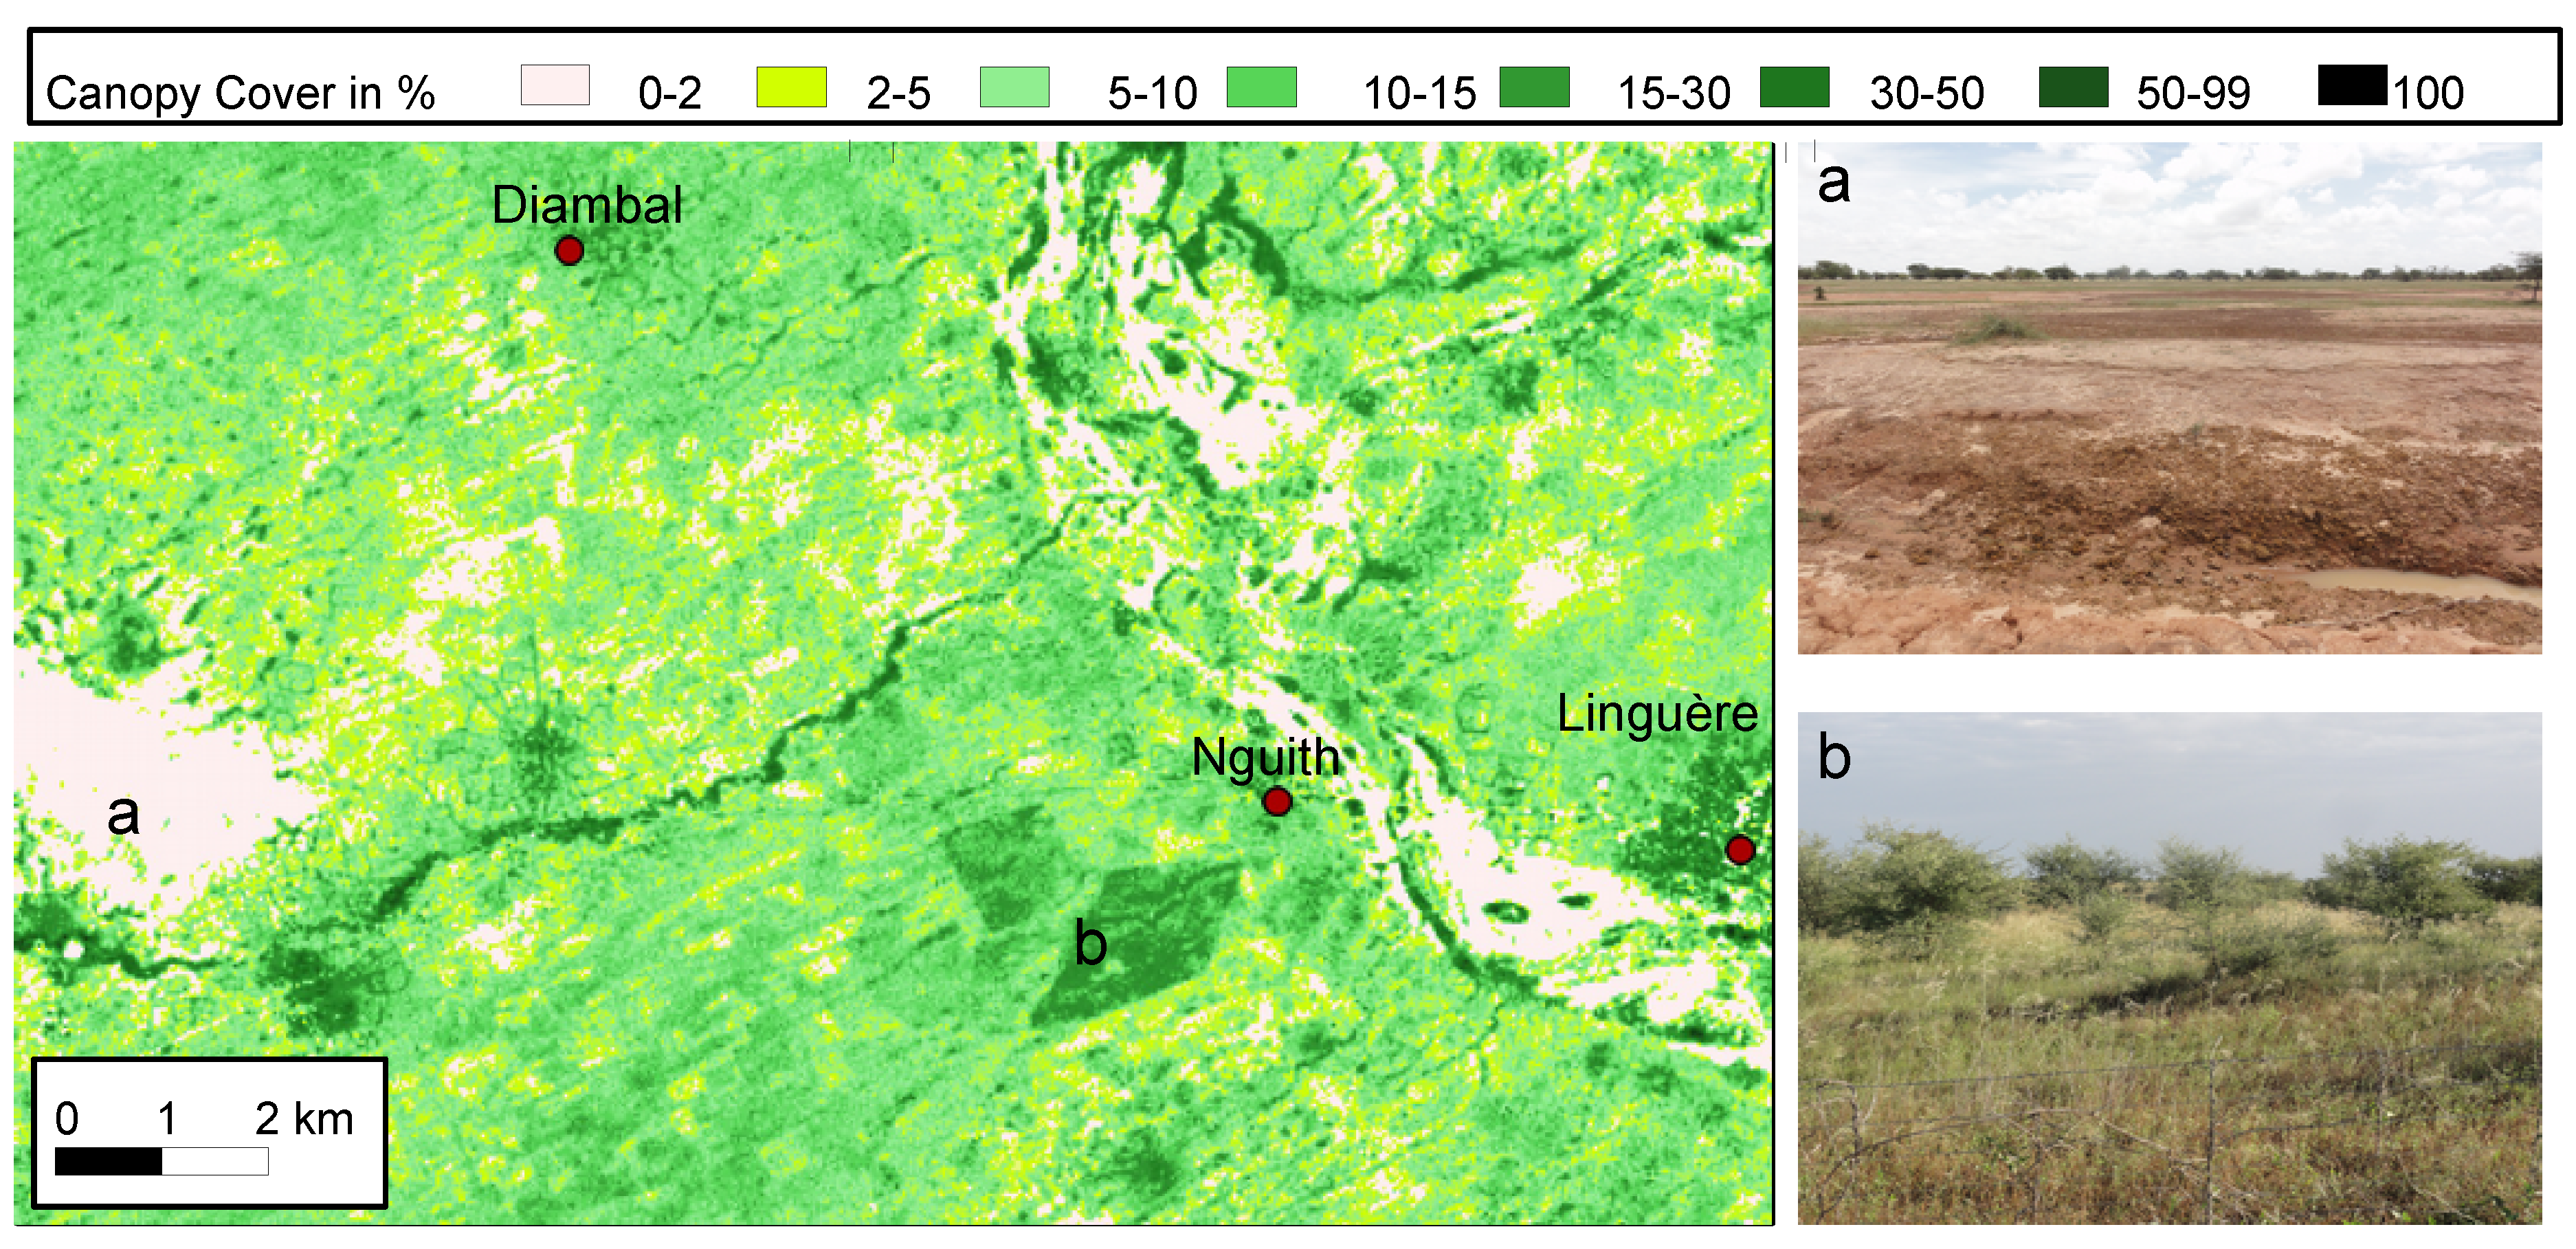
Table A3). Visual analysis revealed that several sparsely vegetated river beds of the Ferlo valley are erroneously modeled as
Bowel due to similar soil- and spectral-properties. Ferruginous
Bowel soils are largely located on the sandstone plateau in the east of the study area, but several spots are spread throughout the sandy zones, especially south of Khogue, but also west of Linguère and north of Kadji. They constitute the largest category in the study area with 39% while
Dek are the smallest with a portion of 2%.
Dek are mainly situated inside and along recent and ancient river beds.
Dior are the second predominant soil with a fraction of 31% equally distributed mainly along the northern and southern sandy ecoregion and sporadic along valleys in the east.
Bardial soils are slightly less widespread (28%) and often found more closely to river beds. This explains the slightly higher clay content.
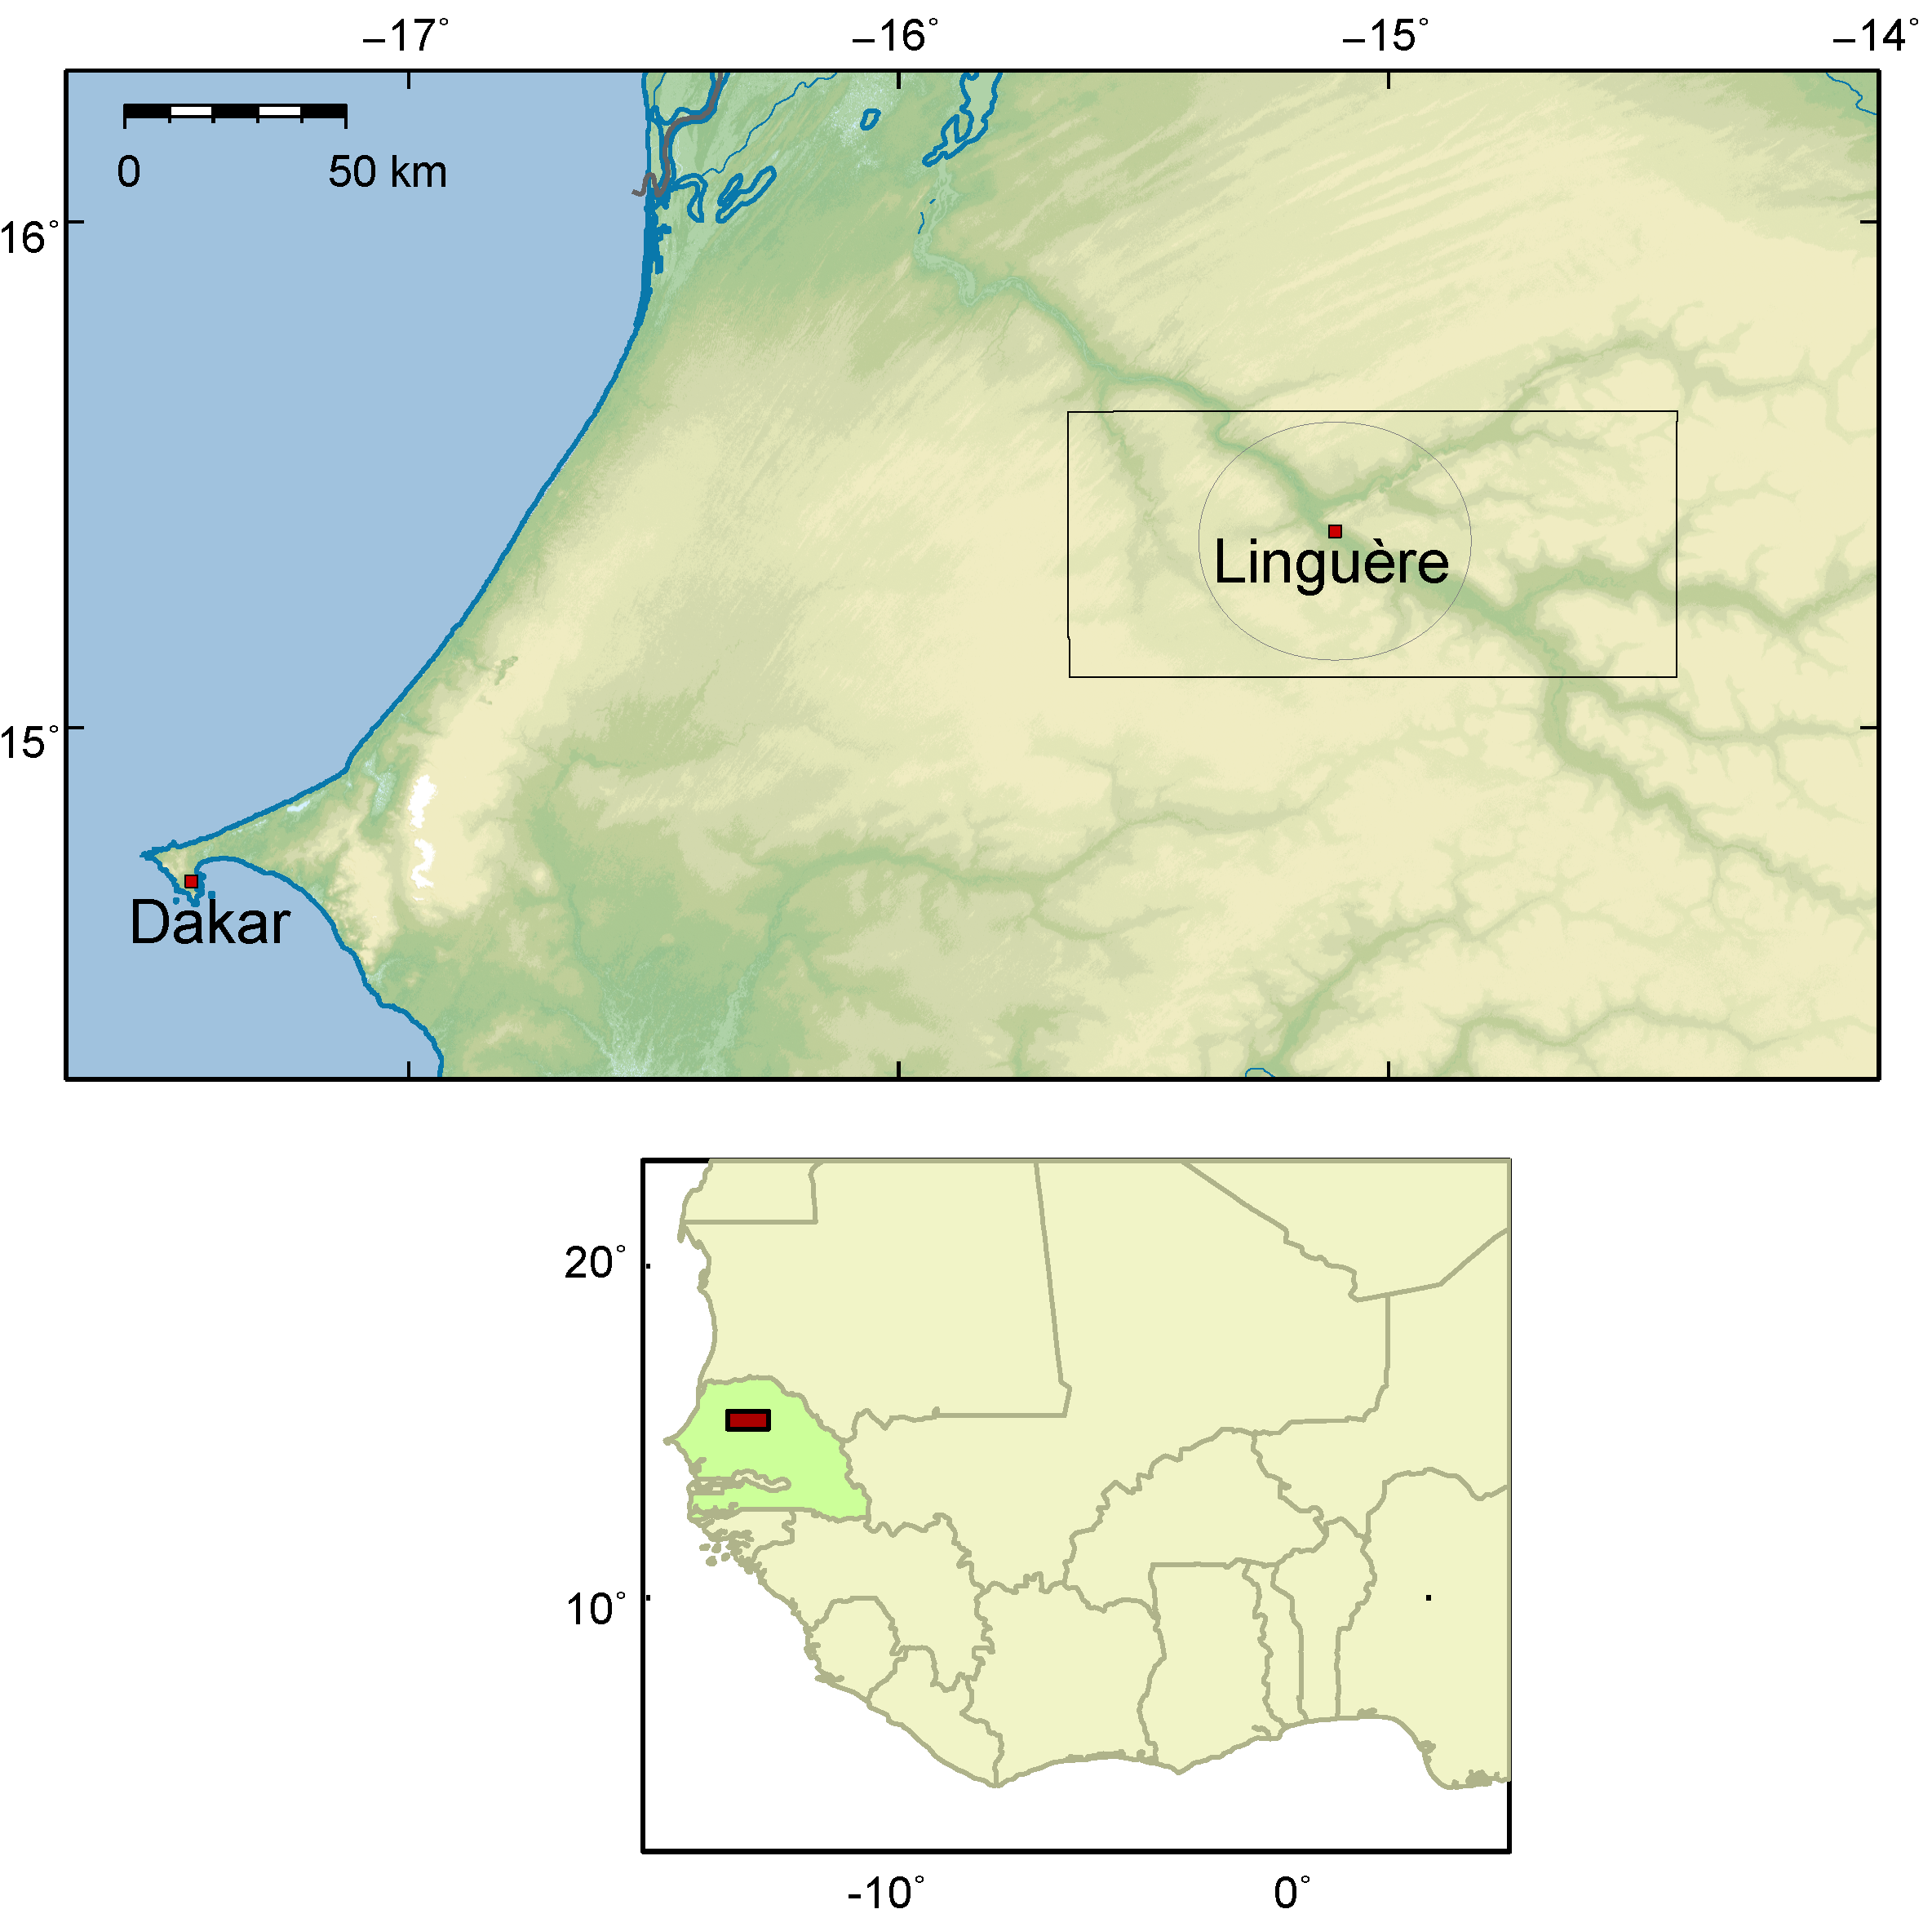
Figure 5.
Modeled soil types in the Ferlo around Linguère. The legend shows the soil names in Wolof. For the corresponding scientific names, see
Table 1. The area represents the square in
Figure 1.
Figure 5.
Modeled soil types in the Ferlo around Linguère. The legend shows the soil names in Wolof. For the corresponding scientific names, see
Table 1. The area represents the square in
Figure 1.
Validation of the modeled map was conducted by comparisons with existing soil maps. Neither the map of Maignien [
15] nor the one of Stancioff
et al. [
16] distinguish between different Arenosols. Apart from that, the pattern and distribution of soil types in the modeled soil map show a good agreement with existing maps. Stancioff
et al. [
16] found 3 prevailing soils corresponding with our clustered classes: (1) hydromorphic soils are situated in river beds and ancient valleys (
Dek/
Xour areas); (2) Regosols are found in the east and agree with
Bowel; (3) Sandy tropical ferruginous soils are located in the western part of the study area and agree with the distribution of
Dior and
Bardial Arenosols. Maignien [
15] classified hydromorphic soils as weakly hydromorph sandy and clayey soils. In Maignien’s soil map, the east of the study area (the
Bowel region) is covered by weakly leached tropical ferruginous soils, characterized by solidification and crusts in the deep. Maignien [
15] found two more soils in the zone modeled as
Dior/
Bardial: (1) ferruginous brown-red soils on siliceous sands situated around Kadji and in the northwest and west of the study area and (2) brown sub-arid soils, sometimes calcareous in the deep (south of Linguère).
By aggregating the modeled soil map to a coarser resolution (up to 1 km), the spatial pattern is preserved and still provides information on the predominant soil. This indirectly gives information on predominant woody vegetation and potential usage at a coarse scale. Local land cover maps [
19,
43] show a similar spatial pattern but the provided information differs. In comparison with MODIS (Moderate Resolution Imaging Spectroradiometer) global land cover maps, a much more realistic pattern can be observed on our soil map [
29].
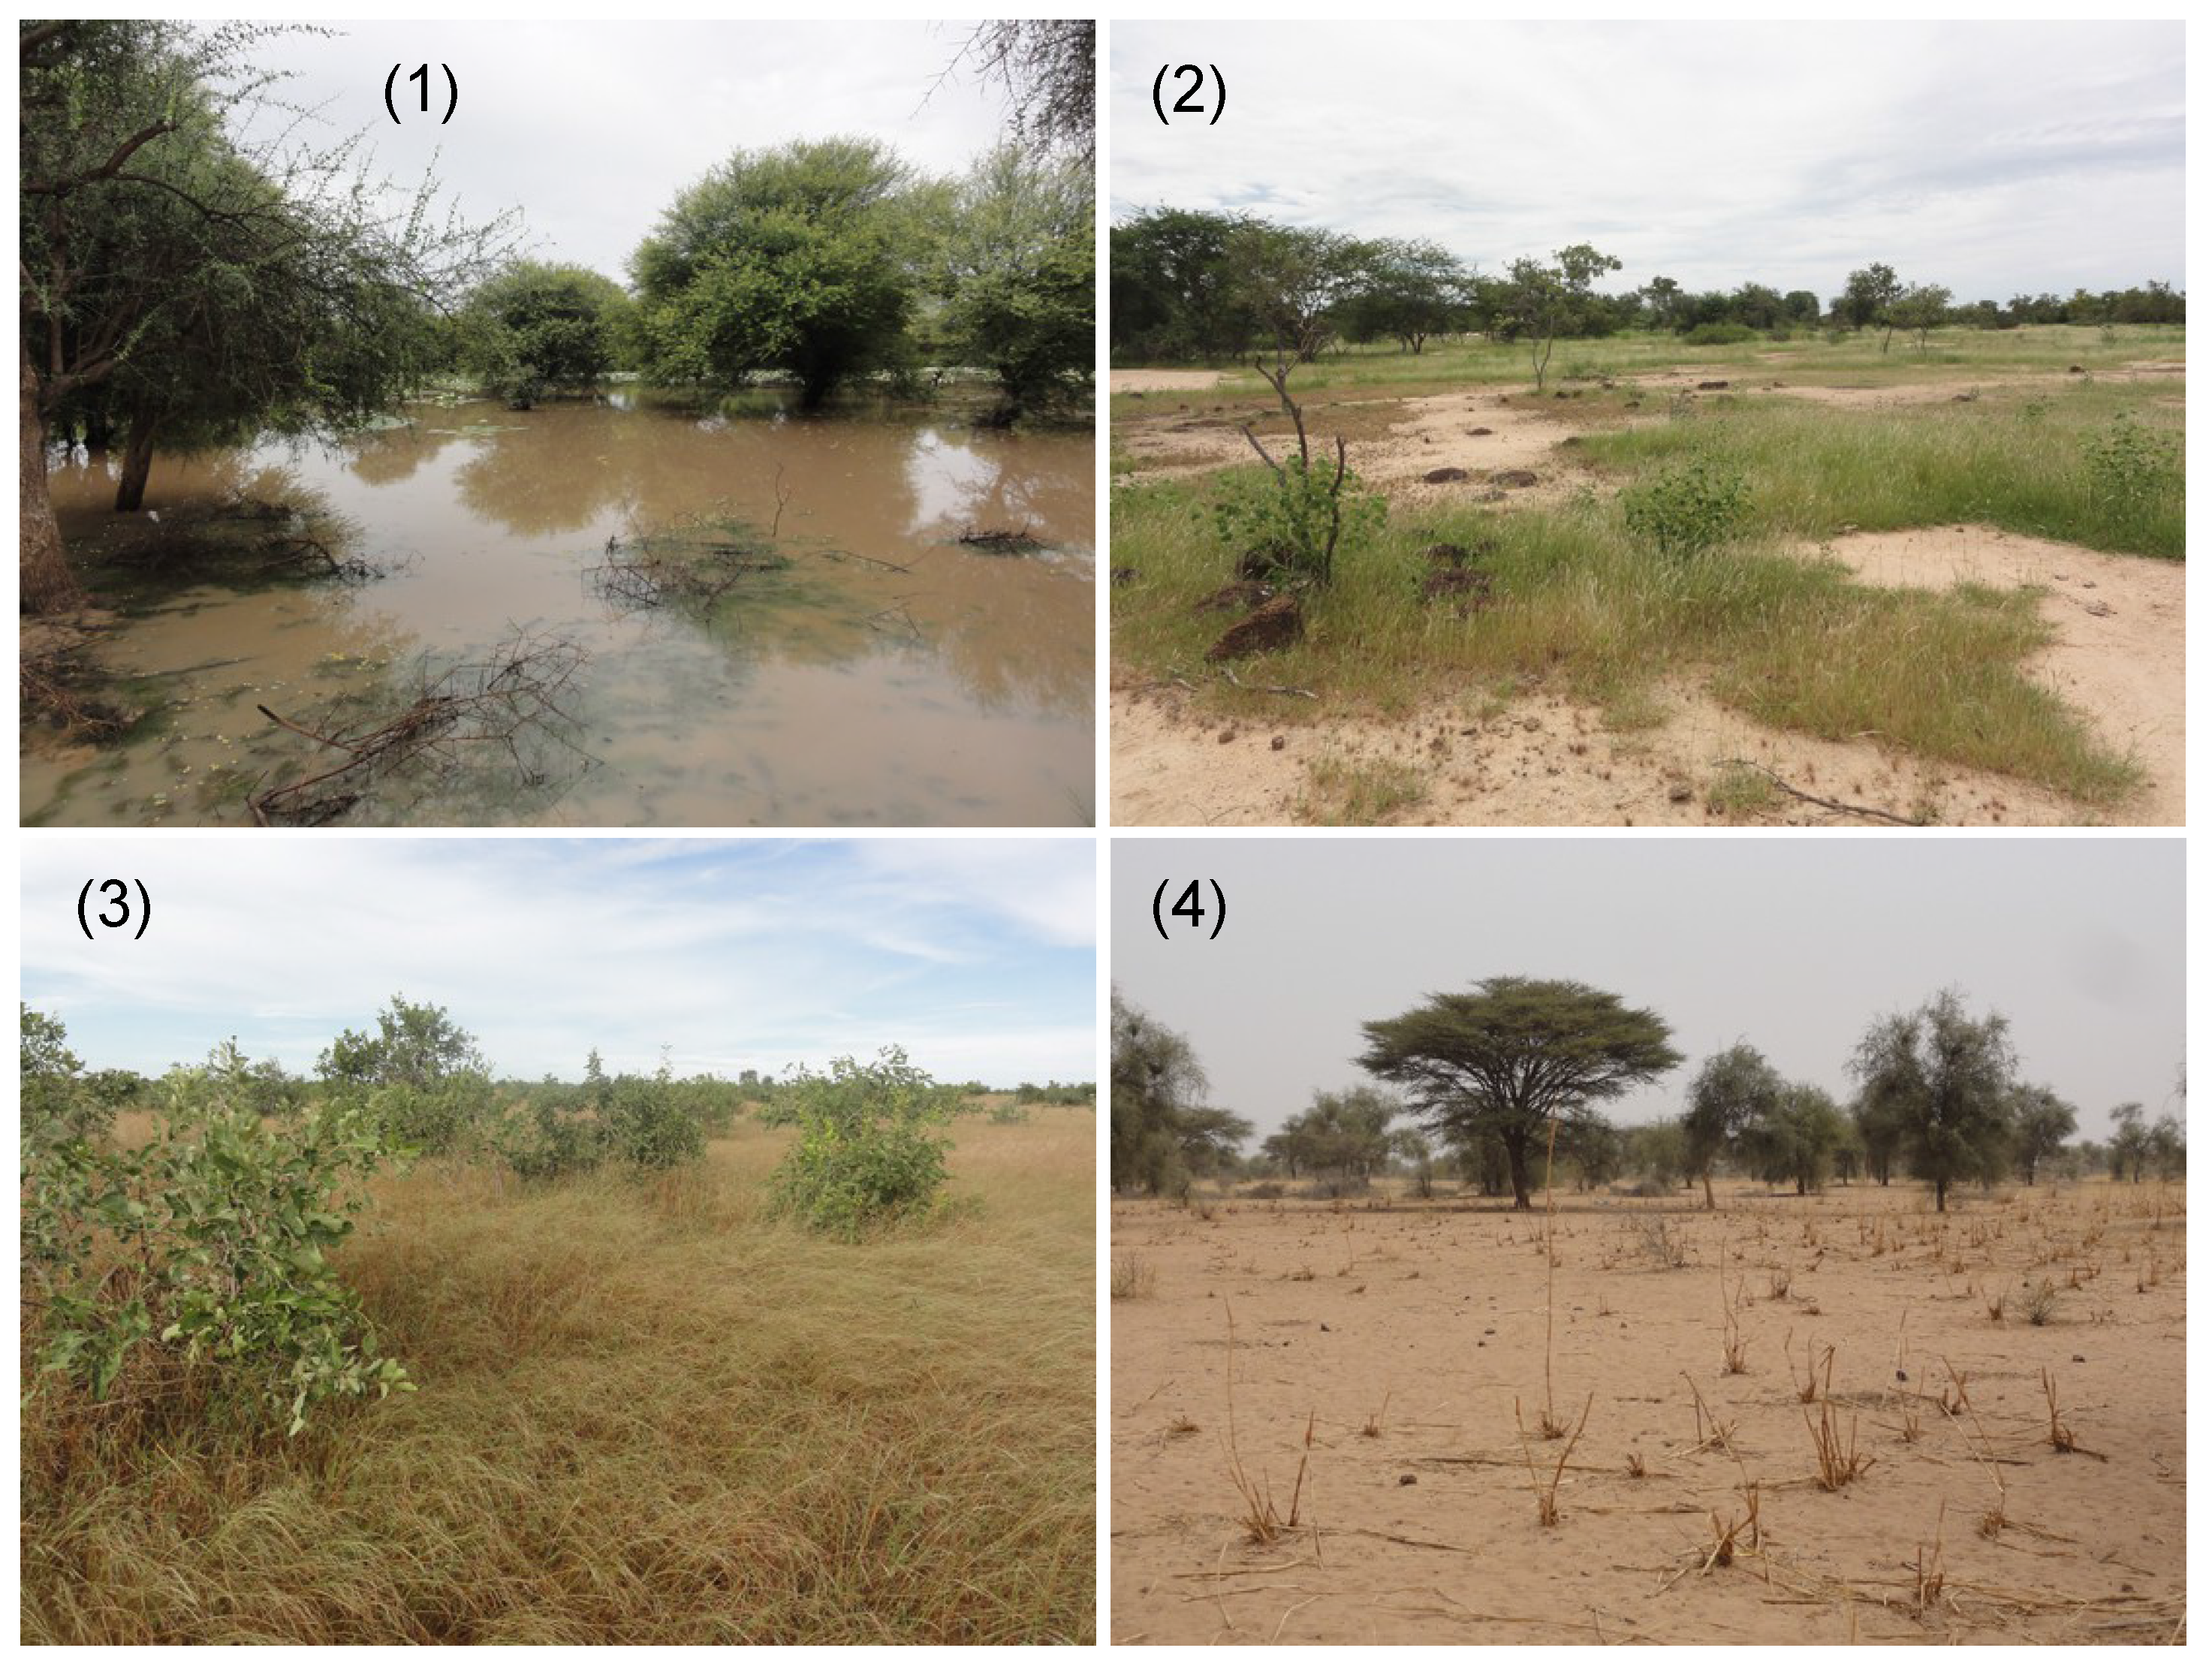
3.3.3. Relationship between Soil and Woody Vegetation
This section describes and discusses woody species surveys and canopy coverage according the classes (1)
Dek; (2)
Bowel; (3)
Dior; and (4)
Bardial. Results are summarized in
Table 3 and
Figure 8. Regarding species, trees and shrubs of all heights are included, whereas tree height, trunk circumference and trees/ha are only available for trees > 4 m (see
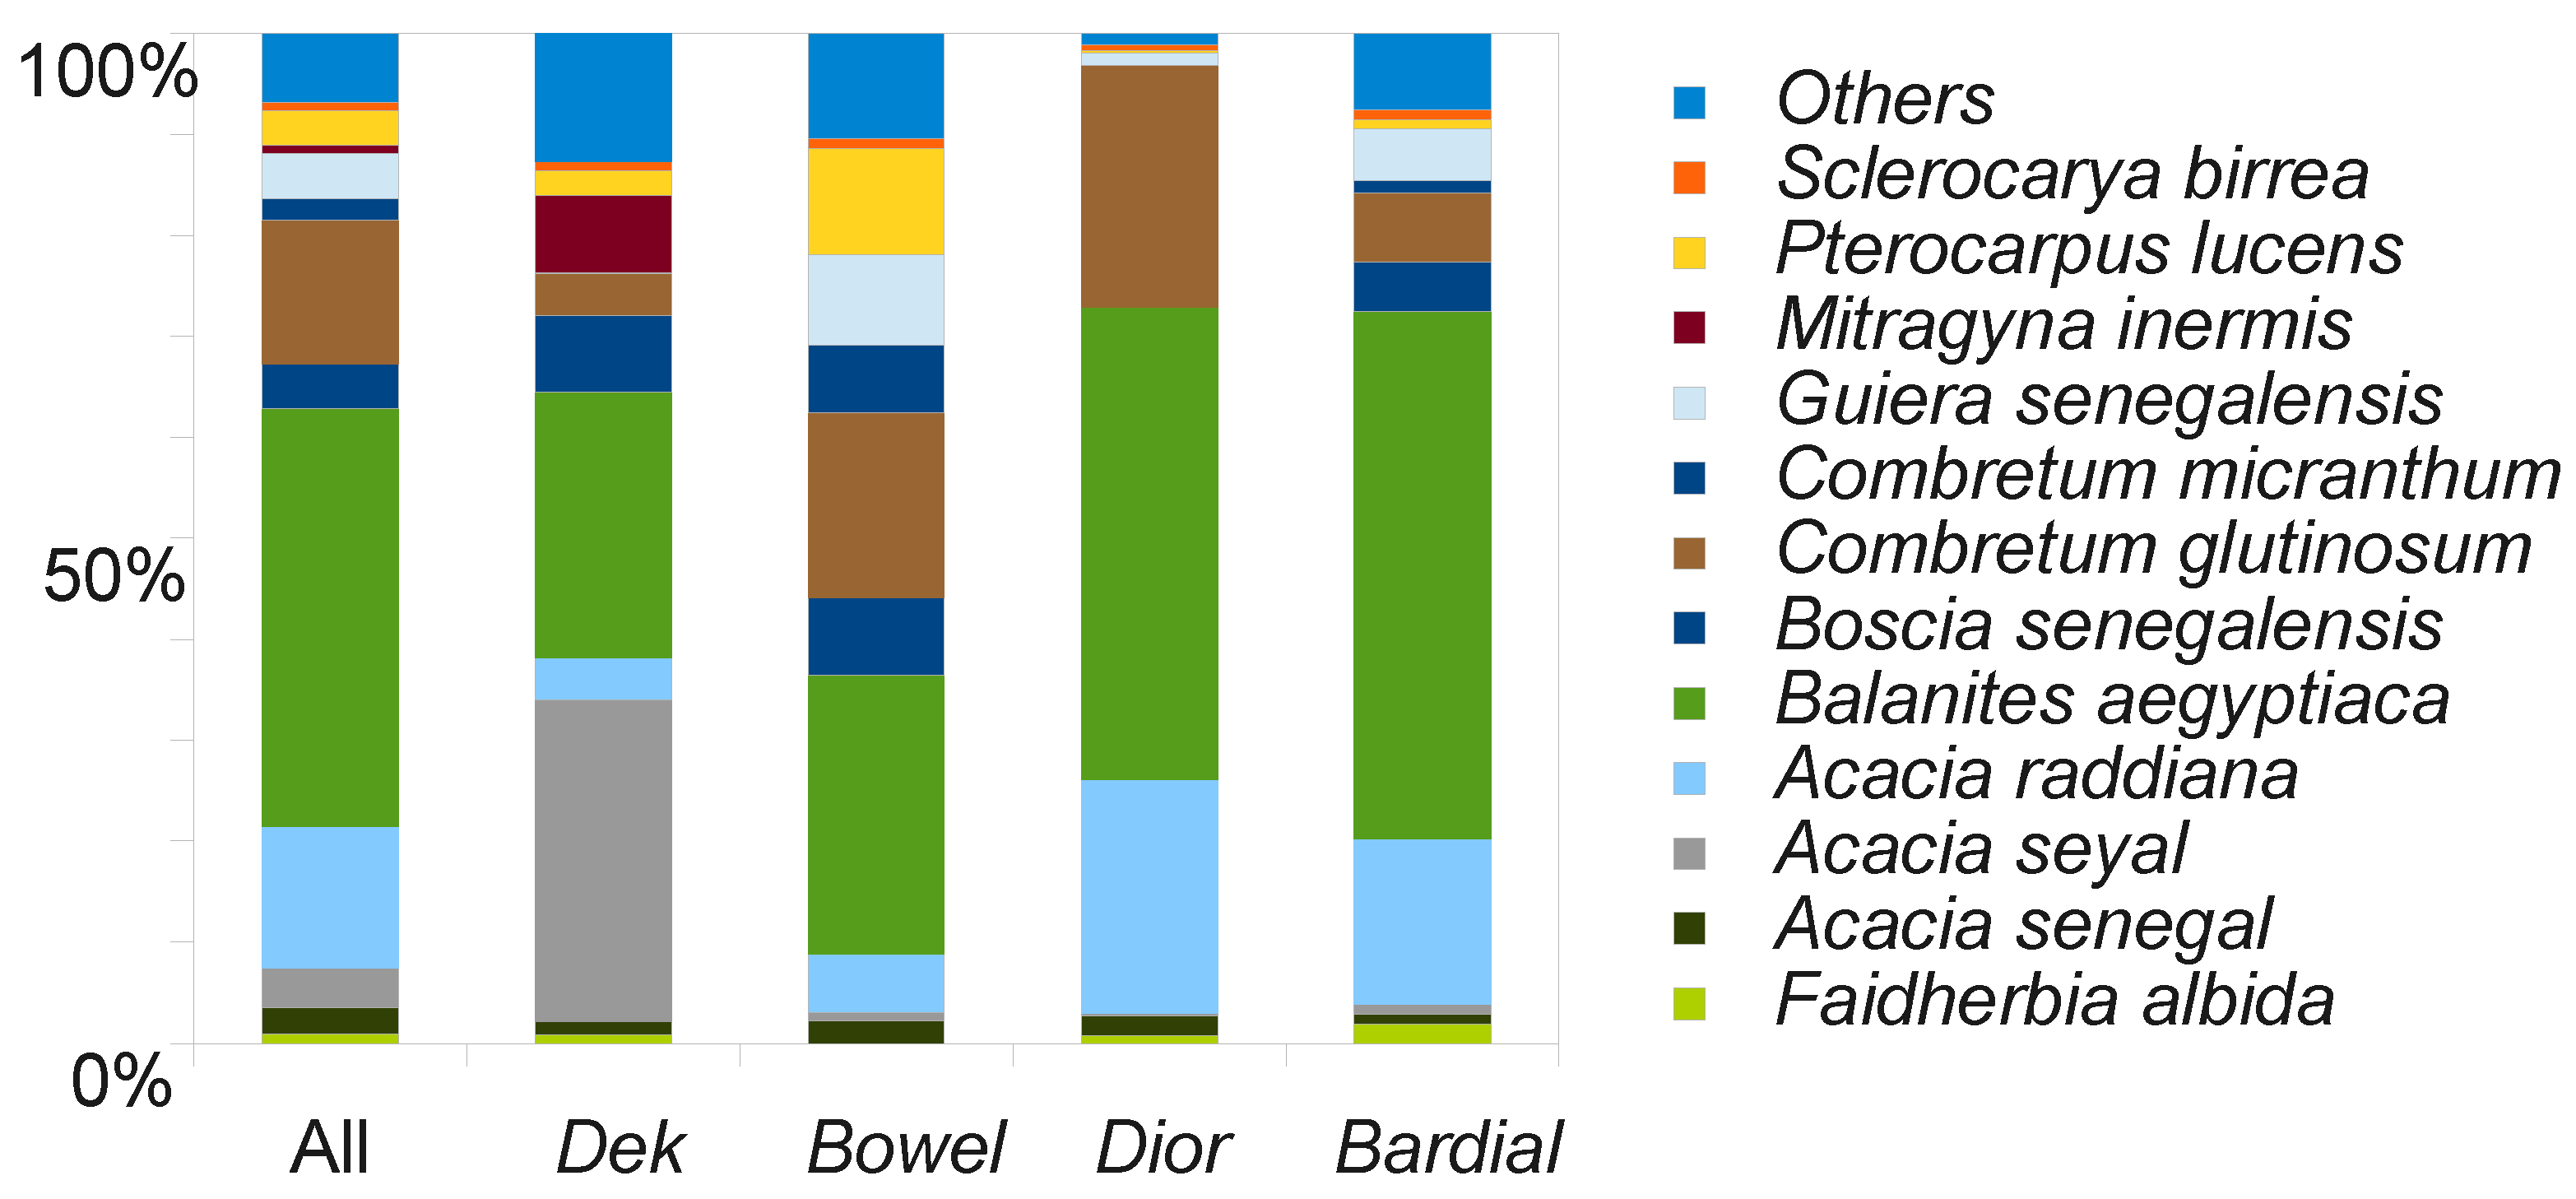
Table 3). The ratio tree/shrub counts the relation between trees > 4 m and shrubs < 4 m. At this point it has to be noted that much of today’s woody species composition is strongly influenced by humans and livestock. However, a clear pattern can still be observed. Mostly dominating are
Balanites aegyptiaca (43%),
Combretum glutinosum (15%) and
Acacia raddiana (15%) while 21 other species account for 27%.
Table 3.
Mean vegetation parameters classified according to the 4 clustered soil types derived for test sites from field data (*) and for the whole study area from remote sensing products.
Table 3.
Mean vegetation parameters classified according to the 4 clustered soil types derived for test sites from field data (*) and for the whole study area from remote sensing products.
| Parameter | Dek | Bowel | Dior | Bardial |
|---|
| % Spatial occurrence | 2 | 38 | 31 | 29 |
| Altitude (m) | 24 | 46 | 39 | 40 |
| NDVI (June) | 0.19 | 0.15 | 0.16 | 0.17 |
| Canopy cover (%) | 18 | 6 | 7 | 10 |
| Canopy cover <1% (%) | 0 | 29 | 9 | 3 |
| Trees/ha (>4 m) * | 53 | 26 | 11 | 15 |
| Tree height (>4 m) (m) * | 8 | 7.62 | 7.2 | 7.8 |
| Tree circumference (>4 m) (cm) * | 70 | 34 | 59 | 63 |
| % Shrubs | 34 | 60 | 77 | 61 |
Figure 8.
Distribution of the predominant species according to the 84 test sites (all heights). Note that Balanites aegyptiaca is dominant in all classes. Other: Acacia nilotica var. adansonii, Acacia nilotica var. tomentosa, Acacia pennata, Adansonia digitata, Combretum aculeatum, Combretum nigricans, Commiphora africana, Bauhinia rufescens, Grewia bicolor, Piliostigma reticulatum, Sterculia setigera, Tamarindus indica, Ziziphus mauritiana.
- (1)
A majority of rare species such as
Mitragyna inermis and
Acacia nilotica var. tomentosa are found on
Dek soils and are mostly absent in other classes (see
Figure 8). Especially the abundance of
Acacia seyal is statistically significantly higher (
0.05) on
Dek than in all other classes. Also mean tree height and trunk circumference of trees are greatest for the
Dek group. The ratio of shrubs to trees is 34%, showing that large trees are more frequent on hydromorphic soils. Furthermore, trees/ha as well as mean canopy coverage outnumber all other classes. 87% of the classified
Dek area exceeds a canopy cover of 10% (
Table 3).
- (2)
As mentioned, it is not always easy to draw a strict boundary between a
Dek soil within a
Xour and a loamy
Bowel. However,
Bowel Regosols have a unique species composition with significantly higher portions of
P. lucens,
Guiera senegalensis,
Combretum micranthum and
Boscia senegalensis than the other classes (
0.05). This composition follows the soil clustering, which generates only heavy clayey depressions with standing water as
Dek and summarizes all lateritic and loamy sites including depressions (
Xour) with above mentioned vegetation as
Bowel. Species richness on
Bowel Regosols is high (
Figure 8). Woody cover ranges from 0% to 89% with a mean of 6% due to a very heterogeneous landscape (see
Figure 7). 28% of the zone can be considered as relatively dense non-degraded bushland with a canopy cover > 10%, and 55% exceed a canopy cover of 5%. However, 29% of the
Bowel soils are deforested, mostly a sign of degradation. Widespread degradation is mainly a problem of the
Bowel class, as in all other soil classes combined, deforested areas account for merely 12%. Shrubs or small trees (<4 m) constitute 60% of the woody vegetation, which is evidence for the prevailing shrub savanna (
Table 3).
- (3)
Dior sites have a significantly higher abundance of
C. glutinosum (
0.05) than the other classes, most of them growing on peanut fallows and representing 24% of the woody population on
Dior. Numbers in trees/ha, canopy cover, deforested areas and species diversity (
Figure 8) are strongly influenced by humans, as most shrubs are cut down when a field is changed from fallow to actively cultivated cropland. Thus, coverage is higher on fallows but still low, since farmers prefer not to have any large trees within their groundnut fields, as trees attract birds which subsist on crops during the harvest. Trees are not needed for fixing nitrogen, as groundnuts and beans are legumes as well. This is also expressed by the percentage of shrubs and small trees (<4 m), which is 77% on
Dior. Mean tree height and trunk circumference are slightly lower than on
Bardial Arenosols which are used for growing millet (
Table 3).
- (4)
Bardial exceed
Dior in trees/ha and canopy cover as well. Deforested areas are mostly nonexistent on
Bardial. Moreover, most
B. aegyptiaca are found on
Bardial soils, but their abundance is not significantly higher than on
Dior (see
Table 3 and
Figure 8).


