1. Introduction
Many governments in West Asia, here defined as the Arabic countries of the Arabian Peninsula plus Turkey and Iran, have enacted laws to protect environmental resources since the 1990s [
1], but pressures facing the environment have increased. A report by UNEP and other regional organizations [
2] describes how the region is characterized by rapid population growth, which is expected to rise from 334.5 million individuals in 2008 to over 580 million in 2050. Population growth, increased wealth and strategies to diversify economies away from a dependence on oil export are causing ever-growing water scarcity, desertification, salinization of groundwater, pollution of water bodies and other land use developments that are unsustainable.
As defined by Article 1 of the Ramsar Convention, wetlands are “
areas of marsh, fen, peatland or water, whether natural or artificial, permanent or temporary, with water that is static or flowing, fresh, brackish or salt, including areas of marine water the depth of which at low tide does not exceed six metres” [
3]. Wetland types found in the West Asian region include mangroves, sea grass beds, brackish wetlands,
wadis (riverbeds that typically are flooded only after heavy rain), bogs, and freshwater marshes [
4]. West Asia contains approximately 107,000 km
2 of wetlands, excluding wadis. For comparison, the Pantanal wetland system in South America covers 150,000 km
2. Nonetheless, given the prominence of environmental issues related to water supply and quality in West Asia, remaining wetland areas in the region are at grave risk.
It has long been recognized that losing natural resources such as wetland ecosystems affects human welfare [
5,
6]. Nowadays the local and global benefits in the form of goods or services to human society provided by ecosystems are known as ecosystem services [
7,
8]. The ecosystem services of wetlands are manifold (e.g., Barbier
et al. [
9] and Russi
et al. [
10]) and include climate regulation that occurs as wetlands capture carbon dioxide, methane and nitrous oxide; nursery provision for fish populations; flood protection to inland settlements; regulating groundwater recharge; filtering nutrients and pollutants from surface water; and providing opportunities for recreational and educational activities. When wetlands decline in terms of area or ecological quality this puts the delivery of such ecosystem services at risk.
The impact of social and economic developments on freshwater and coastal wetlands in West Asia is significant and the policy response in the region has been inadequate [
11]. Urban expansion takes place on scenic coastal locations or even in marine ecosystems off-shore. Development is driven by population growth, but also by the desire to diversify economies towards tourism. These developments destroy coastal wetlands including mangroves, coral reefs and sea-grass beds directly. There are also indirect effects caused by increased run-off from wastewater, fertilizers, and desalinization plants, as well as damage to resources caused by tourist visits. A drive to increase agricultural production has in the past led to great loss of freshwater wetlands via upstream water extraction and conversion of wetlands. Overfishing causes further imbalances in ecosystems that are already fragile.
One cause of the overexploitation of wetlands, and many natural resources in general, is that the full suite of benefits they provide are rarely accounted for in decision making in an integrated approach. Consequently wetlands are “too cheap” in economic terms and there is little economic incentive for their conservation as compared to the economic benefits of, e.g., a new office block or aquaculture. The ecosystem services framework proposed by the Millennium Ecosystem Assessment [
7] and The Economics of Ecosystems and Biodiversity [
12,
13] can help inform policy makers about the benefits of wetlands. To include economic considerations in national decision making is an approach that has been taken up by governments around the globe in their National Biodiversity Strategy Action Plans. Its actual implementation in policy has been less widespread [
14], however, and still has scientific hurdles to overcome [
15].
In both the scientific and “grey” literature there are very few publications about the economic value of natural resources in West Asia. Al-Madani
et al. [
16] assess the impacts of dredging and land reclamation on the mangroves and other coastal wetland types of Bahrain. They argue that the effect on fisheries would have macro-economic impacts as well, as at the time 10.5% of the Bahraini working population was active in the fisheries sector. Shaltout
et al. [
17] consider the species richness of
sabkha (salt flat) areas in Saudi Arabia, without looking at social or economic benefits. Other researchers have estimated several non-market values of wetlands in Iran [
18], the potential tourism value of Iranian wetlands [
19], and a
wadi in Oman [
20].
This paper presents the first large scale assessment of the economic value of coastal and freshwater wetlands in West Asia. In the following section, we provide a brief overview of the general concept and approach to estimate the total economic value of natural resources. Subsequently, we describe our specific method applied, data used and our results. We conclude with our most important findings and by suggesting steps to improve this type of analysis when the policy context requires more detailed information.
2. Total Economic Value of Natural Resources and Value Transfer
In this section we provide an introduction to the total economic value (TEV) of natural resources and the valuation technique employed in this study. The TEV of natural resources is the aggregate of a range of different value types generated by natural resources (e.g., Turner
et al. [
21]).
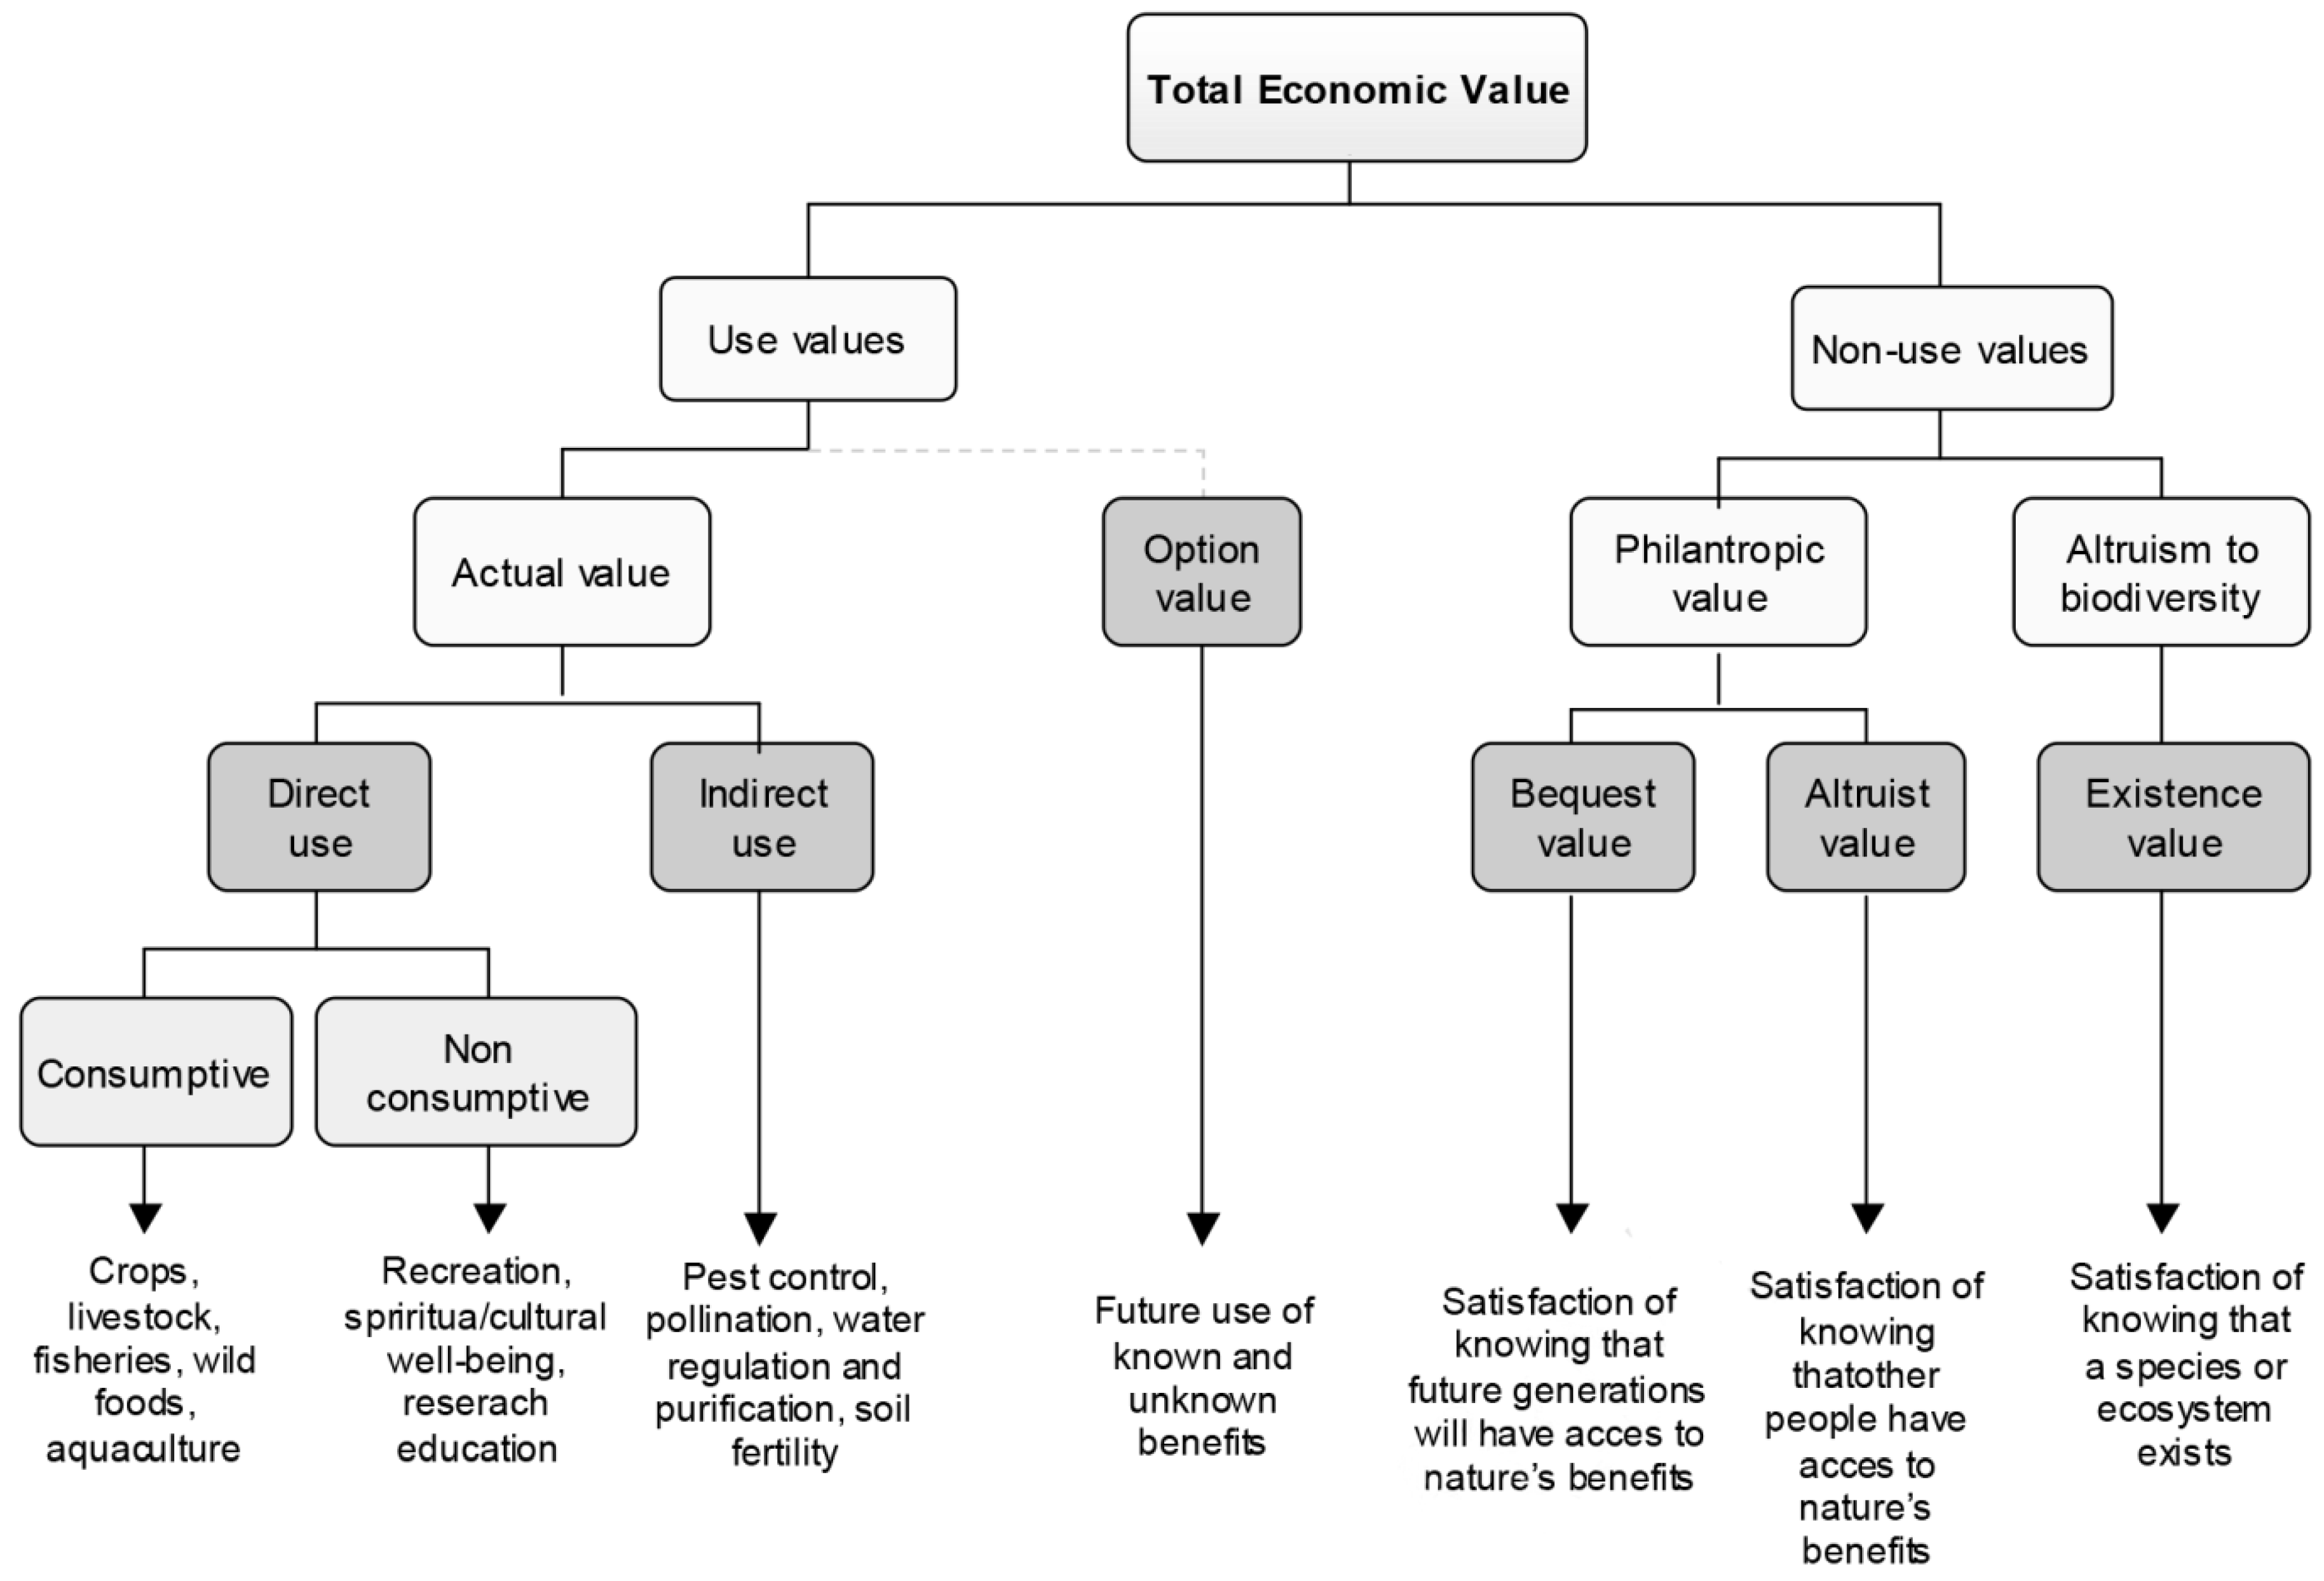
Figure 1 illustrates TEV and its value components. If we disregard “option value” because it is not a frequent subject in applied studies, the main distinction is between use values and non-use values. Use values are divided into direct use values, benefits that originate from using or actively experiencing natural resources, such as recreation and the production of food, and indirect use values that stem from ecosystems’ ability to self-regulate and ensure stable delivery of other environmental flows. Non-use values derive from a psychological or emotional attachment to nature. Although in practice the value categories cannot always be strictly maintained, TEV is an accepted framework for assessing the value of natural resources in monetary terms. An EPA-SAB report [
22] discusses monetary values as opposed to other value systems. That discussion, however, is beyond the scope of this introduction.
There are several techniques for estimating the monetary value of natural resources, for which there often are no or only imperfect markets. These techniques can be based on prices of substitute or complimentary goods, time and money spent to visit natural parks, or surveys of users of environmental goods and services. Insightful discussions of these various techniques are provided by Freeman [
23] and Van Beukering
et al. [
24]. Most of these techniques, however, have a high cost in terms of time and resources.
Figure 1.
Composition of the Total Economic Value (TEV) of natural resources. Source: TEEB [
7], Chapter 5.
Figure 1.
Composition of the Total Economic Value (TEV) of natural resources. Source: TEEB [
7], Chapter 5.
A cost-effective technique is value transfer, where one takes existing value estimates from one or more study sites and applies them to the site of interest, the policy site. This technique is relatively fast because it is based on results from published valuation studies. It can also be used for “scaling up”, which is the process of taking values estimated from localized changes in individual study sites to assess changes in multiple policy sites in a larger geographic area [
25]. For this assessment of the economic value of wetlands in West Asia, value transfer was considered the best and most effective option to generate the desired indicative results.
All value transfer exercises entail a degree of uncertainty that are caused by errors in the value data (“measurement error”), biases in the valuation literature (“publication selection bias”), and errors caused by statistical analysis (“generalization error”) [
26]. Measurement error in primary valuation estimates may result from weak methodologies, unreliable data, analyst errors, and the whole gamut of biases and inaccuracies associated with market and non-market valuation methods. Publication selection bias arises if there is an editorial preference to publish statistically significant results and novel valuation applications rather than replications or if the available stock of knowledge is skewed towards wetlands for which there is high awareness and policy interest. Generalization error occurs when values for study sites are transferred to policy sites that are different without fully accounting for those differences. Potentially important differences between wetlands that will result in different ecosystem service values include the determinants of supply (wetland scale, quality, functioning and the availability of complementary ecosystems) and demand for wetland services (population, income, preferences and the availability of substitute ecosystems) [
27].
In addition, generalization error can occur when the spatial resolution of the data used to map spatial phenomena differs between the study and policy sites. Such differences may be in terms of population characteristics as well as physical or environmental characteristics of the natural resource or wetland.
There are several options of technical sophistication when conducting a value transfer exercise. On the one extreme, one can employ “unit transfer” to apply directly a value found for a study site to the policy site(s). If the policy sites are very similar to the study site, this can be an acceptable approach. At the other end of the scale of complexity is “meta-analytic value transfer”, which uses a multitude of valuation publications to generalize from their findings through statistical analysis of ecological and socio-economic variables [
28]. The product of the statistical analysis is a “meta-analytic value function”, which can be used to estimate monetary values. This approach may minimize the degree of errors when values are transferred across ecosystems with substantially different characteristics [
29,
30].
3. Method
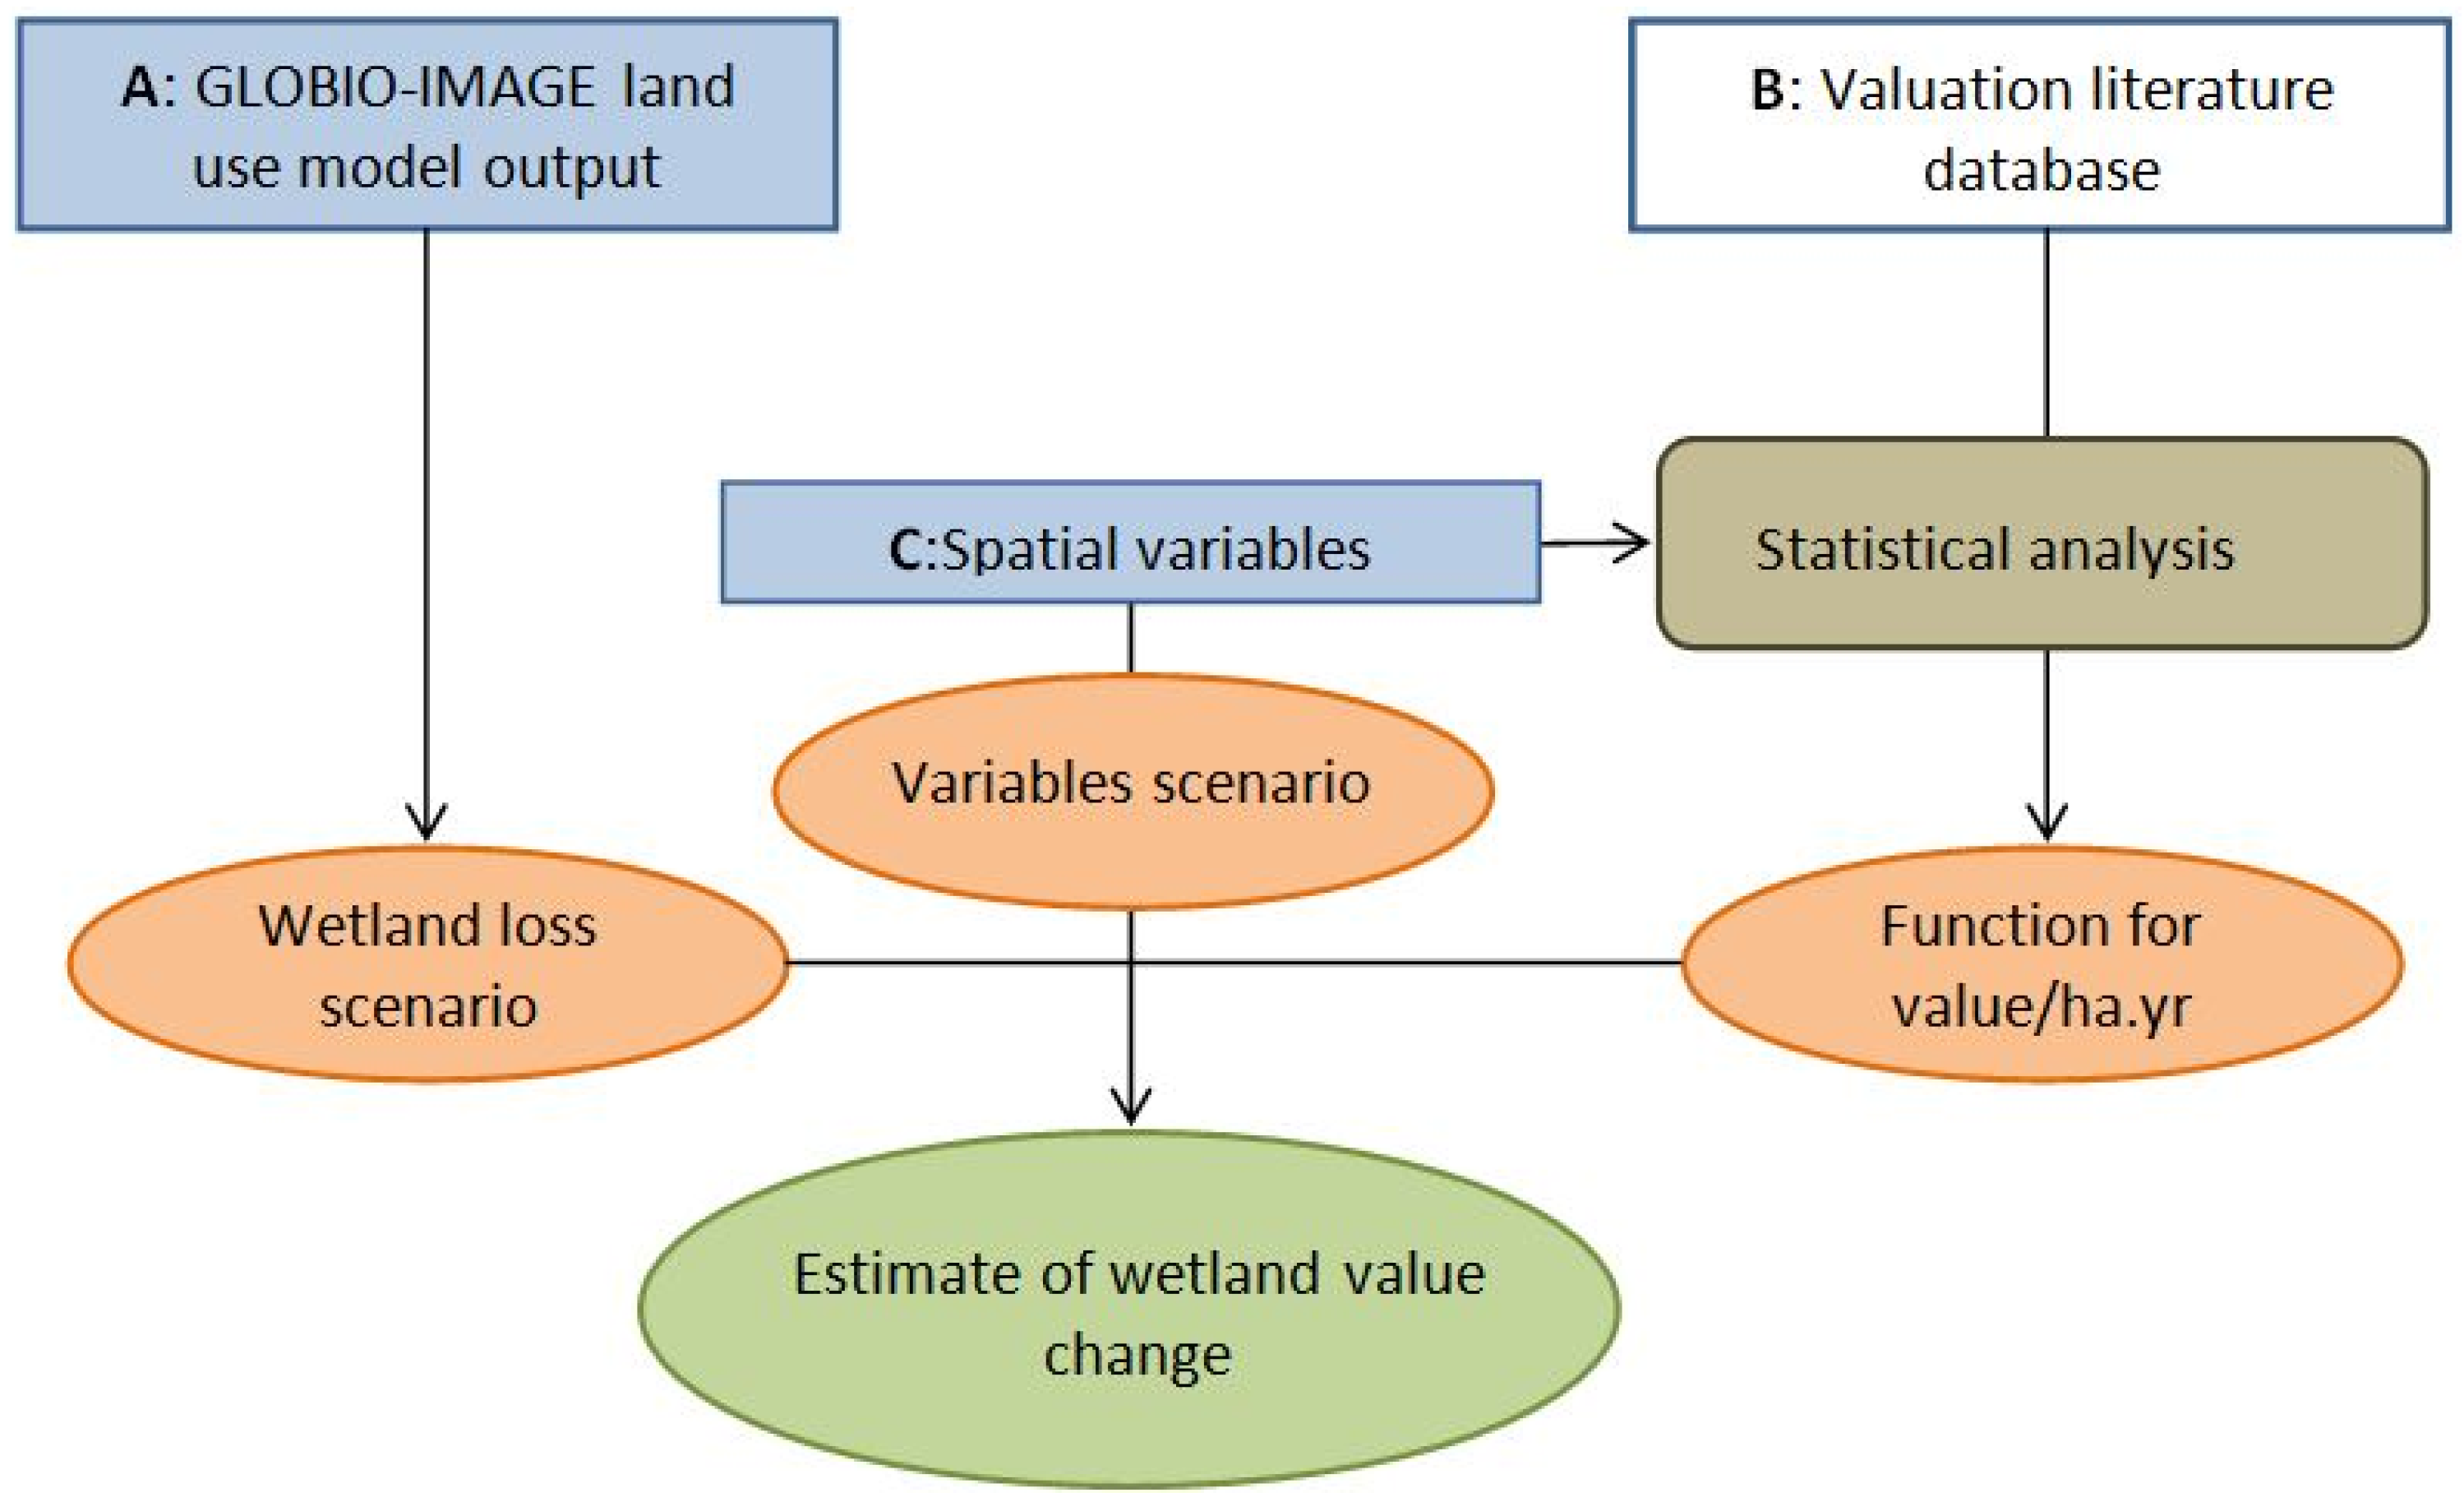
The approach used in this study combines various data sources and model outputs as shown in
Figure 2. There are three types of data that constitute the pillars of our method. The first pillar is the output of the “Integrated Model to Assess the Global Environment—Global Biodiversity” (IMAGE-GLOBIO) integrated assessment model [
31,
32] which predicts loss of area for a suite of habitat types including wetlands (component A in
Figure 2). A data set developed from primary valuation studies constitutes the second pillar (component B in
Figure 2). The third pillar is provided by spatial ecological and socio-economic variables that are used in a statistical meta-analysis of the valuation literature to give a function that relates wetland value to various explanatory variables (component C in
Figure 2).
Figure 2.
Schematic representation of the method.
Figure 2.
Schematic representation of the method.
To define a baseline scenario for freshwater and coastal wetland change as well as mangrove change for the period 2000–2050 and 2010–2050, respectively, this report makes use of the results of the IMAGE-GLOBIO integrated assessment model [
31,
32]. IMAGE-GLOBIO is a modeling framework developed to calculate the impact of five environmental drivers on terrestrial biodiversity. The IMAGE model is based on cause-effect relationships derived from the literature and uses spatial information on drivers of change for macro-economic modeling to calculate sectoral changes in supply and demand. The output of IMAGE comprises spatially explicit changes in urban construction, agriculture and infrastructure. These outputs are in turn used in the GLOBIO model, which derives changes in the extents of a range of habitat types. It should be noted that IMAGE-GLOBIO predicts area changes but does not cover changes in ecosystem quality. Hence impacts from, e.g., brine disposal from desalinization plants are not included in this analysis. Since the model furthermore does not predict area loss of wetlands or mangroves specifically, we allocate loss predictions from neighboring non-wetland habitats to the wetland sites. Underlying this step is the assumption that local developments in terms of population growth, urban sprawl, and conversion affect wetland in equal measure as they do non-wetland habitats.
The value transfer technique employed here is meta-analytic value transfer. This technique includes a suite of ecological and socio-economic characteristics of wetland sites that might affect their value [
27]. We use this technique because there are very few publicly available valuation studies of freshwater or coastal wetlands in West Asia. Therefore, all value observations come from other regions of the world. Applying a straightforward unit transfer approach would almost certainly entail large estimation errors. As indicated earlier, a more integral statistical analysis has been found to minimize errors in such conditions.
The data collected for this study are value observations from mangroves and other wetland types from studies that have been conducted across the world. These value observations tend to be of individual ecosystem services or TEV, although some studies provide value observations for a set of ecosystem services. For the purposes of the statistical analysis, however, each observation is essentially treated as an observation of TEV. We separate value observations for distinct ecosystem services and include ecosystem service type as an explanatory variable in the statistical analysis. For a detailed description of the literature databases and the statistical analyses used in this study, we refer to [
25] for wetlands and [
33] for mangroves Both publications are available online with Open Access, and are also directly available from the corresponding author upon request, but we show an overview of the statistical results in
Table 1.
The statistical analyses produce meta-analytic value functions that can be used to estimate values of mangroves as well as freshwater and non-mangrove coastal wetlands. This requires spatially distributed observations of ecological and socio-economic variables. Constructing the maps of freshwater and coastal wetlands in West Asia was performed using the publicly available Global Database of Lakes, Reservoirs and Wetlands [
4]. Intermittent wetlands such as wadis can be clearly identified in the map representation of this database, but are excluded from the analysis because the meta-analytic value transfer function is not applicable to this wetland type.
Table 1.
Meta-analytic value functions for mangroves, and coastal and freshwater wetlands. The dependent variable is the natural log of the dollar value per hectare per year for the respective ecosystems.
Table 1.
Meta-analytic value functions for mangroves, and coastal and freshwater wetlands. The dependent variable is the natural log of the dollar value per hectare per year for the respective ecosystems.
| Variable | Coefficient (Mangroves) 1 | S.E. | Coefficient (Wetlands) 1 | p-value |
|---|
| Constant | −0.590 | 2.193 | −0.970 | 0.709 |
| Coastal protection 2 | 1.456 *** | 0.491 | - | - |
| Water quality 2 | 1.714 ** | 0.752 | - | - |
| Fisheries 2 | 0.860 ** | 0.355 | - | - |
| Fuel wood 2 | −1.085 ** | 0.437 | - | - |
| Contingent valuation 2 | - | - | 0.317 | 0.625 |
| Choice experiment 2 | - | - | −0.524 | 0.581 |
| Hedonic pricing 2 | - | - | −2.328 ** | 0.043 |
| Travel cost method 2 | - | - | −0.705 | 0.261 |
| Replacement cost 2 | - | - | −0.383 | 0.538 |
| Net factor income 2 | - | - | −0.125 | 0.843 |
| Production function 2 | - | - | −0.091 | 0.896 |
| Market prices 2 | - | - | −0.215 | 0.712 |
| Opportunity cost 2 | - | - | −1.164 | 0.165 |
| Marginal valuation 2 | - | - | 0.828 * | 0.053 |
| Inland marshes 2 | - | - | −0.211 | 0.726 |
| Peatbogs 2 | - | - | −2.266 *** | 0.004 |
| Salt marshes 2 | - | - | 0.073 | 0.901 |
| Intertidal mudflats 2 | - | - | −0.239 | 0.672 |
| Flood control 2 | - | - | 0.626 | 0.169 |
| Water supply 2 | - | - | −0.106 | 0.828 |
| Water quality 2 | - | - | 0.514 | 0.288 |
| Commercial fishing/hunting 2 | - | - | 0.042 | 0.917 |
| Recreational fishing 2 | - | - | −1.355 *** | 0.002 |
| Recreational hunting 2 | - | - | −0.119 | 0.786 |
| Natural materials 2 | - | - | −0.153 | 0.732 |
| Fuel wood 2 | - | - | −0.959 | 0.198 |
| Non-consumptive recreation 2 | - | - | 0.218 | 0.626 |
| Aesthetic 2 | - | - | 0.432 | 0.370 |
| Natural habitat 2 | - | - | 1.211 ** | 0.012 |
| Mangrove area (ha; ln) | −0.343 *** | 0.065 | - | - |
| Mangrove abundance (km2 within 50km radius; ln) | 0.248 *** | 0.082 | - | - |
| Wetland area (ha; ln) | - | - | −0.218 *** | 0.000 |
| Wetland abundance (ha within 50km radius; ln) | - | - | −0.125 | 0.118 |
| Roads (km within 50 km radius; ln) | −0.312 * | 0.175 | - | - |
| GDP per capita (US$; ln) | 0.785 *** | 0.174 | 0.430 *** | 0.004 |
| Population (within 50km radius; ln) | 0.284 | 0.149 | 0.503 *** | 0.000 |
| N | 130 | | 222 | |
| R-squared | 0.45 | | 0.36 | |
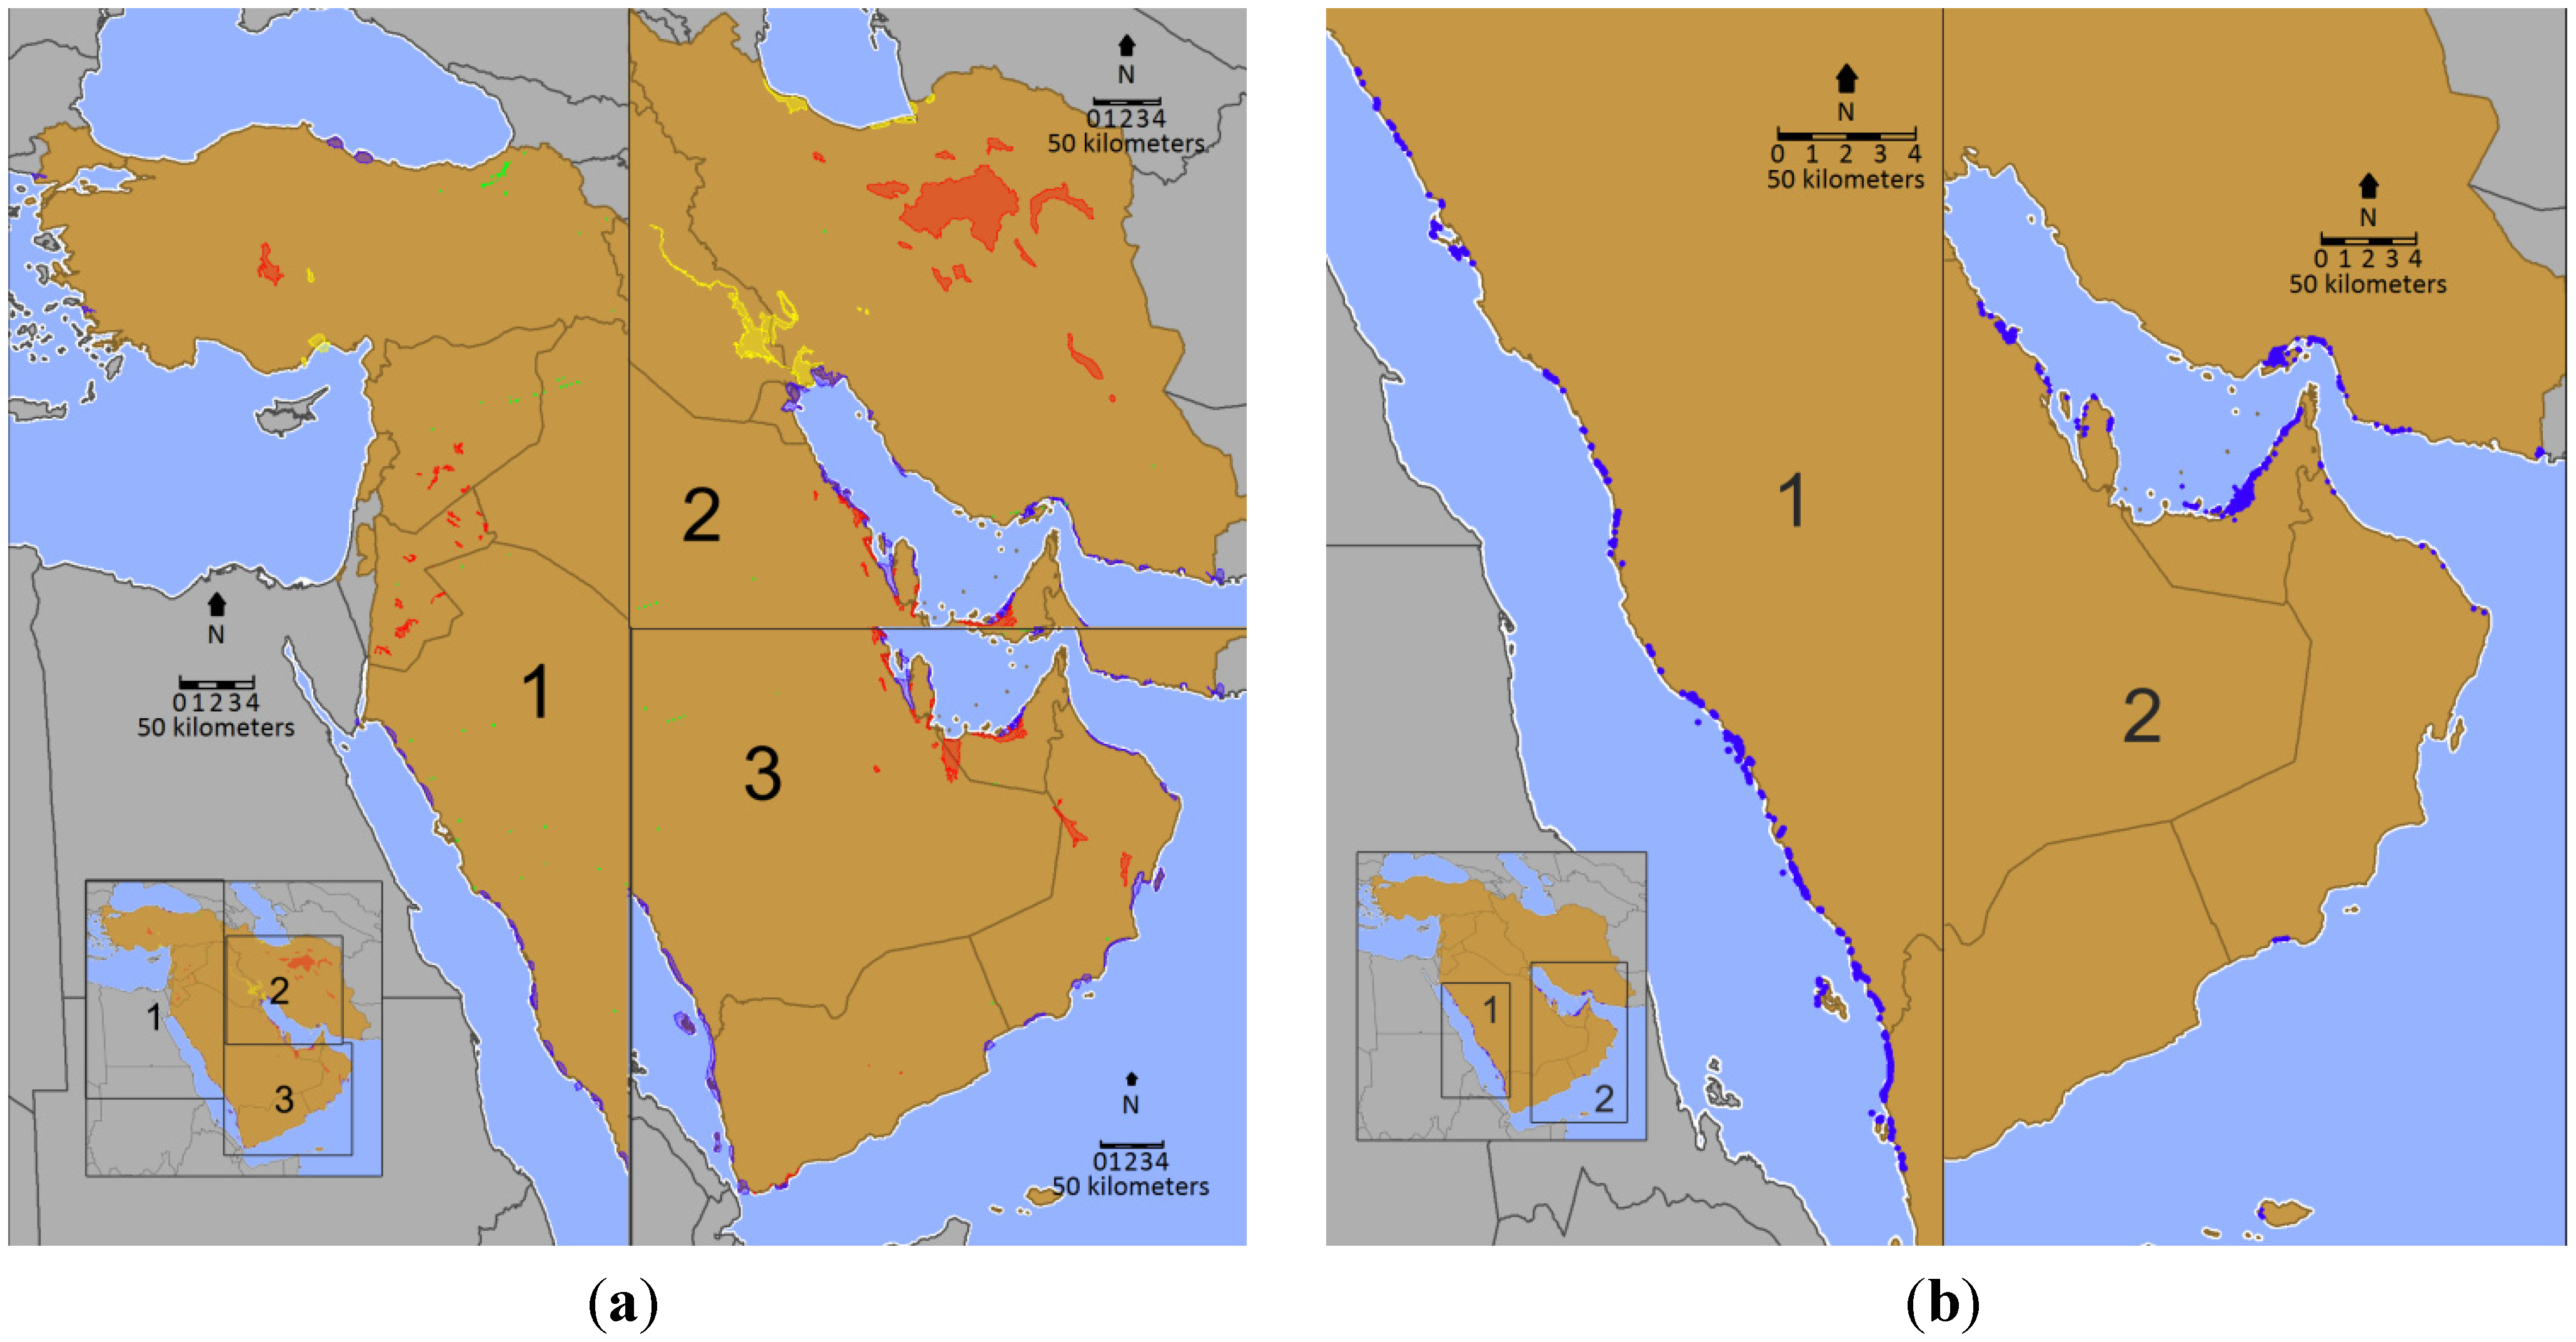
For mangroves we can perform a separate analysis because a detailed spatial dataset of mangroves has recently become available [
34]. Moreover we have a separate database of mangrove valuation studies that was used to develop a separate meta-analytic value transfer function. In order to avoid double-counting of mangrove and wetland areas in the two assessments, an overlay of the mangrove and wetland maps was made to remove mangrove areas from the wetland map. The two maps are shown in
Figure 3.
Figure 3.
Maps of wetland distributions in West Asia. Study nations are colored brown, non-study nations are grey and water bodies are light blue. (a) Wetland distribution in 2000. Different wetland classes are indicated by color: Yellow for freshwater marsh and floodplain; dark blue for coastal wetland including estuary, delta, and lagoon but excluding mangrove; red for pan, brackish/saline wetland; and green (visually exaggerated for illustration purposes) for bog, fen, and mire; (b) Mangrove distribution in 2010, indicated by dark blue. Mangrove areas have been visually exaggerated for illustration purposes.
The meta-analytic value functions furthermore require the development of socio-economic spatial variables for each West Asian site. For detailed descriptions of the selection of these variables, we refer to [
25,
33]. We use the FAO 1998 Roads of the World database for the infrastructural variables to approximate accessibility of wetlands. The Global Rural-Urban Mapping Project [
35] (adjusted version with matched UN country totals) indicates population density numbers to represent the local number of wetland beneficiaries for each site in the meta-analytic value function for freshwater and non-mangrove coastal wetlands. The MODIS 500 m Global Urban Extent map [
36] contains urban extent, which approximates the same variable but in the value function for mangroves. Each map was transformed appropriately for the various neighborhood analyses used to construct the socio-economic and environmental variables.
Employing the data and the meta-analytic value functions in a comparative scenario analysis enables us to estimate the value of regional wetlands. The baseline scenario of habitat loss derived from the IMAGE-GLOBIO model has previously been used to assess the cost of policy inaction to halt global biodiversity loss,
i.e., the failure to introduce additional environmental policies or to strictly implement existing policies [
37]. We use outputs for the scenario of wetland loss as well as predictions for the various socio-economic spatial variables in our scenario.
For each site, patch-specific parameter values for the spatial variables are substituted into the meta-analytic value function to estimate values per unit area (US dollar/ha/yr). The value of wetlands is approximated by calculating a price per hectare in 2050 for a situation with wetlands kept at the level of 2010 (mangroves) or 2000 (freshwater and non-mangrove coastal wetlands) as projected by IMAGE-GLOBIO. Values for socio-economic variables for the year 2050 are inserted in the meta-analytic value function but mangrove area variables (mangrove area and abundance) are used for the years 2010 and 2050. This yields two estimates of the marginal values of wetlands, one at a high level of conservation and one with a degree of wetland loss. For each wetland patch, the two values are averaged to achieve a better estimate of the change in value of each patch for the duration of the scenario (see, e.g., [
21,
25]).
Lower and upper bound values are then calculated using the 95% prediction intervals for each wetland site, which are computed using the method proposed by Osborne [
38]. The prediction intervals provide an indication of the precision with which the estimated value function can predict out-of-sample values,
i.e., value estimates that are not in the database with valuation literature. The prediction intervals do not, however, reflect a number of other sources of uncertainty in the analysis, including inaccuracies in the data used to construct the maps of West Asian wetland sites or the assumptions used to describe the baseline change in the extent and spatial distribution of mangroves.
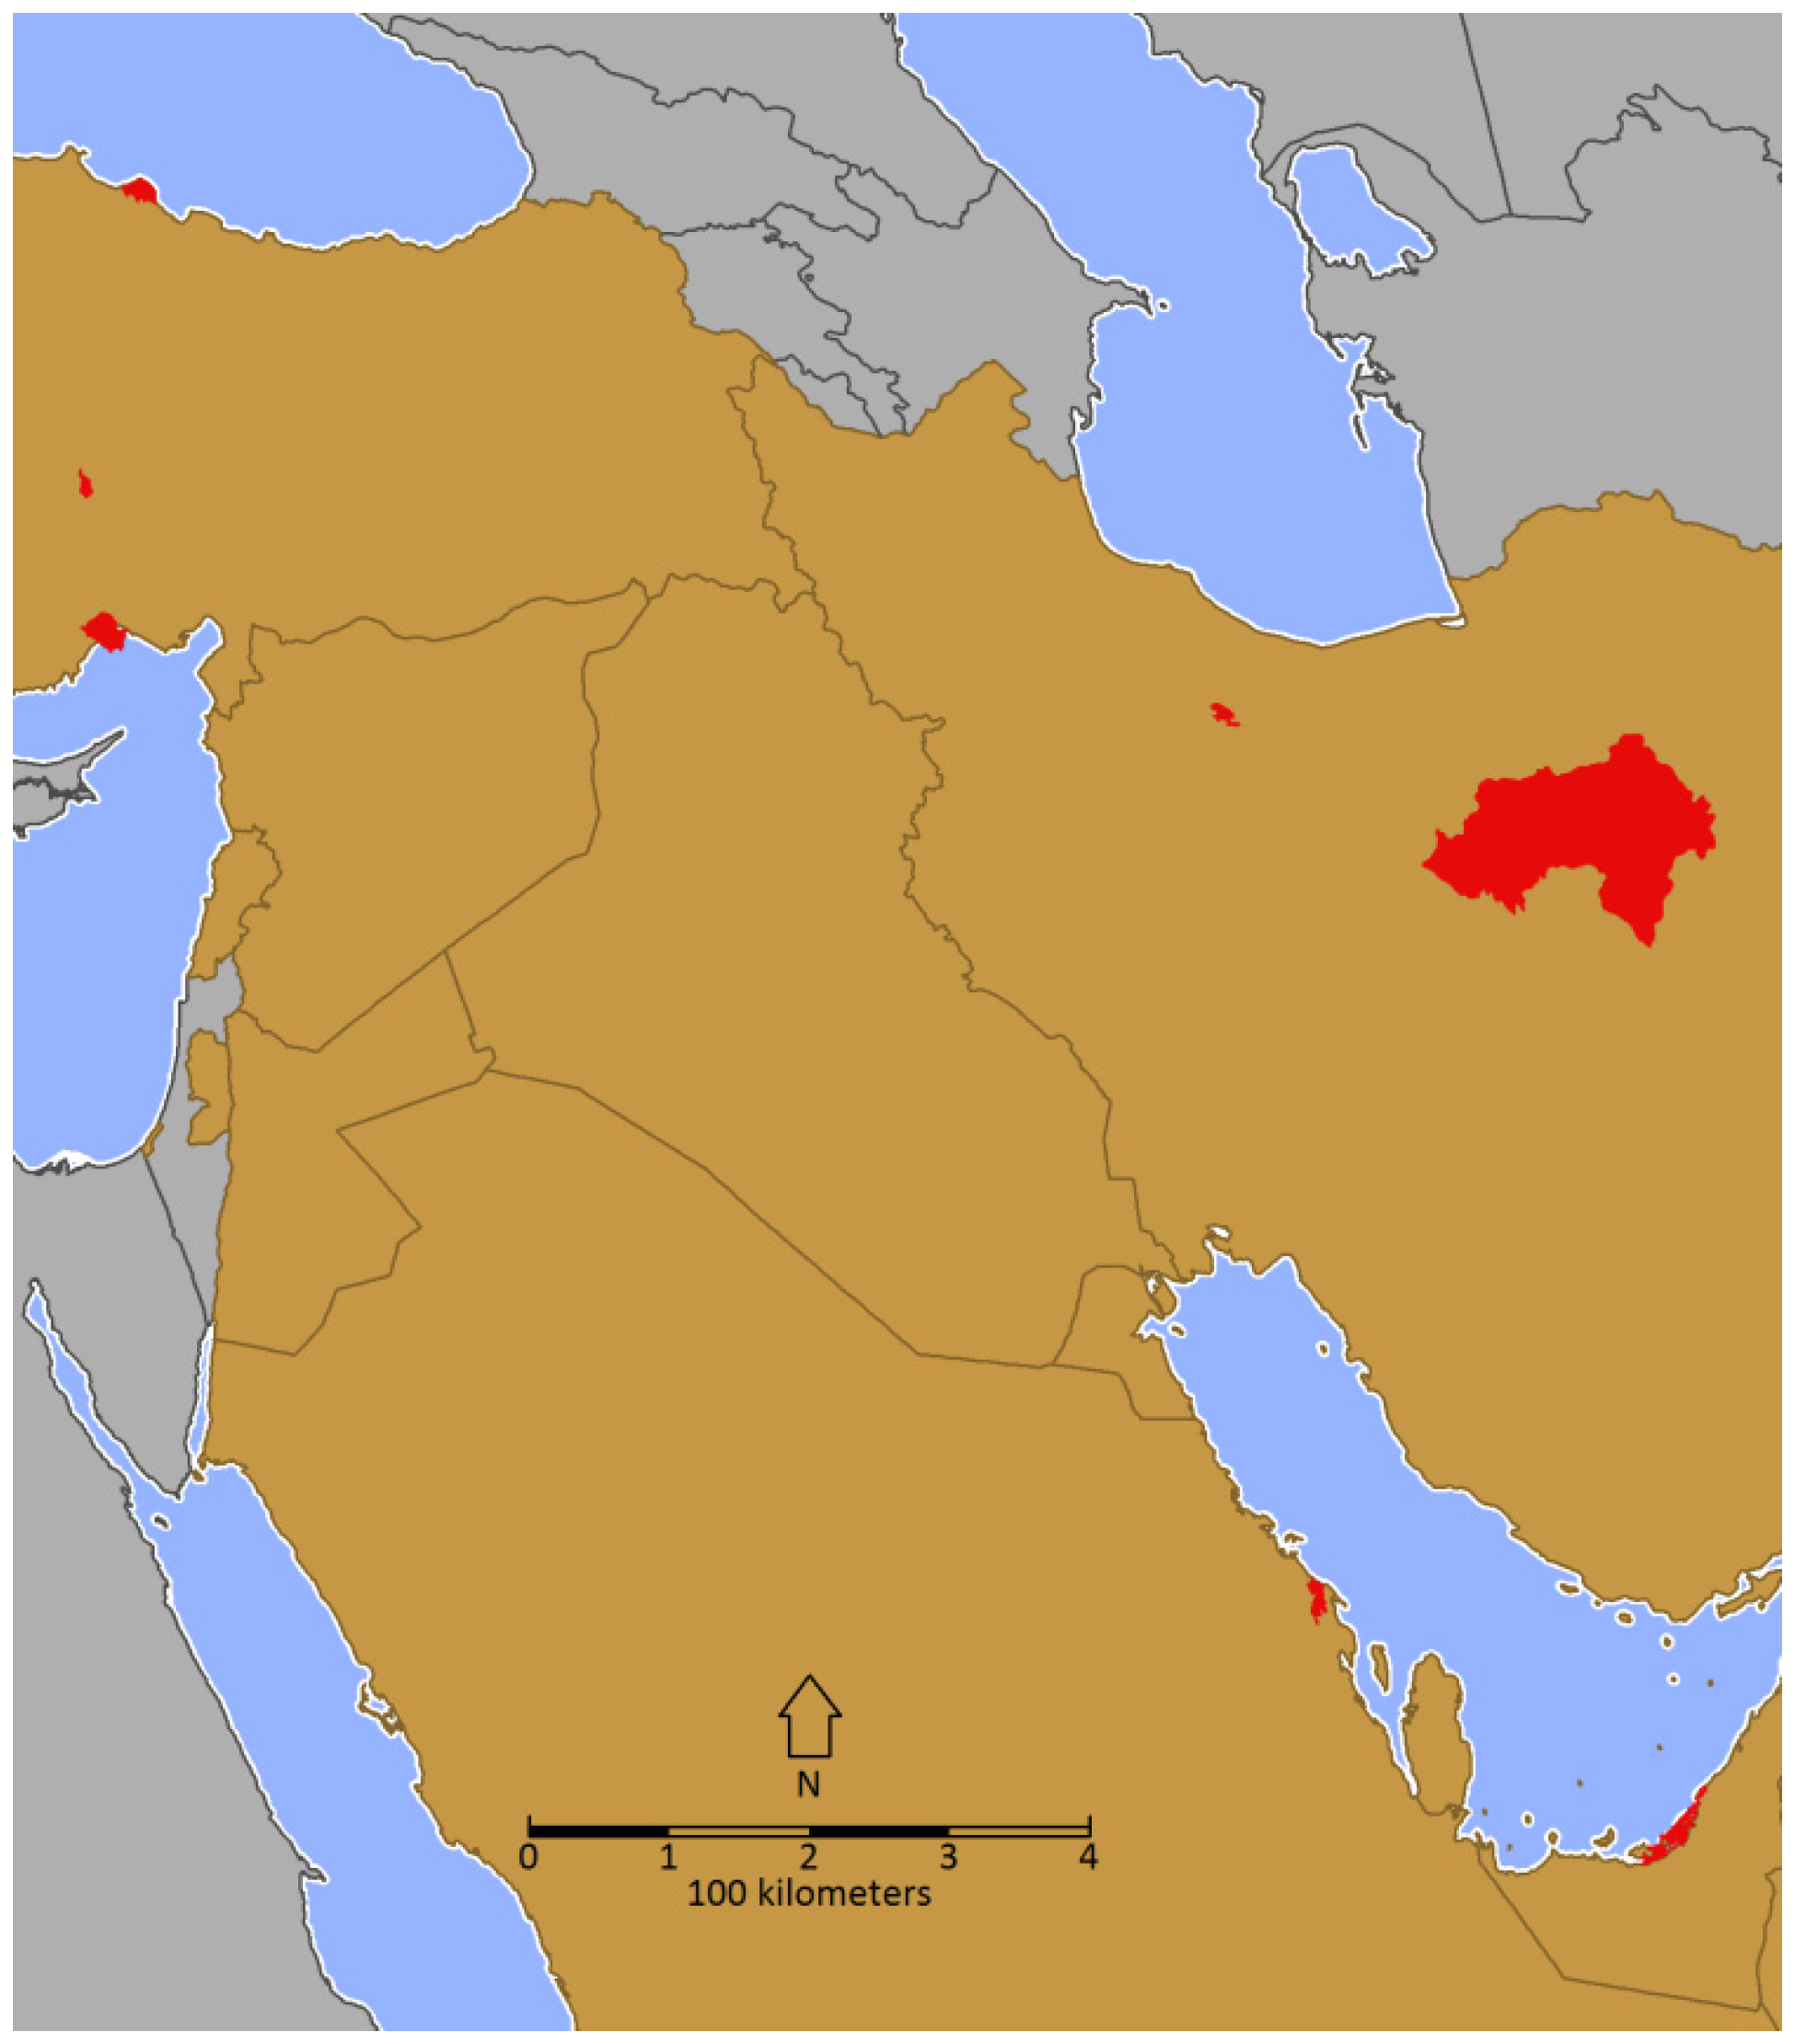
Regarding this final issue, a few remarks should be made. Reviewers have pointed out apparent errors in the map of wetlands that affect our results. For instance, the data set does not show any wetlands in Lebanon. Therefore the country does not appear in the results even though Lebanon does contain a number of smaller wetlands, including four sites designated as Wetlands of International Importance under the Ramsar Convention. Furthermore the data show no wetlands in the north and north-west of Iran where there should be, and the extent of the Iranian saltpans appears to be too large. A final point addresses the limitation of the automatic method used to allocate mangrove and wetland patches to national territories, which is that wrong allocations can be made depending of the exact position of wetlands sites relatively to the country borders. One example concerns the Mesopotamian marshes on the border of Iraq and Iran, which are mostly allocated to Iran. This means that the results for Iran are exaggerated, whereas the results for Iraq are underestimated. At the regional level which is the target scale of our analysis, of course, these national deviations cancel out.
5. Conclusions
In many West Asian countries the economic benefits generated by coastal and freshwater wetlands are not yet sufficiently reflected in development policies. As a first step to fill this information gap, this study has provided an initial estimate of the economic value of West Asian wetlands. The regional total of the present value of the foregone benefits of not conserving mangroves and other wetlands is between 2.3 billion US dollars (4% discount rate; see
Table 1 and
Table 2) and 7.2 billion US dollars (1% discount rate). This regional total does not reflect variations between or within nations, but it suggests that there is a significant potential welfare benefit from integrating wetland values in development decisions.
It should be emphasized that the results of a large-scale study such as this should be treated as indicative rather than absolute. There are several reasons for such caution. One is the availability and reliability of data and models at large spatial scales, which may not capture very well the national realities and variations in economic and infrastructural development. Consequently, where this analysis has predicted low national economic loss, this should not be taken to mean there is absolutely no risk of high losses. Furthermore, in some respects the loss of mangroves and wetlands is a regional concern. The loss of local wetlands may have effects on ecosystem services beyond national borders, such as nursery support for fisheries. It is therefore recommended to view the results presented here as a preliminary assessment to help regional decision makers recognize the value of coastal and freshwater wetlands.
Proceeding from here to integrating ecosystems, ecosystem services and biodiversity into various policy fields, a policy goal that is also referred to as “mainstreaming” biodiversity, requires more in-depth environmental-economic studies. Such integration is necessary, however, to identify costs and benefits, winners and losers from any policy change that affects humans and ecosystems. The value estimate presented here, for instance, does not distinguish explicitly between ecosystem services even though locally, individual services may well respond differently to an environmental change. Restricting public access to a wetland, for instance, may improve habitat services but will reduce the benefits derived from recreation. The existence of such trade-offs in ecosystem services mean that even seemingly innocuous policies, such as the efforts of regional government to make national economies less dependent on mineral resources by stimulating the tourism sector, may have an unforeseen effect on the net change in wetland ecosystem services. In its Fourth National Report to the CBD, for instance, the Kingdom of Morocco acknowledges both the economic importance and the great damage to natural resources done by the tourism sector [
39].
By considering the full suite of impacts on wetlands and their ecosystem services at all planning levels, governments are mainstreaming the value of wetlands and can reduce economic impacts by sharing economic losses, and improve compliance with existing or new policies. Both aspects are crucial to achieving sustainable and equitable policies for managing natural resources. TEEB [
40] describes the various steps that are needed for a full policy relevant assessment of the economic impacts of policies that affect ecosystems and Russi
et al. [
10] provide guidelines for assessments of wetlands specifically. This assessment framework stresses the importance of having a clear policy purpose within which a valuation of ecosystem change can take place.
A policy goal for an assessment should be defined through a dialogue between various stakeholder groups. Only if all parties acknowledge and share ownership of an environmental problem is a sustainable solution viable. This dialogue should be repeated throughout an assessment to ensure the project still lives up to expectations and needs. For many countries in West Asia, however, such interaction between decision makers and the general public is still a new and unfamiliar policy instrument [
11]. This situation may pose a challenge for studies about the economic impacts of ecosystem change in West Asia.
Moreover it can be a long process to find a sustainable solution to an environmental conflict. Even after a full assessment is concluded it is likely that monitoring and occasional revision of the implemented policy are needed. Preferences may change over time after which there may no longer be a strong enough incentive to uphold previous agreements. Alternatively, economic circumstances may change so that a resource that provided benefits that were previously considered economically irrelevant may become highly valuable. For instance, this study has presented estimates of the value of wetlands that are insignificant compared to income levels in some countries. Nevertheless there are states in West Asia that have recently experienced severe economic shocks that, in other regions of the world, would have severely limited national options to provide technological solutions to environmental problems. For some West Asian nations such restrictions are relevant only in the very long run, but for others they may be much closer.
An additional challenge is that there is little information about the value of West Asian ecosystems publicly available. It would be of immense value if more case studies were performed in the region and published. Given the range of ecosystems in the region case studies should strive to cover new ecosystems at risk from policy change. The breadth of knowledge provided in this way would potentially allow swift and cost-effective transfer of knowledge and policies across the region.
Furthermore such case studies could develop local capacity by involving local researchers. Given the current lack of experience with this type of assessment, it is likely that relevant expertise in the region is scarce. Hence there is a need to introduce both researchers and decision makers to this type of environmental-economic assessment.
The countries of West Asia are increasingly becoming aware of the environmental problems caused by fast-growing populations and increasing consumption levels. The continued and active participation of the governments of West Asia in international conservation frameworks, as illustrated by the submission of National Biodiversity Strategy and Action Plans or the designation of Ramsar wetland sites, indicates a willingness to conserve wetlands. By rationalizing decisions on conservation and development these efforts can be streamlined, but a lack of information and expertise remains a major hurdle to such improvements. To our opinion his study has provided a first step that shows there is a large potential benefit to conserving ecosystems, but further research is needed before ecosystems and biodiversity can be acknowledged in decision making.


