Abstract
In the context of sustainable urban development, the application of selected indicators integrated with scenario simulation and analysis can contribute to evidence-based decision making. This paper discusses the application of land use modelling and opportunity mapping approaches to evaluate regional development scenarios for the Greater Dublin Region in the period to 2026 evolving from research initially developed with the Dublin Regional Authority. This involved the simulation of four different future regional development scenarios using an adapted version of the MOLAND model with opportunity maps based on combined spatial indicators corresponding to these scenarios. The results produce valuable information for policy makers and planners assisting the evaluation of the consequences of their decisions in both a spatial and temporal context. This paper aims to show how current and future planning and economic policy can make targeted and evidence-based policy interventions and achieve resource efficiencies through the use of scenario analysis.
Keywords:
land use; model; MOLAND; scenario; indicators; multi-criteria analysis; Z-score; opportunity mapping; decision making 1. Introduction
Policy makers with responsibility for regional planning are facing a challenging task of managing systems that are complex. This can be due to global factors, such as population growth, migration, economic recession, climate change and actions at the national and local level of competing individuals and groups whose priorities may not produce outcomes consistent with sustainable development. Confronted with such complexity, decision makers need adequate tools and approaches to assist their understanding of the effects of policy interventions in urban regions [1,2]. The management of the environment and, in particular, land resources can be greatly assisted through the ability to analyse the likely future implications of policies, planning and development decisions. The use of spatial models and scenarios are a powerful means of exploring possible futures [3,4]. Spatial decision support systems (SDSS) are designed specifically to provide a spatial representation of the future. They are particularly helpful in the domains of land use and environment, which are also inherently spatial. In the past, decisions of an ad hoc nature have been allowed and justified by short-term economic and employment gains without realising their long-term implications. This is especially evident during short-term booms, when sudden development demands place major demands on development management decision making [5]. The recommendations of the Mahon Tribunal, which addressed malpractice and corruption in the Irish planning system [6], point to the need for greater transparency in the way elected members exercise their powers in planning decisions and a need for improved discharge of functions in local and regional planning. Other policy initiatives, such as the 2010 Planning and Development (Amendment) Act and the development of Myplan.ie (an online planning information system), have been described by the Irish Minister for Housing and Planning as demonstrations that the planning system is moving towards a more coordinated and evidence-based approach to planning in Ireland (statement from Minister Jan O’Sullivan, 4 April 2012) [7]. More recently, the Government publication titled “Putting People First—Action Plan for Effective Local Government” [8] proposed regional spatial and economic strategies with statistical data availability and reliability at a sufficiently granular level at the forefront of evidence-based policy formation.
Together with SDSS and geospatial models, scenario analyses are key instruments in producing information for stakeholders and policy makers to aid their understanding of urban development processes [9,10,11,12]. To evaluate scenarios, policy makers need some quantitative measures or indicators reflecting different aspects of human and environmental systems. Indicators are meant to support researchers, policy makers, stakeholders and the public in monitoring the status and changes in key sustainability dimensions and to foresee the potential consequences of action or inaction [13]. They are quantitative tools for the evaluation of the present situation in the region, as well as future scenarios simulated by different models.
Using one indicator or multiple indicators separately is unlikely to reflect real-world situations where decisions are made based on several competing factors and requirements. Hence, combined indicator indices are often applied. In this regard, deprivation indices, for example, have been used to measure the relative affluence or deprivation of an area using a combination of demographic profiles, social class composition and labour market statistics [14]. However, various studies [15,16] illustrate that a deprivation index or census statistics alone cannot capture the dynamics of living in high or low opportunity areas. Different “opportunity structures” define neighbourhoods, including accessibility to higher educational institutes, jobs and various services; proximity to transport network, parks, coastline, etc. All of these factors can be presented as spatial indicators, which may be altered significantly under different future land use development scenarios. Consequently, a combined indicator index based on opportunity measures calculated for each scenario can assist decision makers in deciding a preferred scenario and, accordingly, the decisions required for achieving that land use development strategy. Based on such information, stakeholders and policy makers can understand the driving forces and the current state of urban (and rural) development, as well as how their decisions can influence future trends.
The objective of this study was the application of combined indicator mapping for the evaluation of different scenarios simulated by the land use model, MOLAND. The paper is focused on applying this approach to assess the future development patterns in the Greater Dublin Region (GDR) under various scenarios as part of the Dublin Regional Authorities policy analysis [5]. It argues that scenario modelling combined with indicator mapping can make a significant contribution to informing decision makers as to the likely consequences of their decisions.
2. Methodology
The research methodology covers three main areas:
- Simulating regional development quantitative scenarios by using a cellular automata (CA) (a class of spatially-disaggregate models, often pictured as being formed on a 2-dimensional lattice of cells, where each cell represents a land use and where embodying processes of change in the cellular state are determined in the local neighbourhood of any and every cell [17])-based land use model, MOLAND;
- Elaborating indicators to identify and define the most suitable indicators for analysis;
- Creating indicator maps within a Geographical Information System (GIS) environment to support policy makers in assessing how those indicators change in the case of different future scenarios.
2.1. Study Area
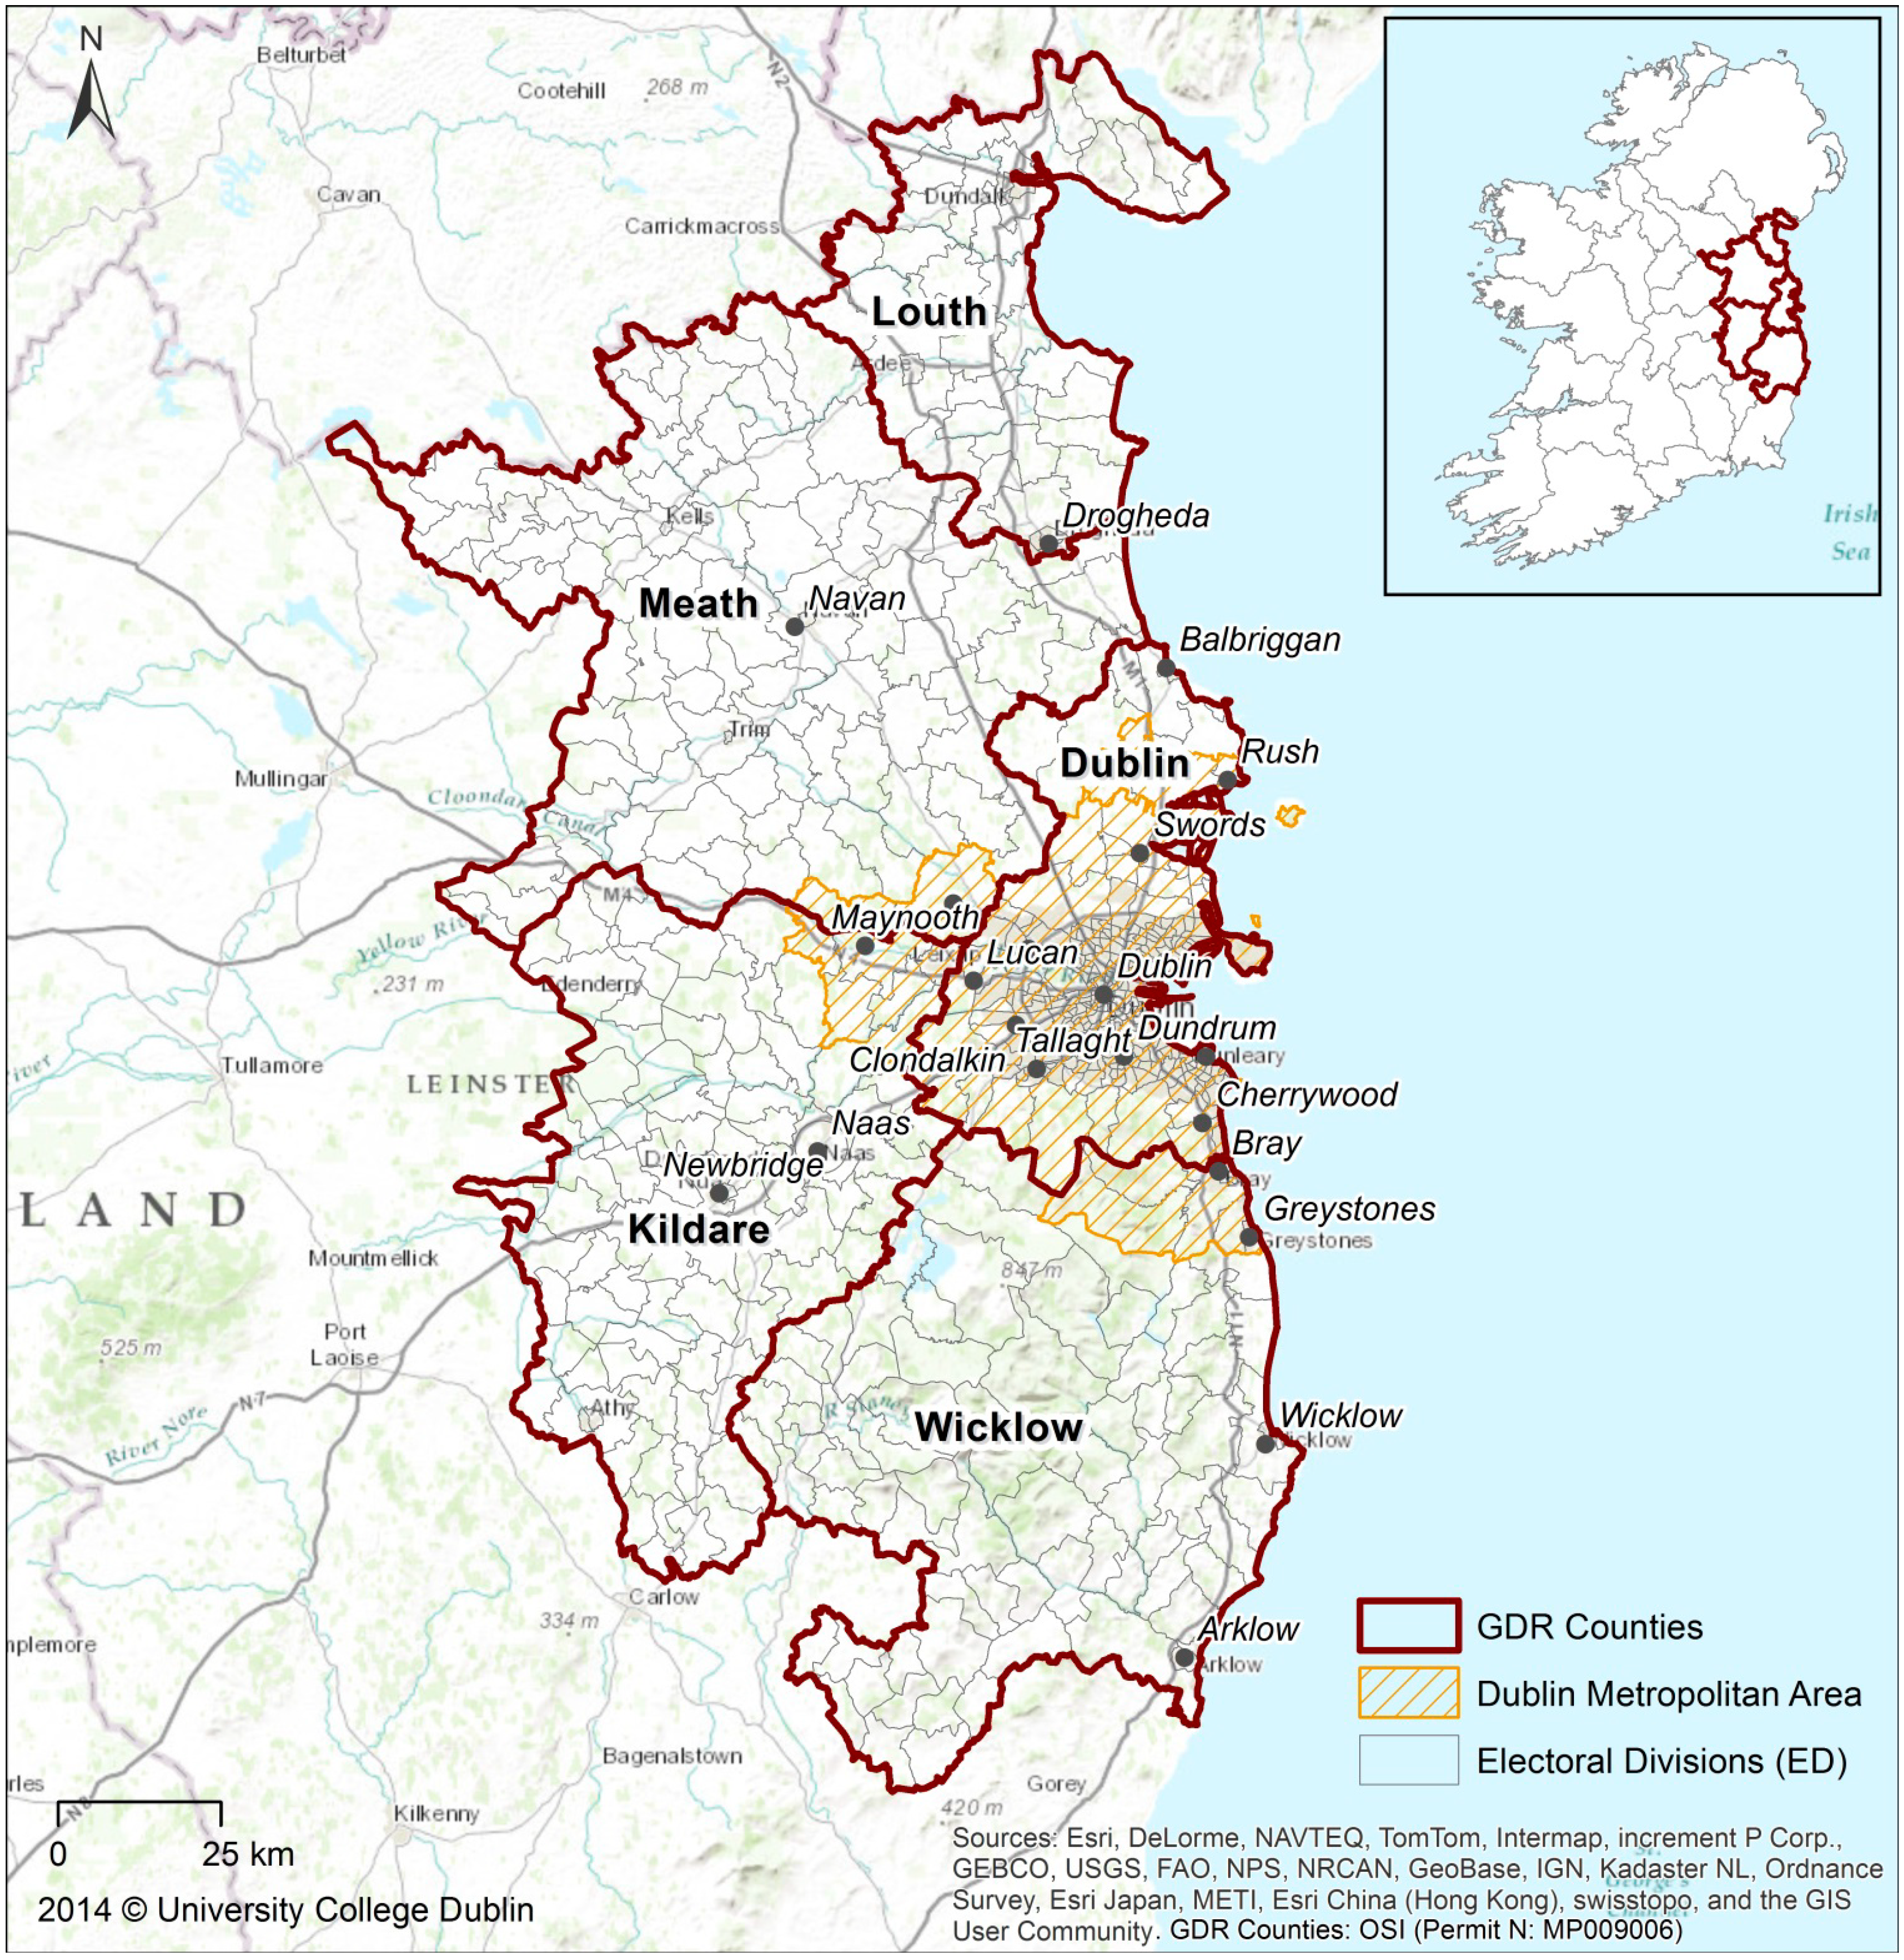
The Greater Dublin Region (GDR) is Ireland’s most densely populated region with a population of 1.9 million (42% of the state total) within 7800 km2 (Figure 1). The metropolitan area of the Greater Dublin Region is shaded in grey in the map below. This represents an area of continuous urban fabric extending from Dublin City outwards [18].
During the last few decades, Ireland experienced unprecedented social, economic and demographic changes. The GDR was the principal beneficiary of the growth period, often referred to as the “Celtic Tiger” [19], and faced the greatest transformations. However, the realities of recent development patterns differ substantially from stated policy in the National Spatial Strategy [20] and from international best practice in many cases. The dispersal of housing development was caused by a lack in provision of housing close to the city centre and the availability of cheaper development land in the hinterland of the GDR. The dispersal of housing, retail and employment activities in a fragmented manner across the GDR exacerbated existing environment, infrastructure and service provision challenges. In 2009, the economy and development markets experienced a major downturn as development activity effectively stalled. This downturn was evident in Ireland across all economic sectors and, in particular, the construction sector. Housing completion, for example, dropped from 93,400 units in 2006 to 26,400 in 2009 and to 8300 by 2013 (Central Statistics Office (CSO) StatBank Housing Statistics dataset HSA01: House Completions by Housing Sector and Year). In 2014, the Irish Housing Agency predicted that 16,000 new units per annum would be required in urban settlements for the four years until 2018 in order to satisfy future demand [21]. Dispersed and unsustainable development patterns have had considerable negative economic and environmental consequences. Development and environmental policies rooted in evidence-based planning are now required across the region for improved and sustainable patterns of development. Uncertainty surrounding future demographic and economic projections indicates that the spatial modelling implications of alternative projections would be an essential aid to all participants in the urban development, environmental management process and policy making [22].

Figure 1.
The Greater Dublin Region counties and Electoral Divisions (EDs) with the highlighted metropolitan area representing the continuous urban fabric of the city region.
Figure 1.
The Greater Dublin Region counties and Electoral Divisions (EDs) with the highlighted metropolitan area representing the continuous urban fabric of the city region.
2.2. Land Use Model MOLAND
The popularity of CA-based models is largely explained by their specific properties, including being tractable, dynamic, flexible and applicable to space represented as a raster [23]. CA treats space in an absolute manner, which is an advantage over other urban and regional models, such as gravity, econometric and location-allocation models, where the treatment of space is relative [24].
The application of CA in geographical modelling was originally proposed by Tobler [25]. Based on CA techniques, many urban models were developed for better understanding of urban evolution [26,27]. According to Yeh and Li [28], there are at least three types of urban CA: (1) simulating urban dynamics that are explained by urban theories (e.g. [29]); (2) simulating the direction and pattern of future urban development (if the current urban processes continue into the future) by using real data sets (e.g. [30,31,32]); and (3) simulating different urban forms based on planning objectives (e.g. [33]). The MOLAND model is an improved version of the CA developed by White et al. [30]. It was developed by the Research Institute for Knowledge Systems (RIKS) under the auspices of the European Commission Joint Research Centre and was specifically designed for regional development assessment [29,34]. MOLAND is remarkable in simulating 32 urban land uses. Additionally, the land uses and transport networks adopt the CORINE land cover classification, with a fourth more detailed level of nomenclature added for artificial surfaces [35]. Furthermore, the robustness of the model is proven by successful applications in more than twenty regions in Europe (e.g. [10,29,36]) and in a few regions outside of Europe, such as Lagos and Delhi megacities [9,34]. These international applications make MOLAND a highly comparable tool across a variety of urban and rural regional typologies of different sizes and locations. Taking these into consideration and following discussions with stakeholders on alternative modelling systems, the MOLAND model was chosen for this research and used in the review of the Regional Planning Guidelines for the Greater Dublin Area in 2010. The research required a model with an integrative capacity to develop alternative scenarios on growth paths with specific indicators relating to physical, infrastructure transport and energy for which MOLAND was deemed most suitable. It was adapted [37] and calibrated [38] for the GDR in the Urban Environment Project [11,12,22,37,38,39]. Then, it was tested and applied for the region as a valuable tool informing decision makers in Ireland [11,22,40,41,42]. A brief description of the model is given below, and it is explained in detail in previous publications [37,38,43].
The MOLAND model is built on the base of the GEONAMICA framework, which was developed by RIKS and has been the basis for many other integrated spatial decision support systems, such as WadBos, Environment Explorer, MedAction, XPLORAH and METRONAMICA [44]. GEONAMICA provides an environment to build new or integrate existing spatial models. The version of the MOLAND model used in this study is the model on which the METRONAMICA model was developed later by RIKS. So there are a lot of similarities between those models with some added functionality and indicator provision in the latest version. The key characteristics which distinguish the MOLAND/METRONAMICA model from conventional CA models are: (1) distance decay functions defining the relationship between neighbouring cells; (2) integration with GIS making it possible to initiate the model from within the actual geography; and (3) constrained cell transition making allocation based on total ranked score for each cell [45]. More specifically, the MOLAND model comprises two sub-models working at different scales: a spatial interaction-based model of activity location and migration (the macro model) and a CA-based land use model (the micro-model) with which the macro model is linked dynamically, so that the two components run as a single model. At the macro scale, the model takes as inputs the population and the economic activities (number of jobs by three major economic sectors—industry, commerce and services) in the region, and these are then split among the sub-regions of the modelled area (counties).
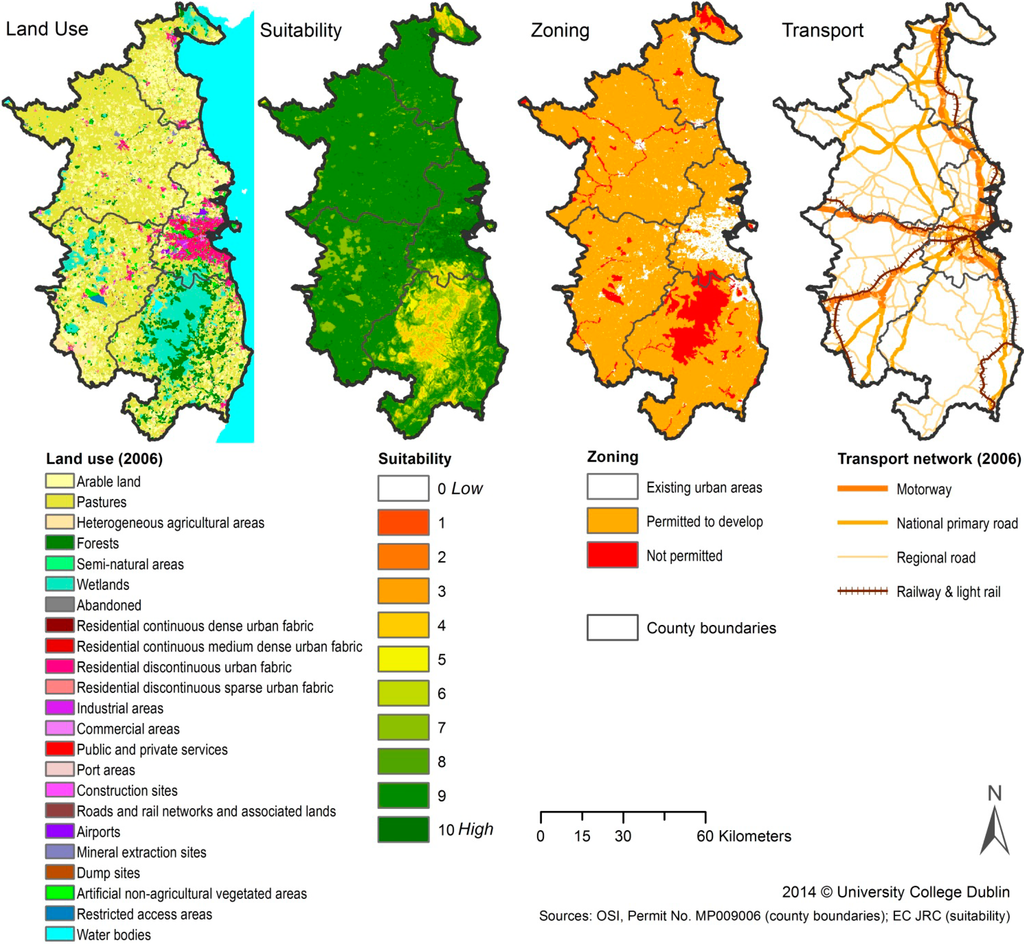
Figure 2.
GIS datasets were used in the MOLAND model Greater Dublin Region (GDR) application, which included: land use in 2006 based on CORINE classification, suitability of land for urban development, zoning representing policy restrictions for development and the transport network, including roads and rail.

At the same time, the macro-model captures the competition for population and economic activity among the sub-regions and generates a relocation of activity among them. At the micro scale, the sub-regional totals for population and economic activities generated by the macro-model are translated into demands for the corresponding land uses; for example, population will be accommodated within the residential land use categories, and economic activities will be provided for within commercial, industrial and service land use types. The micro model consists essentially of a constrained CA; this is the heart of the MOLAND model. The CA consists of: (1) a grid of cells representing the land use of the GDR (with a 200-m cell size and 23 land use classes); (2) a set of factors (i.e., suitability, zoning, accessibility/transport network and neighbouring land uses) influencing the direction of land use change (Figure 2); and (3) transition rules in a neighbourhood (with a radius of 8 cell diameters), which determine the push and pull forces between land uses as a function of the distance from the centre of that neighbourhood [43].
The model also includes a stochastic parameter, which ensures the generation of realistic land use patterns [11,38]. The result is a dynamic land use representation or map, on which the land use pattern changes year by year in a realistic manner, as validated by land use maps for past periods, as well as the present.
The MOLAND model allows for the development and generation of alternative future scenarios using different population and employment projections, zoning restrictions and transport network updates. Future scenarios can then be visualized, giving stakeholders and decision makers an idea of the possible implications of their decisions in terms of land use change; a picture of the future.
As the most up-to-date land use map presently available for the GDR is for 2006, that year is set as a starting point in the model for this study. 2026 is set as the final year, facilitating the use of and aligning with official population projections [46] for future scenarios.
2.3. Scenarios
Research using scenarios and software tools together with participatory activities have become popular instruments in a large number of studies [47,48,49,50,51,52,53]. Beside different future possibilities, which can be illustrated and compared by using our imagination, intuition and creativity [54], modelling support and stakeholders input are frequently used to mirror realistic issues and give an answer to what we could do if the scenario assumptions will occur.
Four scenarios of GDR development up to 2026 were used in this study and are briefly presented in Table 1. These scenarios were developed in a specially organised workshop by researchers at University College Dublin with key policy stakeholders from across the Dublin and Mid East Regional Authorities using five driving forces, namely: population, economic trends, urbanization, transport and overall trends [42]. The workshop participants expressed interest in several qualitative scenarios based on those drivers, official projections and their knowledge of the region. Four preferred scenarios were selected in this study, as they were considered the most relevant by the policy stakeholders (Table 1).
For the simulation in the starting year of 2006, the census population and employment data provided by the Irish Central Statistics Office (CSO) were used. For the population forecast to 2026, the “M2F1 Traditional” projection from CSO [46] was used for “Business as Usual”, “Compact Development” and “Managed Dispersed” scenarios, assuming international migration declining with constant fertility and a return to the traditional pattern of internal migration by 2016.
The CSO “M0F1 Traditional” projection was used for the “Recession” scenario and includes zero net migration and high fertility. Job numbers for the “Business as Usual” scenario were extrapolated using population and job figures from 2006 and the CSO population projection for 2026, assuming that the distribution of jobs in industry, commerce and services will remain the same as it is in 2006 and that the absolute numbers will increase in accordance to population growth by 2026.
The “Managed Dispersed” scenario suggests a 10% increase of the number of jobs by 2026 compared with the “Business as Usual” scenario. For the “Compact Development” scenario, 30% more jobs are projected compared with the “Managed Dispersed” scenario. The job numbers for the “Recession” scenario are based on projections from the Economic and Social Research Institute [55], where a relatively short recession followed by a strong recovery is assumed.

Table 1.
GDR development scenarios and specific variables used in the MOLAND model.
| Scenario | Suitability and Transport | Population 2026 | Jobs 2026 | ||
|---|---|---|---|---|---|
| Industry | Commerce | Service | |||
| Pre-recession trends or business as usual Further development of urban patterns as emerged before the economic crisis. | Default suitability (as in Figure 2); New light rail lines are introduced by 2020. | 2,553,149 | 380,573 | 559,519 | 362,129 |
| Compact Development Urban growth and regional development in the frame of a strong environmental protection policy with less pressure on natural land uses. | Specific suitability map promoting urban development in the metropolitan area and key towns with restricted zone along coastline. New light rail lines are introduced by 2020. | 2,553,149 | 544,219 | 800,112 | 517,844 |
| Managed Dispersed Growth and sprawl of rural town and villages in open countryside particularly along the Dublin-Belfast corridor. | Specific suitability map promoting urban development in metropolitan area, key towns, as well as along the Dublin-Belfast corridor. | 2,553,148 | 418,630 | 615,471 | 398,342 |
| Recession Slow urban development due to recession, including a potential recovery by 2016. | Default suitability (as in Figure 2). | 2,133,819 | 300,603 | 372,329 | 244,898 |
Since there were no definite plans on future zoning, only protected areas were zoned as non-developable, and the same zoning maps representing policy restrictions for urban development were used for all scenarios (Figure 2). To implement the effects described in each scenario, some modifications were made to the suitability maps for residential and industrial classes to reflect those parts of the region that are not only suitable for development based on their geo-physical characteristics, but are also seen as areas that will be prioritised for development over the period to 2026. The suitability of key towns was kept relatively high, while in the rural areas, it was decreased.
Thus, the main differences of the suitability maps are: the inclusion of highly suitable towns along the Dublin-Belfast transport corridor for the “Managed Dispersed” scenario; and a restricted zone (2-km buffer along the coastline) for future development for the “Compact Development” scenario. For the “Business as Usual” and “Recession” scenarios, the default suitability map presented in Figure 2 was used. This prioritisation was based on a discussion with key stakeholders from the Dublin and Mid East Regional Authorities on scenario descriptions. Transport network maps were also adjusted for some of the scenarios to represent their specific requirements (Table 1) [55,56]. More detailed descriptions of the scenarios, assumptions used and how they were developed are presented by Petrov et al. [12,42]. In this study, we build on the results of the MOLAND model simulations for these scenarios. Particularly, the MOLAND output land use maps of 2026 for these scenarios were further analysed using the Map Comparison Kit software developed by RIKS.
2.4. Informing Decision Makers
Key assumptions in policy scenarios containing statements about trends and actions [57] can be linked to parameters in the MOLAND model [10]. Based on the direction of policy/land change, the model can inform decision making in two different ways:
- (a)
- The model is trying to gauge the land use change caused by specific policies. In this case, the transport network, zoning and suitability maps are key elements of the MOLAND, allowing it to reproduce characteristics of a scenario [10]. Both zoning and suitability maps represent the capacity of a cell to support a particular land use. Transport network updates, such as new light rail lines, might shift the use of land in the future. The customization of these elements together with the fine tuning of other parameters (such as population and job projections) can permit decision makers to explore specific scenarios.
- (b)
- The model can also help policy makers by using a reverse direction argument. This argument assumes certain inputs are out of the control of policy makers (such as population and migration), but those population dynamics will cause land use change in the future. Thus, the model can inform policy makers about which locations will change the most in case of specific population and employment projections and, hence, locations that will demand policies to address higher population density, investment in infrastructure, etc. [22].
In the scenarios explored, the alterations in the suitability and transport network indicate policy directions that can be taken by planners or decision makers; whereas population and employment projections do not reflect policy options and are estimated based on projections from other institutions [55,56]. Different suitability levels and transport network orientations will result in different levels of attraction for population and employment across the study area and, hence, will generate different land use patterns. In this way, interregional migration and, as a result, population and job numbers in separate sub-regions (counties) are also influenced by scenario assumptions.
2.5. Indicators
The modelled land use maps can give some indication of spatial pattern distinctions between scenarios. However, considering the complex interconnections resulting in impacts with different environmental and social-economic impacts, a set of indicators can be used for quantifying data on factors, such as urban sprawl, green area loss, population change, access to transport, etc.
Two main criteria were used for the selection of indicators in this study: (1) the possibility to calculate the indicator value based on the MOLAND model output (land use raster map); and (2) having a preferred value (effect) in the context of general public interest. For example, the negative effect of the “Proximity to urban green areas” indicator (Table 2) in this case means that people prefer to live close to green areas. Therefore, a growing distance between their residence and green areas has a negative effect. In contrast, people usually do not find living very close to industrial areas an attractive proposition [58]. Thus, the “Distance to industrial areas” has a positive effect, meaning that the growing distance has a positive effect. On the other hand, the industrial areas are also employment locations, and being very far from jobs is also not preferred. Therefore, we have another indicator with a positive effect called “Quantity of potential employers”, which shows the total area of industrial, commerce and service areas within a 15-km radius from residential neighbourhoods. Though these last two indicators may seem intrinsically in contradiction, together they are reflecting an assumption that people prefer living far enough from industrial areas to have better environmental conditions, but also being close enough for a more reasonable daily commute. There are similar overlaps also between “Proximity to main roads” and “Proportion of residential areas adjacent to major transport routes”; or “Proximity to urban green areas” and “Quantity of nearby green areas”. However, proximity indicators here measure the mean minimum distance, while the proportion and quantity indicators measure the volume. Therefore, those indicators are effectively supplementing each other.
All indicators presented in Table 2 are based on land use and location and can be calculated based on the MOLAND output maps. These indicators were chosen on the basis of their reliability and reproducibility by a steering group consisting of researchers and experts from University College Dublin, National Transport Authority, Forfás (the national economic advisory board), the Economic Social and Research Institute (ESRI) of Ireland, the Dublin Regional Authority and the Dublin City Council. Evidently, preferred values for the indicators are not constant and can be varied depending on a person, an application or a scenario. Table 2 presents the preference directions defined by our steering group for this study.
The indicators were calculated for the GDR using Electoral Divisions (EDs) as geographic representations of neighbourhoods, which is a substantial improvement of the resolution compared with previous similar studies on the GDR [12,42,59] where counties were the geographic level used for indicator calculations (the 5 counties of GDR include 628 EDs with the areas ranging between 0.14 and 76.4 km2 and a mean of 12.4 km2, while the county areas range between 827.1 and 2341.7 km2 with a mean area of 1562.9 km2 see Figure 1). For each indicator, the MOLAND output land use map (which covers GDR and a 500-m buffer into counties outside of the GDR) was analysed at the ED level using various GIS methods in the ArcGIS 10.1 environment. Appendix 1 presents a detailed description of specific tools developed in the ArcGIS Model Builder and Python for the calculation of these indicators.
Considering that it is hardly possible that all indicators get a preferred value for a scenario and that no single indicator is enough to describe differences in the region at an aggregated level, it is essential to evaluate scenarios based on more sophisticated multi-criteria evaluation methods. This was achieved using an opportunity mapping approach, described below, which was adapted and applied for the selected set of indicators.
Table 2.
Indicators and their preferred directions, which were defined by the steering group for this study.
| N | Indicator (Variable Name) | Description | Effect (Direction Preference) |
|---|---|---|---|
| 1 | Proximity to urban green areas (Dist_Res2Grn) | Mean minimum distance from residential areas in an ED to semi-natural (beaches, sand plains, natural grassland, woodland shrub, etc.), forest and artificially vegetated areas (parks, sport facilities, etc.). | Negative |
| 2 | Distance to industrial areas (Dist_Res2Ind) | Mean minimum distance from residential areas in an ED to industrial areas. | Positive |
| 3 | Proximity to commercial areas (Dist_Res2Com) | Mean minimum distance from residential areas in an ED to commercial areas. | Negative |
| 4 | Proximity to services (Dist_Res2Ser) | Mean minimum distance from residential areas in an ED to service areas. | Negative |
| 5 | Proximity to main roads (Dist_Res2Rd) | Mean minimum distance from residential areas in an ED to main roads (motorway, national and regional roads). | Negative |
| 6 | Proximity to coast (Dist_Res2Coast) | Mean minimum distance from residential areas of a neighbourhood to coastline. | Negative |
| 7 | Proximity to railroad and light rail stations (Dist_Res2RailSt) | Mean minimum distance from residential areas in an ED to railroad and light rail stations. | Negative |
| 8 | Proportion of residential areas adjacent to major transport routes (Res_inRd200mbuf) | Proportion of residential areas (from overall residential) in an ED within 200-m distance from major roads, railway and light rail. | Negative |
| 9 | Quantity of potential employers (IndComSer_frmRes15km) | Total area of industrial, commerce and service areas within 15-km radius from residential neighbourhoods. | Positive |
| 10 | Quantity of nearby tertiary education institutes (TertiaryMean_frmRes13km) | Mean number of tertiary institutes within 13 km from residential neighbourhoods (the average distance travelled by students aged 19+ years is 13 km (Central Statistics Office (CSO), 2007)). | Positive |
| 11 | Quantity of nearby green areas (SmnatForestArtveg_frmRes5km) | Total green (semi-natural, forest and artificially vegetated areas) areas within 5-km radius from residential areas in an ED. | Positive |
| 12 | Ratio of green areas to built areas (Ratio_SmnalForestArtveg2Urban) | The ratio of green (semi-natural, forest and artificially vegetated areas) areas to built areas (residential, industrial, commercial, service). | Positive |
2.6. Opportunity Mapping
Opportunity mapping is an approach to conceptualise and visualize the varying levels of access to the opportunities that exist throughout different neighbourhoods and regions. Having high access to opportunity means having access to positive conditions, such as a safe place to live, proximity to educational services, employment options, access to transport networks and health services. Often, opportunity has an uneven spatial distribution, leading to differing access to opportunity structures. Therefore, understanding the opportunity landscape is vital in order to improve the quality of life and outcomes of the residents [16].
Mapping opportunity in the region requires the selection of indicators that are indicative of high (or low) opportunity (for instance, preferred value of our indicators discussed above). Examples of high opportunity indicators include a high-number of jobs, the availability of various options for high-level education and a green environment. Low opportunity indicators include high crime rates, being too close to heavy industry or major roads, etc. A central requirement of indicator selection is the clear connection between the indicator and opportunity. The effects can be considered positive or negative depending on the research question and undertaken assumptions. For example, a high number of potential employers not far from the place of residence can be considered as a positive factor for finding a relevant job, meaning that the more employers there are, the higher the opportunity is; whereas the same factor in some way can be represented by the commute distance to work, which will be considered as a negative factor, assuming that the longer the distance, the lower the opportunity. Similarly, higher general unemployment rates can be a negative factor within an area, but a higher unemployment rate of people with high education or skills can be a positive regional economic factor, because it enriches the choice of skilled workers for employers and may be a prerequisite for a new business development.
The defined set of indicators are then assessed at the same geographic scale (e.g., ED), by standardizing through the use of Z-scores (these are statistical measures quantifying the distance data points are from the mean of a data set) as shown in Formula 1 below.
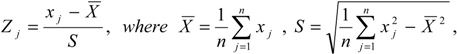
Z-scores are helpful in the interpretation of raw score performance, since they take into account both the mean of the distribution and the amount of variability (or the standard deviation). The Z-score indicates how far the raw score is from the mean, either above or below it, in standard deviation units. If distribution is not skewed (e.g., normal or uniform) a positive Z-score is always above the mean (upper 50%); a negative Z-score is always below the mean (lower 50%), and a Z-score of zero is always exactly on the mean. Thus, when trying to understand the overall comparative performance of different groups with respect to a certain variable, we can assess how a certain group (of individuals, EDs, etc.) is performing with respect to the mean performance for the specific variable. The use of Z-scores allows data for an ED to be measured based on their relative distance from the data average for the entire study region. Z-scores are used to put all of the indicators on the same measurement scale, removing the specific unit of measurement of each indicator. The final “opportunity index” for each ED is based on the average Z-scores for all included indicators. The corresponding level of opportunity (very low, low, moderate, high, very high) is determined by sorting all EDs into quintiles based on their opportunity index scores. Thus, the EDs identified as “very high” opportunity represent the top 20% of scores among all EDs in the study region. Conversely, EDs identified as “very low” opportunity represent the lowest scoring 20% of all EDs.
The overall combined Z-scores calculated as a mean of the indicators’ Z-scores taking into account the effect they have. Thus, for this study, taking into account the preferred values of 12 indicators described in Table 2, the combined Z-score will be calculated as follows:

3. Results and Discussion
The comparison of the urban areas existing in 2006 and then developed by 2026 for alternative scenarios is a good way to understand the overall regional development patterns and possibilities. Figure 3 shows the comparison results of actual 2006 land use map with the land use maps for 2026 generated by the MOLAND model.
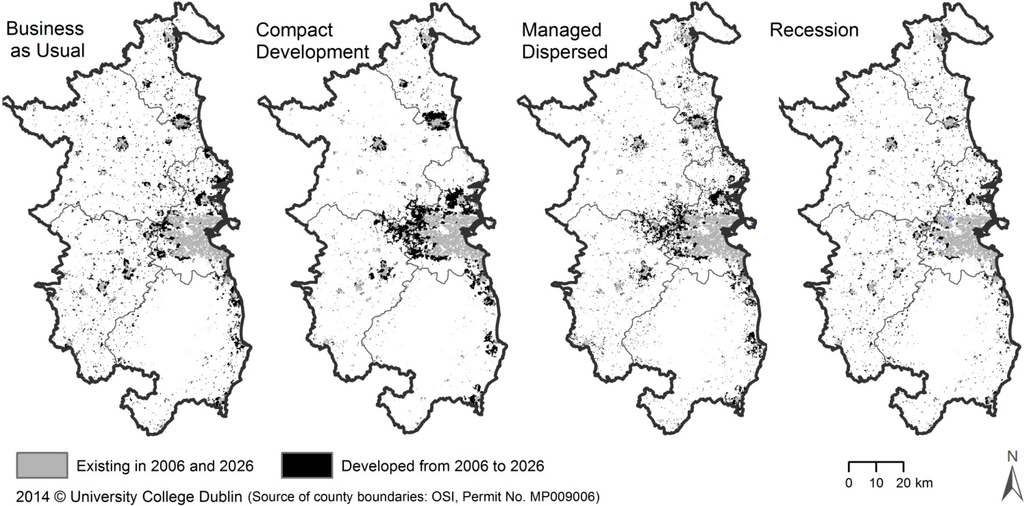
Figure 3.
Comparison of GDR urban development in 2006 and 2026 scenarios.
Figure 3.
Comparison of GDR urban development in 2006 and 2026 scenarios.

Spatial differences in urban development patterns are visible. Particularly, the dispersed settlement pattern and merger of formerly separate urban areas is observed in the “Business as Usual” scenario. In the case of “Compact Development” scenario, the urban development is focused into the Dublin Metropolitan footprint and a small number of large growth centres along major transport routes (these growth centres include the towns of Drogheda, Navan, Naas, Wicklow and Arklow). While the development is across the region in the case of the “Managed Dispersed” development scenario, it is consolidated into several growth centres of Arklow, Balbriggan, Drogheda, Navan, Naas, Newbridge and Wicklow. This contrasts with the “Business as Usual” scenario, where development is widely dispersed in small pockets across the region. Finally, the “Recession” scenario shows dispersed development similar to the “Business as Usual” scenario with essentially less overall urban growth. Those patterns result from the assumptions made for each scenario and converted into the model through population and employment projections, transport network updates and suitability alterations. As a result, they reflect the likely outcomes of socio-economic changes and planning decisions covered by those scenarios.
From Figure 3, a policy maker can broadly deduce that the “Business as Usual” scenario will result in sprawling development across the GDR, hence placing increasing pressures on service and infrastructure provision regionally. In contrast, the “Compact Development” scenario results in a very definite concentration within and expansion of the core metropolitan area of the GDR and other large growth centres. This development scenario, while following the compact city model [60], can also lead to diseconomies of scale and pressures on urban environments, such as transport congestion [61,62]. The “Managed Dispersed” scenario spreads development more evenly across the region, following the spatially-oriented policy options proposed in the National Spatial Strategy [63], including the development of a polycentric, competitive, attractive and balanced urban system. As a result, urban development for the “Managed Dispersed” scenario is less dispersed than for the “Business as Usual” scenario, where there are no particular policies directing development (see Table 1).
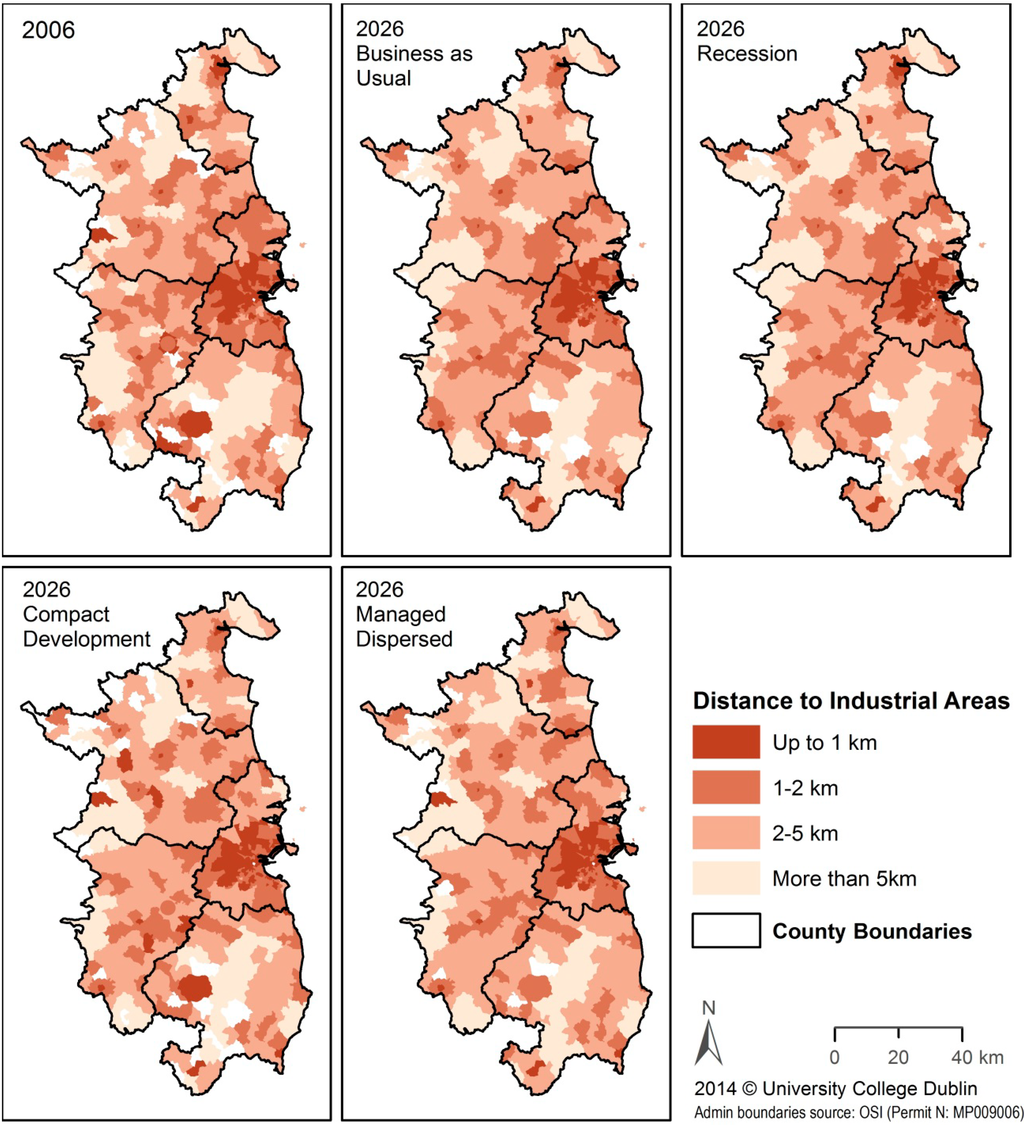
Figure 4.
Proximity of residential areas to industrial areas in the GDR.
Figure 4.
Proximity of residential areas to industrial areas in the GDR.
Although the map comparison gives a useful visual indication of possible future development patterns in the region, the indicators can enhance decision making by providing localised quantitative evidence for scenario comparison. Thus, the following figures present some of the indicators described in Table 2 on the ED level for 2006 and for 2026 in the case of four scenarios.
Figure 4 maps proximity to industrial areas (mean minimum distance from residential areas in an ED to industrial areas) over the four land use scenarios, comparing them to 2006. The relative growth of the core metropolitan area of the GDR appears to lead to a reduction in proximity hotspots across the GDR in both the “Compact Development” and “Managed Dispersed” scenarios, when compared with 2006. However, both exhibit more balanced regional development than the “Business as Usual” and “Recession” scenarios. Presumably, this is as a result of an increased proportion of future population being directed into the metropolitan area.
The mapping output highlights the importance of managing and balancing regional development in order to ensure the necessary provision of infrastructure and services to allow orderly development of (1) industry and employment opportunity and (2) the population and skills base, as determined by the quantum and distribution of population (in key growth centres, nodes and corridors).
The context for these scenarios is the Regional Planning Guidelines (RPG) for the Greater Dublin Area (GDA) 2010–2022 [18], which supports the delivery of more population within the existing footprint of the metropolitan area and expansion of this footprint in conjunction with new high quality public transport investment, the designation of multi-modal transport corridors providing enhanced public transport linkages serving key towns and linked investment in developing designated growth centres in the hinterland area. Regional land use policy as recommended by the RPGs encourages mixed use settlement forms and sustainable centres, in which employment and residency are located in close proximity to each other. Furthermore, RPGs support the strategic multi-modal transport corridors, which promote a choice of sustainable travel modes, green travel choices and reduce long distance commuter trends and congestion [18].
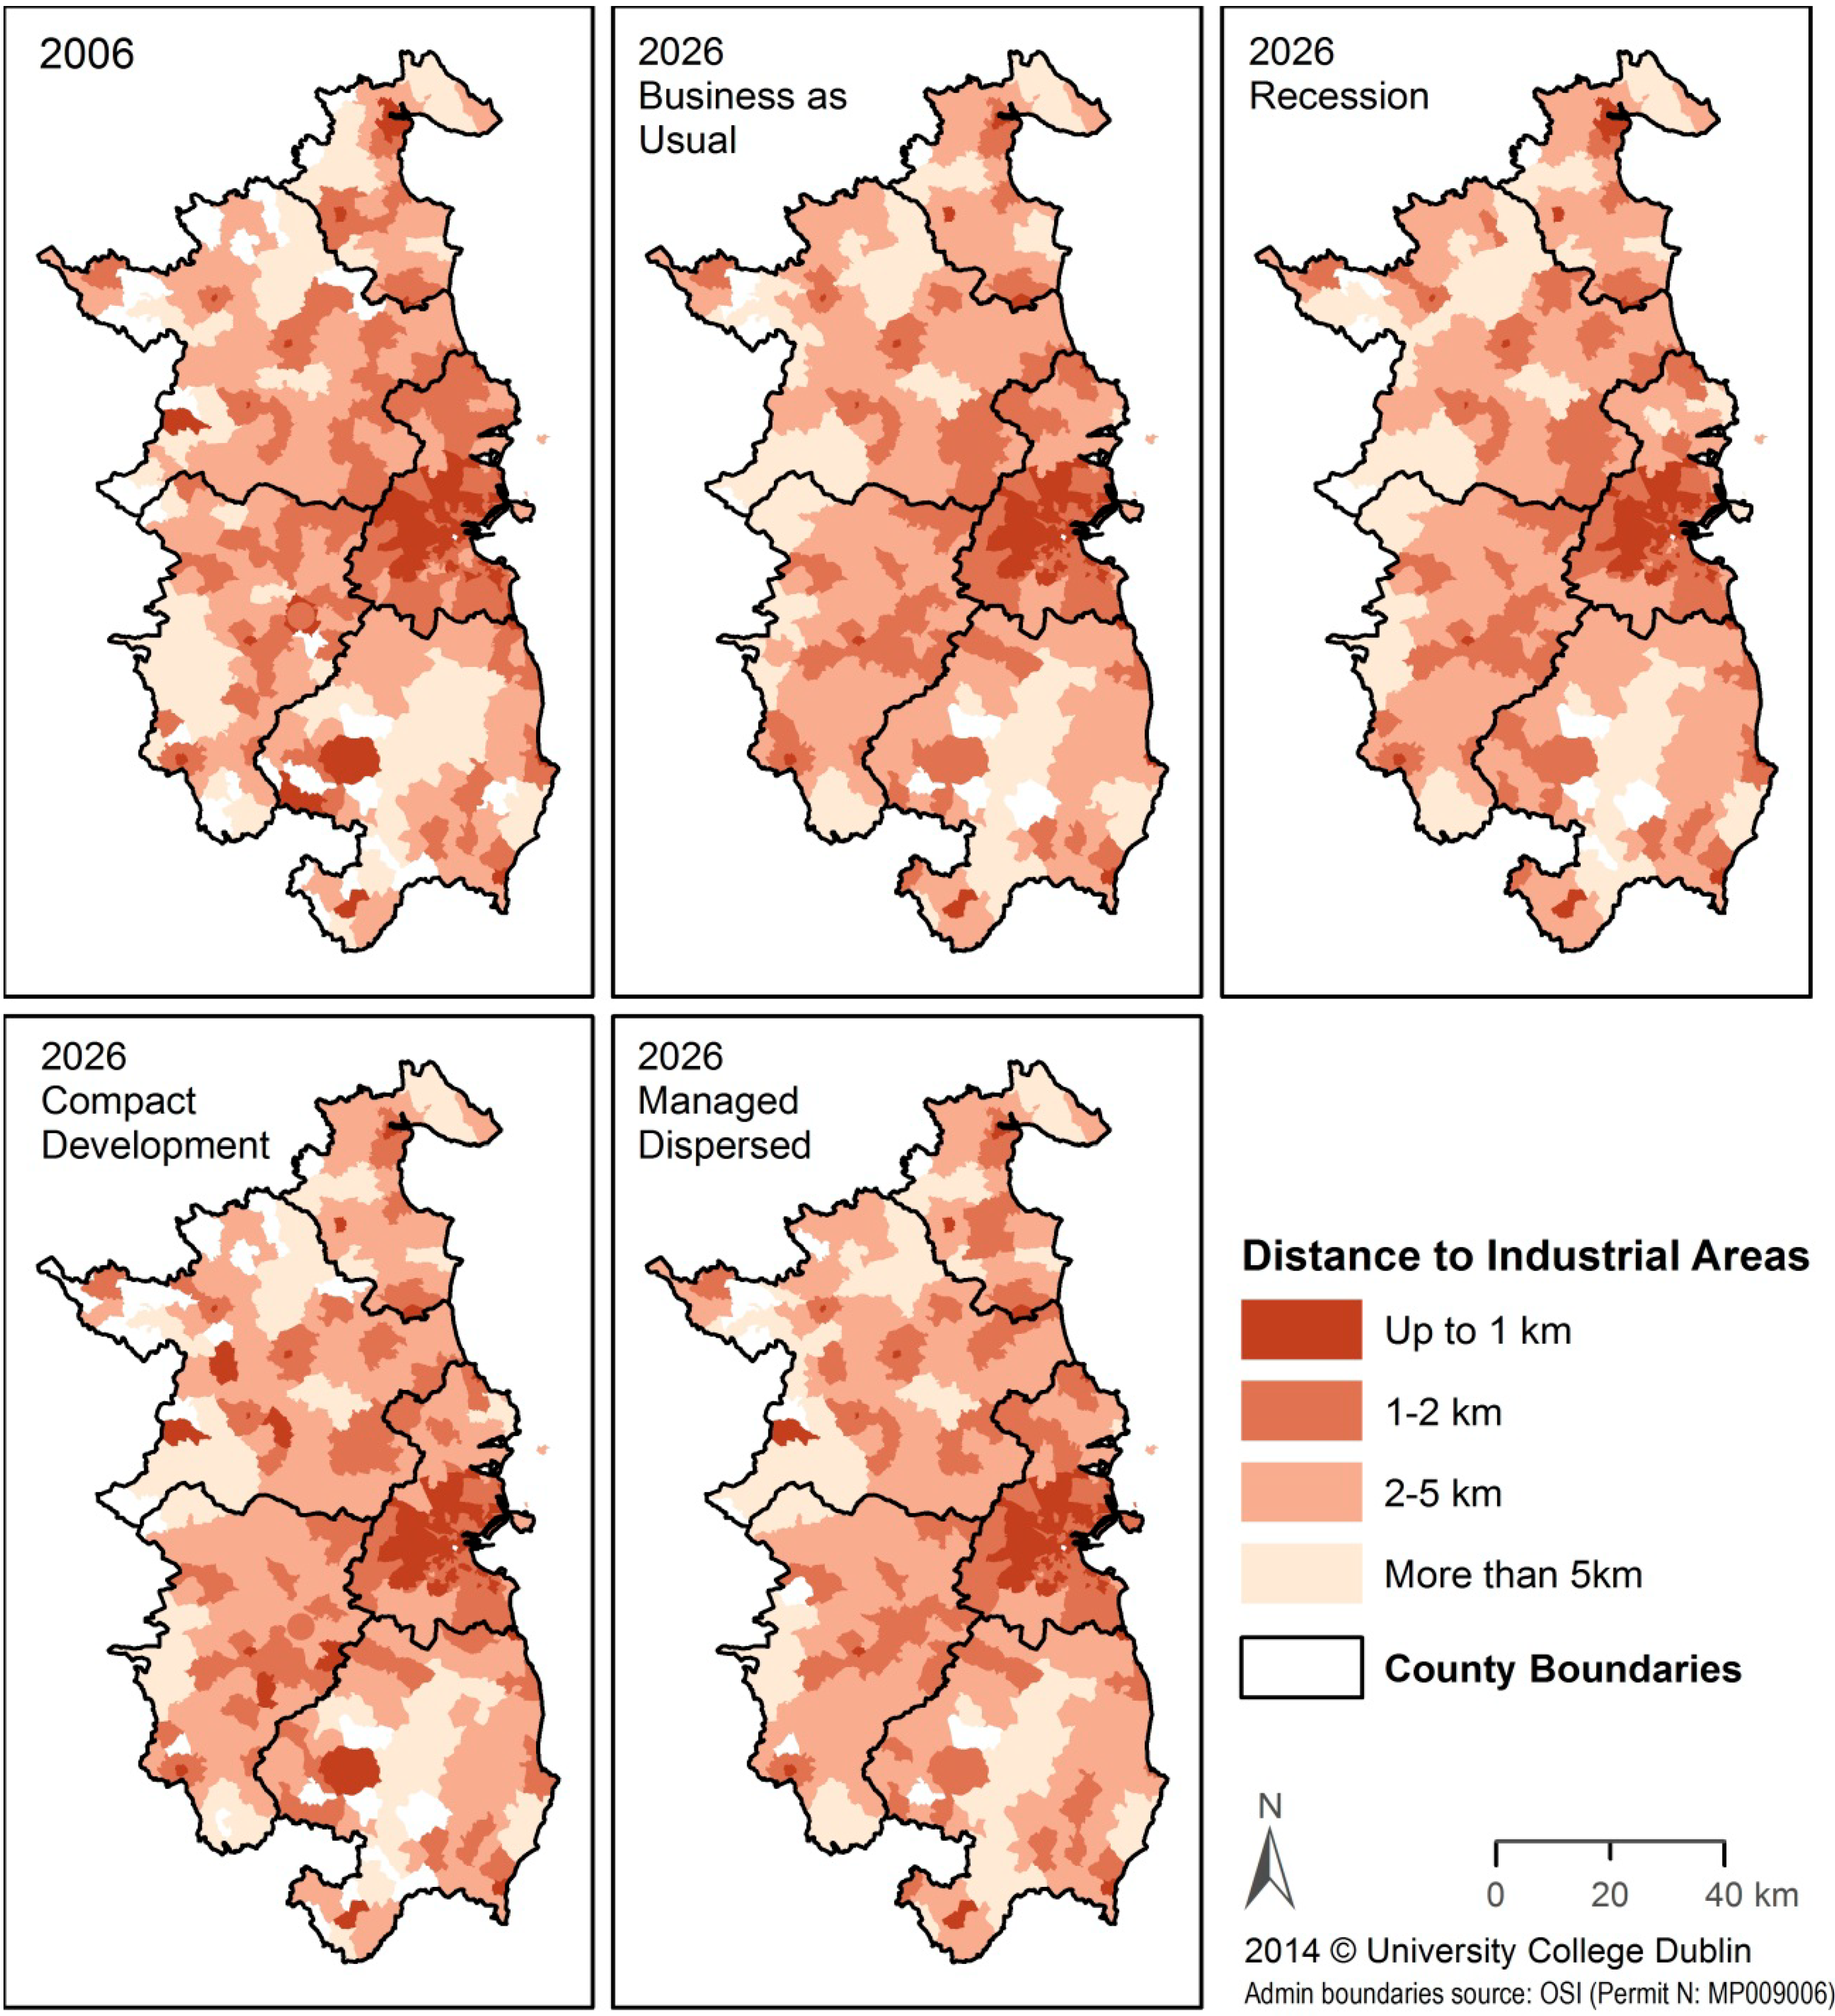
Figure 5 shows the variations in proximity to the roads (mean minimum distance from residential areas in an ED to main roads) according to the different land use scenarios. In each case, proximity remains high within the metropolitan core area due to the dense networks and transport modes available there. This makes differences more difficult to discern. They result from different settlement patterns emerging within the EDs under different scenarios. The results demonstrate, from a practical and local planning perspective, that the maps could have further policy applicability if refined for local area analysis. For example, this could be carried out to assess how strategic policy decisions could affect the quantum and distribution of residential areas in relation not only to transport access, but in relation to key access points to main roads.
Access to urban green areas presented in Figure 6 (mean minimum distance from residential areas in an ED to green areas, including parks, sport and leisure facilities, beaches, semi-natural areas and forest) raises fundamental questions and debates around the perception of life quality. This especially relates to: (i) demand for unsustainable one-off rural (single dwellings in or at rural locations, which result in greater demands on infrastructure and services) and edge of settlement housing; (ii) encroachment on sensitive environmental areas. For example, access to green areas under a balanced “Managed Dispersed” scenario shows a more distributed level of coverage across the GDR in terms of access to green areas than “Compact Development.” While this arguably satisfies demand for life quality needs, such as access to green areas, this demand must be tempered by other socio-economic requirements and development control. The “Compact Development” scenario shows high levels of access cantered around key urban centres in the hinterland area of the GDR.
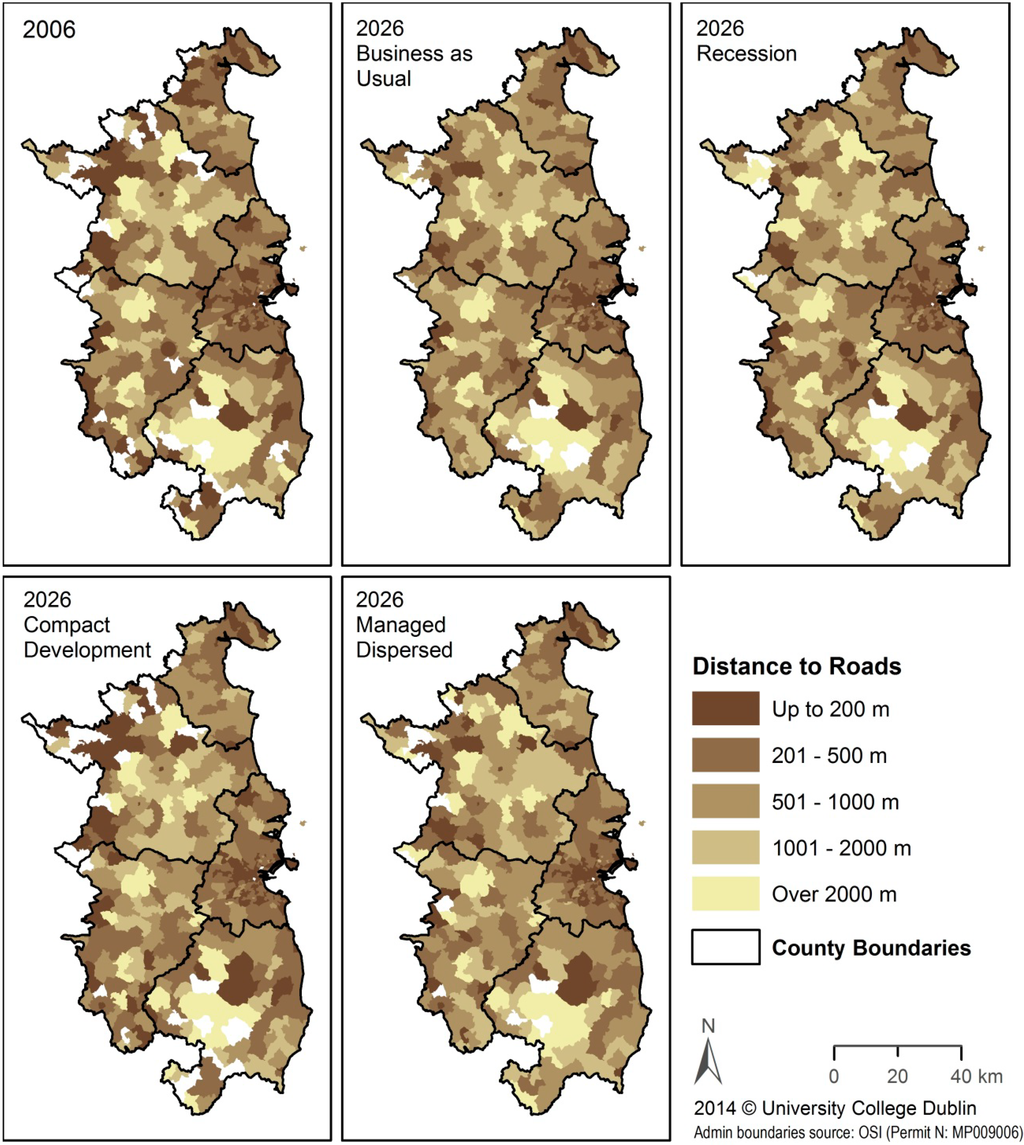
Figure 5.
Proximity of residential areas to main roads in the GDR under the various proposed scenarios.
Figure 5.
Proximity of residential areas to main roads in the GDR under the various proposed scenarios.

A caveat therefore is that the opportunity maps do not necessarily show the density of residential development within a given ED. We can presume, for example, that under the “Compact Development” scenario, more persons may have access to urban green areas located within the core metropolitan area of Dublin. However, the effects, negative or otherwise (such as increased pressure from use of the green area or encroachment of development into green areas), of compact development on the quality of green areas are not as easily quantified. These maps should, therefore, be applied firstly at a broad strategic level and secondly checked against the geo-spatial overlay of specific local environmental features.
Consideration of the proximity of future population distributions to these urban green areas and the associated demands on these assets is beneficial to planning in the area of green infrastructure. Green infrastructure planning is a core feature of both the RPGs for the GDA [18] and, by extension, the county development plans of the constituent local authorities of the GDA. Proximity to green areas can be also considered with respect to the green infrastructure planning for the region. The RPGs for the GDA [18] state that the function of green infrastructure planning should include strategic guidance on green areas to consider, enhance, manage and integrate as part of broader ongoing changes taking place regarding settlement and population, land use planning, transport planning and economic activity.
Figure 6.
Proximity of residential areas to urban green areas in the GDR under the various proposed scenarios.
Figure 6.
Proximity of residential areas to urban green areas in the GDR under the various proposed scenarios.

In general, the use of such evidence-based scenarios and indicators significantly improves the capacity of decision makers to consider and evaluate alternative development options. In addition, as the region moves through the implementation phases of development, the evidence from such research will be of considerable benefit in the necessary prioritisation of development options that promote sustainable growth. Prioritisation can realise a development pattern to reduce negative environmental impacts and also provides increased opportunity for new and existing residents and business.
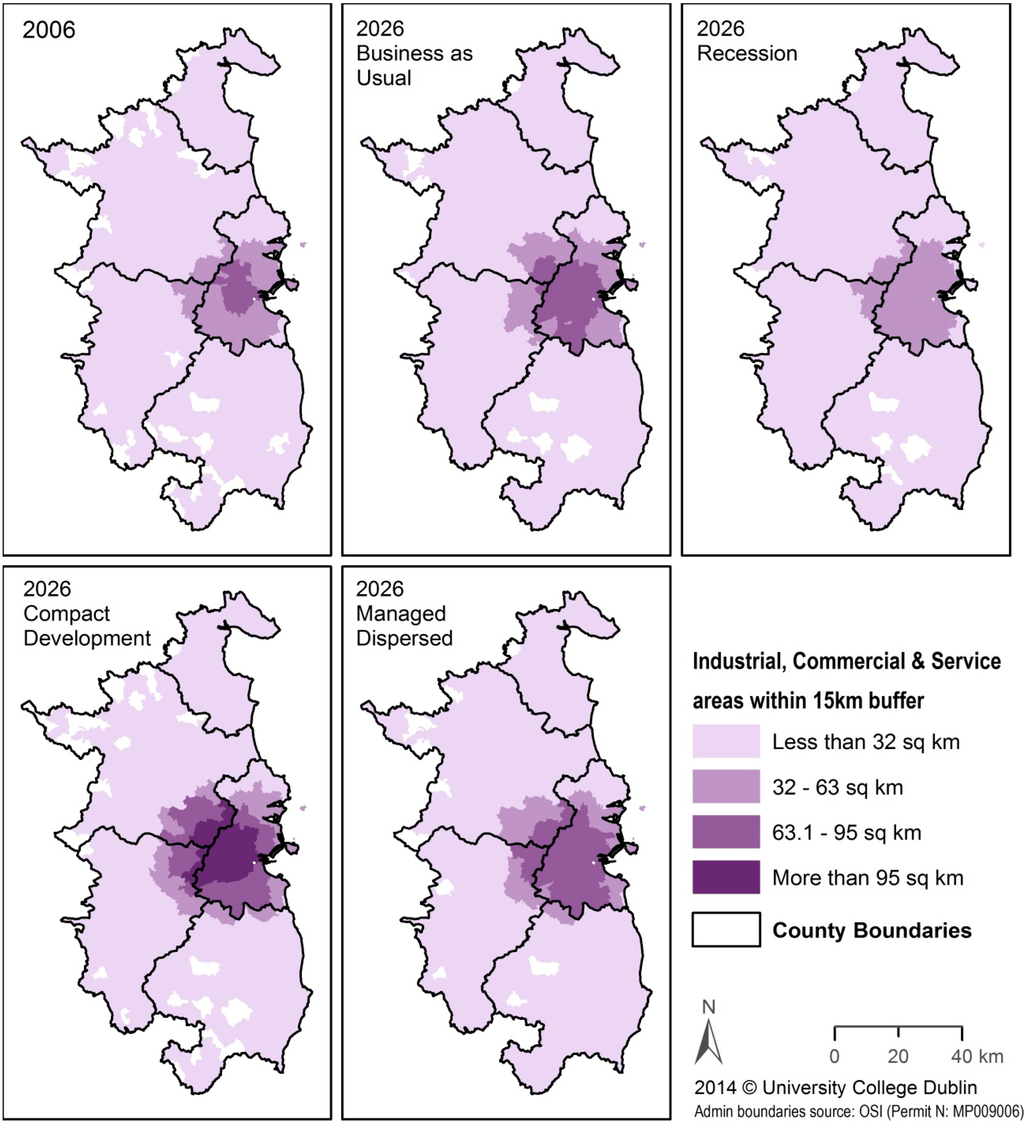
Figure 7.
Total area of industrial, commerce and service areas within a 15-km radius from residential neighbourhoods within the GDR.
Figure 7.
Total area of industrial, commerce and service areas within a 15-km radius from residential neighbourhoods within the GDR.

Figure 7 shows that there are more industrial, commercial and service land uses that are the main employment providers within a 15-km buffer from residential areas in an ED in the case of the “Compact Development” scenario. The relatively high concentration of enterprises and high employment densities within the core metropolitan area of Dublin is the main determinant of the mapping outcome under the “Compact Development” scenario. While in the case of the “Recession” scenario, the numbers of industrial, commercial and service land uses are less than what existed in 2006. In addition, though the “Managed Dispersed” scenario does not result in as much of a concentration of activity within the Dublin metropolitan area as the “Compact” area, it does achieve a greater balance of access across the entire GDR. This could be considered a more politically acceptable action; however, this may also require increased transport infrastructure or service costs to realise acceptable levels of accessibility for dispersed development and to ensure that modes other than private car are used.
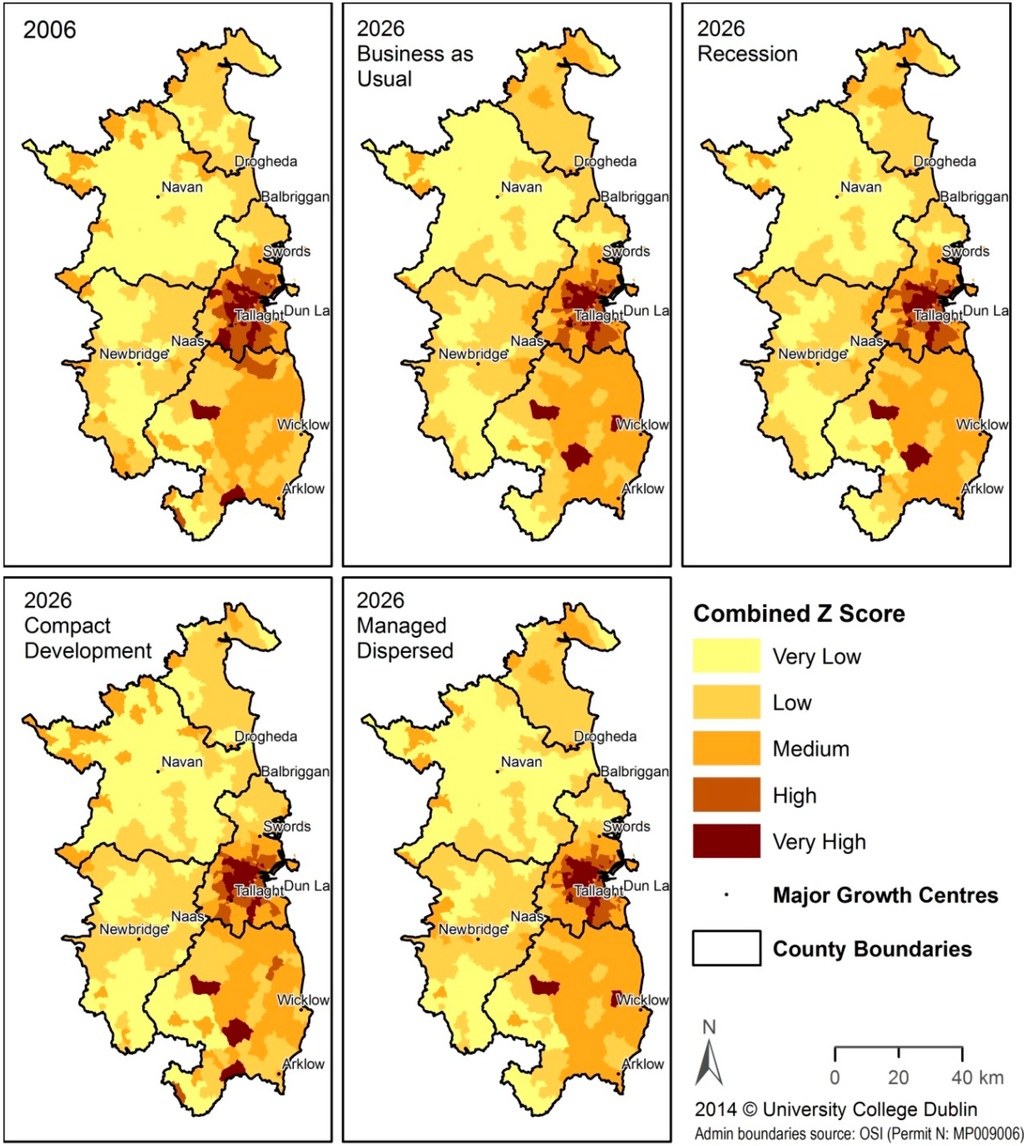
Figure 8.
Composite indicator maps of GDR.
Figure 8.
Composite indicator maps of GDR.

The opportunity mapping approach described in Section 2.5 was further applied to develop combined indicator maps for the region with the 12 indicators presented in Table 2.
Figure 8 shows a composite indicator map conditionally called the “Opportunity” map in terms of the 12 indicators. Opportunity mapping activity can be then described as geo-locating the best place to take residence from the accepted perspectives on the defined indicators. Opportunity in each case is concentrated within the core urban area of Dublin. Thus, this pattern generated by the chosen indicators supports the theory of cities as drivers of economic productivity, centres of knowledge and of enterprise [64,65,66,67].
Outside of the metropolitan core, levels of opportunity tend to be higher in the south of the GDR, across most scenarios, influenced in part by access to urban green areas, coastal areas and major primary transport routes.
The policy or plan maker must also apply knowledge of land use suitability and land use restrictions to check the results of the opportunity mapping. For example, some areas in the south of the GDR (north central to central Co. Wicklow) show medium levels of opportunity, even though development would be highly restricted there, due to the presence of the Natura 2000 designation in the Wicklow Mountains. In this study, the use of suitability and zoning maps in the MOLAND model ensures that there is very little or no development in restricted areas. However, those areas still may obtain a high opportunity based on the indicator values alone, and so, the plan or policy maker must be aware of such occurrences and restrictions.
Alternatively, in developing an economic plan for the region, required under the proposed new Regional Spatial and Economic Strategies [8], it would be possible to select a composite of indicators to focus more closely or solely on policy priorities, such as enterprise and employment.
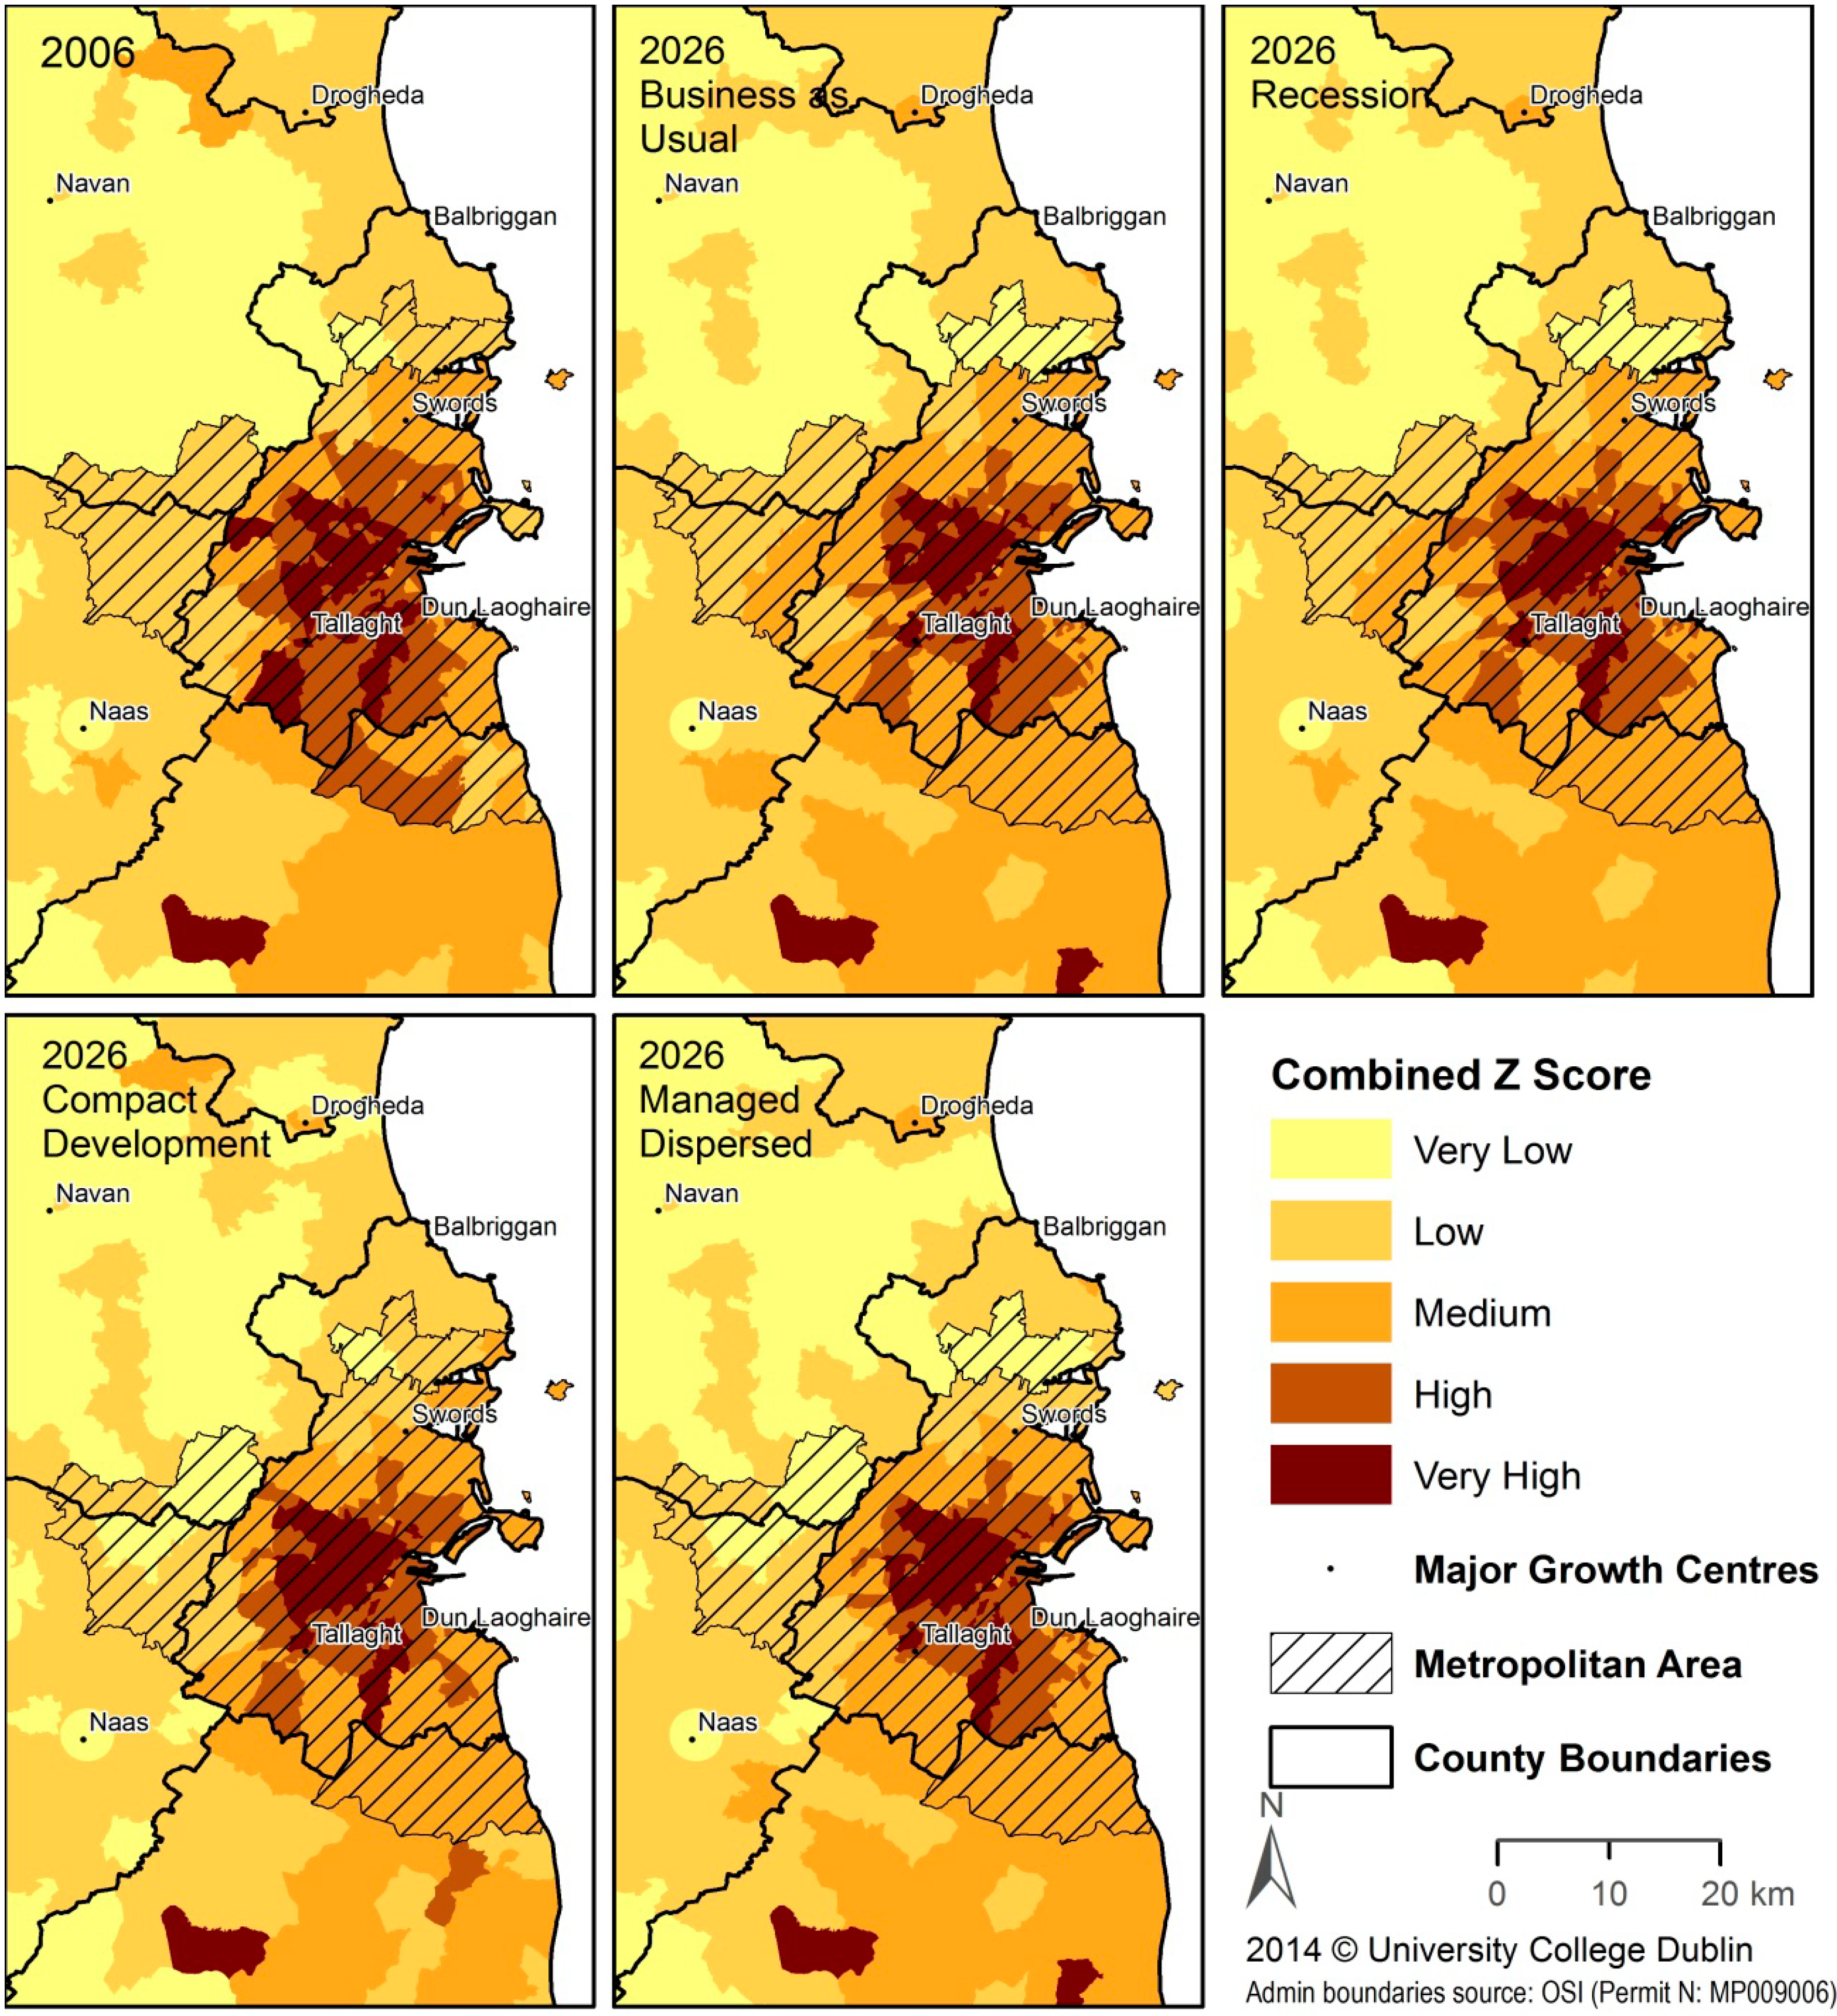
A closer look at the Dublin Region shows that opportunity levels and locations will shift from 2006 across all scenarios (Figure 9). Very high levels of opportunity are more evident in the “Compact Development” and “Managed Dispersed” scenarios than in the “Business as Usual” or “Recession” Scenarios. The fact that the high and very high opportunity diminishes within the Dublin Region from 2006 to 2026 is also a cause for further policy investigation. This can possibly be explained by an increase of distances from residential areas to urban green areas and main roads caused by the extension of residential areas simulated by the model, as the studied scenarios do not include major transport network updates or an increase of green areas.
The evaluation of the indicators carried out by the key stakeholders (including the National Transport Authority, the Dublin Regional Authority, Dublin City Council, the Economic and Social Research Institute of Ireland and the School of Geography, Planning and Environmental Policy and Forfás (the national economic policy advisory board)) is currently available upon request from the Dublin Regional Authority or its successor organisation. The indicator evaluations were based on the experience and expertise of the various stakeholders in the collation, preparation, analysis and implementation of various data and information for the purposes of economic and spatial planning in Ireland.
While for this study, we have aggregated all indicators (Formula 2), the evaluation of the conceptual framework behind the mapping will improve the method for practical application in decision making. Particularly, the internal consistency of these indicators and acceptable compensability levels need further research. In a situation where multiple indicators (criteria) are involved, the importance of each indicator relative to the particular category of opportunity must be evaluated and included in the opportunity mapping process to get realistic results. From a policy or plan makers’ perspective, there may be value in weighting indicators according to the perceived rating of importance. Obviously, reaching agreement on the relative importance of different indicators can be a complex and difficult task. Hence, multi-criteria analysis based on different ranking methods [68] can be applied to evaluate the relative importance of all indicators involved and reflect their importance in the opportunity mapping process as completed by our research team for the whole Ireland opportunity mapping exercise using a more comprehensive set of indicators [69]. However, in contrast to the whole of Ireland and other opportunity mapping studies [15,16], where a higher number of socio-economic indicators are used (e.g., numbers of employed and unemployed people, age dependency ratio, people with different education levels, household vacancy rate, people on the live register of unemployment, crime rates, etc.), the indicators suggested in Table 2 can be estimated for future scenarios and, therefore, are especially useful for alternative scenario evaluations.

Figure 9.
Composite indicator maps of the Dublin Region and Metropolitan Area.
Figure 9.
Composite indicator maps of the Dublin Region and Metropolitan Area.
4. Conclusions
Land use modelling and scenario analysis can provide a powerful evidence base for policy formation. One considerable advantage of the indicators used is that they are measurable and based on the specific requirements of the stakeholders. Weightings naturally introduce subjectivity, but have a usefulness in identifying the perceived strengths and weaknesses of the indicators chosen and the potential to improve the methodology. Finally, the opportunity map displays the composite of many indicators and results in a greater understanding of the dynamics of opportunity, both locally and regionally, for better informed policy formation. Linking it with land use modelling and applying it to scenario evaluation is an effective approach for evidence-based decision making, where research findings are used to support policy choices. In particular, such findings can give policy making interests a means of testing conflicting policy options and evaluating their impacts over extended periods of time. This will still result in conflicting opinions, potential outcomes and views as to plan making and development decisions. However, final decisions, when made, can be grounded on some evidence of their likely consequences and costs.
Taking into account the limited number of indicators in this study and their specific characters, the maps in Figure 8 and Figure 9 are not fully comprehensive opportunity maps. More accurately, these are maps of combined indicators that can be calculated based on the MOLAND model simulation outputs, which assist decision makers and planners in the selection of the most favourable future scenario. While the indicators used for this research are representative, they do point to the potential of forming a strong evidence base in terms of making the case for defining the best scenario and the need to service future population growth. The indicators and the results of the mapping exercise can be considered in a broader policy context, which includes life quality considerations, the tendency for knowledge economy enterprises to cluster in urban areas, the attraction of investment into an area and the retention of highly skilled mobile workers. Furthermore, through the comparison of policy targets and directions regarding future societal and economic needs and demands. The land use modelling, indicators and mapping exercise can allow urban planners and policy makers to see across a range of development scenarios and how their decisions of today will be compatible with the perceived demands of the future.
Acknowledgments
All work undertaken on the MOLAND model, for the Greater Dublin Region, is subject to the license conditions of the software developers, Research Institute for Knowledge Systems b.v. (RIKS b.v.), and the data set owners, DG JRC, under License No. JRC.BWL.30715. The calibration and validation of the MOLAND has been implemented in the scope of the Urban Environment Project, generously sponsored by the Irish Environmental Protection Agency as part of the Environmental Research Technological Development and Innovation (ERTDI) programme, which is funded through the National Development Plan. 2005-CD-U1-M1, Decision support tools for managing the urban environment in Ireland.
Author Contributions
Harutyun Shahumyan implemented the modelling and spatial analysis covered by the paper. He also developed tools to calculate the indicators using the MOLAND output and to generate the opportunity maps in the ArcGIS package. Brendan Williams and Walter Foley analysed the characteristics of the urban development of the study region. They worked with decision makers and planners to understand their vision on alternative future scenarios for the Greater Dublin Region and to identify required indicators for more effective decision making. Laura Petrov has created the storylines of the scenarios and assisted in converting them into quantitative scenarios applicable in the MOLAND model.
Conflicts of Interest
The authors declare no conflict of interest.
References
- Geertman, S.; Stillwell, J.C.H. Planning Support Systems Best Practice and New Methods; GeoJournal Library, Vol. 95; Springer: Dordrecht, Germany, 2009; Volume XXII, p. 490. [Google Scholar]
- Batty, M. PSS: Progress, Predictions & Speculations on the Shape of Things to Come; UCL CASA Working Paper 122; The Centre for Advanced Spatial Analysis (CASA), University College London: London, UK, 2007. [Google Scholar]
- Shearer, A.W. Approaching scenario-based studies: Three perceptions about the future and considerations for landscape planning. Environ. Plan. B 2005, 32, 67–87. [Google Scholar] [CrossRef]
- White, R.; Straatman, G.; Engelen, G. Planning visualization and assessment: A cellular automata based integrated spatial decision support system. In Spatially Integrated Social Science; Janelle, G., Ed.; Oxford University Press: Oxford, UK, 2004; pp. 420–442. [Google Scholar]
- Williams, B.; Oley, W.; Cudden, J.; Shahumyan, H. Synthesis report: Dublin Ireland’s flagship. In Dublin’s Role in the Irish & Global Economy Project Report; University College Dublin: Dublin, Ireland, 2012. [Google Scholar]
- Mahon, A.J. The Final Report of the Tribunal of Inquiry into Certain Planning Matters and Payments; Planning Tribunal: Dublin Castle, Ireland, 2012. [Google Scholar]
- MyPlan.ie Website. Available online: http://www.myplan.ie/en/newinitiatives.html (accessed on 11 September 2014).
- DoECLG. Putting People First: Action Plan. for Effective Local Government; Department of Environment, Community and Local Government Dublin: Dublin, Ireland, 2012. [Google Scholar]
- Barredo, J.I.; Demicheli, L.; Lavalle, C.; Kasanko, M.; McCormick, N. Modelling future urban scenarios in developing countries: An application case study in Lagos, Nigeria. Environ. Plan. B 2004, 31, 65–84. [Google Scholar] [CrossRef]
- Petrov, L.O.; Lavalle, C.; Kasanko, M. Urban land use scenarios for a tourist region in Europe: Applying the MOLAND model to Algarve, Portugal. Landsc. Urban Plan. 2009, 92, 10–23. [Google Scholar] [CrossRef]
- Shahumyan, H.; White, R.; Petrov, L.; Williams, B.; Convery, S.; Michael, B. Urban development scenarios and probability mapping for Greater Dublin Region: The MOLAND model applications. Lect. Notes Comput. Sci. 2011, 6782, 119–134. [Google Scholar]
- Petrov, L.; Harutyun, S.; Brendan, W.; Sheila, C. Scenarios and indicators supporting urban regional planning. Procedia—Soc. Behav. Sci. 2011, 21, 243–252. [Google Scholar]
- Rametsteiner, E.; Pülzl, H.; Alkan-Olsson, J.; Frederiksen, P. Sustainability indicator development—Science or political negotiation? Ecol. Indicat. 2011, 11, 61–70. [Google Scholar] [CrossRef]
- Haase, T.; Pratschke, J. Deprivation and Its Spatial Articulation in the Republic of Ireland: New Measures of Deprivation Based on the Census of Population, 1991, 1996 and 2002; Area Development Management: Dublin, Ireland, 2005. [Google Scholar]
- Reece, J.; Gambhir, S.; Ratchford, C.; Martin, M.; Olinger, J. The Geography of Opportunity: Mapping to Promote Equitable Community Development and Fair Housing in King County, WA; Kirwan Institute for the Study of Race and Ethnicity, Ohio State University: Columbus, OH, USA, 2010. Available online: http://kirwaninstitute.osu.edu/docs/KingCounty.pdf (accessed on 11 September 2014).
- Reece, J.; Gambhir, S.; Olinger, J.; Martin, M.; Harris, M. People, Place and Opportunity: Mapping Communities of Opportunity in Connecticut; A Report Commissioned by Connecticut Fair Housing Center. Kirwan Institute for the Study of Race And Ethnicity, Ohio State University: Columbus, OH, USA, 2009. Available from: http://www.kirwaninstitute.osu.edu/reports/2009/11_2009_CTOppMapping_FullReport.pdf (accessed on 11 September 2014).
- Batty, M. Urban modelling. In International Encyclopedia of Human Geography; Kitchin, R., Thrift, N., Eds.; Elsevier: New York, NY USA, 2009; pp. 51–58. [Google Scholar]
- Dublin & Mid-East Regional Authorities, The Regional Planning Guidelines Office. Regional Planning Guidelines for the Greater Dublin Area. 2010. Available online: http://rpg.ie/index.html (accessed on 11 September 2014).
- Couch, C.; Leontidou, L.; Petschel-Held, G. (Eds.) Urban Sprawl in Europe: Landscapes, Land-Use Change & Policy; Blackwell: Oxford, UK/Malden, MA, USA, 2007; Volume XIX, p. 273.
- National Spatial Strategy. National Spatial Strategy for Ireland 2002–2020: People, Places and Potential; Stationery Office: Dublin, Ireland, 2002; p. 160. [Google Scholar]
- Housing Agency & Future Analytics. Housing Supply Requirements in Ireland’s Urban Settlements 2014–2018; Housing Agency: Dublin, Ireland, 2014. [Google Scholar]
- Williams, B.; Shahumyan, H.; Boyle, I.; Convery, S.; White, R. Utilizing an urban-regional model (MOLAND) for testing the planning and provision of wastewater treatment capacity in the Dublin Region 2006–2026. Plan. Prac. Res. 2012, 27, 227–248. [Google Scholar] [CrossRef]
- De Almeida, C.; Batty, M.; Monteiro, A.M.; Soares-Filho, B.S.; Cerqueira, G.C.; Pennachin, C.P. Stochastic cellular automata modeling of urban land use dynamics: Empirical development and estimation. Comput. Environ. Urban Syst. 2003, 27, 481–509. [Google Scholar] [CrossRef]
- Dietzel, C.; Clarke, K.C. Replication of spatio-temporal land use patterns at three levels of aggregation by an urban cellular automata. Cell. Autom. Proc. 2004, 3305, 523–532. [Google Scholar]
- Tobler, W.R. Cellular geography. In Philosophy in Geography; Gale, S., Olsson, G., Eds.; Reidel: Dordrecht, The Netherlands, 1979; pp. 379–386. [Google Scholar]
- Batty, M. Cellular automata and urban form: A primer. J. Am. Plan. Assoc. 1997, 63, 266–274. [Google Scholar] [CrossRef]
- Couclelis, H. From cellular automata to urban models: New principles for model development and implementation. Environ. Plan. B 1997, 24, 165–174. [Google Scholar] [CrossRef]
- Yeh, A.G.O.; Li, X. Simulation of development alternatives using neural networks, cellular automata, and GIS for urban planning. Photogramm. Eng. Remote Sens. 2003, 69, 1043–1052. [Google Scholar] [CrossRef]
- White, R.; Engelen, G. Cellular automata as the basis of integrated dynamic regional modelling. Environ. Plan. B 1997, 24, 235–246. [Google Scholar] [CrossRef]
- White, R.; Engelen, G.; Uljee, I. The use of constrained cellular automata for high-resolution modelling of urban land-use dynamics. Environ. Plan. B 1997, 24, 323–343. [Google Scholar] [CrossRef]
- Clarke, K.C.; Gaydos, L.J. Loose-coupling a cellular automaton model and GIS: Long-term urban growth prediction for San Francisco and Washington/Baltimore. Int. J. Geogr. Inf. Sci. 1998, 12, 699–714. [Google Scholar] [CrossRef] [PubMed]
- Silva, E.A. The DNA of our regions: Artificial intelligence in regional planning. Futures 2004, 36, 1077–1094. [Google Scholar] [CrossRef]
- Yeh, A.G.O.; Li, X. A constrained CA model for the simulation and planning of sustainable urban forms by using GIS. Environ. Plan. B 2001, 28, 733–753. [Google Scholar] [CrossRef]
- Barredo, J.I.; Demicheli, L. Urban sustainability in developing countries’ megacities: Modelling and predicting future urban growth in Lagos. Cities 2003, 20, 297–310. [Google Scholar] [CrossRef]
- McCormick, N.; Lavalle, C.; Barredo, J. An example of the application of spatial dynamics modeling for evaluating the future impact of land use development decisions. Proceedings of 4th Seminar of the PlanNet Europe Network on Strategic Environmental Assessment (SEA) of Urban Plans and Programs, Brussels, Belgium; 2005, pp. 47–55. Available: http://planet.difu.de/2005/proceedings/index.phtml (accessed on 11 September 2014).
- Demicheli, L.; Carlo, L.; Marjo, K.; Jose, B.; Niall, M.C.; Valentina, S. Creaton of Territorial and Environmental Data Sets for the County of Harjumaa (Estonia) and the Corridor Tallin-Parnuu; Institute for Environment and Sustainability, EC Joint Research Centre: Ispra, Italy, 2003. [Google Scholar]
- Shahumyan, H.; Twumasi, B.O.; Convery, S.; Foley, R.; Vaughan, E.; Casey, E.; Carty, J.; Walsh, C.; Michael, B. Data Preparation for the MOLAND Model Application for the Greater Dublin Region; UCD Urban Institute Ireland Working Paper Series; University College Dublin: Dublin, UK, 2009. [Google Scholar]
- Shahumyan, H. The MOLAND Model Calibration and Validation for the Greater Dublin Region; UCD Urban Institute Ireland Working Paper Series; University College Dublin: Dublin, Ireland, 2009. [Google Scholar]
- Urban Environment Project Website. Available online: http://www.uep.ie (accessed on 11 September 2014).
- Brennan, M.; Shahumyan, H.; Walsh, C.; Carty, J.; Williams, B.; Convery, S. Regional Planning Guideline Review: Using MOLAND as Part of the Strategic Environmental Assessment Process; UCD Urban Institute Ireland Working Paper Series; University College Dublin: Dublin, Ireland, 2009. [Google Scholar]
- Shahumyan, H.; Convery, S.; Casey, E. Exploring land use-transport interactions in the Greater Dublin Region using the MOLAND model. In Proceedings of the 1st Annual Conference of the Irish Transport Research Network, Dublin, Ireland, 31 August 2010.
- Petrov, L.; Shahumyan, H.; Williams, B.; Convery, S. Applying spatial indicators to support a sustainable urban future. Environ. Prac. 2013, 15, 19–32. [Google Scholar] [CrossRef]
- Engelen, G.; White, R.; Uljee, I. The MOLAND Model for Urban and Regional Growth; Research Institute for Knowledge Systems (RIKS BV): Maastricht, The Netherlands, 2004. [Google Scholar]
- Hurkens, J.; Hahn, B. Using the GEONAMICA® software environment for integrated dynamic spatial modelling. In Proceedings of iEMSs 2008: International Congress on Environmental Modelling and Software, Barcelona, Spain, 7–10 July 2008.
- Donghan, K.; Batty, M. Calibrating Cellular Automata Models for Simulating Urban Growth: Comparative Analysis of SLEUTH and Metronamica; UCL CASA Working Paper 176; The Centre for Advanced Spatial Analysis (CASA), University College London: London, UK, 2011. [Google Scholar]
- Central Statistics Office (CSO). Population and Labour Force Projections 2011–2041; CSO: Dublin, UK, 2008. [Google Scholar]
- Brack, W.; Altenburger, R.; Schüürmann, G.; Krauss, M.; López Herráez, D.; van Gils, J.; Slobodnik, J.; Munthe, J.; Gawlik, B.M.; van Wezel, A.; et al. The SOLUTIONS project: Challenges and responses for present and future emerging pollutants in land and water resources management. Sci. Total Environ. 2014. [Google Scholar] [CrossRef]
- Celino, A.; Concilio, G. Participation in environmental spatial planning: Structuring-scenario to manage knowledge in action. Futures 2010, 42, 733–742. [Google Scholar] [CrossRef]
- Geneletti, D. Environmental assessment of spatial plan policies through land use scenarios: A study in a fast-developing town in rural Mozambique. Environ. Impact Assess. Rev. 2012, 32, 1–10. [Google Scholar] [CrossRef]
- Hewitta, R.; van Delden, H.; Escobar, F. Participatory land use modelling, pathways to an integrated approach. Environ. Model. Softw. 2014, 52, 149–165. [Google Scholar] [CrossRef]
- Engaging the Future—Forecasts, Scenarios, Plans, and Projects; Lincoln Institute of Land Policy: Cambridge, MA, USA, 2007.
- Solecki, W.D.; Oliveri, C. Downscaling climate change scenarios in an urban land use change model. J. Environ. Manag. 2004, 72, 105–115. [Google Scholar] [CrossRef]
- Verburg, P.H.; Veldkamp, A.; Rounsevell, M.D.A. Scenario-based studies of future land use in Europe. Agric. Ecosyst. Environ. 2006, 114, 1–6. [Google Scholar] [CrossRef]
- Xiang, W.N.; Clarke, K.C. The use of scenarios in land-use planning. Environ. Plan. B 2003, 30, 885–909. [Google Scholar] [CrossRef]
- Bergin, A.; Conefrey, T.; Fitzgerald, J.D.; Kearney, I.M. Recovery Scenarios for Ireland; Research Series Number RS007; Economic and Social Research Institute: Dublin, Ireland, 2009; Volume 7. [Google Scholar]
- Central Statistics Office (CSO). Regional Population Projections 2016–2031; CSO Statistical Release: Cork, Ireland, 2013. [Google Scholar]
- Kok, K.; van Delden, H. Combining two approaches of integrated scenario development to combat desertification in the Guadalentin Watershed, Spain. Environ. Plan. B 2009, 36, 49–66. [Google Scholar] [CrossRef]
- De Vor, F.; de Groot, H.L.F. The impact of industrial sites on residential property values: A hedonic pricing analysis for the Netherlands. Reg. Stud. 2009, 45, 609–623. [Google Scholar] [CrossRef]
- Shahumyan, H.; Jankowski, P. Integration of the MOLAND model with GeoChoicePerspectives spatial decision support software for scenario evaluation. In Proceedings of the 13th AGILE International Conference on Geographic Information Science, Guimarães, Portugal, 10–14 May 2010.
- Burton, E. The compact city: Just or just compact? A preliminary analysis. Urban Stud. 2000, 37, 1969–2006. [Google Scholar] [CrossRef]
- Jenks, M.; Burton, E.; Williams, K. (Eds.) The Compact City: A Sustainable Urban Form? Spon Press: London, UK, 1996.
- Haughton, G.; Hunter, C. Sustainable Cities; Jessica Kingsley: London, UK, 1994. [Google Scholar]
- National Spatial Strategy. National Spatial Strategy—The Irish Urban System and Its Dynamics; Government Stationery Office: Dublin, Ireland, 2000. [Google Scholar]
- Quigley, J.M. Urbanization, agglomeration, and economic development. In Urbanisation and Growth; Spence, M., Annez, P.C., Buckley, R.M., Eds.; The International Bank for Reconstruction and Development: Washington, DC, USA, 2009. [Google Scholar]
- Organisation for Economic Cooperation and Development (OECD). Competitive Cities in the Global Economy; OECD: Paris, France, 2007. [Google Scholar]
- Asheim, B.; Cooke, P.; Martin, R. The rise of the cluster concept in regional analysis and policy: A critical assessment. In Clusters and Regional Development: Critical Reflections and Explorations; Asheim, T., Ed.; Routledge: London, UK/New York, NY, USA, 2006; pp. 1–29. [Google Scholar]
- Krugman, P. Innovation and agglomeration: Two parables suggested by city-size distributions. Jpn. World Econ. 1995, 7, 371–390. [Google Scholar] [CrossRef]
- The Center for International Forestry Research (CIFOR). Guidelines for Applying Multi-Criteria Analysis to the Assessment of Criteria and Indicators; CIFOR: Bogor, Indonesia, 1999. [Google Scholar]
- Shahumyan, H.; Williams, B.; Foley, W. Spatial analytic approaches assessing socio-economic development of the Dublin Region: Compared with other regions in Ireland. In Dublin’s Role in the Irish & Global Economy Project Report; University College Dublin: Dublin, Ireland, 2013. [Google Scholar]
Appendix
Indicators Calculation Methodology
A1. Proximity of Residential Areas to Green/Industrial/Commercial/Service Areas
Tool description: Mean minimum distance from one land use (residential areas) in an ED to other land use (semi-natural, forest, artificially vegetated, industrial, commercial, service) areas.
Steps (Figure A1)
- Land use raster map is converted to a vector map (ArcToolbox > Conversion Tools > From Raster > Raster to Polygon).
- Resulting land use vector layer is intersected with EDs vector layer (ArcToolbox > Analysis Tools > Overlay > Intersect).

Figure A1.
ArcGIS Model calculating proximity of residential areas to green, industrial, commercial or service areas.
Figure A1.
ArcGIS Model calculating proximity of residential areas to green, industrial, commercial or service areas.
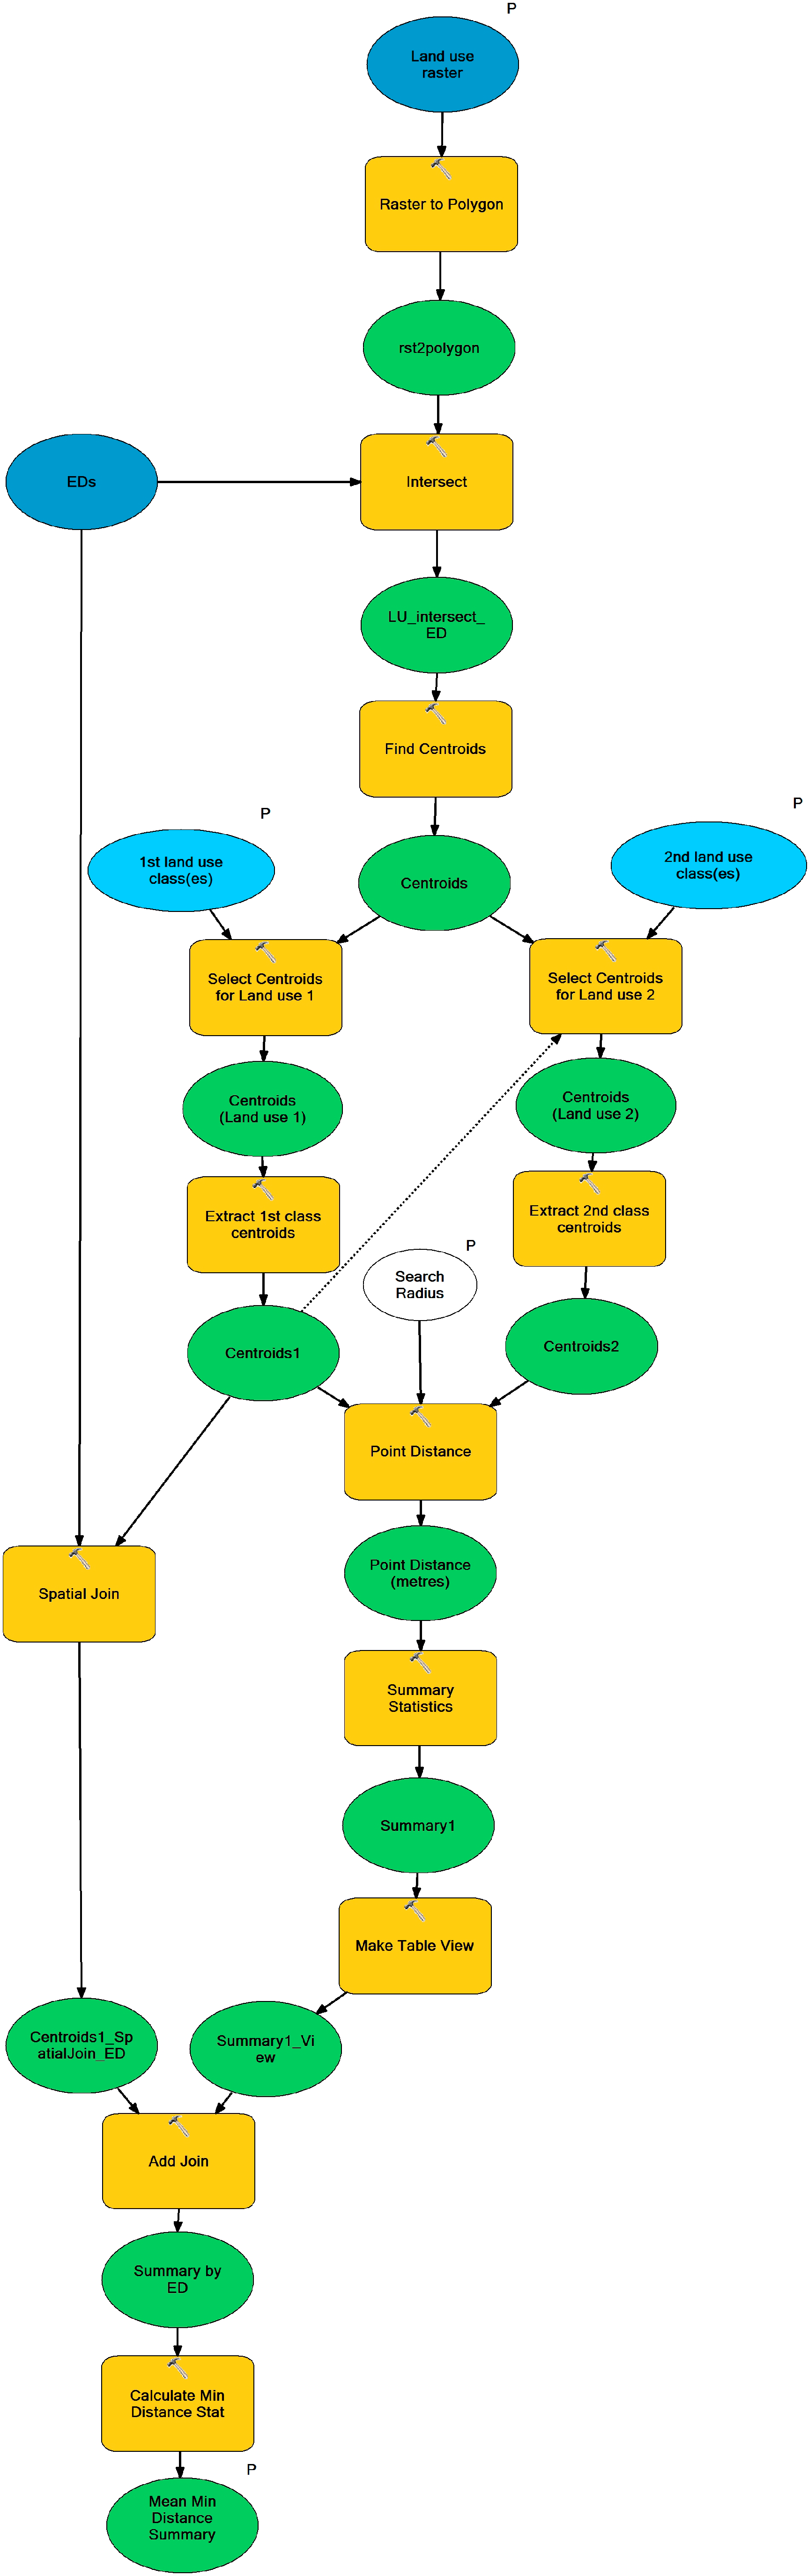
- Centroids of all intersected polygons are generated (ArcToolbox > Data Management Tools > Features > Feature to Point).
- Two groups of centroids were selected and exported to new layers: centroids corresponding to residential land use polygons and centroids corresponding to the second relevant land use (green, industrial, commercial, etc.) (ArcToolbox > Analysis Tools > Extract > Select followed by ArcToolbox > Data Management Tools > Features > Copy Features).
- Centroids corresponding to residential land use polygons were spatially joined with ED polygons in which they are located (ArcToolbox > Analysis Tools > Overlay > Spatial Join, using COMPLETELY_WITHIN match option). As a result each “residential” centroid has got corresponding ED code in its attribute table, which will be later used in Summary Statistics.
- The distances between points in the two centroid layers are calculated (ArcToolbox > Analysis Tools > Proximity > Point Distance). This calculates the distances between all possible pairs of points from these two layers.
- Minimum distance from a residential point to the second land use point is identified (ArcToolbox > Analysis Tools > Statistics > Summary Statistics).
- Resulting table is joined with ED layer (ArcToolbox > Data Management Tools > Joins > Add Join).
- Mean minimum distance is calculated for each ED (ArcToolbox > Analysis Tools > Statistics > Summary Statistics).
A2. Proximity to Main Roads/Railway/Coast
Tool description: Mean minimum distance from one land use (residential) areas in an ED to some vector features (main roads, rail stations, and coastline).
Steps (Figure A2)
- Land use raster map is converted to a vector map (ArcToolbox > Conversion Tools > From Raster > Raster to Polygon).
- Resulting land use vector layer is intersected with EDs vector layer (ArcToolbox > Analysis Tools > Overlay > Intersect).
- Centroids of all intersected polygons are generated (ArcToolbox > Data Management Tools > Features > Feature to Point).
- Centroids corresponding to residential land use polygons are selected and exported to new layer (ArcToolbox > Analysis Tools > Extract > Select followed by ArcToolbox > Data Management Tools > Features > Copy Features).
- “Residential” centroids are spatially joined with ED polygons in which they are located (ArcToolbox > Analysis Tools > Overlay > Spatial Join, using COMPLETELY_WITHIN match option). As a result each “residential” centroid has got corresponding ED code in its attribute table, which will be later used in Summary Statistics.
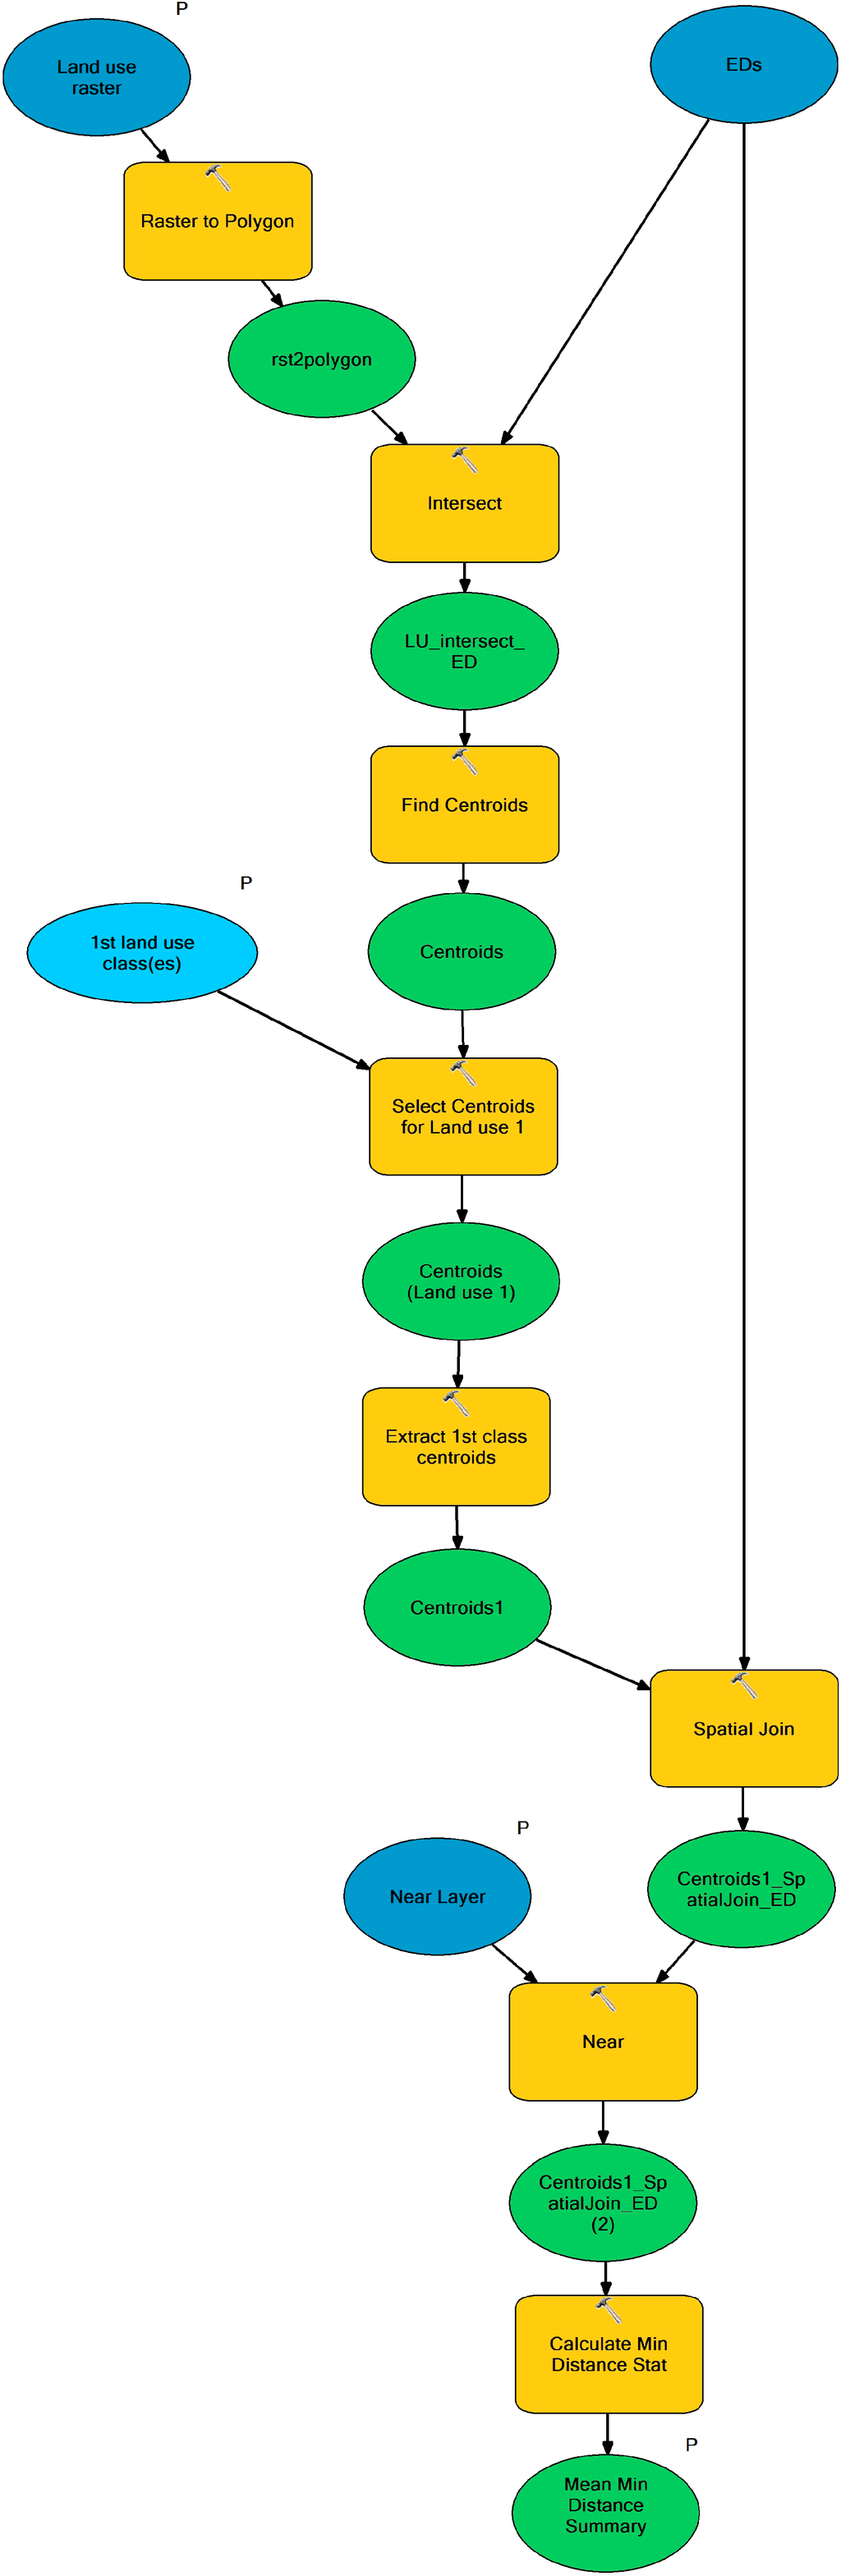
Figure A2.
ArcGIS Model calculating proximity to roads, railway or coast.
Figure A2.
ArcGIS Model calculating proximity to roads, railway or coast.

- The distances from centroids to the nearest object in the “Near” layer (e.g., roads or coastline) are calculated (ArcToolbox > Analysis Tools > Proximity > Near).
- Mean minimum distance is calculated for each ED (ArcToolbox > Analysis Tools > Statistics > Summary Statistics).
A3. Proportion of Residential Areas Adjacent to Major Transport Routes
Tool description: Proportion of residential areas (from overall residential) in an ED within specific (200 m) distance from major roads, railway and light rail.
Steps (Figure A3)
- A specific (200 m) buffer from major roads is created (ArcToolbox > Analysis Tools > Proximity > Buffer).
- The road buffer is intersected with ED boundaries (ArcToolbox > Analysis Tools > Overlay > Intersect).
- Land use areas are calculated using road buffer and ED intersect polygons as zone feature (ArcToolbox > Spatial Analyst Tools > Zonal > Tabulate Area).
- New field “Residential” is added to the statistics table (ArcToolbox > Data Management Tools > Fields > Add Field).
- The values of Residential field is calculated as a summary of four residential land use types used in the MOLAND land use dataset (ArcToolbox > Data Management Tools > Fields > Calculate Field).
- All other fields in the summary table are deleted.
A4. Quantity of Potential Employers
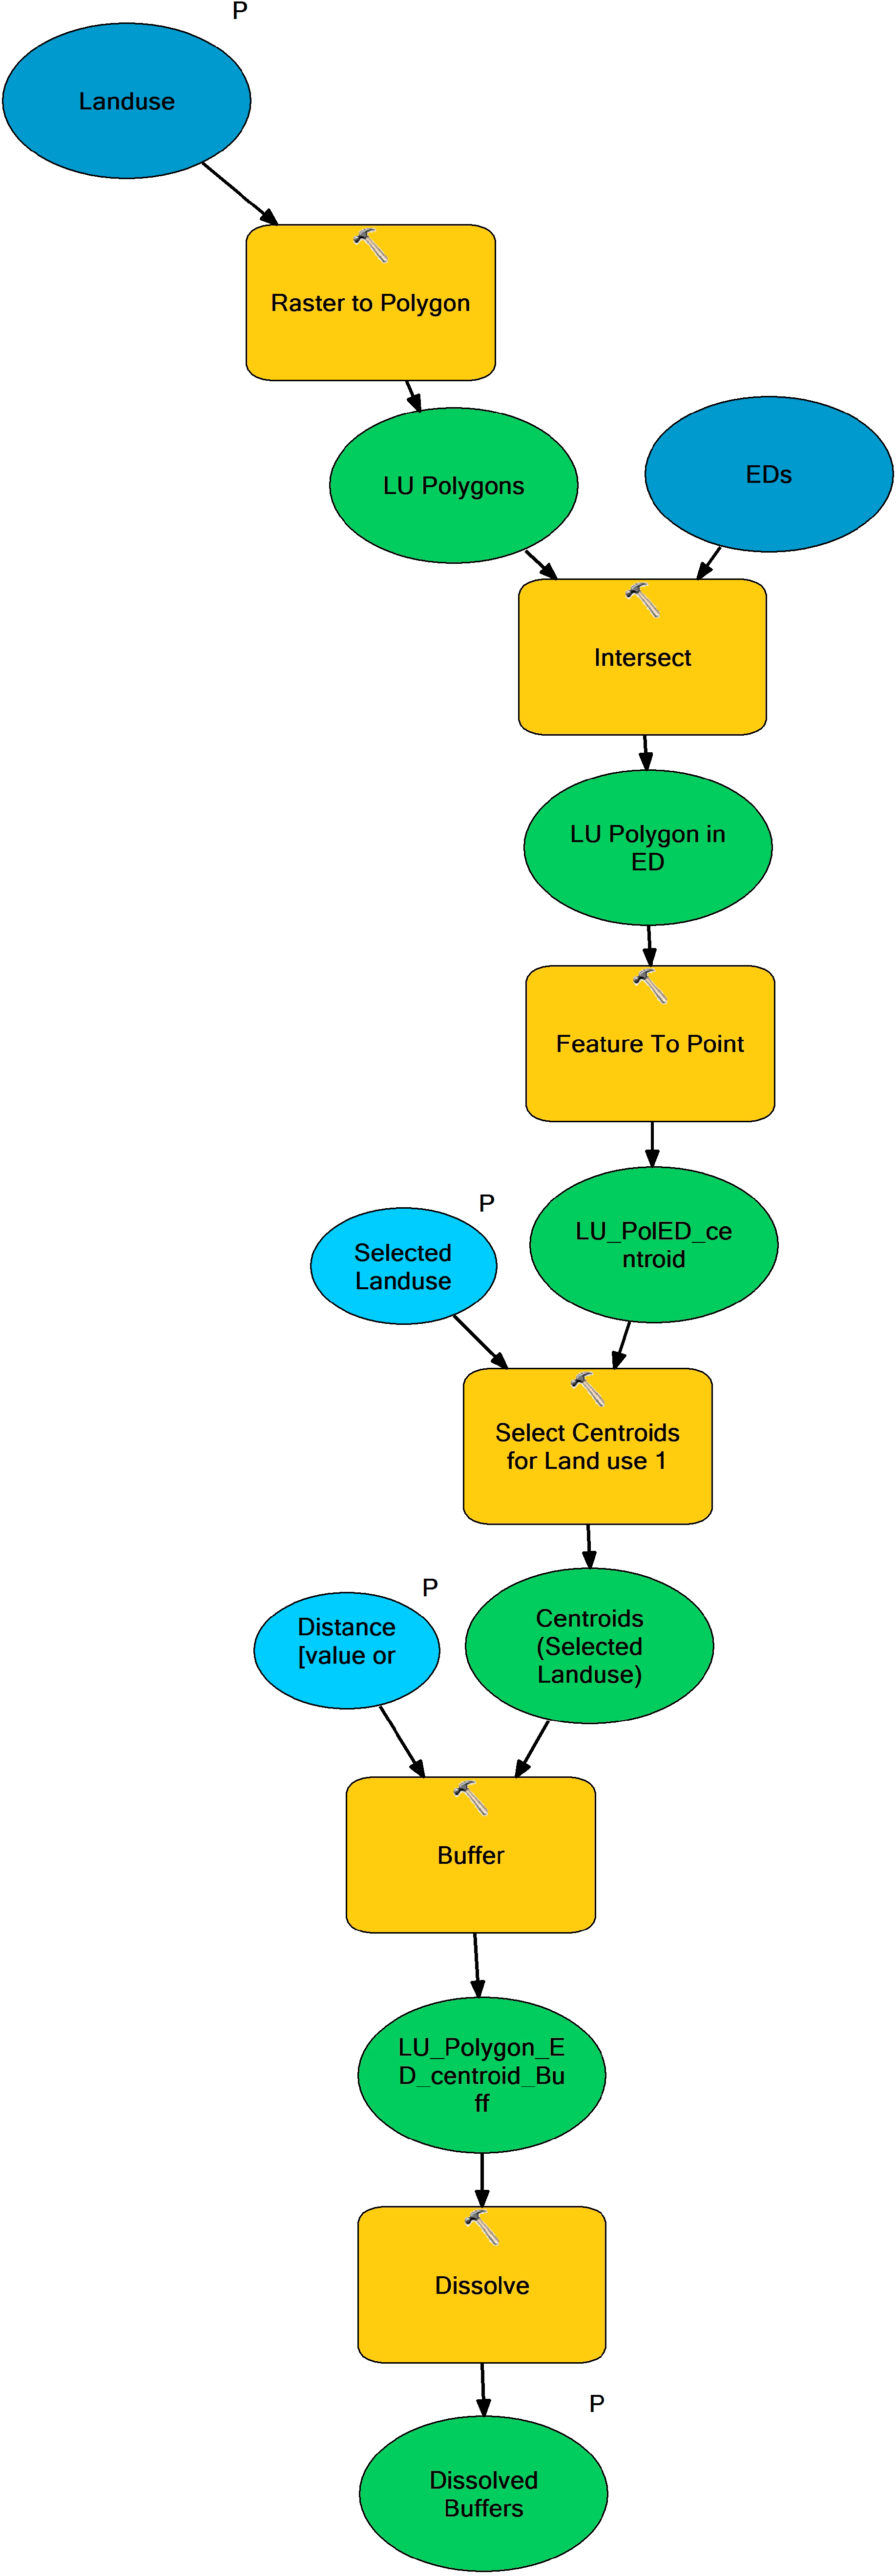
Tool description: Total area of selected land use (industrial, commerce and service) areas within specific (15 km) radius from residential neighbourhoods.
Steps (Figure A4)
- Land use raster map is converted to a vector map (ArcToolbox > Conversion Tools > From Raster > Raster to Polygon).
- Resulting land use vector layer is intersected with EDs vector layer (ArcToolbox > Analysis Tools > Overlay > Intersect).
- Centroids of all intersected polygons are generated (ArcToolbox > Data Management Tools > Features > Feature to Point).
- Centroids corresponding to residential land use polygons are selected and exported to new layer (ArcToolbox > Analysis Tools > Extract > Select followed by ArcToolbox > Data Management Tools > Features > Copy Features).
- A buffer with specified distance has created for residential polygon centroids.
- The buffers are dissolved using ED codes.
- Land use areas are calculated using dissolved buffer layer as zone feature (ArcToolbox > Spatial Analyst Tools > Zonal > Tabulate Area).
- Selected land use (industrial, commerce and service) areas are summed.

Figure A3.
ArcGIS Model calculating proportion of residential areas adjacent to major roads.
Figure A3.
ArcGIS Model calculating proportion of residential areas adjacent to major roads.
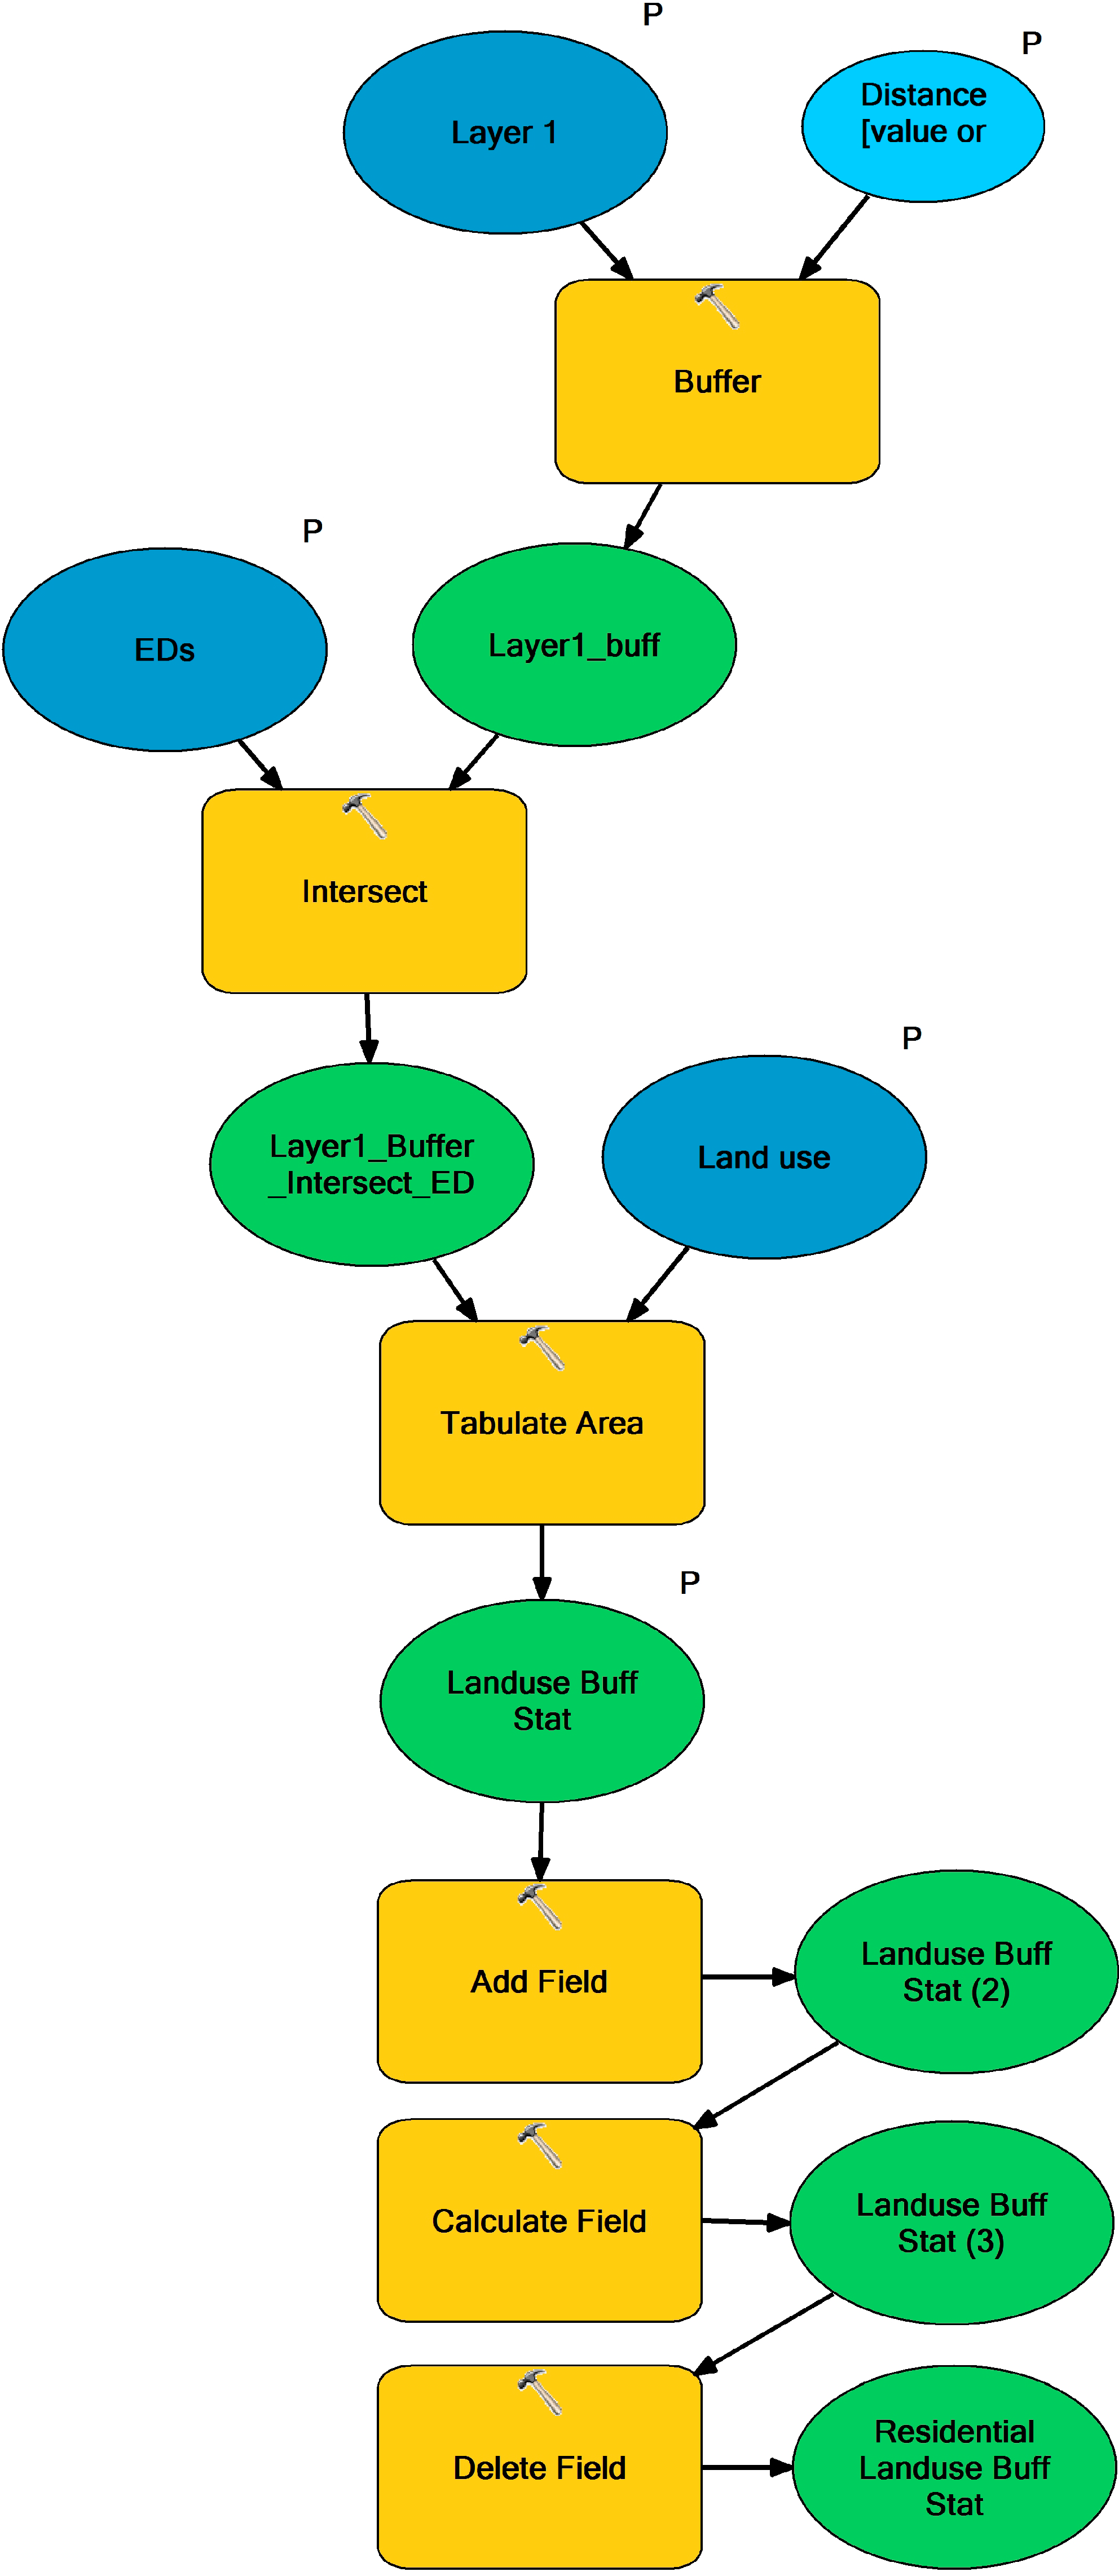

Figure A4.
ArcGIS Model calculating quantity of potential employers.
Figure A4.
ArcGIS Model calculating quantity of potential employers.
A5. Quantity of Nearby Tertiary Education Institutes
Tool description: Mean number of tertiary institutes within specific distance (13 km) from residential neighbourhoods.
Steps
- 1–6
- steps from A4 model;
- 7.
- The dissolved buffers are spatially joined with tertiary institutes layer (as a result the number of the institutes in each buffer for each ED is counted).
A6. Quantity of Nearby Green Areas
Tool description: Total area of selected land uses (semi-natural, forest and artificially vegetated areas) areas within specific (5 km) radius from residential areas in an ED.
Steps
- 1–7
- steps from A4 model using 5 km in step 5.
- 8.
- Semi-natural, forest and artificially vegetated areas are summed.
A7. Ratio of Green Areas to Built Areas
Tool description: The ratio of some land use (semi-natural, forest and artificially vegetated areas) areas to other land use (residential, industrial, commercial, service).
Steps
- Land use areas are calculated using ED polygons as zone feature (ArcToolbox > Spatial Analyst Tools > Zonal > Tabulate Area)
- The sum of green (semi-natural, forest and artificially vegetated areas) and built areas (residential, industrial, commercial, service) have been calculated for each ED.
- The ratio of the above mentioned sums is calculated.
© 2014 by the authors; licensee MDPI, Basel, Switzerland. This article is an open access article distributed under the terms and conditions of the Creative Commons Attribution license (http://creativecommons.org/licenses/by/3.0/).