Article

Which Landscape Elements Deliver Which Cultural Ecosystem Services? Multimodal Evidence from a Tiered Urban Forest Park System


1
School of Architecture, South China University of Technology, Guangzhou 510640, China
2
College of Computing, Georgia Institute of Technology, Atlanta, GA 30332, USA
3
State Key Laboratory of Subtropical Building and Urban Science, Guangzhou 510640, China
4
Guangzhou Institute Forestry and Landscape Architecture, Guangzhou 510405, China
*
Author to whom correspondence should be addressed.
These authors contributed equally to this work.
Land 2026, 15(9), 1586; https://doi.org/10.3390/land15091586
Submission received: 30 July 2026 / Revised: 18 August 2026 / Accepted: 27 August 2026 / Published: 28 August 2026
(This article belongs to the Special Issue Cultural Ecosystem Services in Urban Green Spaces)

Abstract

Cultural ecosystem services (CES) are widely measured but rarely attributed to the specific landscape elements that generate them. We coupled element-level image recognition with service-level text analysis across 20,447 reviews and 18,997 photographs from three social media platforms covering 15 national-, provincial-, and municipal-level forest parks in Guangzhou, China (2020–2024). A 2660-term dictionary quantified nine CES; a fine-tuned deep learning classifier identified 28 landscape elements; multiple correspondence analysis described the element-service structure and ridge regression tested associations within four case parks. Natural elements aligned with ecological, aesthetic, and inspirational services and built elements with cultural, social, and wellness services, but two results qualify that division. First, individual elements were associated with different services in opposite directions: seasonal forest with higher aesthetic appreciation but lower recreation, water features with higher aesthetic value but lower inspiration. Second, the mapping differed across the four case parks rather than holding constant; in the municipal case park, only built facilities positively predicted social interaction. These four parks are illustrative exemplars rather than representative samples of their tiers. Dynamic biological elements (birds 0.43%, insects 0.12%, fish 0.08%) ranked lowest of all 28 elements. These are descriptive associations awaiting mechanistic explanation; on that reading, planning for CES would be better organized around intended services than element inventories, calibrated to the individual park.

1. Introduction

Rapid urbanization and high population density have intensified residents’ separation from nature and their exposure to psychological stress, heightening demand for the non-material benefits that ecosystems provide [1,2]. Successive classification frameworks have established cultural ecosystem services (CES) as a distinct service category [3,4,5,6,7]. CES are the non-material benefits people obtain from ecosystems through recreation, aesthetic experience, spiritual enrichment, cognitive development, and social interaction, and they directly shape human well-being and quality of life [8,9,10,11]. In high-density cities, forest parks serve not only as ecological “green lungs” but also as principal settings where the public contacts nature, undertakes leisure, and gains spiritual satisfaction and cultural identity [12,13]. As public demand shifts from sightseeing toward deeper restoration and cultural identification, quantifying forest-park CES from a visitor-demand perspective offers a basis for refined park operation and management [14].
Traditional CES assessment has relied on questionnaires, interviews, expert scoring and public-participation GIS [15,16,17], and on economic valuation methods such as travel cost and benefit transfer [18,19,20]. Although these participatory and valuation methods capture in-depth information, they are limited by small samples, restricted spatial-temporal coverage, subjectivity, and high cost [21]. In the big-data era, every citizen acts as a “sensor”, and the rise of social media platforms such as Ctrip, Weibo, and Dianping has opened new avenues for CES perception assessment, providing large, real-time, multimodal first-person data that reflect visitors’ experiences across broad spatial-temporal scales [22,23,24,25].
Methods for mining these data have advanced quickly. Convolutional and more recent deep learning architectures identify and classify visual content with objectivity, efficiency, and good generalization [26,27], and have proven effective for quantifying CES and landscape features from photographs [28]. On the text side, dictionary-based approaches offer transparent, reproducible, and cross-site-comparable classification of service types and their frequencies, whereas large language models (LLMs) excel at tasks where contextual nuance, irony, and compound semantics matter [29,30]. LLM-based CES assessment is no longer novel in itself: Luo et al. [31] introduced a few-shot prompting method for extracting CES perceptions from text, Song et al. [32] applied and benchmarked several LLMs to decode multidimensional park perceptions across 158 parks in Hong Kong, Ren et al. [33] combined deep text classification with sentiment modelling for heritage parks, and Zhang et al. [34] assessed CES perception and equity across 115 urban parks from review data. What remains uncommon is the coupling of the two modalities within a single design: most studies analyze either images or text, leaving the complementarity of multi-source social media data underexploited [35,36,37,38]. Images reveal which physical landscape elements draw attention; text reveals how visitors feel and what they value. Coupling them permits an explicit element-to-service attribution that neither modality supports alone.
Within this literature, urban forest parks merit dedicated attention. Compared with general urban parks or natural forests, forest parks in high-density cities combine relatively intact vegetation with intensive public use, so their CES emerge from the interplay of ecological structure and constructed facilities [12,39]. Social media studies have begun to characterize forest-park CES and visitor sentiment at national or city scales [38,40,41] and to contrast user groups [13], and forest-landscape studies have highlighted recreational and aesthetic values and their trade-offs with other services [42,43]. Parallel work in urban parks has mapped seasonal dynamics and supply-demand patterns of CES [44,45] and has applied pretrained vision models to park imagery in Guangzhou itself [46]. Few studies, however, have systematically compared parks of different administrative levels within one metropolitan area, where level-specific resource endowments and functional mandates are likely to yield distinct CES profiles. None, to our knowledge, has asked whether the relationship between a landscape element and a service is itself contingent on that administrative position.
Three gaps motivate this study. First, although CES have been linked to landscape characteristics, data and method constraints have confined most work to small scales, single elements or single service types, so it remains unclear whether a given element supports services uniformly or trades one against another [38,47]. Second, systematic quantification and horizontal comparison of CES across forest parks of different administrative levels and functions are scarce, leaving the moderating role of institutional position untested [48]. Third, integrated image-text frameworks for forest-park CES remain uncommon, notwithstanding the rapid growth of single-modality LLMs and computer-vision applications [31,32,49].
Addressing these gaps, this study examines 15 forest parks of different administrative levels in Guangzhou and constructs an integrated image-text CES and landscape-element framework. Our objectives are to (1) determine the direction and strength of individual landscape elements’ associations with each CES and, in particular, whether the same element can support one service while depressing another; (2) establish whether these element-to-service associations are stable across parks at all, or whether an element such as a lake is associated with the same service wherever it occurs; (3) if they are not stable, examine administrative level as one candidate grouping among several, recognizing that in the Chinese system this designation is awarded on the basis of landscape resource quality and therefore bundles rather than isolates a set of correlated park attributes (Section 2.1); and (4) characterize the composition, temporal evolution, and level-based differentiation of perceived CES that provide the context for those associations. We then derive differentiated landscape-optimization and management implications. The contribution is not the use of an LLM or an image classifier as such, but rather the element-level attribution that these permit, and the observation that the attribution is not constant across parks. We do not test a formal hypothesis of a tier effect: with four case parks, the design cannot separate administrative level from the park characteristics that level designation reflects, and we treat the four parks as illustrative exemplars rather than as representative samples of their tiers.

2. Materials and Methods

2.1. Study Area

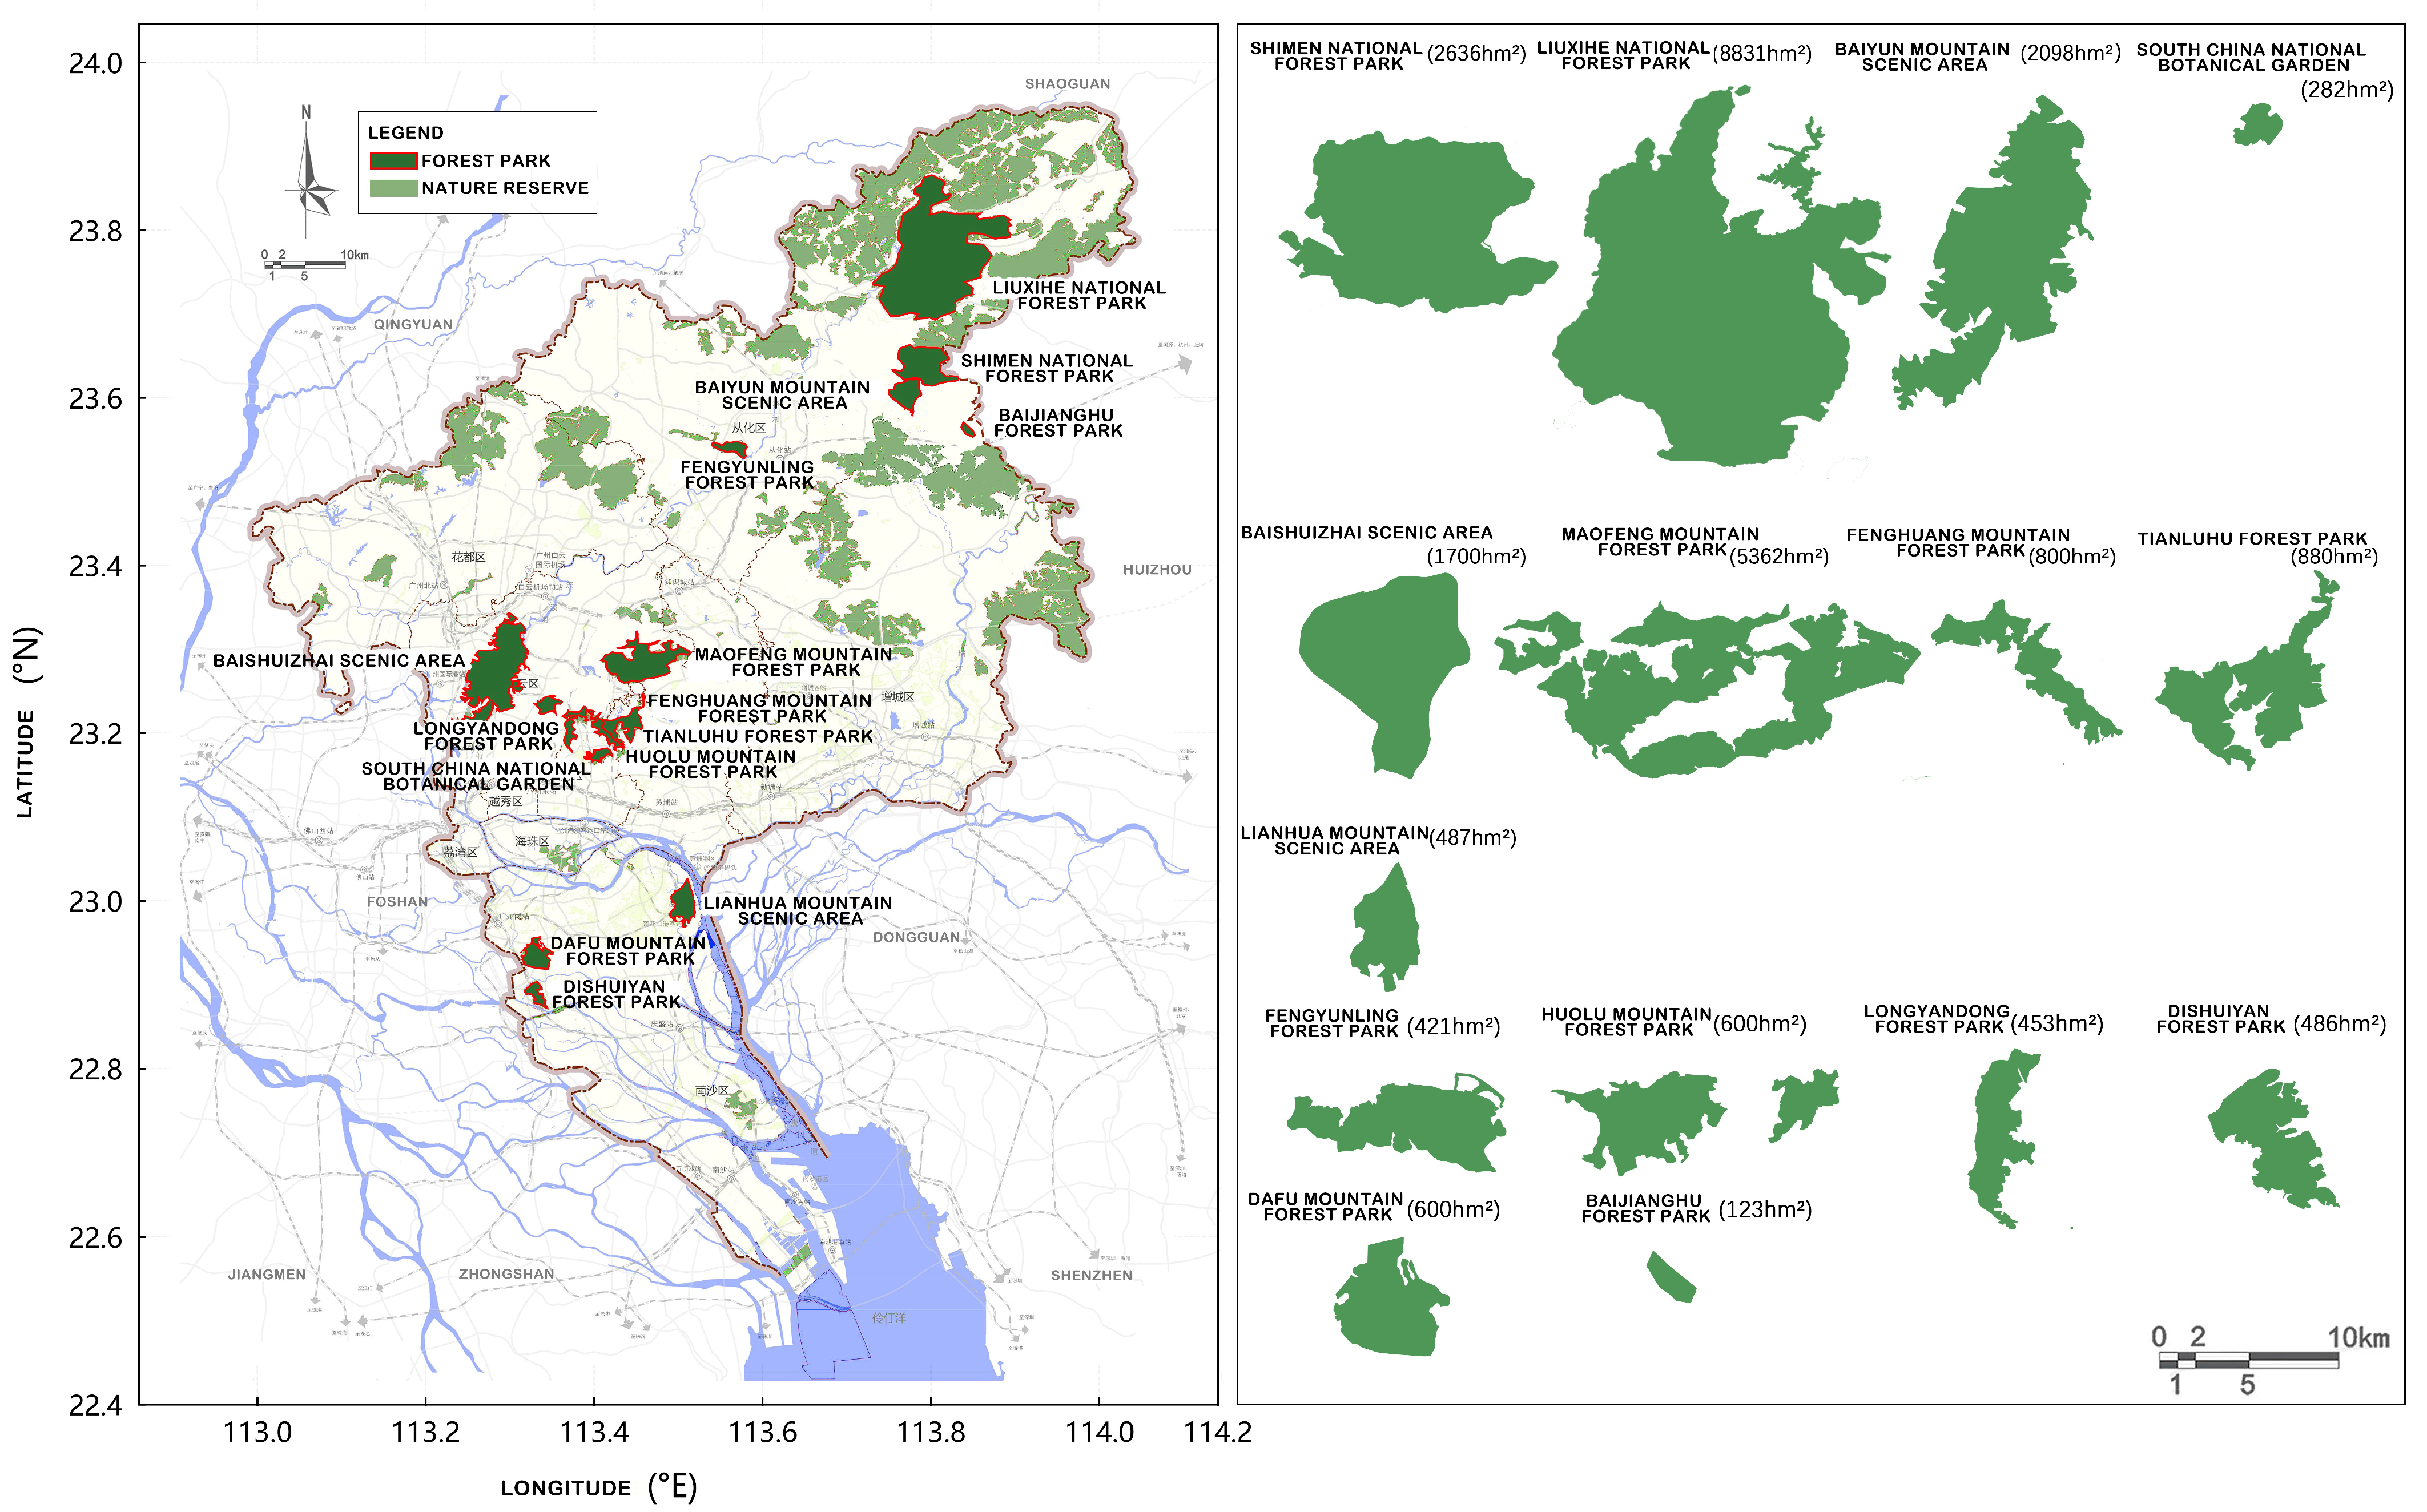
Guangzhou, in the south subtropical monsoon zone, combines a “mountain-water-city-field-sea” spatial pattern with deep Lingnan cultural heritage, giving its forest parks high environmental heterogeneity and landscape diversity. Its forest parks are organized in a three-tier system (national, provincial, and municipal) whose levels differ in scale, resource endowment, management intensity, and service radius, making the city well suited to a within-metropolis comparison across levels [50]. Based on the forest-park lists in the Guangzhou Park Construction and Protection Plan (2017–2035) and the Green and Beautiful Guangzhou Five-Year Action Plan (2023–2027), and considering data availability, ecological representativeness and spatial adjacency, 15 representative forest parks across the three levels were selected (Table 1, Figure 1). The South China National Botanical Garden was grouped at the national level because it adjoins Huolu Mountain to form a continuous forest space; Baiyun Mountain, Baishuizhai, and Lianhua Mountain were included because their core functions in the protected-area system are highly consistent with forest parks (Baiyun Mountain—national; Baishuizhai and Lianhua Mountain—provincial). Together, the sample spans large peri-urban national parks, mid-sized provincial parks, and small, city-embedded municipal parks, covering the principal types of forest recreation space in the metropolitan area.
Because the tier structure is central to the comparison and is unfamiliar outside China, its basis is worth stating. Forest parks are established through a statutory application and approval procedure, and the national standard for evaluating forest park scenic resources (GB/T 18005-1999) [51] requires a defined boundary, with forest landscape as the core asset, and resources capable of supporting public recreation, fitness, research, and education. The forestry administration assigns the tier on the basis of landscape resource quality: national parks must have “particularly beautiful” forest landscape, are typically dominated by natural primary and secondary forest, and hold nationally recognized natural or cultural resources; provincial parks must have “beautiful” forest landscape of provincial representativeness and are mostly secondary forest and plantation; municipal parks need only forest landscape of local distinctiveness and are predominantly plantation. Because the designation is itself awarded on resource quality, tier is correlated by construction with forest origin and maturity, area, distance from the urban core, catchment population, and management resourcing. Administrative level should therefore be read in this paper as an umbrella attribute standing for that bundle, not as an institutional variable whose effect has been isolated from the landscape endowment it reflects. This matters for transferability: what may carry to other tiered systems is the finding that element-to-service associations vary with a park’s position in such a bundle, not the particular Guangzhou coefficients.

2.2. Data Collection and Preprocessing

A web crawler built in Python 3.12.7 with the Requests and BeautifulSoup libraries collected social media data on the 15 parks from Ctrip, Weibo, and Dianping between January 2020 and December 2024 by searching park-name keywords, yielding 27,683 records. Each record contained the username, posting time, review text, photographic image, star rating, gender, and IP, stored in structured form with Pandas. The three platforms were chosen to balance complementary user groups: Ctrip captures travel-oriented visitors who often write detailed trip reviews, Weibo captures a broad social media public posting spontaneous impressions, and Dianping captures local residents documenting routine use. This combination broadens demographic and behavioral coverage and mitigates the bias of any single source. Data cleaning removed news, advertisements, and other content posted by institutional or non-individual accounts, deleted entries unrelated to the target parks, and de-duplicated repeated posts; records lacking usable text or images were excluded from the corresponding analysis. After cleaning, 20,447 text records and 18,997 image records were retained, providing a large, multi-year and multimodal basis for the CES and landscape analyses. The two corpora are not independent samples: both are drawn from the same body of posts, 20,447 of which contributed usable text and 18,997 a usable photograph, and the shortfall in the image corpus arises almost entirely from two parks, the South China National Botanical Garden and Dafu Mountain, where a large share of reviews carried no usable photograph. Section 3 states which of these samples underlies each reported result.

2.3. Assessment Framework and Indicators

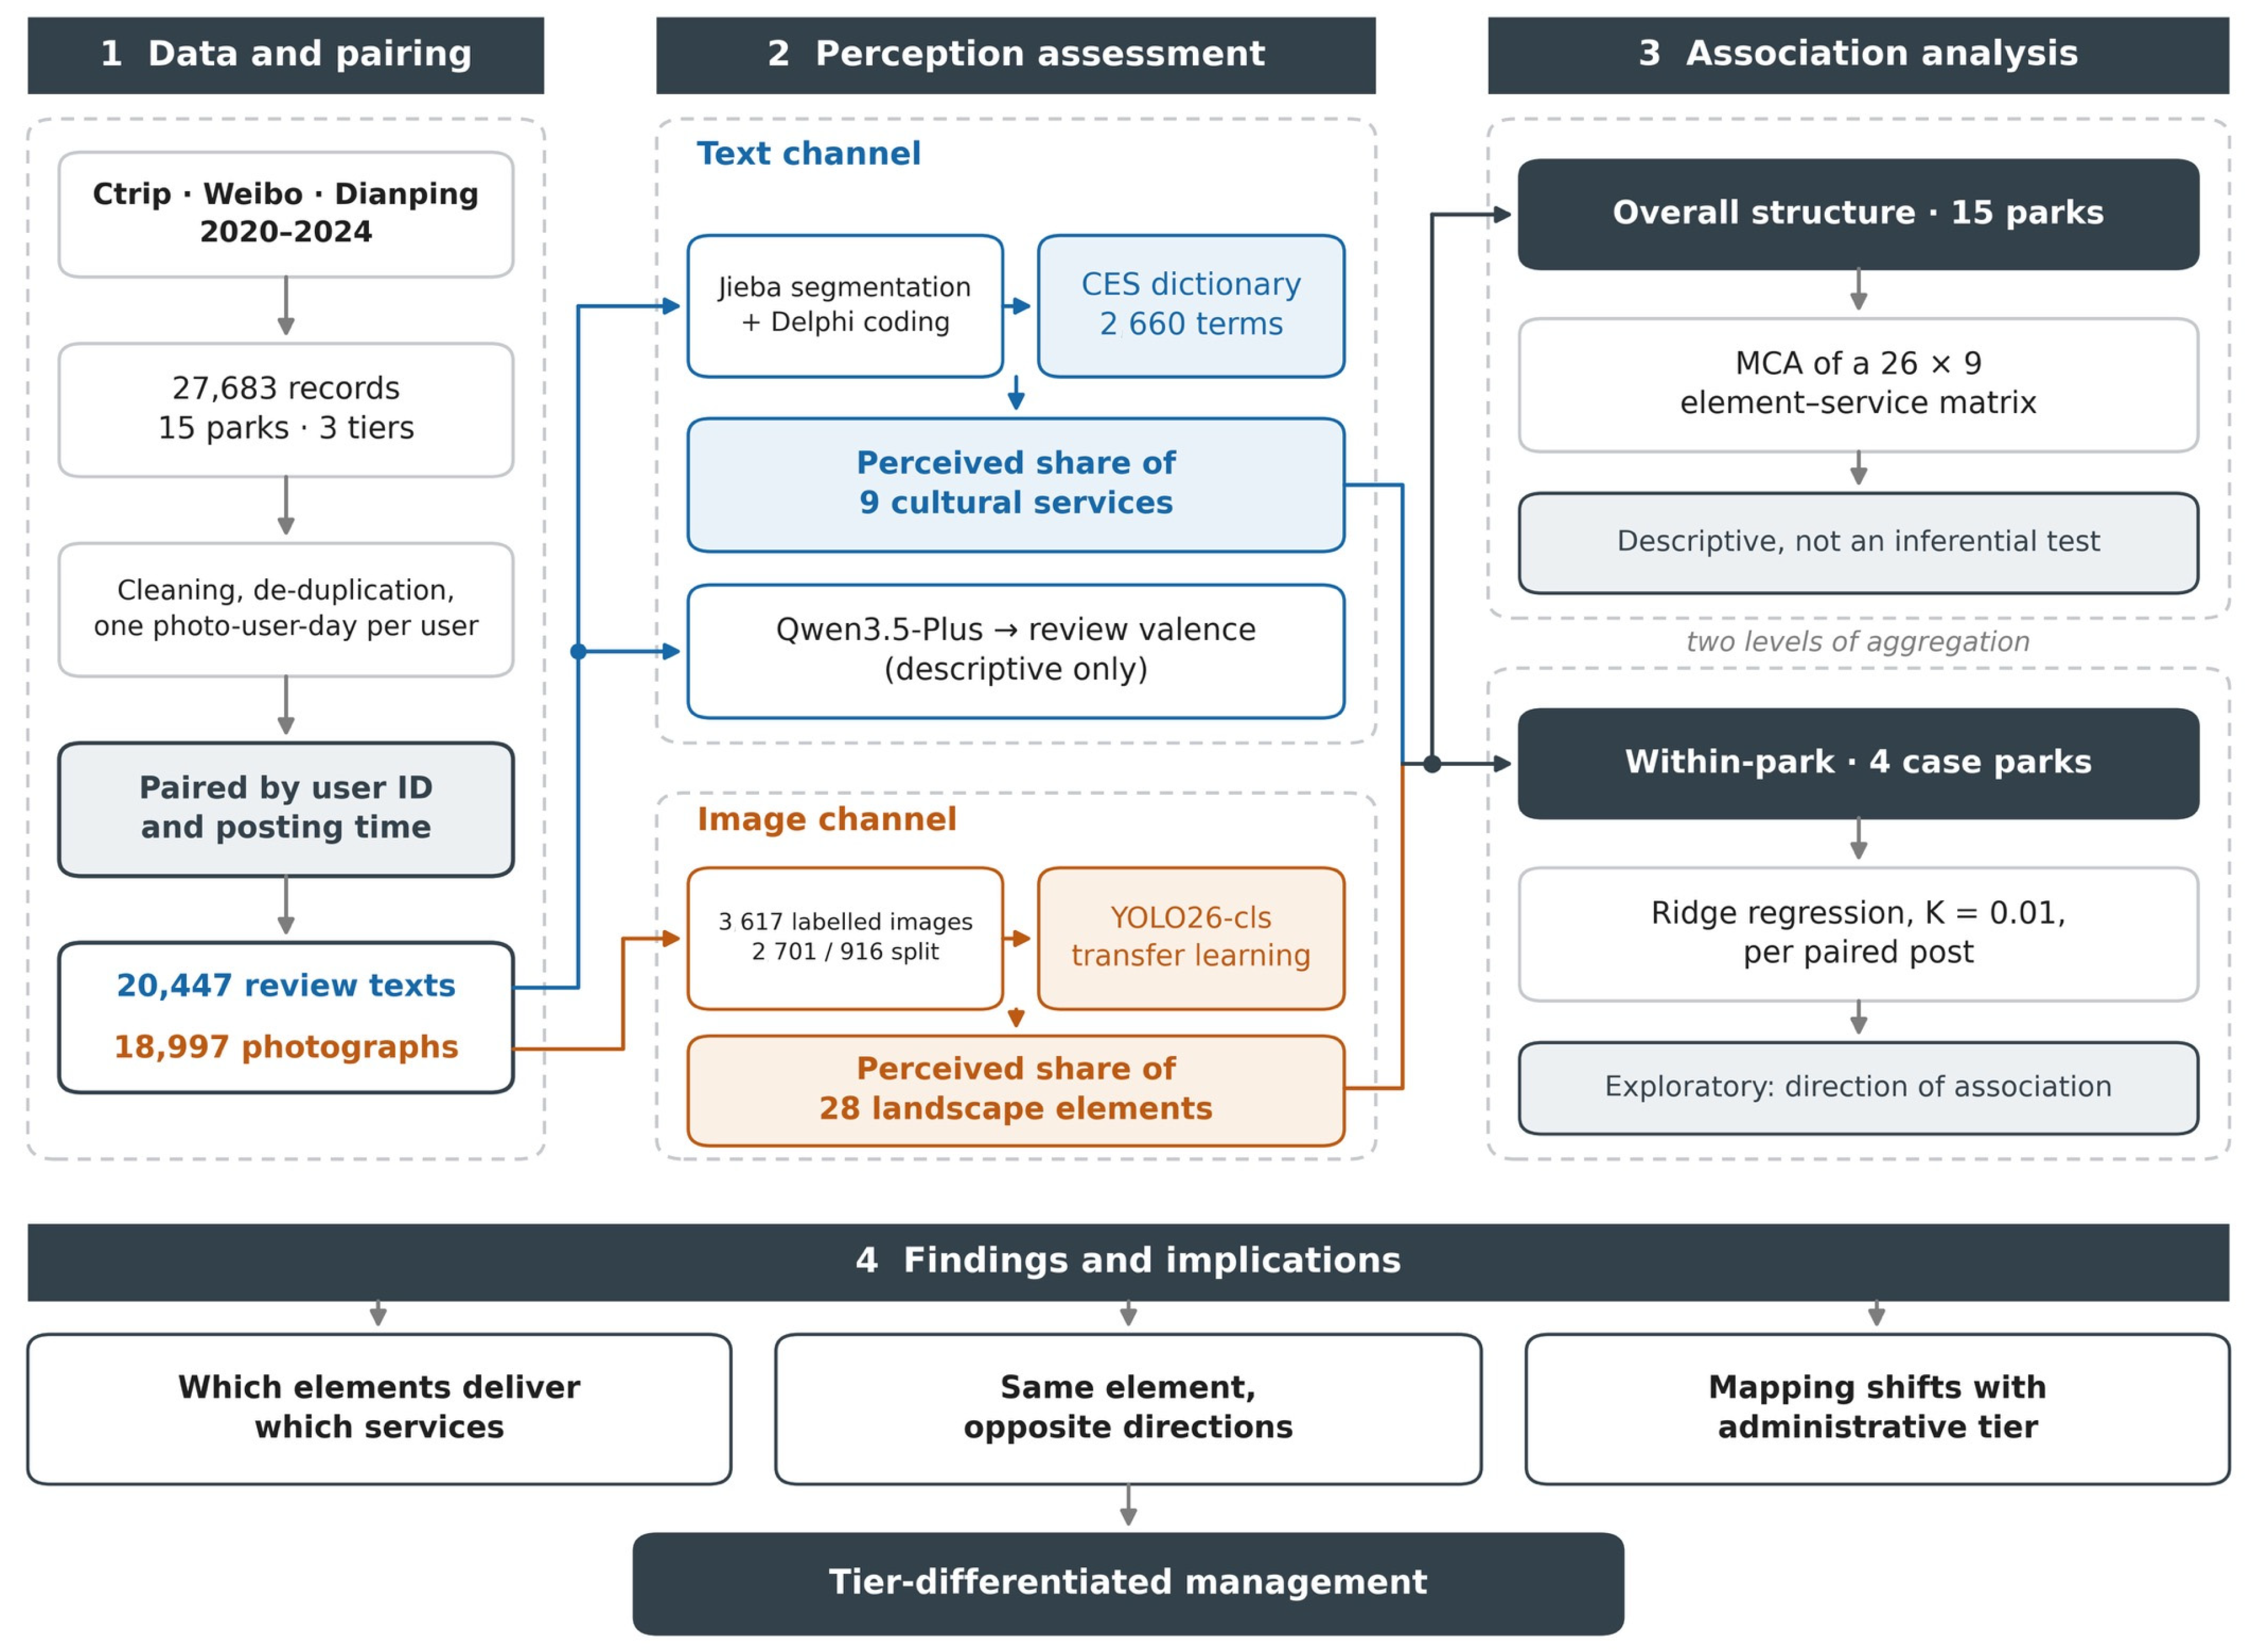
The framework proceeds in four stages (Figure 2). In the first, records are cleaned, and the two modalities are paired: each photograph is matched to its review text by user identifier and posting time, so that what a visitor wrote and what that visitor photographed refer to the same encounter. Pairing governs the association analyses of stage 3, which use only posts contributing both a usable text and a usable photograph; the descriptive profiles of stage 2 are computed on each channel’s full cleaned corpus. In the second stage, the two channels are analyzed in parallel. From the texts, a domain dictionary yields the perceived share of each of nine cultural services, and a large language model yields the valence of each review; from the photographs, a fine-tuned deep learning classifier yields the perceived share of each of 28 landscape elements. In the third stage, the two sets of results are related to one another at two levels of aggregation: multiple correspondence analysis describes the overall element-service structure across all 15 parks, while ridge regression tests associations within individual case parks at the level of the paired post. The fourth stage draws the management implications. Distinguishing the two levels of aggregation matters for interpretation, and the two analyses are reported accordingly in Section 3.4 and Section 4.
Nine CES indicators were determined from a literature review and field interviews adapted to Guangzhou’s regional characteristics (Table 2): aesthetic appreciation; social interaction and relationships; environment and biodiversity; scientific research and nature education; cultural diversity and heritage; recreation and ecotourism; forest health and wellness; inspiration; and sense of place and spiritual attachment. These nine categories synthesize widely used CES classifications while reflecting the recreational, aesthetic, and cultural functions most salient in subtropical urban forest parks. Their correspondence with the cultural section of CICES V5.1 [52] is as follows: recreation and ecotourism and forest health and wellness fall under classes 3.1.1.1 and 3.1.1.2 (physical and experiential interactions, active and passive respectively); aesthetic appreciation under 3.1.2.4; scientific research and nature education under 3.1.2.1 and 3.1.2.2; cultural diversity and heritage under 3.1.2.3; environment and biodiversity under 3.2.2.1 (existence value); inspiration under 3.2.1.1 (symbolic meaning); and sense of place and spiritual attachment under 3.2.1.1 and 3.2.1.2. Social interaction and relationships have no separate class in CICES V5.1 and are treated here within 3.1.1.1, reflecting the known difficulty that CICES has in representing the relational dimension of cultural services [2]. The correspondence is one of scope rather than exact equivalence: our categories are defined to be recoverable from short review text, which requires vocabulary-level distinctions that CICES does not draw.

2.4. CES Perception and Sentiment Assessment

CES perception was quantified with a dictionary method. Jieba performed word segmentation; building on literature-based grouping and the Delphi expert method [53], a five-member team from architecture, landscape architecture, and ecological-environment fields coded high-frequency words and designed a dictionary-matching table, re-coding ambiguous items until consensus. Words with frequency greater than 10 were retained and expanded with a Word2vec model and manual addition, producing a Guangzhou forest-park CES dictionary of 2660 words across the nine CES types.
Text was matched to the dictionary to identify CES terms. The perceived share of CES i within an analytical unit u was computed as the proportion of all CES-term occurrences in that unit attributable to service i :
S i , u = N i , u j = 1 9 N j , u
where N i , u is the number of occurrences of dictionary terms belonging to service i within unit u , and the denominator is the total number of CES-term occurrences across all nine services in the same unit. The unit is the whole corpus for the overall composition, an individual park where parks are compared, and a park-year the temporal analysis. A single review may contain terms for several services, so N counts term occurrences rather than reviews. Expressing perception as a share of total CES mentions makes parks of different popularity comparable and supports both cross-park and temporal comparison.
Sentiment was analyzed with Alibaba Cloud Tongyi Qianwen (Qwen3.5-Plus; Alibaba Cloud, Hangzhou, China), accessed through an OpenAI-compatible interface [54], returning emotional valence (positive/neutral/negative) and an arousal score. The prompt combined four modules: role-play as a landscape-architecture domain expert, a task description, few-shot examples, and a fixed output framework. This was intended to stabilize the model’s output and reduce ambiguity. The full prompt is provided in Supplementary Text S1.
To assess reliability, 200 reviews were randomly sampled and independently labelled by five landscape-architecture experts; expert consensus was determined by majority vote. Model output agreed with expert consensus on 73.5% of this sample. Inspection of the disagreements showed the characteristic failure mode to be mixed-valence reviews in which a positive scenic comment is followed by a specific complaint, where the model tended to follow the leading clause. Because the corpus is dominated by positive expression, and because a three-class judgement of short user-generated text is intrinsically noisy, we use the sentiment output only to describe aggregate tendency across parks and do not interpret individual review classifications or draw inferences from small between-park differences. Sentiment is accordingly an auxiliary descriptive layer in this design. It is not used to weight CES term occurrences, and it does not enter the association analyses of Section 3.4. The reason is structural as well as precautionary: valence is assigned to a whole review, whereas CES perception is measured from term occurrences within that review, so a review containing terms for four services carries one valence that cannot be apportioned among them without imposing an untested weighting rule. Integrating sentiment functionally would require a review-level model of which service the expressed affect refers to, which the present data do not support.

2.5. Landscape Feature Identification

Twenty-eight landscape-element categories were established by combining field surveys, visitor interviews, image interpretation, and the literature. They span vegetation, landform, water bodies, built facilities, and human activities (16 natural, 10 built, and 2 activity types). Finer categories were consolidated into a consistent indicator set, so that trees and shrubs were grouped as tree-shrub mixed forest and road signs and guide boards as signage, while regionally distinctive elements such as seasonal forest and flowers were retained separately to capture subtropical phenological change. A Guangzhou forest-park landscape-feature dataset of 3617 expert-labelled images was then built and split into 2701 training and 916 validation images, and the YOLO26 image-classification pretrained model (yolo26x-cls.pt) [55], a member of the YOLO family first introduced for real-time detection by Redmon et al. [56], was fine-tuned on it by transfer learning.
Several measures were used to stabilize training and limit overfitting. A grouped optimization strategy divided the model’s parameters into separate groups optimized independently, with the initial learning rate (lr0) set to 0.001. A cosine-annealing scheduler (cos_lr) dynamically adjusted the learning rate so that the rate of each parameter group decayed gradually as iterations progressed, producing smoother convergence than a fixed rate. Dropout regularization with a strength of 0.2 randomly deactivated a fraction of units during training so that the model does not over-rely on particular features. An early-stopping criterion with a patience of 50 epochs halted training when validation performance showed no appreciable improvement over 50 consecutive epochs. Data augmentation (random flipping, rotation, and scaling) was applied during training to improve robustness and generalization.
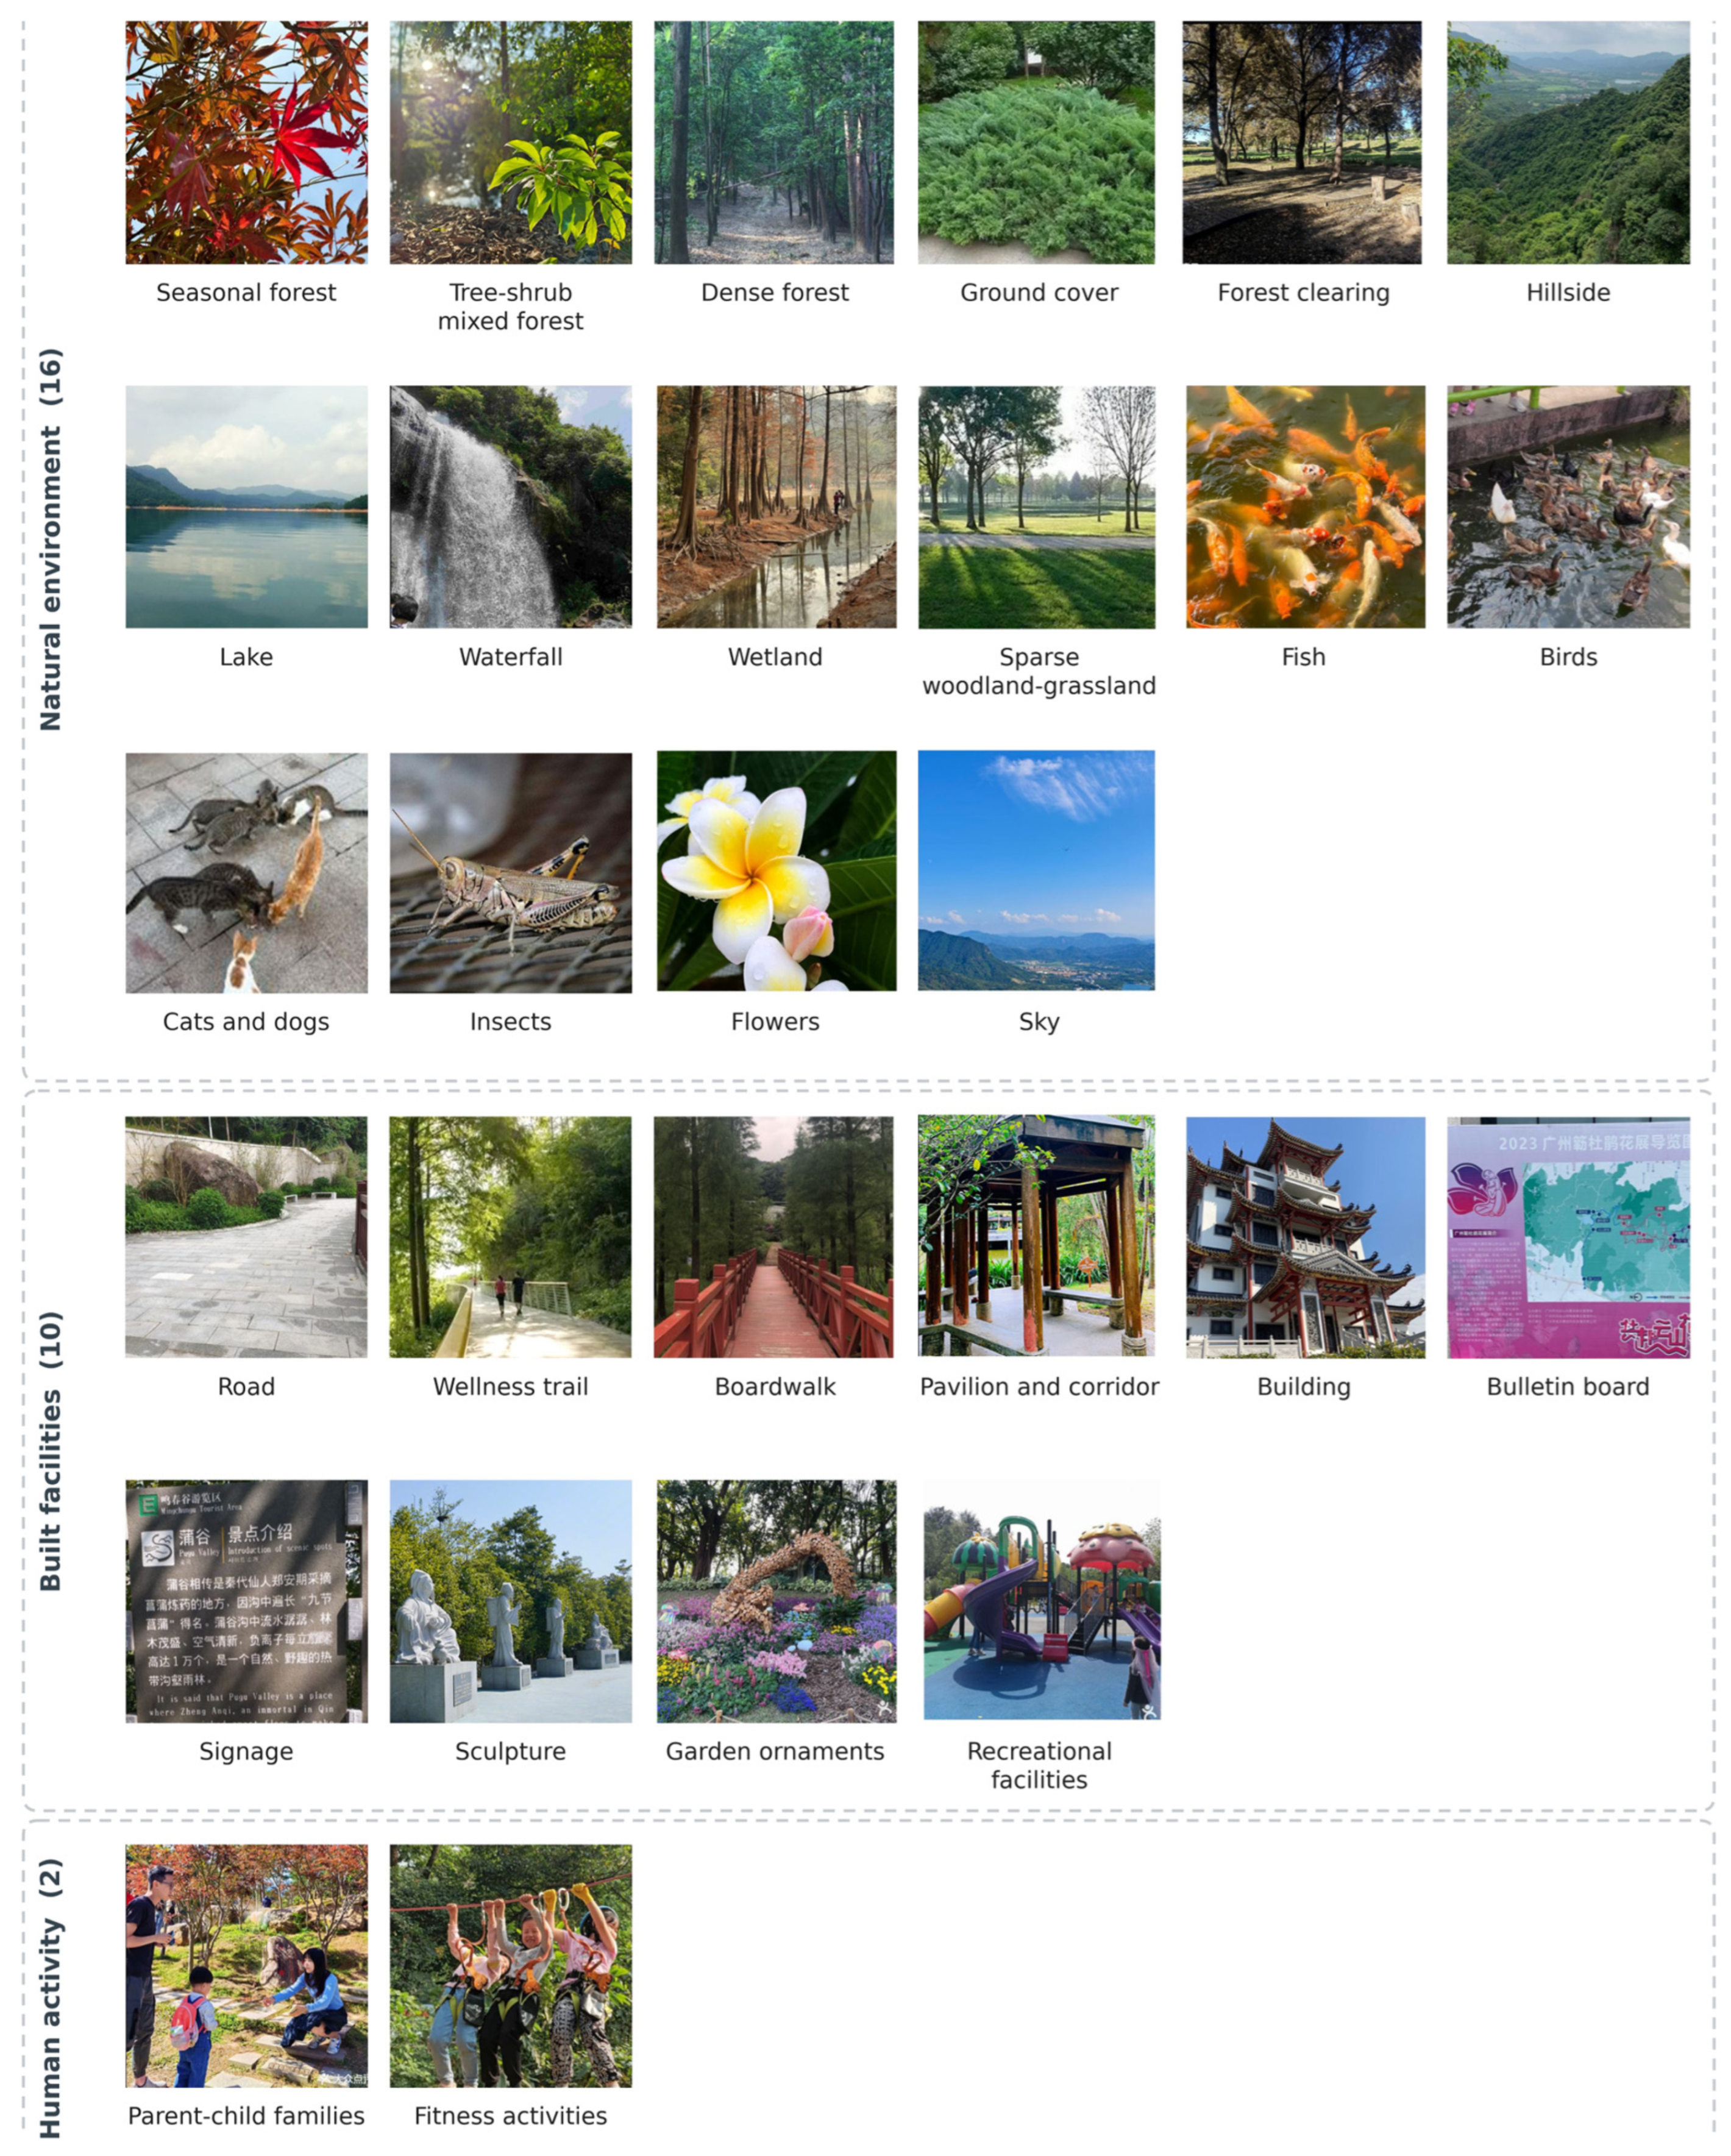
The final model reached 91.57% validation accuracy and 98.96% top-five accuracy. To check that automatic recognition matched human judgement, five landscape-architecture researchers independently annotated a held-out test set of 1251 images, and the model outputs were compared against these labels through a confusion matrix. Classification was reliable for the major element categories, which dominate the corpus; performance was weaker for categories that are visually ambiguous at distance, or that occupy few pixels in a typical photograph, and the consequences of this are considered in Section 4.3. The trained model was then applied to all retained images to identify the 28 elements and compute their weighted, confidence-thresholded, and normalized perceived share (Pi); exemplar images for all 28 classes are shown in Figure 3. The resulting values are reported in Section 3.3. Classification is multi-label rather than single-label: for each photograph, the model returns its five highest-scoring element classes with their confidences, and each photograph therefore contributes to as many as five element categories, weighted by confidence and subject to the confidence threshold. One photograph is thus not attributed to one feature. Of the 18,997 photographs, 18,916 (99.6%) yielded at least one element above the threshold.

2.6. Association Analysis

The two modalities were linked during preprocessing. Records lacking either a usable review text or a usable photograph were removed, and photographs were reduced to one photo-user-day (PUD), that is, one photograph per unique combination of user and date, drawn at random from that user’s photographs for the day, so that highly active users are not over-represented; each retained photograph was named by user identifier and posting time so that image and text from the same post could be matched one to one. Manual inspection of 50 randomly drawn records per park gave a cleaning pass rate of 95.80%.
Two complementary association analyses were then run at different levels of aggregation, and the distinction matters for interpretation. The multiple correspondence analysis (MCA) describes the overall structure of element-service co-occurrence at the level of the element, using all 15 parks. The ridge regressions test element-to-service associations at the level of the individual post, within single parks.
Overall structure (MCA). For each landscape element and each CES, the aggregate perception score was dichotomized at a threshold of 0.1 (1 if the element’s perceived share for that service reached the threshold, 0 otherwise). Chi-square tests were applied to each element-service pair and elements showing no association across services were dropped, leaving a 26 × 9 binary matrix with landscape elements as rows and cultural services as columns. MCA was applied to this matrix in Python (prince), and the number of retained dimensions was determined by the eigenvalue criterion [57]. Because the matrix has 26 rows, the MCA is a descriptive summary of how elements and services are positioned relative to one another in a reduced space, not an inferential test, and it is reported and interpreted as such. The dimension scores are the complete output of this step and are reported in Section 3.4.
Within-park associations (ridge regression). Preliminary ordinary least squares fits showed inflated coefficient variances arising from multicollinearity among the landscape-element predictors, and stepwise selection was rejected because it would have discarded elements considered substantively relevant. Ridge regression (K = 0.01) was therefore used [58], retaining all predictors while shrinking coefficient variance. Models were fitted separately for four case parks spanning the tiers: Shimen (national), Baishuizhai and Maofeng Mountain (provincial), and Dafu Mountain (municipal). The 28 landscape elements were entered as predictors, and each of the nine CES in turn as the response. Each observation is one paired post.

3. Results

Section 3.1, Section 3.2 and Section 3.3 describe each channel on its entire cleaned corpus: the CES profiles on all 20,447 text records and the landscape-element profiles on all 18,997 image records. Section 3.4 uses only paired posts. The three descriptive sections should therefore be read as background on what each channel contains, not as a description of the sample entering the regressions. Because both corpora are drawn from the same posts, the two are closely related rather than structurally divergent, but they are not identical, and the composition of the image corpus is weighted away from the two parks noted in Section 2.2.

3.1. Composition and Temporal Change of Perceived CES

Across the 20,447 text records, the dictionary matched the great majority of culturally relevant expressions. Recreation and ecotourism value clearly dominated (38.81%), followed by aesthetic appreciation (23.93%); together, these two visible, experiential services accounted for nearly two-thirds of all perceived CES, consistent with forest parks functioning primarily as destinations for outdoor leisure and scenery. Sense of place and spiritual attachment (9.08%), forest health and wellness (8.00%), and environment and biodiversity (7.03%) formed an intermediate tier reflecting more reflective and restorative engagement, while social interaction (6.57%), cultural diversity and heritage (3.49%), scientific research and nature education (1.83%), and inspiration (1.26%) were weakly perceived (Table 3). The marked under-representation of educational, heritage, and inspirational services suggests that the deeper knowledge- and meaning-oriented benefits of forest parks are not yet salient to most visitors.
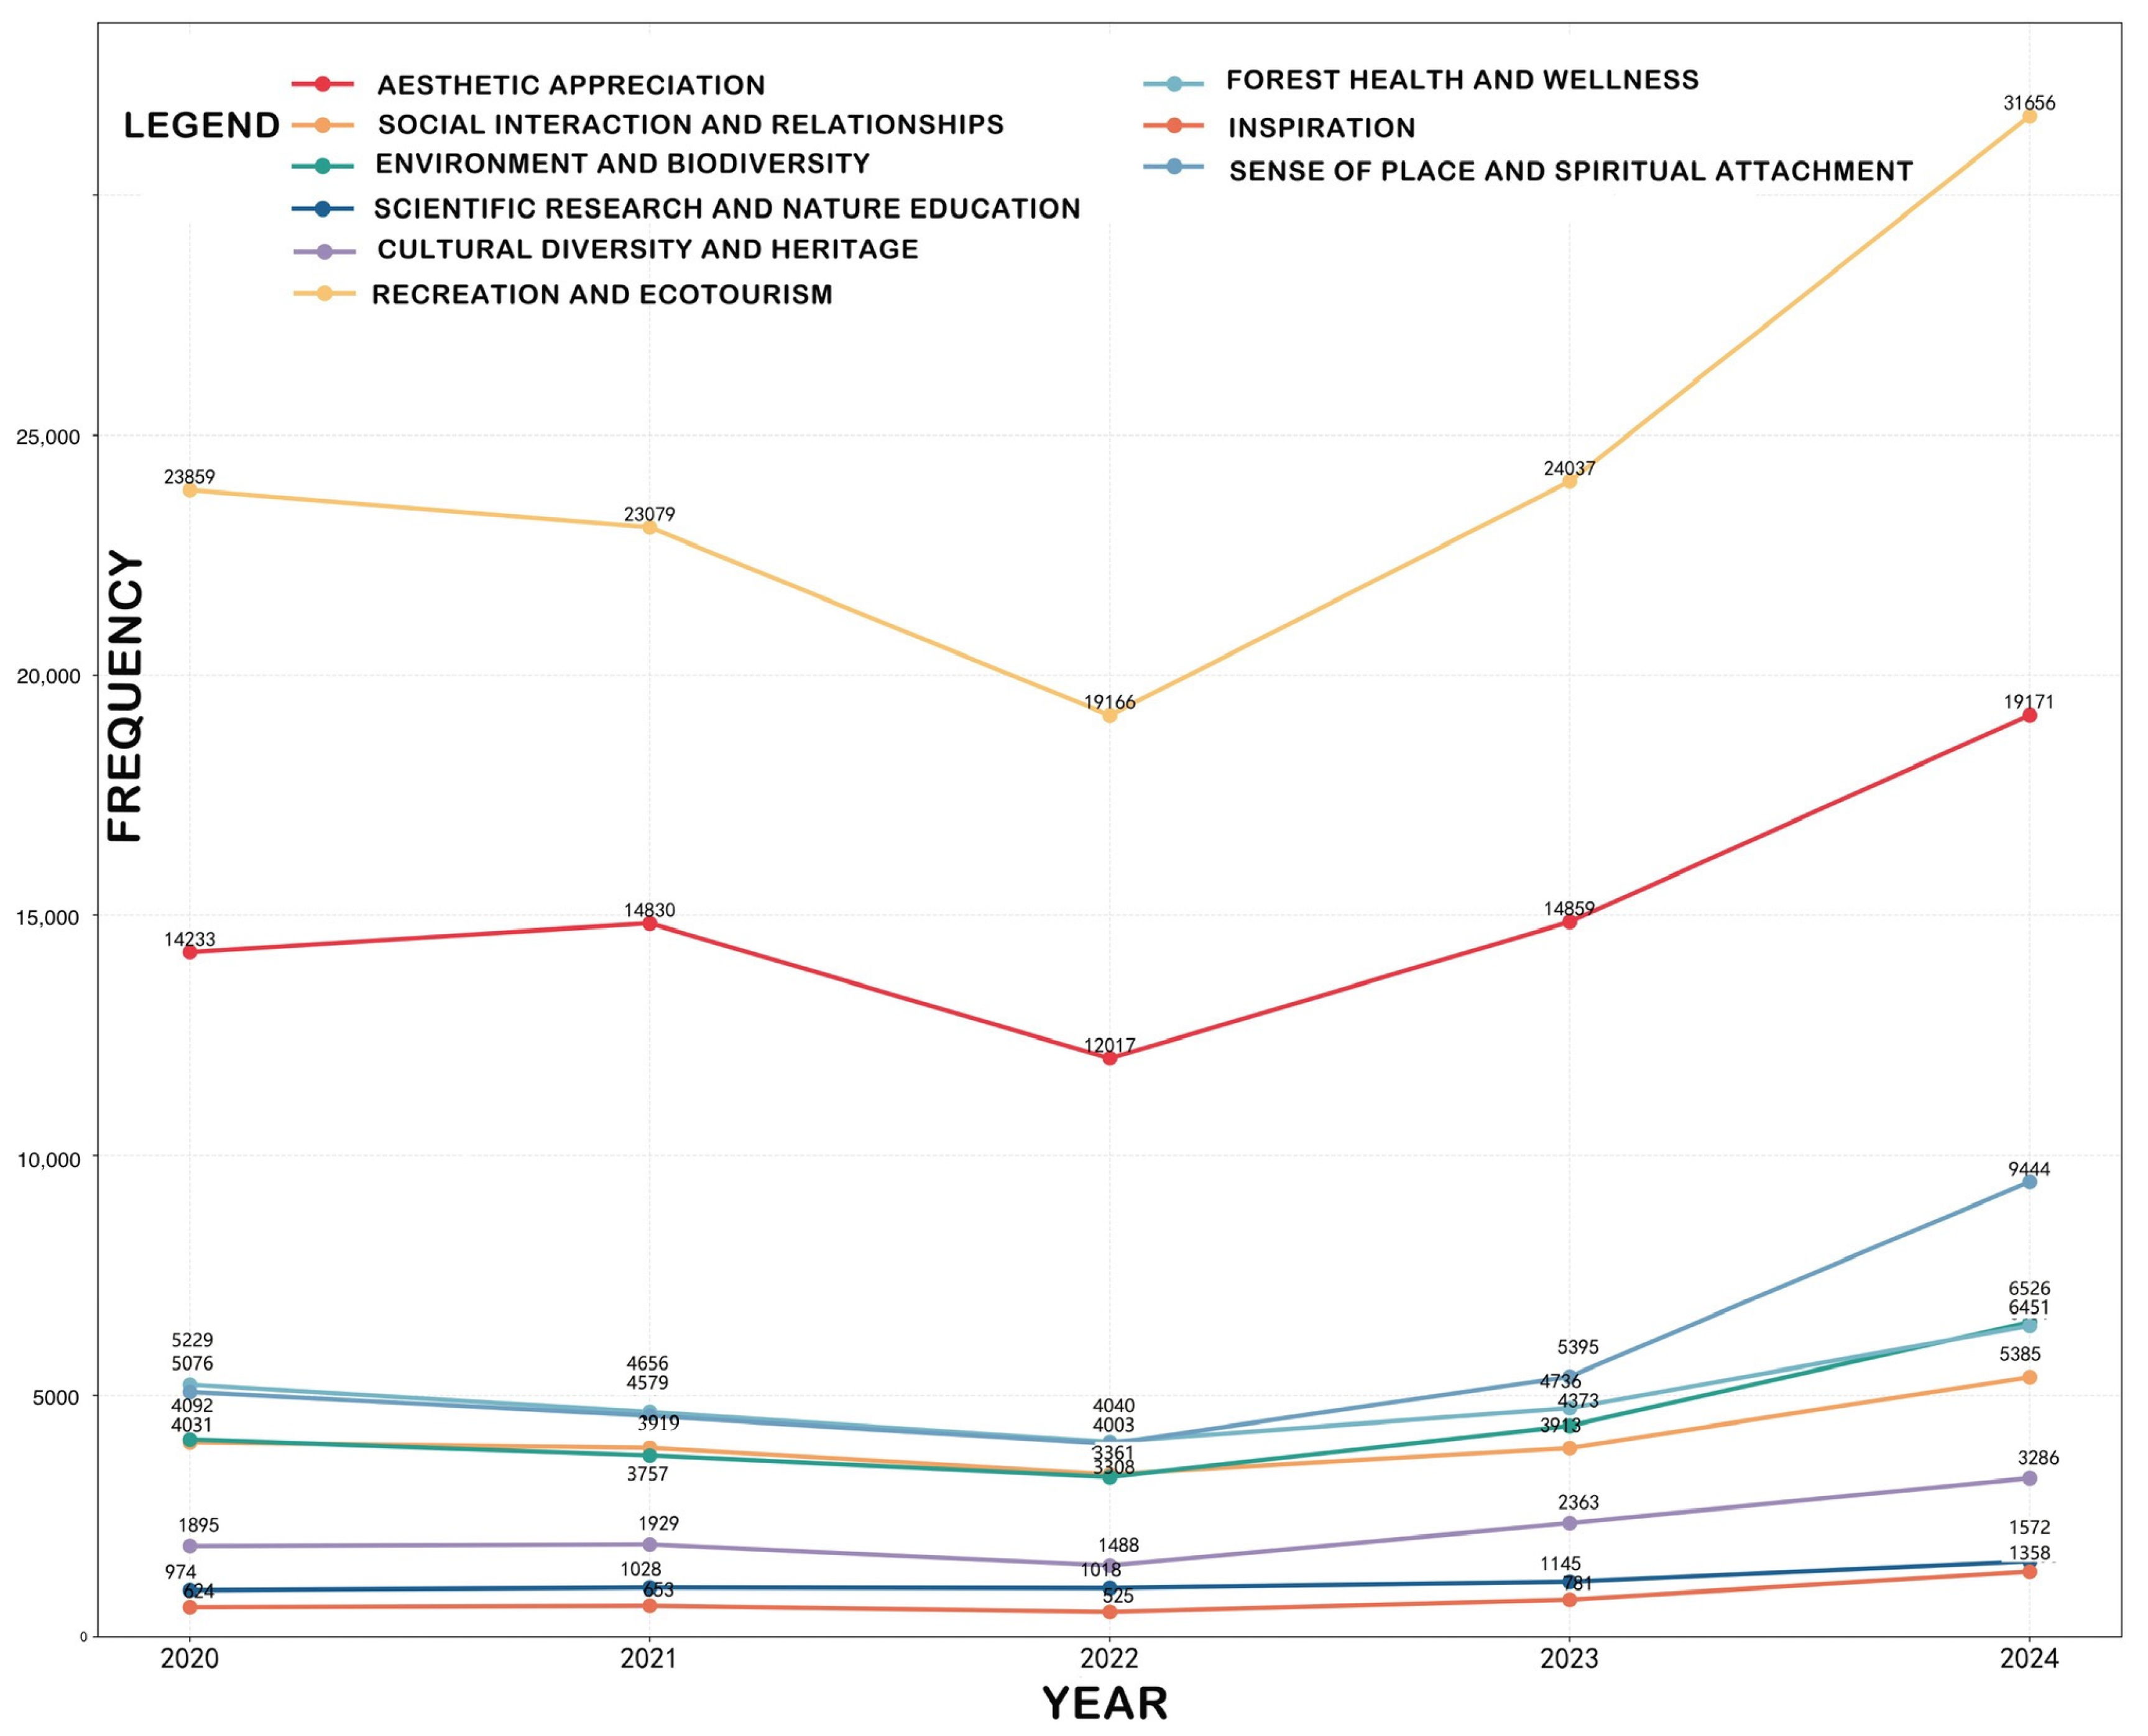
Over 2020–2024, total perceived frequency rose with fluctuation, a cumulative increase of 41.38% (Figure 4); a 2022 dip coincided with reduced visitation during the COVID-19 pandemic, followed by recovery. Growth rates differed by service. Recreation kept growing in absolute frequency, but its share fell from 39.76% to 37.31%, indicating that its relative dominance was diluted as other values rose. Sense of place and spiritual attachment increased most strongly, from 5076 to 9444 term occurrences (+86.05%), reaching 11.13% by 2024; inspiration grew by 117.63%, and environment and biodiversity rose from 6.82% to 7.69%. Aesthetic appreciation remained the stable second value (around 23–25%). Taken together, these compositional shifts are consistent with demand deepening from sightseeing recreation toward emotional connection, ecological education, and spiritual experience. They are not evidence of it. Five years is a short window over which to observe a change in what people value, but a long one over which platform populations, posting conventions, and the affordances of the platforms themselves all changed substantially, and the window contains a pandemic disruption that altered both visitation and what visitors wrote about. A rising share of attachment and education vocabulary may therefore reflect a change in who posts and how they write as much as a change in what visitors value. We report the trend because it is worth observing and could anchor longer time series; we interpret it no further.
CES composition differed markedly across the three administrative levels. National parks displayed the most diverse and resource-distinct profiles: the South China National Botanical Garden was strongest in scientific research and nature education; Shimen led in aesthetic value (37.40%), driven by its forests and seasonal flower seas; Liuxihe stood out in environment and biodiversity value (18.19%) owing to its extensive forest and water systems; and the city-central Baiyun Mountain was high in recreation (33.32%) and sense of place. Even so, deeper cultural-heritage and inspiration values were generally weak across national parks. Provincial parks were dominated by recreation and ecotourism value (averaging 41.71%, the highest of the three levels) and showed relatively high sense of place (averaging 11.79%), reflecting smaller service radii and close community ties, but their scientific education and inspiration values averaged below 1.5%. Municipal parks were the most heterogeneous, forming recreation/social-dominant (Huolu, Dafu), culture-dominant (Longyandong), and environment-dominant (Dishuiyan) modes; social interaction value was especially prominent (Dafu reaching 37.71%), consistent with their role as neighborhood gathering spaces, yet scientific education value remained generally below 2%. This tiered pattern indicates that level positioning, resource endowment, and service radius jointly shape which services the public perceives.

3.2. Public Sentiment

Expressed sentiment was predominantly positive across the sample as a whole (Table 4), reported here as an auxiliary descriptive layer that is not carried into the element-to-service analysis of Section 3.4, which is consistent with the well-documented tendency of voluntary review platforms to over-represent satisfied visitors. Following Section 2.4, we read these shares as an aggregate description rather than as a measurement of visitor affect, and we base the discussion below on the vocabulary associated with each valence rather than on the proportions themselves.
The vocabulary is more informative than the counts. Positively valenced reviews concentrated on the landscape base (pleasant scenery, fresh air, lush greenery) and on leisure functions such as boating, greenway walking, and hiking. Negatively valenced reviews pointed almost entirely at facilities and management: narrow paths, absent lighting, poor service, crowding. Scenery and vegetation appear scarcely at all in the negative vocabulary. The distinction between the two lexicons is stable across parks even where the proportions are not, and it separates what the landscape supplies from what management supplies. Two parks stood out for elevated negative expression, Longyandong and Liuxihe, in both cases on facility and accessibility vocabulary rather than on landscape quality.

3.3. Landscape Feature Perception

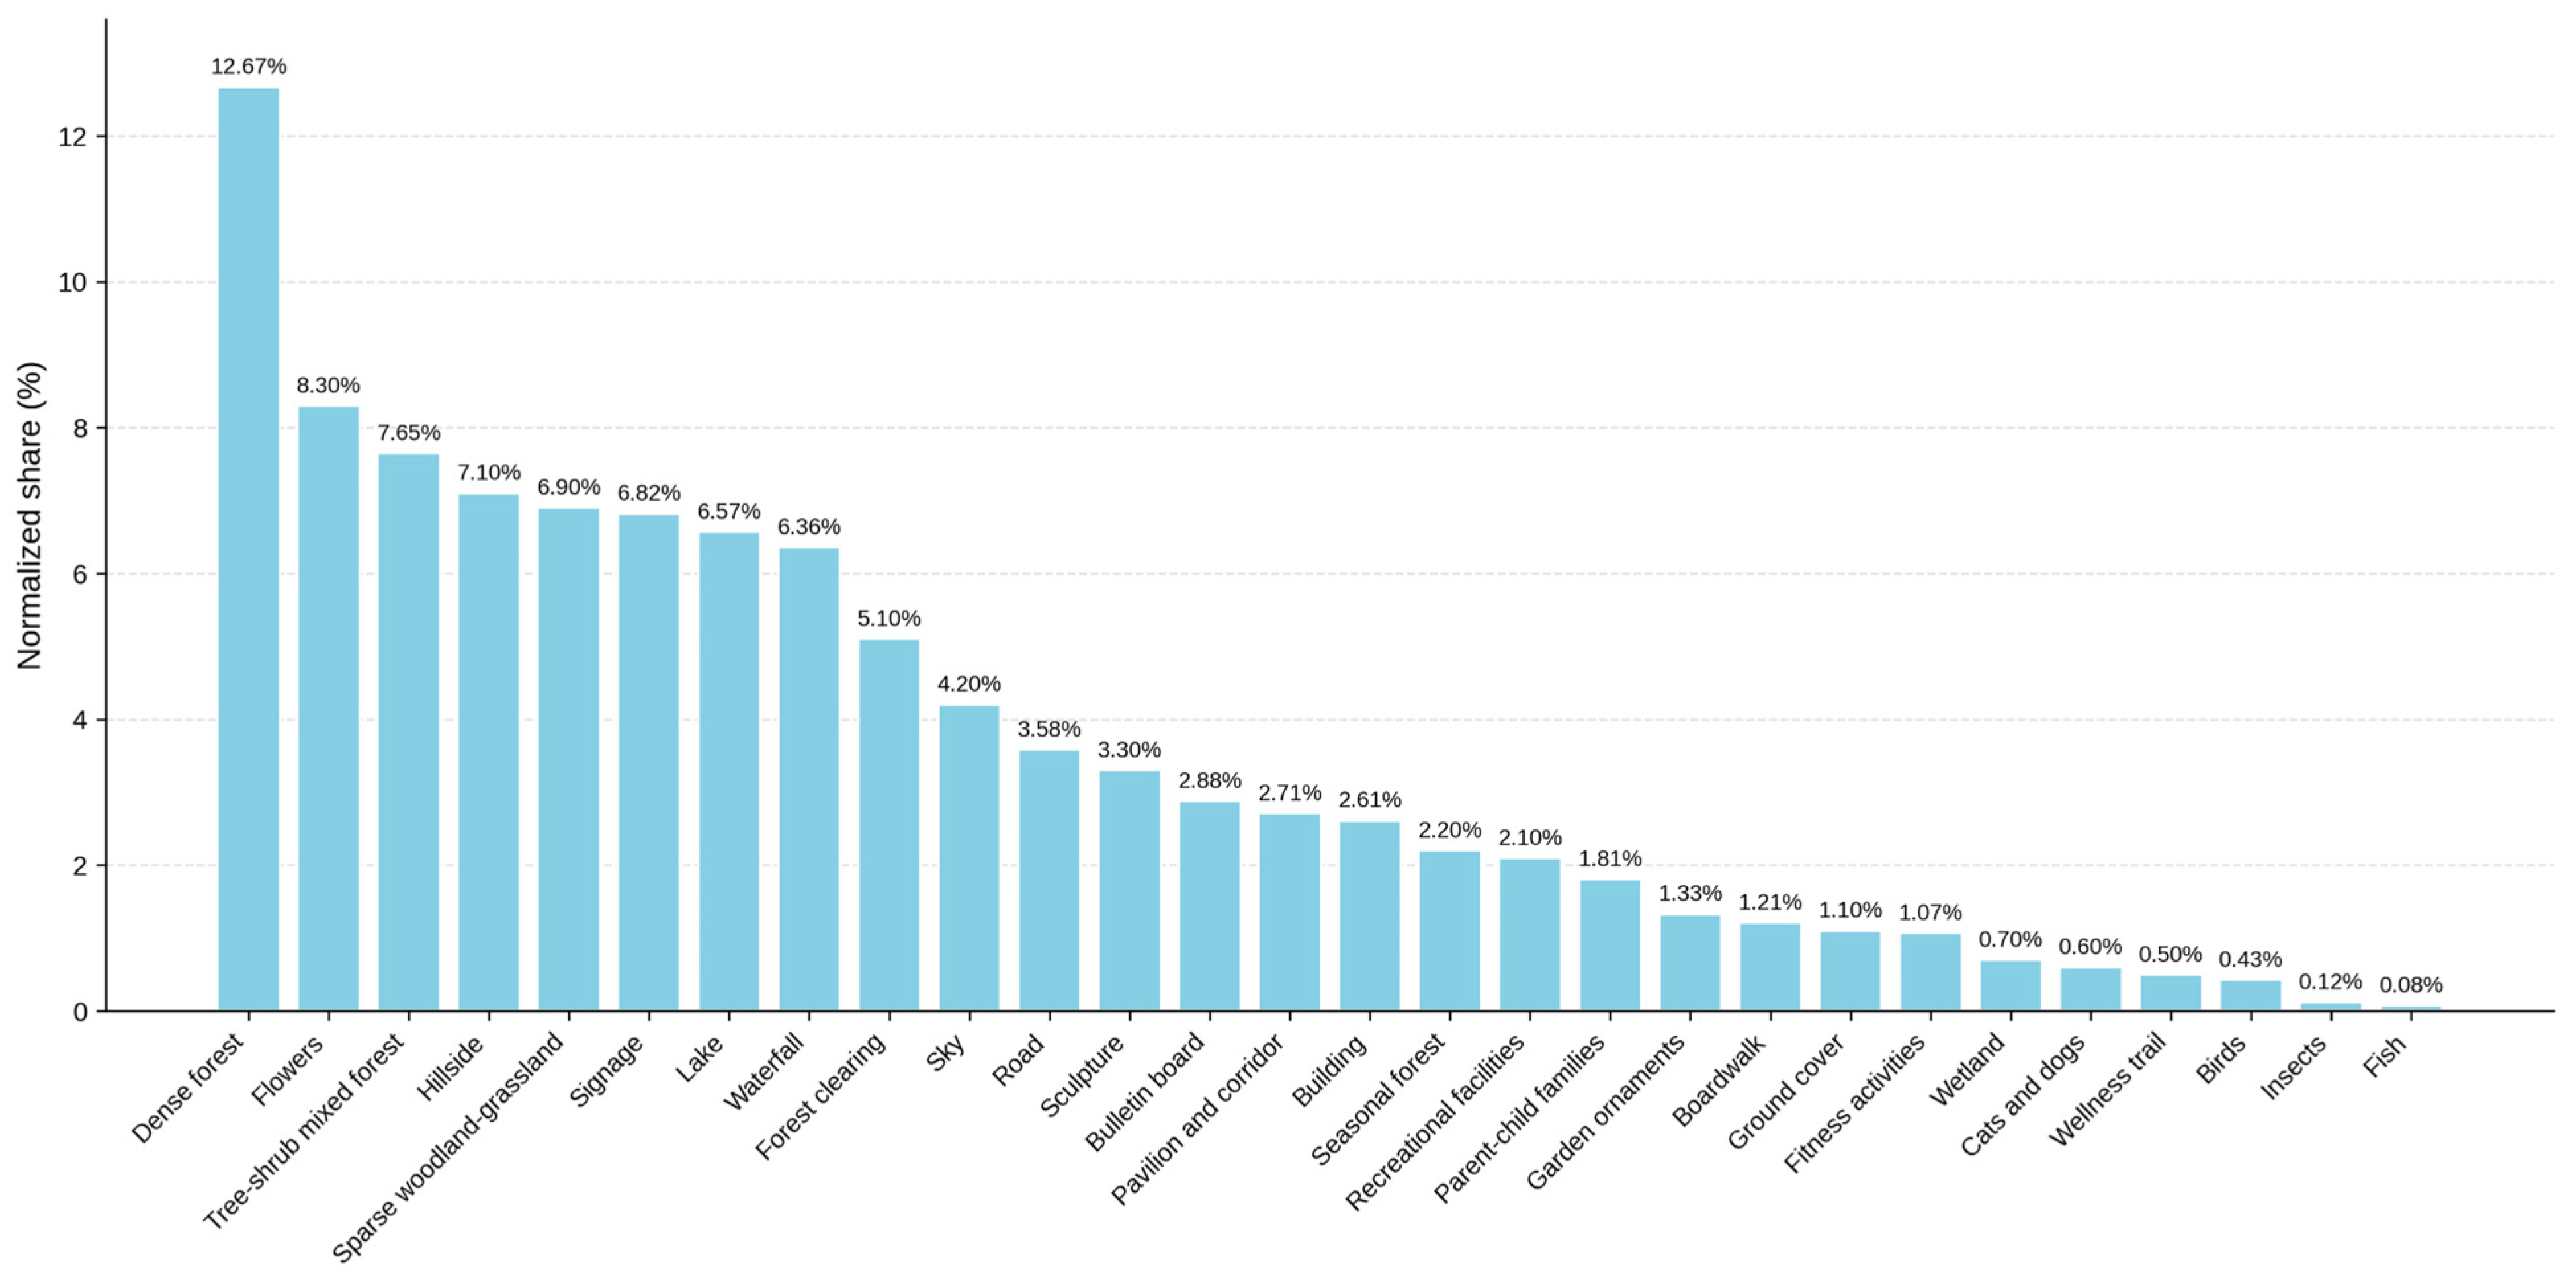
The model-derived perception of the 28 landscape elements is shown in Figure 5. Natural vegetation clearly dominated: dense forest ranked first at 12.67% and, together with tree-shrub mixed forest (7.65%), exceeded 20% combined, forming the green base and reflecting the parks’ advantage in forest cover and canopy closure, while flowers (8.30%) stood out as a highlight element frequently photographed and shared, embodying the “flower city” image. Hillside (7.10%), sparse woodland-grassland (6.90%), lake (6.57%), waterfall (6.36%), forest clearing (5.10%), and sky (4.20%) further outlined the mountain-and-water scenic base, and seasonal forest (2.20%) reflected attention to phenological change. Among built elements, signage (6.82%) was the most perceived, followed by road (3.58%), sculpture (3.30%), bulletin board (2.88%), pavilion and corridor (2.71%), and building (2.61%), reflecting the role of hard landscape in carrying recreation and transmitting regional culture, whereas recreational facilities (2.10%), garden ornaments (1.33%), and boardwalk (1.21%) were comparatively minor.
By type, natural elements accounted for the majority of perceived attention, with forest vegetation forming the dominant cluster and water and landform features the scenic backbone; human activity and minor natural elements such as parent-child families (1.81%), fitness activities (1.07%), ground cover (1.10%), wetland (0.70%), and wellness trail (0.50%) were intermediate to small. The clearest gap concerns living, dynamic nature: cats and dogs (0.60%), birds (0.43%), insects (0.12%), and fish (0.08%) ranked lowest of all 28 elements. Because these are among the most direct cues of biodiversity, their very low visibility is consistent with the parks’ considerable ecological richness not yet being converted into perceivable biodiversity cognition or nature-education experience. That is not the only available reading, and the design cannot separate the alternatives. Birds, insects and fish are small, mobile and often distant, so they are intrinsically harder to photograph with a phone camera than a hillside or a lake, and when photographed they occupy few pixels, which is also where the classifier performs least well (Section 4.3). A low perceived share may therefore record a limit of the medium and the method rather than an absence of visitor interest, and these values should be treated as a lower bound on encounter rather than as a measure of attention. This gap is directly relevant to the weakly perceived scientific education and biodiversity services reported in Section 3.1.
Dense-forest perception peaked at Shimen (national, 25.53%), Dishuiyan (municipal, 18.62%), and Fenghuang Mountain (provincial, 15.80%), and tree-shrub mixed forest at the South China National Botanical Garden (15.53%), indicating that canopy dominance in the visual record tracks the extent of continuous forest cover rather than administrative tier as such. Aggregated by level, however, national parks showed a stronger natural orientation overall, whereas provincial and municipal parks showed clearer service-oriented and facility-rich profiles.

3.4. Associations Between Landscape Elements and CES

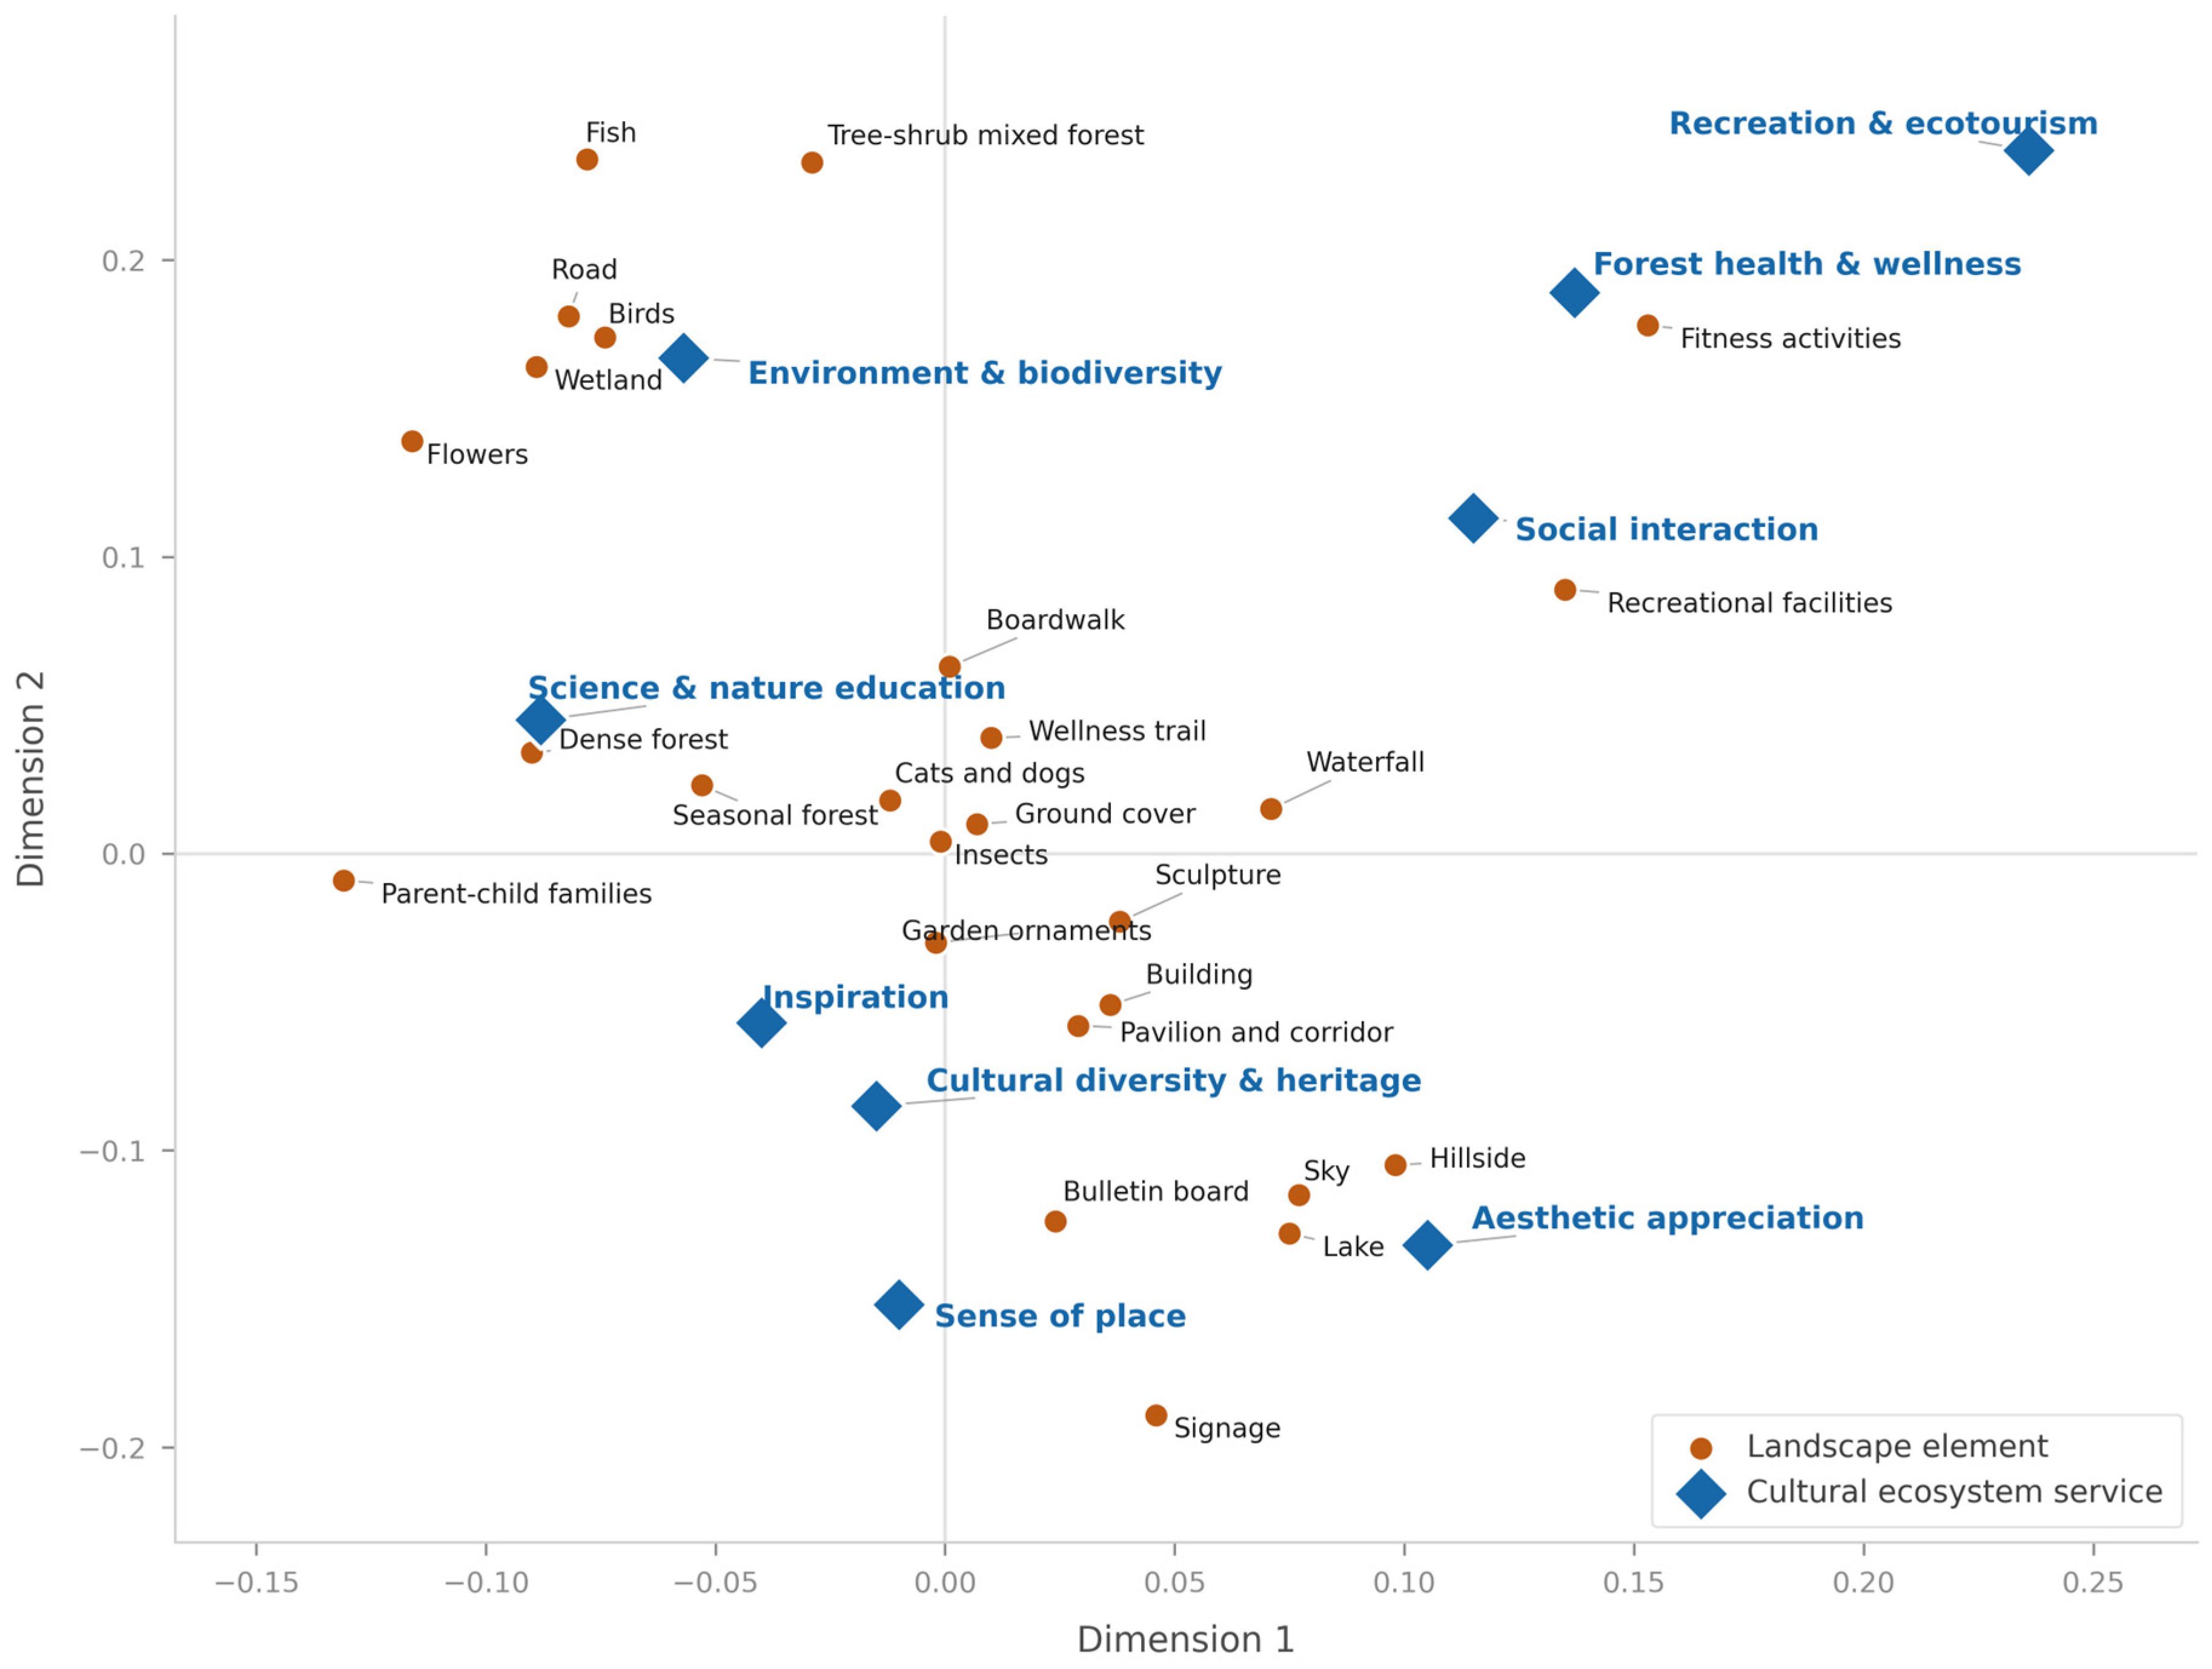
Overall structure (MCA). Chi-square screening retained 26 of the 28 elements, and the MCA of the resulting 26 × 9 matrix arranged services and elements into four readable regions of the plane (Figure 6). Services of active use (recreation and ecotourism, forest health and wellness, and social interaction) occupy the upper right, closest to fitness activities and recreational facilities. Aesthetic appreciation sits alone in the lower right, closest to hillside, lake and sky, that is, to landform, open water and skyline rather than to vegetation. Environment and biodiversity value and scientific research and nature education occupy the upper left, closest to birds, wetland, fish, tree-shrub mixed forest, and flowers on the one hand and to dense forest, seasonal forest, and parent-child families on the other. Cultural diversity and heritage, inspiration, and sense of place occupy the lower left, closest to pavilion and corridor, garden ornaments, buildings, bulletin boards, and signage.
Two features of this configuration are worth noting because they qualify a common assumption. First, the plane does not resolve into a simple natural pole and a built pole. Natural elements are distributed across all four regions: landform and water sit with aesthetic appreciation, fauna and wetland with biodiversity, and closed canopy with education. Built elements likewise divide between the activity facilities of the upper right and the interpretive and symbolic structures of the lower left. What the configuration separates is closer to a distinction between active use, scenic contemplation, biotic encounter, and cultural or reflective meaning, each drawing on both natural and constructed features. Second, the services most weakly perceived overall, education and inspiration, sit near the origin, where positions are least stable. Because this analysis operates on 26 aggregated observations, it is reported as a description of structure and not as a test, and the element-to-service claims developed below rest on the within-park regressions rather than on this plot.
Within-park associations. Table 5 reports all 36 models fitted for the four case parks. Seventeen passed the overall F-test at p < 0.05, and nineteen did not; adjusted R2 among the models that passed ranged from 0.007 to 0.082. As set out in Section 2.6, the results indicate the direction of associations and the elements that recur rather than predictive power.
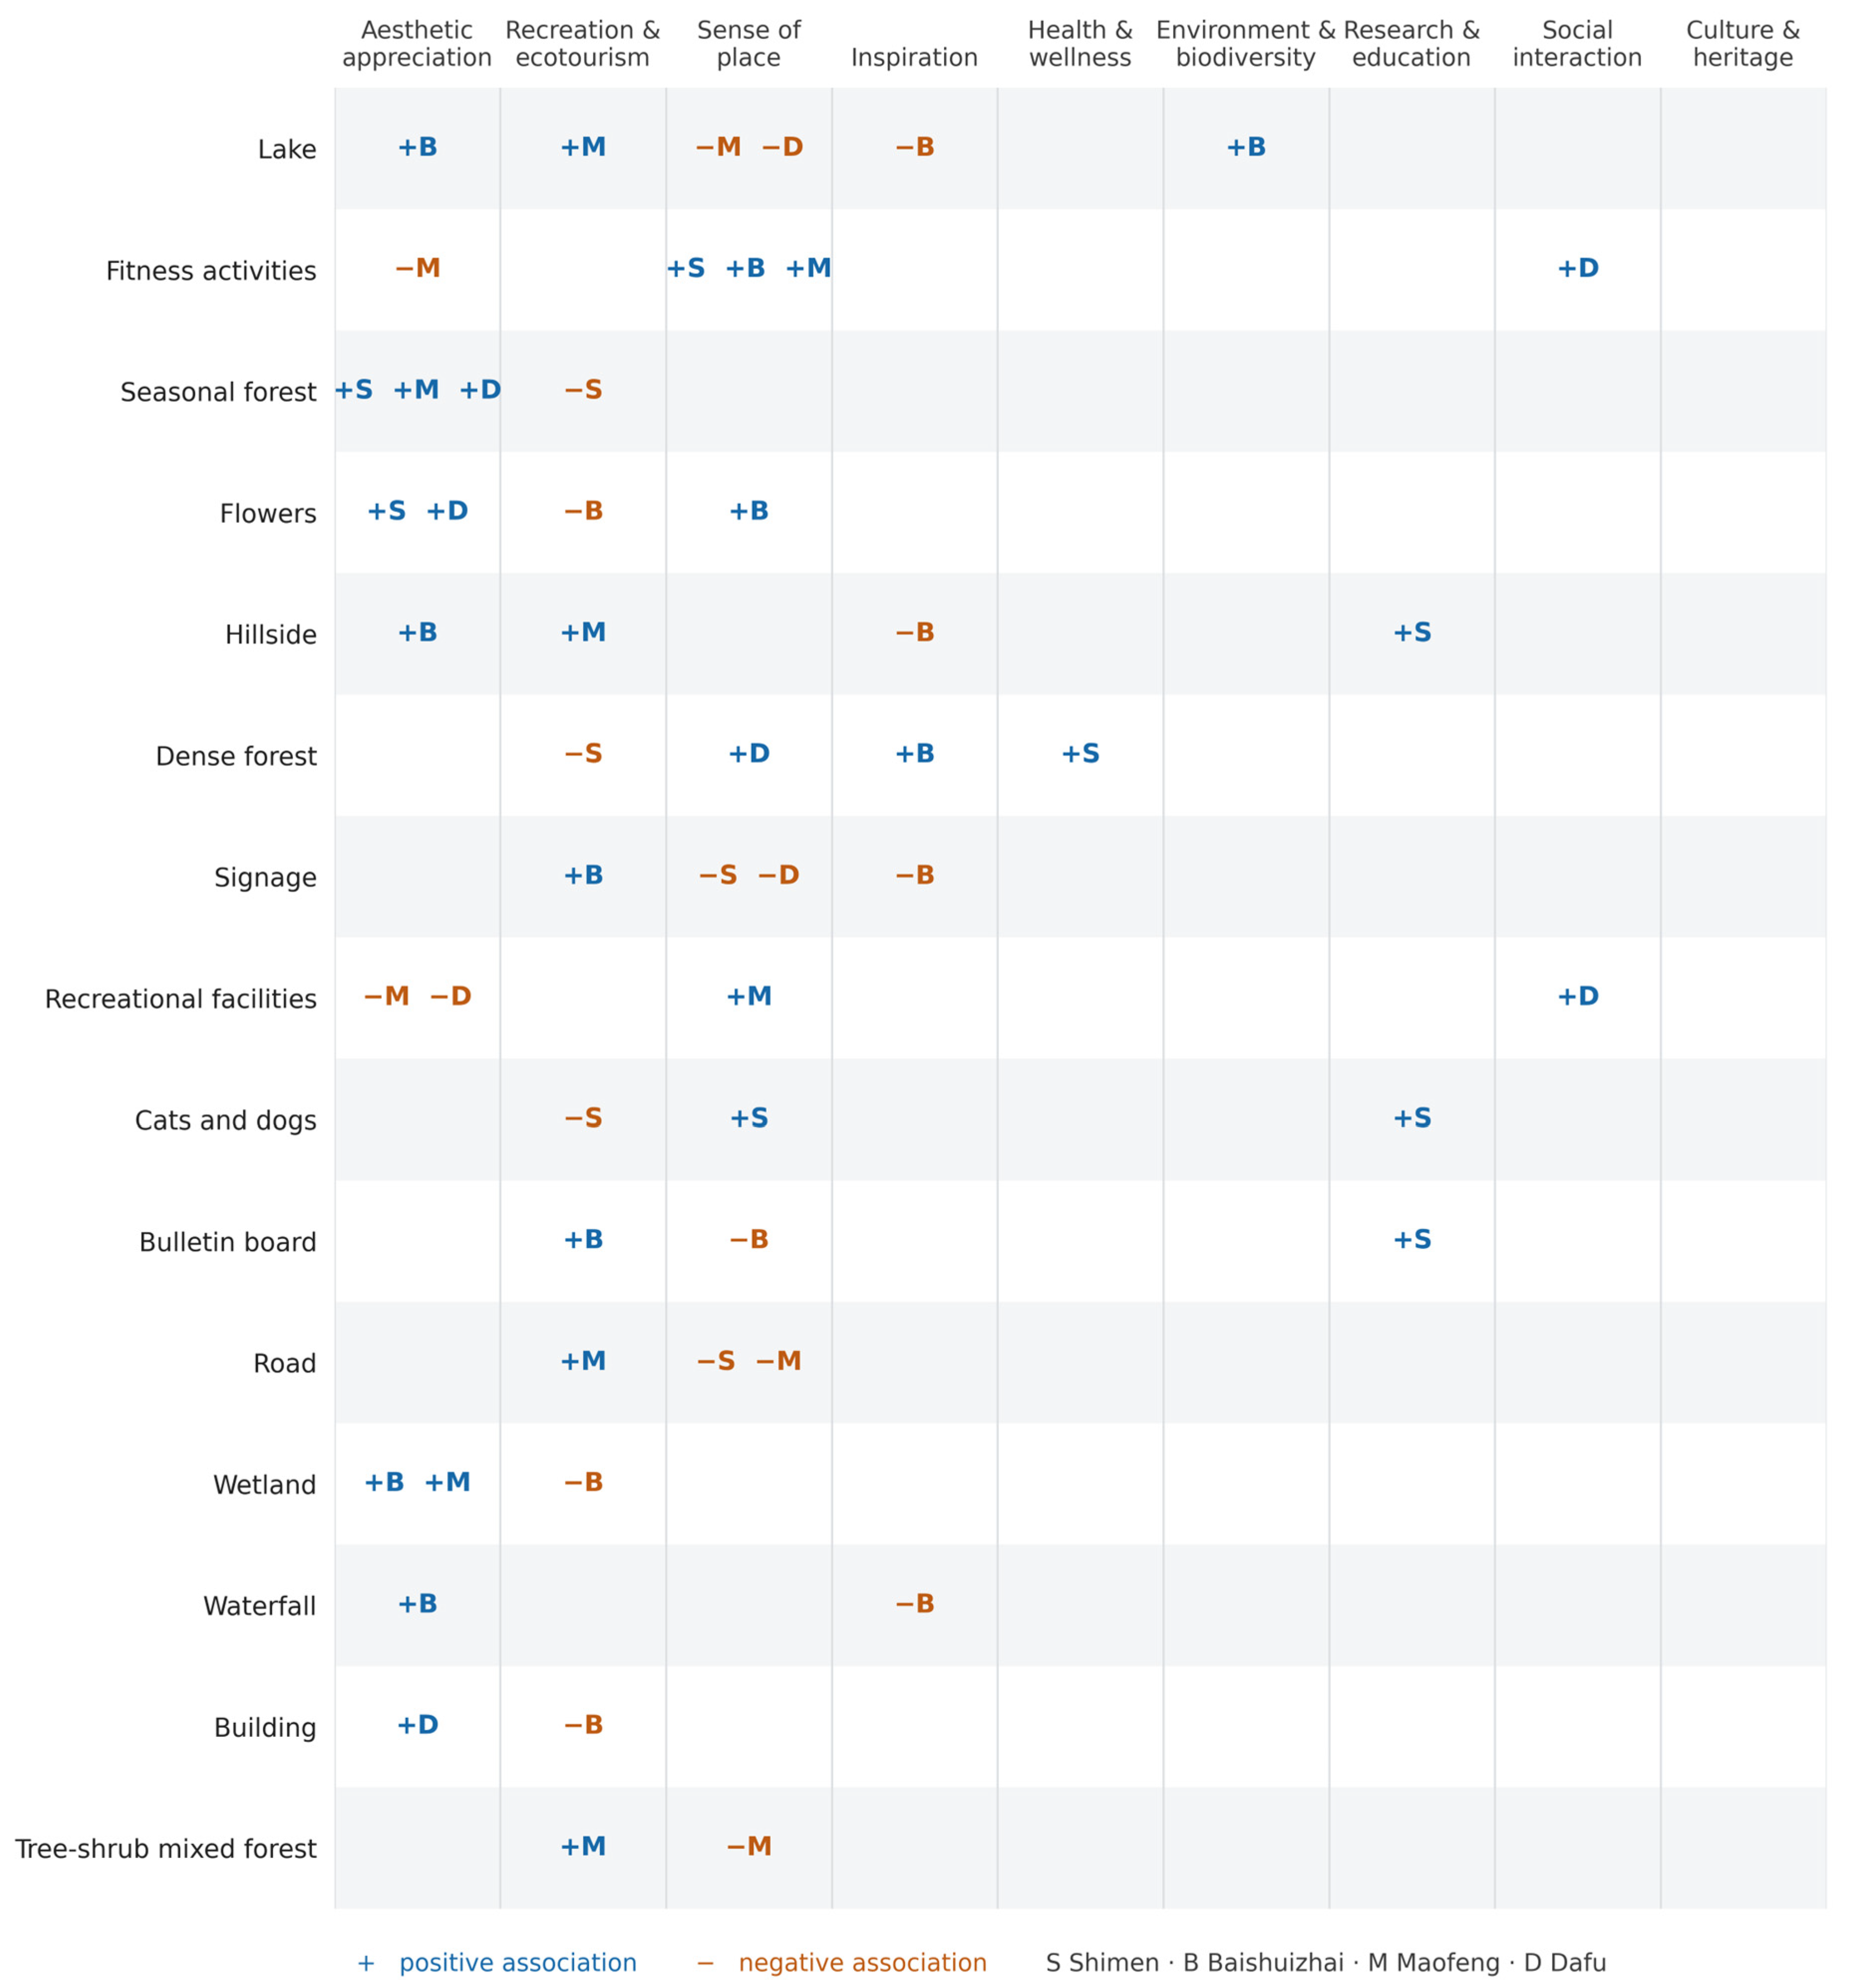
At Shimen (national), five of the nine services were significantly related to the element set. Seasonal forest and flowers were positively associated with aesthetic value, consistent with the park’s autumn-color and flower-sea landscapes; hillside, fish, birds, cats and dogs, and bulletin boards were positively associated with scientific research and nature education, a pattern suggesting that encounters with visible fauna function as educational content in a way static interpretation does not. Dense forest, parent-child families and the wellness trail were positively associated with wellness value, while seasonal forest, dense forest and cats and dogs were negatively associated with recreation (seasonal forest β = −0.054). Dense forest thus carried a positive association with wellness and a negative one with recreation within the same park, enclosed canopy apparently favoring deep relaxation but not active leisure. Sense of place was positively associated with cats and dogs (β = 0.213), insects (β = 0.260) and fitness activities (β = 0.264), and negatively with road (β = −0.060) and signage (β = −0.063).
At Baishuizhai (provincial), five models were significant, and four were not. Water and landform elements (hillside, lake, waterfall, wetland) were positively associated with aesthetic value, and ground cover, lake, and forest clearing were positively associated with environment and biodiversity value. Yet lake (β = −0.028), waterfall (β = −0.023), and hillside (β = −0.021) were negatively associated with inspiration, for which dense forest, sky, and pavilion-and-corridor were positive. One reading is that strong audio-visual stimulation occupies attention in ways that work against the inward state from which inspiration is reported to arise, and that the steepness that makes the site visually striking also makes it effortful; neither interpretation is tested here. Among built elements, pavilion-and-corridor was positively associated with both sense of place (β = 0.096) and inspiration (β = 0.057), whereas bulletin boards were negatively associated with sense of place (β = −0.040) and buildings negatively with recreation (β = −0.122).
At Maofeng Mountain (provincial), three models were significant. The aesthetic-value model had the highest explanatory power of any fitted model (adjusted R2 = 0.082): seasonal forest (β = 0.153), garden ornaments (β = 0.114), wetland (β = 0.434), and parent-child families (β = 0.116) were positive, whereas recreational facilities (β = −0.111) and fitness activities (β = −0.134) were negative. The same two facility elements were positively associated with sense of place (β = 0.146 and 0.220), reversing sign between the two services. This is consistent with the park functioning as an everyday space for nearby residents, where group exercise builds attachment while detracting from the perceived naturalness that other visitors come for.
At Dafu Mountain (municipal), four models were significant. Every significant positive predictor of social interaction value was a built element or activity (recreational facilities β = 0.059, garden ornaments β = 0.162, fitness activities β = 0.097), and no natural element reached significance for that service. Recreational facilities were simultaneously positive for social interaction and negative for aesthetic value (β = −0.067). Dense forest, birds, and insects were positively associated with sense of place, while birds (β = −0.526) and insects (β = −0.573) carried negative coefficients in the near-significant recreation model (p = 0.056). The same fauna therefore appear as attachment cues in one service and, plausibly, as biting insects, as a nuisance in another.
Across the four parks, natural elements were associated with ecological, aesthetic, and inspirational values and built elements with cultural, social, and wellness values. That division, however, is qualified by how often the sign of an association reverses. Twenty-seven of the 28 elements reached significance in at least one model, and 15 of those 27 did so with opposite signs on different services (Figure 7). In 14 of the 15 cases, the reversal occurs within a single park, so it cannot be attributed to differences between parks. The reversals are also unevenly distributed across services: sense of place, aesthetic appreciation, and recreation account for the great majority, whereas no element reversed sign on cultural diversity and heritage. Two patterns therefore recur strongly enough to warrant emphasis: the same element can be associated with one service positively, and another negatively, within the same park, and the dominant element-to-service pathways differ across the four case parks rather than holding constant, with park level and functional positioning as one possible, but untested, source of that difference.

4. Discussion

4.1. Main Findings and Mechanisms

Perceived CES of Guangzhou forest parks showed clear level-based differentiation. National parks, characterized by scenic landscapes, were strong in recreation, aesthetic, and wellness values and often led in scientific education and environmental values, but were weaker in deeper cultural-heritage and inspiration values; provincial parks were recreation-dominated and community-linked yet relatively monofunctional culturally; municipal parks were distinctive and socially oriented but generally weak in scientific education value. This pattern reflects both parks’ resource characteristics and management positioning and the public’s differentiated demand hierarchy, which runs from daily leisure and social interaction to aesthetic and wellness experience and on to knowledge acquisition and cultural transmission [14,41]. The temporal results are consistent with a dynamic dimension to this hierarchy: over 2020–2024, attachment, biodiversity, and inspiration grew fastest, which would fit an account in which the public seeks more reflective engagement once basic recreational needs are met. As Section 3.1 notes, the observation window is too short, and too confounded with platform change and the pandemic, to distinguish that account from a change in the posting population.
The associations indicate how services are read from the physical system, but they do not divide it into a natural half and a built half. In the overall configuration and in the within-park models alike, natural elements distribute across several service groups: landform and open water with aesthetic appreciation, fauna and wetland with biodiversity, and closed canopy with wellness and education. Built elements divide in turn between activity facilities, which accompany social and recreational values, and interpretive or symbolic structures, which accompany cultural and reflective ones [28,38]. Although natural vegetation dominated perceived attention overall, signage was the single most-perceived built element. This is open to two readings. Signage may be integral to how visitors read and navigate forest-park space, or it may be photographed instrumentally, as an efficient way to record a place name, a route, or a piece of information for later use or for transfer to an audience, in which case its high share indexes the convenience of the sign rather than the value of the thing signed. The present data cannot distinguish the two, and the recommendation in Section 4.2 that interpretive infrastructure carry biodiversity content is weakened to that extent, although both readings support signage as a channel visitors demonstrably direct a camera at.
The most recurrent pattern is that the same element may be associated with different services in opposite directions: closed forest accompanies deep relaxation but not active recreation, and strong water scenery accompanies aesthetic appreciation but not contemplative inspiration. We report these as descriptive associations awaiting mechanistic explanation, not as established service trade-offs. The explanations offered below and in Section 3.4 are post hoc readings consistent with the sign pattern; none is tested here, and a sign reversal in observational co-occurrence data can arise from a genuine trade-off, from a third factor that drives both the element’s visibility and the service vocabulary, or from differences in who photographs what. If the pattern does reflect a trade-off, the design consequence would be that landscape configuration cannot be optimized element by element, since raising the supply of an element would raise some services and depress others. Planning should therefore proceed from an explicit statement of which services a given zone is intended to deliver, and only then to the elements that serve that combination.
The second pattern is that these associations are not fixed properties of the elements. At Dafu Mountain, a municipal park, only built facilities positively predicted social interaction and no natural element reached significance; at the higher-tier parks in this set, natural elements dominated ecological and aesthetic services. How far this supports a tier interpretation needs to be stated carefully. The regressions cover four parks, one national, two provincial, and one municipal, so each tier is represented by one or two cases, and the differences between them are differences between individual parks. They may as easily arise from area, forest origin and maturity, distance from the urban core, catchment composition, or management resourcing as from institutional position, and, as Section 2.1 notes, tier designation is awarded on landscape resource quality, so these attributes are correlated with tier by construction and cannot be separated from it in this design. We therefore treat the four parks as illustrative exemplars rather than as representative samples of their tiers and read the result as showing that element-to-service associations vary between parks, with administrative level serving as a convenient umbrella label for a bundle of correlated attributes that may itself be less relevant than any of its components. Establishing a tier effect as such would require many parks per tier and explicit controls for area, vegetation structure, and accessibility.
These findings are consistent with, and extend, prior work. The dominance of recreation and aesthetic values echoes social media studies of national forest parks and large urban forests in China [38,40,41], while the weak perception of scientific education and inspiration values mirrors the under-provision of “deeper” services reported for urban green spaces [14,21]. The temporal deepening of demand aligns with evidence that visitors increasingly seek restorative and meaningful experiences rather than sightseeing alone [29]. Relative to recent LLM-based CES studies, which have established that language models can extract service perceptions reliably from review text [31,32,33,34], the present design adds the image channel, and therefore the element-level attribution those studies do not attempt; relative to image-based CES studies [28,46], it adds the articulated service and sentiment that images alone cannot supply. Comparable dictionary-and-classification designs applied to urban-renewal sites [59] and to park-based social interaction at metropolitan scale [60] likewise report that built and natural elements support distinct service bundles, but neither examines whether that division shifts with institutional position.

4.2. Implications for Planning and Management

The results support differentiated rather than uniform management. Because the within-park models cover four parks, the guidance below is tied to the specific coefficients those models produced and is offered as an illustration of how element-level attribution changes what a recommendation says, not as a prescription for a tier:
  • National forest parks. At Shimen, the elements positively associated with education were visible fauna and bulletin boards, not vegetation (Table 5), while these parks combine strong aesthetic and recreation perception with weak heritage and inspiration values (Section 3.1). Protecting the forest resource is therefore not by itself sufficient to generate perceived educational value: provision has to target encounters with living, observable nature and the interpretive framing around it. The negative coefficients on road and signage for sense of place in the same park point the other way for circulation infrastructure, which suggests keeping it visually subordinate in the zones intended to carry attachment.
  • Provincial forest parks. Maofeng Mountain gives the clearest single case of one element serving one visitor group at another’s expense: recreational facilities and fitness activities were negatively associated with aesthetic value and positively with sense of place (Table 5). Spatial separation of group-exercise areas from the parts of the park visited for scenery addresses that specific conflict and is preferable to distributing facilities evenly across the site. The same result would not follow from an inventory of what the park contains.
  • Municipal forest parks. At Dafu Mountain, every significant positive predictor of social interaction value was a built element or activity, and no natural element reached significance (Table 5), while social interaction value there was the highest in the sample (37.71%, Section 3.1). Facilities are doing the social work in this park. The accompanying risk is visible in the same table, where recreational facilities carried a negative coefficient on aesthetic value: integrating facilities into the vegetation base rather than clearing for them is the specific implication, one that follows from the coefficients rather than from general principle.
Beyond level-specific measures, four cross-cutting priorities follow. First, because the same element was associated with one service positively and another negatively, and on the reading that this reflects a real trade-off rather than a shared driver, planning would be better organized around intended services than around element inventories, zoning quiet, visually enclosed forest for reflection and wellness separately from open, facility-rich areas for active recreation and social interaction.
Second, the distribution of services across the tiers raises an equity question that the aggregate figures obscure. Municipal parks are the parks most people reach on foot, and in this sample, they were where social interaction value concentrated (37.71% at Dafu Mountain), consistent with their role as everyday social infrastructure and a contributor to neighborhood social cohesion. They were also, however, consistently weakest in scientific education value (generally below 2%). Residents whose realistic access is limited to municipal parks therefore obtain the social benefits of urban forest but comparatively little of the educational and interpretive benefit, which is concentrated in the large peri-urban national parks that require time, transport and cost to reach. Levelling this distribution, by placing interpretive and educational provision in small, city-embedded parks rather than only in flagship sites, is a tractable intervention with a clear distributional rationale.
Third, given the consistently low perception of dynamic biological elements (birds, insects, fish), habitat creation, biodiversity-friendly design and interpretive signage could raise the visibility and perceptibility of biodiversity, advancing “green and beautiful” goals from the visual level to interactive experience and helping to address the weak scientific education and biodiversity services. Because signage was already the most-perceived built element, interpretive infrastructure is a channel visitors demonstrably attend to, and is therefore an efficient carrier for this content.
Fourth, the vocabulary of negatively valenced reviews points at facilities and management rather than at scenery, which suggests that targeted upgrades to paths, lighting, wayfinding and service quality, especially in parks such as Longyandong where such vocabulary was most frequent, are a more efficient route to improving reported experience than intervention in the landscape itself. A continuous monitoring mechanism that tracks CES vocabulary from social media over time could help managers detect emerging needs and refine strategies iteratively [24,30]. Because sentiment is an auxiliary layer here and is not attributed to individual landscape elements, this priority rests on weaker evidence than the three above and is offered as a direction for monitoring rather than as a result of the attribution analysis.

4.3. Limitations

Several limitations remain. First, user-profile bias may unbalance the results. Although the social media dataset is large, it is limited by platform characteristics and uneven population coverage: users concentrate in the 18–35 age group, while older adults, children, and low-income groups participate less. This generational and socioeconomic skew can bias the findings. Older adults’ demand for wellness and spiritual values, and children’s perception of nature education, are hard to express through young users’ online text. Multi-platform mixing mitigates single-source bias, but potential under-representation remains, and the CES perceptions of non-users and infrequent users are not captured. This limitation bears directly on the equity argument in Section 4.2, which should be read as a hypothesis derived from the perception data rather than as a measured distributional outcome. Future work could combine social media analysis with field surveys, using semi-structured interviews and participatory mapping to reach older adults, children, and low-income groups and to obtain deeper attributes such as age, income, and education.
Second, the association analyses are correlational and exploratory. Explained variance is low (R2 = 0.007–0.082), the number of coefficient tests is large relative to the number of reported findings, and the design cannot distinguish an element causing a perception from an element co-occurring with the conditions that produce it. The two recurring patterns, opposite-direction effects and tier conditionality, are more robust to this concern than any individual coefficient, but both warrant confirmatory testing, ideally with a pre-registered design or an experimental manipulation of element visibility. Two further constraints belong here. The descriptive profiles of Section 3.1, Section 3.2 and Section 3.3 are computed on the full text and image corpora while the regressions use paired posts only, so the descriptive context and the inferential sample are related but not identical, and the profiles should not be read as characterizing the regression sample. And the four case parks cannot support a claim about administrative tiers as populations: each tier is represented by one or two parks, tier is confounded with the landscape attributes on which it is awarded, and the between-park differences reported here are therefore differences between four specific sites.
Third, measurement error in the image channel is unevenly distributed and propagates into the regressions. Overall accuracy was high, but classification is harder for categories that are visually ambiguous at distance, such as dense forest against tree-shrub mixed forest in dim or distant shots and boardwalk against road where texture is unclear, and for categories that occupy few pixels, such as birds and insects. Two consequences follow. Elements recognized less reliably will have their associations attenuated toward zero, so an absence of significance for such an element is weak evidence of absence of effect. Elements that are both rarely perceived and less reliably recognized are also estimated from few observations, so their coefficients are unstable in both magnitude and sign; the large coefficients attaching to birds and insects in individual models should be read in that light, and the low perceived shares for small fauna should be read as a lower bound on what visitors actually encounter on site. Both YOLO26 and Qwen3.5-Plus are recent releases without an established external validation literature, which is why human-annotated validation is reported for both components rather than relying on published benchmarks.
Last, the analysis does not incorporate macro-environmental factors. It focuses on within-park landscape elements and gives less attention to external conditions such as land cover, the surrounding urban built environment, and transport accessibility, which also shape perceived CES; higher accessibility, for instance, raises visitation and thus the assessed value of cultural services. Because these spatiotemporal variables are not integrated into a unified framework, the explanation of how some cultural services form may be incomplete. A final constraint concerns the observation window. Five years is short relative to the pace at which cultural values change, and long relative to the pace at which social media platforms, their user populations and their posting conventions change; the window also contains the COVID-19 disruption. Compositional change over this period cannot be attributed to value change with any confidence, and the temporal results should be treated as a baseline for longer series rather than as evidence of shifting demand.

5. Conclusions

This study built an integrated image-text CES perception-assessment framework for urban forest parks and applied it to 15 parks of three administrative levels in Guangzhou. Two results are the study’s substantive contributions. First, individual landscape elements are associated with different cultural services in opposite directions: seasonal forest accompanied higher aesthetic appreciation but lower recreation, and water features higher aesthetic value but lower inspiration. These are descriptive associations rather than demonstrated trade-offs, and the mechanism behind the sign reversals is not tested here; if they do reflect a trade-off, landscape configuration for CES cannot be optimized element by element and should proceed from an explicit statement of which services a zone is intended to deliver. Second, these element-to-service associations are not fixed: in the municipal park examined, only built facilities positively predicted social interaction, whereas natural elements dominated ecological and aesthetic services in the higher-tier parks of this set. With one or two parks per tier, and with tier designation itself awarded on landscape resource quality, we treat these four parks as illustrative exemplars rather than as representative samples and do not claim a tier effect as such. What the result does establish is that element-to-service associations vary between parks, which implies that design guidance should not be moved between parks without re-testing.
The descriptive results provide the context for these associations. Perceived CES were dominated by recreation/ecotourism (38.81%) and aesthetic appreciation (23.93%), with weak perception of scientific education (1.83%) and inspiration (1.26%); over 2020–2024 total perception rose 41.38% and the composition shifted toward emotional, educational and spiritual vocabulary, a shift the observation window is too short and too confounded to attribute to changing values. Expressed sentiment was predominantly positive, with negative vocabulary concentrated on facilities and management rather than on the landscape itself. Landscape attention was dominated by natural vegetation, with signage the leading built element and dynamic biological elements (birds, insects, fish) rarely perceived. This gap helps explain the weak biodiversity and education services and points to a tractable intervention.
Methodologically, coupling LLM-based text analysis with image classification offers a scalable route to element-level CES attribution across many sites and years. Future work could couple these perception measures with macro-environmental and supply-side indicators, extend the multimodal framework to video and cross-city comparison, and move from exploratory association to confirmatory or experimental designs.

Supplementary Materials

The following supporting information can be downloaded at: https://www.mdpi.com/article/10.3390/land15091586/s1. Text S1: Prompt used for large-language-model sentiment classification.

Author Contributions

Conceptualization, L.L., Y.X. (Yao Xiao) and J.W.; methodology, L.L. and Y.X. (Yao Xiao); software, L.L. and Y.X. (Yao Xiao); validation, L.L. and Y.X. (Yao Xiao); formal analysis, L.L. and Y.X. (Yao Xiao); investigation, L.L. and Y.X. (Yao Xiao); data curation, L.L. and Y.X. (Yao Xiao); writing—original draft preparation, L.L. and Y.X. (Yao Xiao); writing—review and editing, J.W.; visualization, L.L. and Y.X. (Yao Xiao); supervision, J.W.; funding acquisition, J.W. and Y.X. (Yongmei Xiong). All authors have read and agreed to the published version of the manuscript.

Funding

This research was funded by the Guangzhou Municipal Science and Technology Bureau Social Development Project (Grant No. 202206010058) and the Guangdong Provincial Philosophy and Social Sciences Planning Project (Grant No. GD26DWQ23).

Data Availability Statement

The CES dictionary, the labelled landscape-image training set, and the aggregated park-level results supporting the findings of this study are available from the corresponding author on reasonable request. Raw social media records cannot be redistributed under the platforms’ terms of service.

Acknowledgments

The authors thank the expert panels who contributed to the dictionary coding and to the annotation of the sentiment and image validation samples, and the management authorities of the study parks for facilitating the field surveys. During the preparation of this manuscript, the authors used Claude (Opus 4.8, Anthropic) to assist with language editing and improving the clarity and organization of the manuscript. All outputs were reviewed, revised, and validated by the authors, who take full responsibility for the content of this publication.

Conflicts of Interest

The authors declare no conflicts of interest.

References

  1. Millennium Ecosystem Assessment. Ecosystems and Human Well-Being: A Framework for Assessment; Island Press: Washington, DC, USA, 2003. [Google Scholar]
  2. Chan, K.M.A.; Satterfield, T.; Goldstein, J. Rethinking ecosystem services to better address and navigate cultural values. Ecol. Econ. 2012, 74, 8–18. [Google Scholar] [CrossRef] [Scilit]
  3. de Groot, R.S.; Wilson, M.A.; Boumans, R.M.J. A typology for the classification, description and valuation of ecosystem functions, goods and services. Ecol. Econ. 2002, 41, 393–408. [Google Scholar] [CrossRef] [Scilit]
  4. Chiesura, A.; de Groot, R. Critical natural capital: A socio-cultural perspective. Ecol. Econ. 2003, 44, 219–231. [Google Scholar] [CrossRef] [Scilit]
  5. Kumar, M.; Kumar, P. Valuation of the ecosystem services: A psycho-cultural perspective. Ecol. Econ. 2008, 64, 808–819. [Google Scholar] [CrossRef] [Scilit]
  6. Kumar, P. (Ed.) The Economics of Ecosystems and Biodiversity: Ecological and Economic Foundations; Earthscan: London, UK, 2010. [Google Scholar]
  7. IPBES. The IPBES Regional Assessment Report on Biodiversity and Ecosystem Services for the Americas; Secretariat of IPBES: Bonn, Germany, 2018. [Google Scholar]
  8. Daily, G.C. (Ed.) Nature’s Services: Societal Dependence on Natural Ecosystems; Island Press: Washington, DC, USA, 1997. [Google Scholar]
  9. Costanza, R.; d’Arge, R.; de Groot, R.; Farber, S.; Grasso, M.; Hannon, B.; Limburg, K.; Naeem, S.; O’Neill, R.V.; Paruelo, J.; et al. The value of the world’s ecosystem services and natural capital. Nature 1997, 387, 253–260. [Google Scholar] [CrossRef] [Scilit]
  10. Haines-Young, R.H.; Potschin-Young, M.B. Proposal for a Common International Classification of Ecosystem Goods and Services (CICES) for Integrated Environmental and Economic Accounting; European Environment Agency: Nottingham, UK, 2010.
  11. Fish, R.; Church, A.; Winter, M. Conceptualising cultural ecosystem services: A novel framework for research and critical engagement. Ecosyst. Serv. 2016, 21, 208–217. [Google Scholar] [CrossRef] [Scilit]
  12. Chen, B.; Qi, X.; Qiu, Z. Recreational use of urban forest parks: A case study in Fuzhou National Forest Park, China. J. For. Res. 2018, 23, 183–189. [Google Scholar] [CrossRef] [Scilit]
  13. Wang, C.; Luo, F. Differing perceptions on cultural ecosystem service values of urban forest landscapes for children and youths: A case study of Changsha, Central China. Urban For. Urban Green. 2025, 112, 129005. [Google Scholar] [CrossRef] [Scilit]
  14. Bai, X.; Chen, J. Public preference and perception of cultural ecosystem services in urban forest parks. Sci. Silvae Sin. 2025, 61, 99–108. (In Chinese) [Google Scholar]
  15. Sherrouse, B.C.; Clement, J.M.; Semmens, D.J. A GIS application for assessing, mapping, and quantifying the social values of ecosystem services. Appl. Geogr. 2011, 31, 748–760. [Google Scholar] [CrossRef] [Scilit]
  16. Brown, G.; Fagerholm, N. Empirical PPGIS/PGIS mapping of ecosystem services: A review and evaluation. Ecosyst. Serv. 2015, 13, 119–133. [Google Scholar] [CrossRef] [Scilit]
  17. Peng, W.; Liu, W.; Cai, W.; Wang, X.; Huang, Z.; Wu, C. Evaluation of ecosystem cultural services of urban protected areas based on public participation GIS (PPGIS): A case study of Gongqing Forest Park in Shanghai, China. Chin. J. Appl. Ecol. 2019, 30, 439–448. (In Chinese) [Google Scholar]
  18. Zhang, F.; Wang, X.H.; Nunes, P.A.L.D.; Ma, C. The recreational value of Gold Coast beaches, Australia: An application of the travel cost method. Ecosyst. Serv. 2015, 11, 106–114. [Google Scholar] [CrossRef] [Scilit]
  19. Yin, N.; Wang, S.; Liu, Y. Ecosystem service value assessment: Research progress and prospects. Chin. J. Ecol. 2021, 40, 233–244. (In Chinese) [Google Scholar] [CrossRef] [Scilit]
  20. Chen, D.; Zhong, L. Review of ecosystem service value assessment and its realization mechanisms. Chin. J. Agric. Resour. Reg. Plan. 2023, 44, 84–94. (In Chinese) [Google Scholar]
  21. Bryce, R.; Irvine, K.N.; Church, A.; Fish, R.; Ranger, S.; Kenter, J.O. Subjective well-being indicators for large-scale assessment of cultural ecosystem services. Ecosyst. Serv. 2016, 21, 258–269. [Google Scholar] [CrossRef] [Scilit]
  22. Oteros-Rozas, E.; Martín-López, B.; Fagerholm, N.; Bieling, C.; Plieninger, T. Using social media photos to explore the relation between cultural ecosystem services and landscape features across five European sites. Ecol. Indic. 2018, 94, 74–86. [Google Scholar] [CrossRef] [Scilit]
  23. Havinga, I.; Bogaart, P.W.; Hein, L.; Tuia, D. Defining and spatially modelling cultural ecosystem services using crowdsourced data. Ecosyst. Serv. 2020, 43, 101091. [Google Scholar] [CrossRef] [Scilit]
  24. Wang, Z.; Miao, Y.; Xu, M.; Zhu, Z.; Qureshi, S.; Chang, Q. Revealing the differences of urban parks’ services to human wellbeing based upon social media data. Urban For. Urban Green. 2021, 63, 127233. [Google Scholar] [CrossRef] [Scilit]
  25. Li, H.; Liu, Z.; Li, X.; Chen, C. Evaluation of cultural ecosystem services of urban riverside green space based on social media text. Landsc. Archit. 2023, 30, 80–88. (In Chinese) [Google Scholar]
  26. Krizhevsky, A.; Sutskever, I.; Hinton, G.E. ImageNet classification with deep convolutional neural networks. Commun. ACM 2017, 60, 84–90. [Google Scholar] [CrossRef] [Scilit]
  27. Zhang, K.; Feng, X.; Guo, Y.; Su, Y.; Zhao, K.; Zhao, Z.; Ma, Z.; Ding, Q. Overview of deep convolutional neural networks for image classification. J. Image Graph. 2021, 26, 2305–2325. (In Chinese) [Google Scholar]
  28. Huai, S.; Chen, F.; Liu, S.; Canters, F.; Van de Voorde, T. Using social media photos and computer vision to assess cultural ecosystem services and landscape features in urban parks. Ecosyst. Serv. 2022, 57, 101475. [Google Scholar] [CrossRef] [Scilit]
  29. Kim, J.; Son, Y. Assessing and mapping cultural ecosystem services of an urban forest based on narratives from blog posts. Ecol. Indic. 2021, 129, 107983. [Google Scholar] [CrossRef] [Scilit]
  30. Li, J.; Gao, J.; Zhang, Z.; Fu, J.; Shao, G.; Zhao, Z.; Yang, P. Insights into citizens’ experiences of cultural ecosystem services in urban green spaces based on social media analytics. Landsc. Urban Plan. 2024, 244, 104999. [Google Scholar] [CrossRef] [Scilit]
  31. Luo, H.; Zhang, Z.; Zhu, Q.; Ben Ameur, N.E.H.; Liu, X.; Ding, F.; Cai, Y. Using large language models to investigate cultural ecosystem services perceptions: A few-shot and prompt method. Landsc. Urban Plan. 2025, 258, 105323. [Google Scholar] [CrossRef] [Scilit]
  32. Song, Q.; Tian, S.; Zheng, L.; Zheng, Y.; Qiu, L.; Huang, B.; van Ameijde, J. Beyond sentiment: Using large language models to decode multidimensional urban park perceptions for enhanced equality. Landsc. Urban Plan. 2026, 268, 105571. [Google Scholar] [CrossRef] [Scilit]
  33. Ren, S.; Chen, X.; Zhang, H. Emotional landscape analysis of cultural ecosystem services in heritage parks: A deep learning approach using social media data. Urban Ecosyst. 2025, 28, 96. [Google Scholar] [CrossRef] [Scilit]
  34. Zhang, Y.; Zhao, L.; Hu, S. Assessing perception and equity of cultural ecosystem services in urban parks using social media data. Sci. Rep. 2025, 15, 33127. [Google Scholar] [CrossRef] [Scilit]
  35. Dang, H.; Li, J. Perception of cultural ecosystem services of urban parks based on natural language processing. J. Shaanxi Norm. Univ. (Nat. Sci. Ed.) 2022, 50, 92–102. (In Chinese) [Google Scholar]
  36. Jiang, Q.; Wang, G.; Liang, X.; Liu, N. Research on the perception of cultural ecosystem services in urban parks via analyses of online comment data. Landsc. Archit. Front. 2022, 10, 32–51. [Google Scholar] [CrossRef] [Scilit]
  37. Gugulica, M.; Burghardt, D. Mapping indicators of cultural ecosystem services use in urban green spaces based on text classification of geosocial media data. Ecosyst. Serv. 2023, 60, 101508. [Google Scholar] [CrossRef] [Scilit]
  38. Cheng, Y.; Zhao, B.; Peng, S.; Li, K.; Yin, Y.; Zhang, J. Effects of cultural landscape service features in national forest parks on visitors’ sentiments: A nationwide social media-based analysis in China. Ecosyst. Serv. 2024, 67, 101614. [Google Scholar] [CrossRef] [Scilit]
  39. Cheng, X.; Van Damme, S.; Li, L.; Uyttenhove, P. Taking “social relations” as a cultural ecosystem service: A triangulation approach. Urban For. Urban Green. 2020, 55, 126790. [Google Scholar] [CrossRef] [Scilit]
  40. Zhang, H.; Yu, J.; Dong, X.; Zhai, X.; Shen, J. Rethinking cultural ecosystem services in urban forest parks: An analysis of citizens’ physical activities based on social media data. Forests 2024, 15, 1633. [Google Scholar] [CrossRef] [Scilit]
  41. Zheng, T.; Pan, Q.; Yan, Y.; Van De Voorde, T. Integrating cultural ecosystem services and subjective perception in large urban forests: A cross-regional analysis through the lens of language. Urban For. Urban Green. 2025, 113, 129051. [Google Scholar] [CrossRef] [Scilit]
  42. Abate, D.; Botequim, B.; Marques, S.; Lagoa, C.; Guerra-Hernández, J.; Hengeveld, G.; Hoogstra-Klein, M.; Borges, J.G. Recreational and aesthetic values of forest landscapes (RAFL): Quantifying management impacts and trade-offs with provisioning and regulatory ecosystem services. For. Ecosyst. 2025, 13, 100318. [Google Scholar] [CrossRef] [Scilit]
  43. Bhatt, H.; Pant Jugran, H.; Pandey, R. Cultural ecosystem services nexus with socio-cultural attributes and traditional ecological knowledge for managing community forests of Indian western Himalaya. Ecol. Indic. 2024, 166, 112379. [Google Scholar] [CrossRef] [Scilit]
  44. Lyu, B.; Gao, Z.; Wang, Y.; Liu, J.; Zhang, L.; Song, J.; Pan, Y.; Cheng, M.; Liu, S.; Chen, Q.; et al. Seasonal dynamics and trade-offs/synergies of cultural ecosystem services in urban parks: A case study of Chengdu, China. Land 2025, 14, 2126. [Google Scholar] [CrossRef] [Scilit]
  45. Zhang, Q.; Jiang, R.; Jiang, X.; Li, Y.; Cong, X.; Xiong, X. Supply–demand spatial patterns of cultural services in urban green spaces: A case study of Nanjing, China. Land 2025, 14, 1044. [Google Scholar] [CrossRef] [Scilit]
  46. Zhang, Y.; Yu, G.; Zhang, L.; Jung, T.; Xu, H. A deep learning framework for emotion recognition and semantic interpretation of social media images in urban parks: The ULEAF approach. Appl. Sci. 2026, 16, 127. [Google Scholar] [CrossRef] [Scilit]
  47. Dai, P.; Zhang, S.; Chen, Z.; Gong, Y.; Hou, H. Perceptions of cultural ecosystem services in urban parks based on social network data. Sustainability 2019, 11, 5386. [Google Scholar] [CrossRef] [Scilit]
  48. Cao, X.; Jia, X. Impact and mechanism of forest park resource endowment on tourism industry development. Tour. Sci. 2023, 37, 156–175. (In Chinese) [Google Scholar]
  49. Lu, L.; Wu, J.; Dai, S.; Xiong, Y. Research progress on cultural ecosystem service driven by multi-source big data. Landsc. Archit. 2026, 33, 100–108. (In Chinese) [Google Scholar] [CrossRef] [Scilit]
  50. Li, H.; Zeng, W.; Deng, J.; Chen, Y. Analysis of the classification of forest park types in Guangzhou. Hubei For. Sci. Technol. 2018, 47, 39–45. (In Chinese) [Google Scholar]
  51. GB/T 18005-1999; China Forest Park Landscape Resources Grade Evaluation. State Bureau of Quality and Technical Supervision: Beijing, China, 1999.
  52. Haines-Young, R.; Potschin, M.B. Common International Classification of Ecosystem Services (CICES) V5.1 and Guidance on the Application of the Revised Structure; Fabis Consulting Ltd.: Nottingham, UK, 2018; Available online: https://cices.eu/ (accessed on 17 August 2026).
  53. Dalkey, N.; Helmer, O. An experimental application of the Delphi method to the use of experts. Manag. Sci. 1963, 9, 458–467. [Google Scholar] [CrossRef] [Scilit]
  54. Qwen Team. Qwen3.5: Towards Native Multimodal Agents. 2026. Available online: https://qwen.ai/blog?id=qwen3.5 (accessed on 28 July 2026).
  55. Jocher, G.; Qiu, J.; Liu, M.; Lyu, S.; Akyon, F.C.; Kalfaoglu, M.E. Ultralytics YOLO26: Unified real-time end-to-end vision models. arXiv 2026, arXiv:2606.03748. [Google Scholar]
  56. Redmon, J.; Divvala, S.; Girshick, R.; Farhadi, A. You only look once: Unified, real-time object detection. In Proceedings of the 2016 IEEE Conference on Computer Vision and Pattern Recognition (CVPR), Las Vegas, NV, USA, 27–30 June 2016; pp. 779–788. [Google Scholar]
  57. Greenacre, M.; Blasius, J. (Eds.) Multiple Correspondence Analysis and Related Methods; Chapman and Hall/CRC: Boca Raton, FL, USA, 2006. [Google Scholar]
  58. Hoerl, A.E.; Kennard, R.W. Ridge regression: Biased estimation for nonorthogonal problems. Technometrics 1970, 12, 55–67. [Google Scholar] [CrossRef]
  59. Cheng, X.; Xu, P.; Van Damme, S. Evaluating cultural ecosystem services of nature-based solutions in urban renewal using social media data. Forests 2026, 17, 749. [Google Scholar] [CrossRef] [Scilit]
  60. Wang, H.; Su, T.; Zhao, W. Understanding urban park-based social interaction in Shanghai during the COVID-19 pandemic: Insights from large-scale social media analysis. ISPRS Int. J. Geo-Inf. 2025, 14, 87. [Google Scholar] [CrossRef] [Scilit]
Figure 1. The 15 study forest parks in Guangzhou. (Left) Their distribution within the municipal boundary. (Right) The boundary of each park at a common scale, labelled with its area, which ranges from 8831 hm2 at Liuxihe to 123 hm2 at Baijianghu.
Land 15 01586 g001
Figure 2. Research framework. Text (blue) and image (orange) records are paired at the level of the individual post (stage 1), analyzed in parallel to yield perceived shares of nine cultural ecosystem services and 28 landscape elements (stage 2), and then related to one another at two levels of aggregation—a descriptive correspondence analysis across all 15 parks and exploratory within-park regressions in four case parks (stage 3).
Land 15 01586 g002
Figure 3. Exemplar images for the 28 landscape-element classes, grouped into natural environment, built facilities, and human activity.
Land 15 01586 g003
Figure 4. Temporal distribution of perceived cultural ecosystem services, 2020–2024.
Land 15 01586 g004
Figure 5. Perceived share of the 28 landscape elements across the Guangzhou forest parks.
Land 15 01586 g005
Figure 6. Multiple correspondence analysis of the 26 × 9 element-service matrix. Points are the dimension 1 and dimension 2 scores for the nine cultural ecosystem services (diamonds) and the 26 retained landscape elements (circles). Proximity indicates association in the reduced space.
Land 15 01586 g006
Figure 7. Landscape elements whose association with cultural ecosystem services reverses sign. Rows are the 15 of 27 significant elements that carry both a positive and a negative coefficient; columns are the nine services. Each mark gives the sign and the park (S Shimen, B Baishuizhai, M Maofeng, D Dafu). Derived from Table 5.
Land 15 01586 g007
Table 1. The 15 study forest parks in Guangzhou.
LevelNameArea (ha)Core Landscape Resources
NationalLiuxihe National Forest Park8831Forest landscape, stream landscape
NationalShimen National Forest Park2636Forest landscape, peaks, flower seas
NationalSouth China National Botanical Garden282.5Rare plants, garden landscape
NationalBaiyun Mountain Scenic Area2098Peaks, viewing platforms, woodland
ProvincialMaofeng Mountain Forest Park5362Peaks, woodland, cultural sites
ProvincialTianluhu Forest Park880Forest landscape, lake, aquatic vegetation
ProvincialFenghuang Mountain Forest Park800Woodland, peaks, wildlife
ProvincialBaishuizhai Scenic Area1700Waterfall, streams, woodland
ProvincialLianhua Mountain Scenic Area487Peaks, ancient quarry, woodland
MunicipalDafu Mountain Forest Park600Woodland, greenways, leisure facilities
MunicipalHuolu Mountain Forest Park600Woodland, fitness facilities
MunicipalFengyunling Forest Park421.5Mountains, cultural sites
MunicipalLongyandong Forest Park453.33Woodland, caves, historic relics
MunicipalDishuiyan Forest Park486Gorge, waterfall, woodland
MunicipalBaijianghu Forest Park123Lake, hydrological landscape, gorge
Table 2. The nine cultural ecosystem service indicators.
CodeCES IndicatorDescription (Example Keywords)
AAesthetic appreciationVisual/sensory beauty of scenery, water, flowers, seasonal change
BSocial interaction and relationshipsSocializing with family/friends (family, friends, parent-child time)
CEnvironment and biodiversityPerception of plant/animal resources and ecosystems (birdsong, wildlife)
DScientific research and nature educationLearning natural science (education, science popularization)
ECultural diversity and heritageTangible/intangible cultural-historical information (history, relics)
FRecreation and ecotourismLeisure activities (walking, hiking, cycling, photography, camping)
GForest health and wellnessRelaxation, stress relief, health (fresh air, tranquil, restorative)
HInspirationCreative/artistic stimulation (inspiration, creation, art)
ISense of place and spiritual attachmentAttachment and identity with the place (belonging, nostalgia, memory)
Table 3. Perceived cultural ecosystem services across the 15 forest parks, 2020–2024. N is the number of CES-term occurrences; the percentage is the share of all CES-term occurrences.
Cultural Ecosystem ServiceN (Occurrences)Share (%)
Aesthetic appreciation75,11023.93
Social interaction and relationships20,6096.57
Environment and biodiversity22,0567.03
Scientific research and nature education57371.83
Cultural diversity and heritage10,9613.49
Recreation and ecotourism121,79738.81
Forest health and wellness25,1128.00
Inspiration39411.26
Sense of place and spiritual attachment28,4979.08
Total313,820100.00
Table 4. Sentiment composition by forest park (%).
LevelParkPositiveNeutralNegative
NationalLiuxihe National Forest Park63.9024.6011.48
NationalShimen National Forest Park74.5320.085.38
NationalSouth China National Botanical Garden74.8521.533.60
NationalBaiyun Mountain Scenic Area78.0318.553.41
ProvincialMaofeng Mountain Forest Park66.2427.406.34
ProvincialTianluhu Forest Park66.0525.708.24
ProvincialFenghuang Mountain Forest Park68.0327.054.90
ProvincialBaishuizhai Scenic Area73.2820.656.05
ProvincialLianhua Mountain Scenic Area76.5020.003.49
MunicipalDafu Mountain Forest Park81.2116.722.06
MunicipalHuolu Mountain Forest Park70.1725.104.72
MunicipalFengyunling Forest Park82.1516.870.97
MunicipalLongyandong Forest Park49.4236.8813.68
MunicipalDishuiyan Forest Park69.4926.484.01
MunicipalBaijianghu Forest Park78.2719.362.35
Table 5. Ridge-regression results for the four case parks, all fitted models.
Park (Level)Cultural Ecosystem ServiceSignificant Positive ElementsSignificant Negative ElementsF-Test pAdj. R2
Shimen (national)Aesthetic appreciationSeasonal forest, flowers0.0000.027
Shimen (national)Scientific research and nature educationHillside, fish, birds, cats and dogs, bulletin board0.0000.019
Shimen (national)Recreation and ecotourismSeasonal forest, dense forest, cats and dogs0.0030.013
Shimen (national)Forest health and wellnessDense forest, parent-child families, wellness trail0.0440.007
Shimen (national)Sense of place and spiritual attachmentCats and dogs, insects, fitness activitiesRoad, signage0.0030.013
Shimen (national)Environment and biodiversityn.s.n.s.>0.05
Shimen (national)Social interaction and relationshipsn.s.n.s.>0.05
Shimen (national)Cultural diversity and heritagen.s.n.s.>0.05
Shimen (national)Inspirationn.s.n.s.>0.05
Baishuizhai (provincial)Aesthetic appreciationHillside, lake, waterfall, wetland0.0170.011
Baishuizhai (provincial)Environment and biodiversityGround cover, lake, forest clearing0.0400.008
Baishuizhai (provincial)InspirationDense forest, sky, pavilion and corridorHillside, lake, waterfall, signage0.0000.028
Baishuizhai (provincial)Recreation and ecotourismSignage, bulletin boardFlowers, building, wetland0.0010.017
Baishuizhai (provincial)Sense of place and spiritual attachmentFlowers, pavilion and corridor, fitness activitiesBulletin board0.0000.019
Baishuizhai (provincial)Social interaction and relationshipsn.s.n.s.0.0880.006
Baishuizhai (provincial)Scientific research and nature educationn.s.n.s.0.2150.003
Baishuizhai (provincial)Forest health and wellnessn.s.n.s.0.647−0.002
Baishuizhai (provincial)Cultural diversity and heritagen.s.n.s.0.731−0.003
Maofeng (provincial)Aesthetic appreciationSeasonal forest, garden ornaments, wetland, parent-child familiesRecreational facilities, fitness activities0.0000.082
Maofeng (provincial)Recreation and ecotourismTree-shrub mixed forest, hillside, lake, birds, road, sculpture0.0040.021
Maofeng (provincial)Sense of place and spiritual attachmentRecreational facilities, fitness activitiesTree-shrub mixed forest, lake, road, boardwalk0.0000.038
Maofeng (provincial)Inspirationn.s.n.s.0.0780.010
Maofeng (provincial)Scientific research and nature educationn.s.n.s.0.0990.009
Maofeng (provincial)Forest health and wellnessn.s.n.s.0.1030.009
Maofeng (provincial)Environment and biodiversityn.s.n.s.0.1180.008
Maofeng (provincial)Social interaction and relationshipsn.s.n.s.0.1210.008
Maofeng (provincial)Cultural diversity and heritagen.s.n.s.0.604−0.002
Dafu (municipal)Aesthetic appreciationSeasonal forest, flowers, buildingRecreational facilities0.0000.050
Dafu (municipal)Social interaction and relationshipsRecreational facilities, garden ornaments, fitness activities0.0000.048
Dafu (municipal)Cultural diversity and heritageInsects, garden ornaments0.0000.040
Dafu (municipal)Sense of place and spiritual attachmentDense forest, birds, insectsLake, signage0.0020.034
Dafu (municipal)Recreation and ecotourismn.s.n.s.0.0560.016
Dafu (municipal)Forest health and wellnessn.s.n.s.0.3350.003
Dafu (municipal)Environment and biodiversityn.s.n.s.0.766−0.007
Dafu (municipal)Scientific research and nature educationn.s.n.s.0.834−0.009
Dafu (municipal)Inspirationn.s.n.s.0.972−0.016
Elements listed reached p < 0.05; “—” indicates no element of that sign reached significance in a model that passed the overall F-test; “n.s.” indicates the model itself did not pass the F-test at p < 0.05. R2 is adjusted. All VIF < 10. No correction for multiple comparisons is applied; see Section 2.6.
Disclaimer/Publisher’s Note: The statements, opinions and data contained in all publications are solely those of the individual author(s) and contributor(s) and not of MDPI and/or the editor(s). MDPI and/or the editor(s) disclaim responsibility for any injury to people or property resulting from any ideas, methods, instructions or products referred to in the content.