Article

System Dynamics Simulation of the Resilience of Sustainable Food Systems in Urban–Rural Transition Zones Empowered by Digitalization

1
School of Entrepreneurship, Zhejiang University of Finance & Economics Dongfang College, Haining 314408, China
2
School of Marxism, Tongji University, Shanghai 200092, China
3
School of Business, Nanjing University, Nanjing 210093, China
*
Author to whom correspondence should be addressed.
Land 2026, 15(9), 1546; https://doi.org/10.3390/land15091546
Submission received: 14 July 2026 / Revised: 10 August 2026 / Accepted: 21 August 2026 / Published: 24 August 2026

Abstract

Rapid urbanization has led to habitat fragmentation in peri-urban areas, continuously eroding the ecological foundation of sustainable food systems in urban–rural transition zones and posing a real threat to regional food security. Against the backdrop of urbanization disturbances, traditional nature-based solutions have limitations in addressing socioecological nonlinear responses, whereas digital tools offer new governance pathways for enhancing food system resilience. To elucidate the intrinsic mechanisms through which digital technology empowers the resilience of peri-urban food systems, this study, which is grounded in ecological wisdom theory, constructs a system dynamics model that integrates “digital technology-ecological perception-ecological wisdom capital” in a three-dimensional linkage. This model simulates the dynamic process through which sustainable food systems in urban–rural transition zones resist the risks of habitat fragmentation and achieve synergistic steady-state evolution. According to the simulation results, a synthesized steady-state transition in sustainable food systems can be regarded as a self-organizing phase transition process. During resource metabolism, system elements show strong nonlinear symbiotic and mutually beneficial features. Further, there is a significant time-lag effect on improving food system resilience through digital technology empowerment and policy coordination. Also, the effects of governance are not immediately visible. Further, as an important instrumental empowerment carrier, urban–rural spatial and information barriers can be broken through means like digital ecological monitoring. Moderate investment in this regard can promote the acceleration of the system’s self-organizing phase transition. Also, this can enhance resilience against disturbance from habitat fragmentation while ensuring food production and supply. Finally, the ecological carrying capacity of core food production spaces does not increase monotonically. This means that the system possesses an adaptive cyclical fluctuation mechanism, with a periodic oscillatory evolution of carrying capacity. This study breaks through static analytical paradigms, fills the quantitative research gap on the resilience evolution of peri-urban food systems driven by the integration of digital technology and ecological wisdom, and can provide scientific evidence and decision-making support for food–ecological collaborative governance in China’s urban–rural transition zones.

1. Introduction

The world is entering a new era centered on the collaborative governance of development and the environment, with the pursuit of sustainable development becoming a shared vision of human societies [1,2]. As cities serve as key engines for driving the implementation of sustainable development goals, increasing attention is being given to the sustainability of their development pathways [1,3], and the pace of urbanization continues to accelerate. According to UN-Habitat statistics, more than half of the global population currently resides in urban areas, and this proportion is expected to increase to 68% by 2050 [4], making the trend of urbanization irreversible. However, while rapid urbanization promotes socioeconomic progress, it also triggers a series of severe challenges, such as ecosystem degradation [5,6]. The ecological evolution of urban–rural systems and their derived social consequences impose constraints on the overall achievement of sustainable development goals that cannot be ignored [7,8,9,10]. In urban–rural fringe areas, urban expansion presents a pattern of “cities surrounding villages, buildings cutting through nature,” leading to habitat fragmentation and the degradation of ecosystem services, which directly threaten the already fragile food systems in these regions. Peri-urban agricultural food systems are not only important sources of fresh agricultural products for cities but also the core carriers of farmland protection and biomass resource cycling. Their multifunctional transformation, ecological degradation, and conflict with the food supply have been identified as high-priority sustainability challenges [11]. Habitat fragmentation compresses space for food production and disrupts key ecosystem service flows, such as pollination, soil conservation, and water retention, thereby posing systemic risks to the stability and security of the urban food supply by undermining the cycling pathways of resource metabolism. Thus, correct valuation of ecosystem services of peri-urban agricultural spaces and understanding their deep interconnections with the resilience of food systems are prerequisites in order to reduce the disjointed logic among policies and stakeholder perceptions and coordinate regional ecological protection and agricultural development [12].
In the context of this challenge, nature-based solutions (NbS) offer a crucial approach to habitat restoration and food system resilience in urban–rural fringe zones. Previous research has indicated that NbS can leverage natural processes to address complex environmental and social challenges and restore degraded habitats and enhance landscape connectivity and ecosystem service supply capacity, thereby reversing the trend of habitat fragmentation [13,14]. Empirical studies in six European countries and urban and peri-urban areas in China have also confirmed that NbS is significantly effective at promoting ecological restoration, enhancing ecosystem services, and advancing sustainable urbanization [15]. Notably, the contribution of NbS to food system resilience extends beyond ecological restoration; by restoring pollination networks, improving soil fertility, and regulating microclimates, NbS directly strengthens the ecological foundation of food production. However, urban–rural fringe zones are complex social–ecological systems that are heavily disturbed by anthropogenic activities and are characterized by highly nonlinear and uncertain dynamics. Relying solely on traditional NbS often makes it difficult to achieve rapid responses and precise adaptation to critical changes. In recent years, the rapid development of digital technologies, artificial intelligence, and ecological information sensing has opened new possibilities for overcoming bottlenecks. The ability to capture both high-spatial and high-temporal resolution information on the status of habitats and the flow of ecosystem services can turn information into a useful resource. This, in turn, enables the precise siting, effect monitoring, and adaptive regulation of NbS, turning static ecological restoration into active resilience governance. Scholars noted that the use of digital technologies and artificial intelligence can help increase efficiency in agricultural production, minimize food waste, and make food systems more sustainable [16], and such technologies have a major data-supportive role in the promotion of sustainable agriculture and the bioeconomy [17]. Nevertheless, current research on the resilience of food systems in urban–rural fringe zones does not elaborate on how digitalization could be combined with NbS to systematically mitigate food security risks through enhanced ecological intelligence caused by the fragmentation of habitats.
Before further analysis of the aforementioned research gaps, it is necessary to review the foundational research progress on habitat restoration and spatial governance within urban–rural fringe zones. Habitat fragmentation leads to biodiversity loss, substantial damage to core ecosystem functions, and exacerbation of the degradation of ecosystem services, making restoration measures that increase landscape connectivity extremely urgent [18]. Fahrig systematically distinguished the independent effects of habitat area loss and spatial configuration fragmentation, further emphasizing the critical importance of addressing habitat fragmentation for biodiversity conservation [19]. Maintaining landscape connectivity positively contributes to ensuring ecosystem service supply and biodiversity maintenance, whereas habitat fragmentation disrupts ecological processes and weakens ecosystem regulation and service efficiency [20,21]. In terms of spatial governance, Rahmoun and Zhao developed a spatial structure model to support sustainable urban–rural development. The model uses strategic clusters and spatial networks [22]. Aflaki Samani et al. proposed a step-by-step planning approach for informal settlements. This approach aims to reduce spatial inequality and improve land management efficiency [23]. Overall, the existing research has four significant limitations in terms of addressing the resilience of peri-urban food systems. First, most studies fail to systematically link digital technologies, ecological wisdom, and the food-ecological coupling resilience of urban–rural fringe zones; in particular, dynamic simulation analyses of resource metabolism processes and security assurance capacities within food systems are lacking. Although the value of digital technologies in empowering agriculture and food systems has been recognized by the academic community, research based on system dynamics modelling in urban–rural fringe zones to reveal the synergistic effects of digital technologies and NbS is scarce. Second, research perspectives often adopt static empirical analyses, making it difficult to elucidate the multiloop, nonlinear dynamic interaction mechanisms between digital empowerment and ecological restoration in urban–rural fringe zones. Third, existing studies often examine the effects of digital technologies, the ecological impacts of urbanization, or individual NbS cases separately. Few studies combine digital technologies, ecological knowledge, and the resilience of peri-urban social–ecological systems into one framework for integrated analysis. Moreover, the link between resilience building and the coupling mechanisms of sustainable food systems remains unclear. Fourth, current research also shows a practical bias. Ecological protection practices mainly focus on the conservation and management of natural reserves. Less attention has been paid to urban–rural fringe areas, which have complex feedback processes and provide both urban food supply and ecological security functions.
On the basis of the aforementioned gaps, this study attempts to construct a system dynamics model with a three-dimensional linkage of “digital technology empowerment–ecological wisdom accumulation–system resilience building–food system sustainability,” focusing on whether and how digitalization can enhance the resilience of peri-urban food systems against habitat fragmentation by strengthening the implementation effectiveness of NbS. The model measures key variables, including the application level of digital technologies, ecological wisdom capital, ecological perception and accounting capabilities, system resilience, and resource metabolic efficiency. It examines how food systems in urban–rural fringe zones evolve from fragmented states toward synergistic and sustainable states, with a focus on evolutionary pathways and threshold effects.
This study follows the logic of “digital technology as the driving force → ecological wisdom capital as the regulatory factor → system resilience as the adaptive response → food system sustainability as the co-evolutionary outcome.” It aims to uncover the mechanisms behind resilience development and transition in urban–rural fringe food systems. Specifically, this study addresses three key questions: First, can digital technologies promote the accumulation of ecological wisdom capital and improve system synergy by enhancing ecological perception and accounting capabilities? Can they also strengthen the role of NbS in habitat restoration and food security? Second, what feedback loops and coupling mechanisms link resource metabolic efficiency with ecological resilience in urban–rural fringe food systems? Third, which key leverage variables help urban–rural fringe food systems cross critical thresholds and shift from fragmented states to synergistic and sustainable states?
To address these questions, this study starts from the two dimensions of technology and ecological wisdom and uses system dynamics methods to describe and quantify the roles of technological and ecological wisdom factors in the influencing process. It simulates the dynamic process through which digital technology drives urban–rural fringe food systems to resist habitat fragmentation and achieve synergistic and sustainable development and identifies the key mechanisms affecting system transition. This approach has academic value in several ways. First, system dynamics provide an effective tool for describing the multiple feedback loops and nonlinear relationships in the co-evolution between digital technologies and urban–rural fringe food systems. It helps fill the theoretical gap in understanding how resilience develops in peri-urban food systems from a dynamic perspective and provides a methodological reference for future studies. However, through simulation studies, different policy intervention scenarios can be modelled to obtain predictive data, providing more forward-looking scientific evidence for the governance of urban–rural fringe food systems. Additionally, this study introduces abstract concepts, such as “ecological wisdom capital” and “ecological perception and accounting capabilities,” into system dynamics analysis. It explores the key factors that help urban–rural fringe food systems cross synergistic thresholds. This approach addresses the limitation of traditional urban–rural governance studies, which often focus more on empirical description than on identifying underlying mechanisms. This study also provides a new application of advanced system dynamics models in urban–rural sustainable governance research. It strengthens the theoretical understanding of the co-evolution of urban–rural fringe food systems and expands the use of dynamic system theory in studies of urban–rural sustainable development.

2. Literature Review and Research Methods

2.1. The Connotation and Conceptual Definition of Key Variables

The core concepts addressed in this study follow a logical hierarchy of “Objective-State-Driving Force.” The sustainable food system is the main focus of this study. The resilience of the food–ecology coupled system and the synergy between food systems and landscape resource metabolism are the key variables used to describe the system’s operating state. Digital technologies and ecological wisdom capital are the main driving forces behind system evolution. These concepts are defined below.
(1)
Sustainable Food Systems: Components of the Objective
The sustainable food system is the ultimate dependent variable in this study. Drawing on the definition framework of the Food and Agriculture Organization of the United Nations [24], this study defines it as a system capable of continuously providing food security and nutrition across the three dimensions of the economy, society, and environment, without compromising the ecological foundation for future generations to meet their food needs. Specifically, its components include three pillars: economic sustainability (the economic viability and efficiency of food production activities), social sustainability (the fairness and accessibility of food distribution), and environmental sustainability (the minimal dependence on and depletion of ecosystem services by food production). In the context of the urban–rural fringe, which is the focus of this study, the sustainable food system is further operationalized as a system that, under the pressure of habitat fragmentation, can maintain the ecological foundation for food production, ensure the stability of the food supply for both urban and rural areas, and achieve closed-loop resource metabolism. This operational definition prioritizes environmental sustainability, emphasizing that economic and social sustainability can be realized only by restoring and maintaining healthy ecosystems. In the subsequent system dynamics model, the degree of realization of a sustainable food system is represented by the coupled evolution of the system resilience index and the resource metabolism synergy index.
(2)
Resilience of the Food–Ecology-Coupled System: System Capacity to Cope with Shocks
The concept of resilience originates from the Latin word “resilio” or “reilire,” meaning “to bounce back or rebound” [25], and was later introduced into the fields of ecology and social-ecological systems research. References to urban resilience are increasing [26]. The Intergovernmental Panel on Climate Change [27] defines resilience as the capacity of a system to cope with hazardous events, trends, or disturbances while maintaining its core functions and structural integrity during change. It is considered a positive attribute when it encompasses the ability to adapt, learn, or transform. The United Nations Office for Disaster Risk Reduction [28] views it as the ability of a system or community exposed to hazards to possess six capacities: to resist, absorb, adapt, adjust, transform, and recover, emphasizing the timeliness and effectiveness of the response.
At a more specific ecological level, resilience refers to the ability of an ecosystem to maintain its stable state when subjected to shocks [29]. The resilience of urban and rural systems can be enhanced through interdependent relationships and partnerships [15].
The resilience of the food–ecology coupled system proposed in this study is a contextualized definition based on the aforementioned resilience theories. It views urban and rural areas as one integrated system and focuses on the social–ecological system where food production, ecological security, and socio-economic factors interact across the urban–rural continuum. It examines three types of capacity. First, resistance capacity refers to the ability to withstand disturbances, such as habitat fragmentation, resource pressure, and climate variability, while maintaining basic food production functions. Second, recovery capacity refers to the ability to return to the original functional state after disturbances. Third, transformation capacity refers to the ability to shift toward a more sustainable state under long-term pressure by changing system structures, such as adopting NbS and applying digital technologies. In contrast to the general concept of ecological resilience, this concept emphasizes the coupling of food production and ecological functions; enhancing resilience must simultaneously serve the dual goals of food security and ecosystem health. This resilience inherently includes the capacity to restore habitats, improve landscape connectivity, and enhance ecosystem service supply through nature-based solutions, thereby consolidating the ecological foundation for food production. At the model quantification level, the system resilience index is represented on a standardized scale of 0–1, with an initial value set at 0.35, reflecting the system’s typical transitional state between vulnerability and resilience. Its dynamic evolution is driven by the evolution of resilience and decay rates.
(3)
Food system–landscape resource metabolism synergy: Degree of evolution from disorder to order
Synergistic phenomena exist in all domains of nature. Synergetics originated from general systems theory and was formally established by the German Professor Hermann Haken in the 1970s. In any complex open system, the interactions and mutual influences among its internal subsystems generate comprehensive and collective effects, namely, synergistic effects, that drive the system from disorder to order, resulting in the formation of stable structures [30].
In this study, the degree of synergy between food system and landscape resource metabolism specifically refers to the degree of synergy between the food system and surrounding landscapes in urban–rural fringe areas, particularly in terms of the flow and transformation of key elements such as water resources, energy, and biomass required for food production. This concept characterizes the evolutionary progression of the food system from disordered fragmentation to orderly synergy, and its essence can be understood as the reduction in the mismatch coefficient of food production factors between urban and rural areas. When habitat fragmentation obstructs resource metabolism pathways, the degree of synergy decreases, and the system tends toward fragmentation. Conversely, when digital technology empowerment and NbS implementation restore the metabolic network, the degree of synergy increases, and the system moves toward synergy. This study argues that the inefficient resource utilization of food systems in urban–rural fringe areas stems from factor market segmentation and that the essence of improvement in the degree of synergy is precisely the bridging of this segmentation and the correction of mismatches. The system’s evolutionary process follows the principle of self-organization; the transition of the food system from fragmentation to synergistic sustainable development is essentially a process of self-organized phase transition. At the model quantification level, the degree of synergy is represented by a 0–1 standardized dimension, with an initial value set at 0.35, reflecting the current state of factor market segmentation and obstructed metabolic pathways. Its dynamic evolution is driven by synergy evolution and fragmentation degradation rates. The synergy evolution rate is regulated by factors such as the degree of information asymmetry, interest conflicts, and the level of digital technology empowerment and decreases as the degree of synergy approaches its upper limit, presenting a nonlinear characteristic of convergence toward a steady state.
(4)
Ecological Wisdom Capital of the Food System: Inherent Regulatory and Buffering Mechanism of the System
Natural capital represents the stock of resources that supply ecosystem services [31], whereas ecological capital emphasizes the material cycling and energy flow functions of ecosystems [32,33,34]. However, both focus on the stock and functions of the natural background, making it difficult to encompass the proactive dimensions of human society, such as ecological cognition, experiential learning and adaptive governance.
The concept of ecological wisdom capital for food systems proposed in this study extends existing research by addressing these limitations. Its theoretical basis comes from four perspectives: symbiosis theory, social–ecological memory and adaptive management, and ecological wisdom theory. Symbiosis theory provides the value foundation of human–land mutualism [35]. Social–ecological memory and adaptive management highlight the continuous adjustment of governance strategies through learning processes [36,37,38]. Ecological wisdom theory combines long-term practical knowledge with ethical judgment to support governance practices [39,40].
Accordingly, ecological wisdom capital for food systems is defined as the cognitive assets accumulated by urban–rural fringe social–ecological systems to support adaptive governance and sustainable food system management. It includes three connected dimensions. First, ecological cognitive capital refers to ecological knowledge from both scientific research and local practices. Second, adaptive governance capacity capital refers to the ability to adjust institutions and spatial planning in response to disturbances. In NbS applications, this includes the ability to assess restoration plans and support organizational learning. Third, normative-value capital refers to shared cultural values and institutional arrangements that promote human–land symbiosis.
Together, these three dimensions shape the direction of digital technology application, affect the metabolic efficiency of food systems and landscape resources, and support the development of green infrastructure. In NbS practices, they determine whether peri-urban areas can identify suitable locations and timing for habitat restoration, evaluate restoration results, and transform practical experience into long-term adaptive governance capacity. In the model, this variable is standardized on a 0–1 scale, with an initial value of 0.4. This indicates that the system has basic ecological knowledge and governance experience but has not yet reached the level of effective adaptive governance. Its evolution depends on both accumulation and loss rates. The accumulation rate is influenced by multiple factors, including digital technology adoption, system synergy, and heat island intensity.
(5)
Digital Technology: An Exogenous Driving Force Empowering the Precise Implementation of NbS
As a key auxiliary variable, digital technology plays an important role in supporting the accurate implementation and adaptive management of NbS in urban–rural food systems. With increasing investment and wider use of technologies such as IoT-based environmental monitoring, satellite remote sensing for habitat mapping, and ecological big data, the application level and maturity of digital technologies continue to improve, strengthening their supporting role.
Specifically, digital technologies provide high-resolution data on habitat conditions and ecosystem service flows. This information supports the precise location, monitoring, and adjustment of NbS, shifting ecological restoration from a static process to a dynamic approach based on resilience governance. At the same time, as an external driving force, digital technology reduces information gaps in food ecosystem governance, supports the accurate implementation of payments for ecosystem services, and lowers the barriers for ecological wisdom capital to reach critical thresholds. As a result, it helps food systems move from fragmented and unstable states toward more coordinated and sustainable structures.
In the model, the application level and maturity of digital technologies are treated as key auxiliary variables. Their initial values are set at a medium–low level based on the current digital infrastructure of the study area. These values then change dynamically through feedback between policy accumulation effects and ecological perception capabilities.

2.2. Theoretical Review of the Relationships Among Key Variables

In the conceptual framework above, a sustainable food system constitutes the ultimate research objective, the realization of which depends on the enhancement of system resilience and synergy, which in turn relies on the interactive drive between digital technology and ecological wisdom capital. The principle of symbiosis serves as a crucial theoretical foundation for understanding the construction of sustainable food systems in urban–rural ecotones [41]. Urban–rural ecotones are core carriers of the urban food supply, farmland protection, and biomass resource cycling. Habitat fragmentation and ecological degradation directly compress food production space and disrupt the resource metabolism cycle of food systems, becoming key bottlenecks constraining the construction of sustainable food systems. From the perspectives of symbiosis theory and synergetics, the evolution of sustainable food systems in urban–rural ecotones from a state of disordered fragmentation to one of ordered synergy can essentially be interpreted as a self-organizing phase transition process within the system driven by digital technology at the foundational level, with ecological wisdom capital as the core regulatory variable. During this evolutionary process, digital technology, food system–landscape resource metabolism synergy, and ecological wisdom capital act as three closely connected driving factors. Together, they help the system overcome resource constraints and spatial barriers caused by habitat fragmentation, moving it toward a stable state where food production and ecological functions are coordinated. This study elucidates the mechanism of action from the following three key dimensions: digital technology, through its empowerment of nature-based solutions (NbS), indirectly influences resource metabolism synergy and the accumulation of ecological wisdom capital, jointly driving the system’s phase transition. First, the dimension of digital technology encompasses technical means such as IoT environmental monitoring, satellite remote sensing mapping, and ecological credit blockchain. As carriers of ecological perception and accounting capabilities, these technologies enable the system to promptly identify the evolving trends of food production space and ecological baselines through real-time dynamic monitoring and precise quantitative assessment, providing a data foundation for subsequent food system governance. In the implementation of NbS, these digital tools are specifically manifested in the suitability assessment of habitat restoration plans, dynamic monitoring of natural process recovery effects, and adaptive regulation of NbS. As an important external driving force, digital technology reduces information gaps in the governance of food system resource metabolism and supports the accurate implementation of payments for food ecosystem services. It therefore creates a basic perception–feedback–regulation loop within urban–rural symbiotic systems.
Second, food system–landscape resource metabolism synergy focuses on the flow and conversion efficiency of key resources, including water, carbon, and biomass energy, required for food production in urban–rural fringe areas. Only when these resources form an efficient and closed-loop metabolic network between urban and rural areas can the resource cycle of the food system be restored. This allows the system to overcome fragmented resource use caused by habitat fragmentation and move toward a state that improves both food security and ecological resilience.
Third, ecological wisdom capital serves as an internal regulatory and buffering mechanism. It helps reduce environmental pressures caused by urban–rural development, improves the resilience of the food–ecology coupled system, and strengthens the ability of the system to maintain food supply under external shocks and disturbances. It also supports the fair distribution and coordinated development of green infrastructure. Within the broader urban–rural development system, ecological wisdom capital regulates the application of digital technology, the efficiency of food system–landscape resource metabolism, and the allocation of green infrastructure.
In NbS applications, ecological wisdom capital determines whether urban–rural systems can identify suitable timing and locations for habitat restoration, evaluate the ecological effects of nature-based solutions, and transform restoration experience into long-term adaptive governance capacity.
Together, these three dimensions form a synergistic evolutionary framework of “perception–metabolism–regulation,” with digital technology supporting NbS implementation as a key link. This framework drives the self-organized transition of urban–rural fringe food systems from fragmented and disordered states toward coordinated and orderly states, as shown in Figure 1.

2.2.1. Principles of Model Variable Screening and Causal Logic Extraction

To avoid subjective arbitrariness in variable selection and causal determination, this study strictly follows a three-step extraction process: “theoretical domain definition, literature co-occurrence screening, and theoretical anchoring of polarity.” All the variables and their relationships clearly support the literature.
(1) Initial Delineation and Screening Criteria of the Variable Library
This study first systematically collected and reviewed the relevant literature from the Web of Science Core Collection and the China National Knowledge Infrastructure (CNKI) over the past 25 years (2005–2025) (twenty-five—2000), focusing on core topics such as “digital technology and urban–rural governance,” “ecological wisdom and socio-ecological systems,” “resilience systems,” “resilience theory and habitat fragmentation,” and “sustainable food systems.” Through careful reading of the abstracts of these documents and full-text studies of the key literature, this study extracted variables closely related to the co-evolutionary process of the food system in the urban–rural ecotone from existing theoretical frameworks, empirical findings, and case discussions.
The inclusion of variables follows these criteria: (1) they are repeatedly discussed in studies related to food system governance in urban–rural transition zones, demonstrating a high degree of theoretical consensus; (2) they possess clear theoretical connotations and can be operationalized as stock or flow variables in system dynamics models; and (3) they are directly relevant to the logical chain of “technology empowerment–wisdom accumulation–resilience–pressure feedback”, which is the focus of this study. On the basis of these criteria, this study ultimately extracted eight core variables from numerous elements addressed in the literature: the breadth of digital technology application, ecological wisdom capital, community participation, ecological resilience, the urban–rural development gap, resource metabolic efficiency, resource pressure, and external shock intensity.
(2) Basis for Determining Causal Loops and Polarity
The polarity (+/−) of each causal chain in model i is determined on the basis of system dynamics norms, established norms, and mature theoretical support rather than subjective empirical judgment. The specifics are as follows:
1. Positive feedback (+): When an increase in the independent variable leads to an increase in the dependent variable (or a decrease in the independent variable leads to a decrease in the dependent variable), this relationship is consistently supported by existing theory. For example, “breadth of digital technology application → ecological perception accounting capability” is positive (+), on the basis of “technology diffusion reduces information asymmetry” theory from information economics [42]; “ecological wisdom capital → community participation” is positive (+), on the basis of “adaptive governance” from social-ecological systems theory [37].
2. Negative feedback (−): When an increase in the independent variable leads to a decrease in the dependent variable (or when a decrease in the independent variable leads to an increase in the dependent variable). For example, “urban–rural development gap → willingness to invest in digital technology” is negative (−), on the basis of the classic argument in investment expectation theory that “an excessive gap inhibits long-term investment return expectations” [43]; “intensity of external shocks → resource pressure on resources” is positive (+), on the basis of the consensus in disaster resilience theory that “disturbance inputs exacerbate system pressure” [29].
All causal chains in this study underwent a cross-comparison process with the literature to ensure that each chain was supported by existing independent theoretical or empirical research, thereby guaranteeing reproducibility and verifiability. This ensured the reproducibility and traceability of the polarity determination.
(3) Inclusion and exclusion criteria for feedback loops
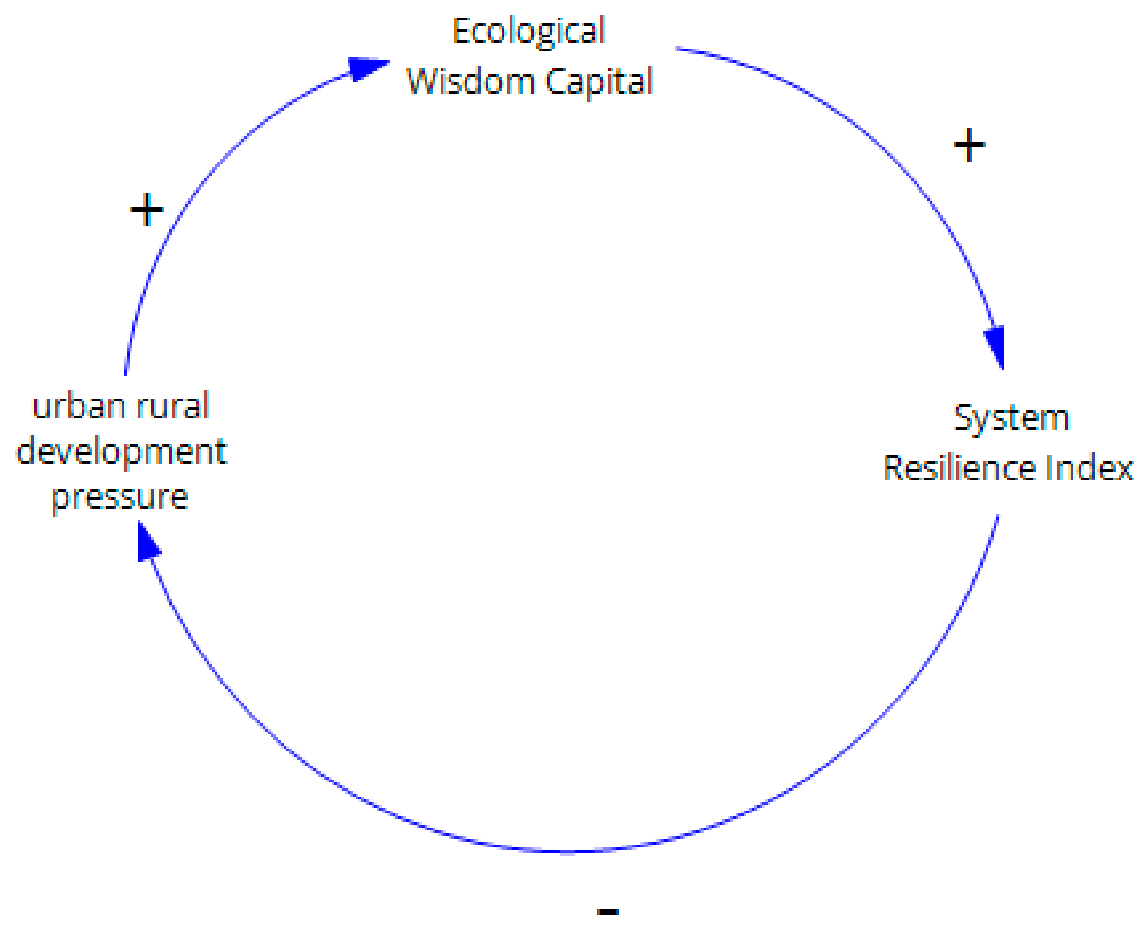
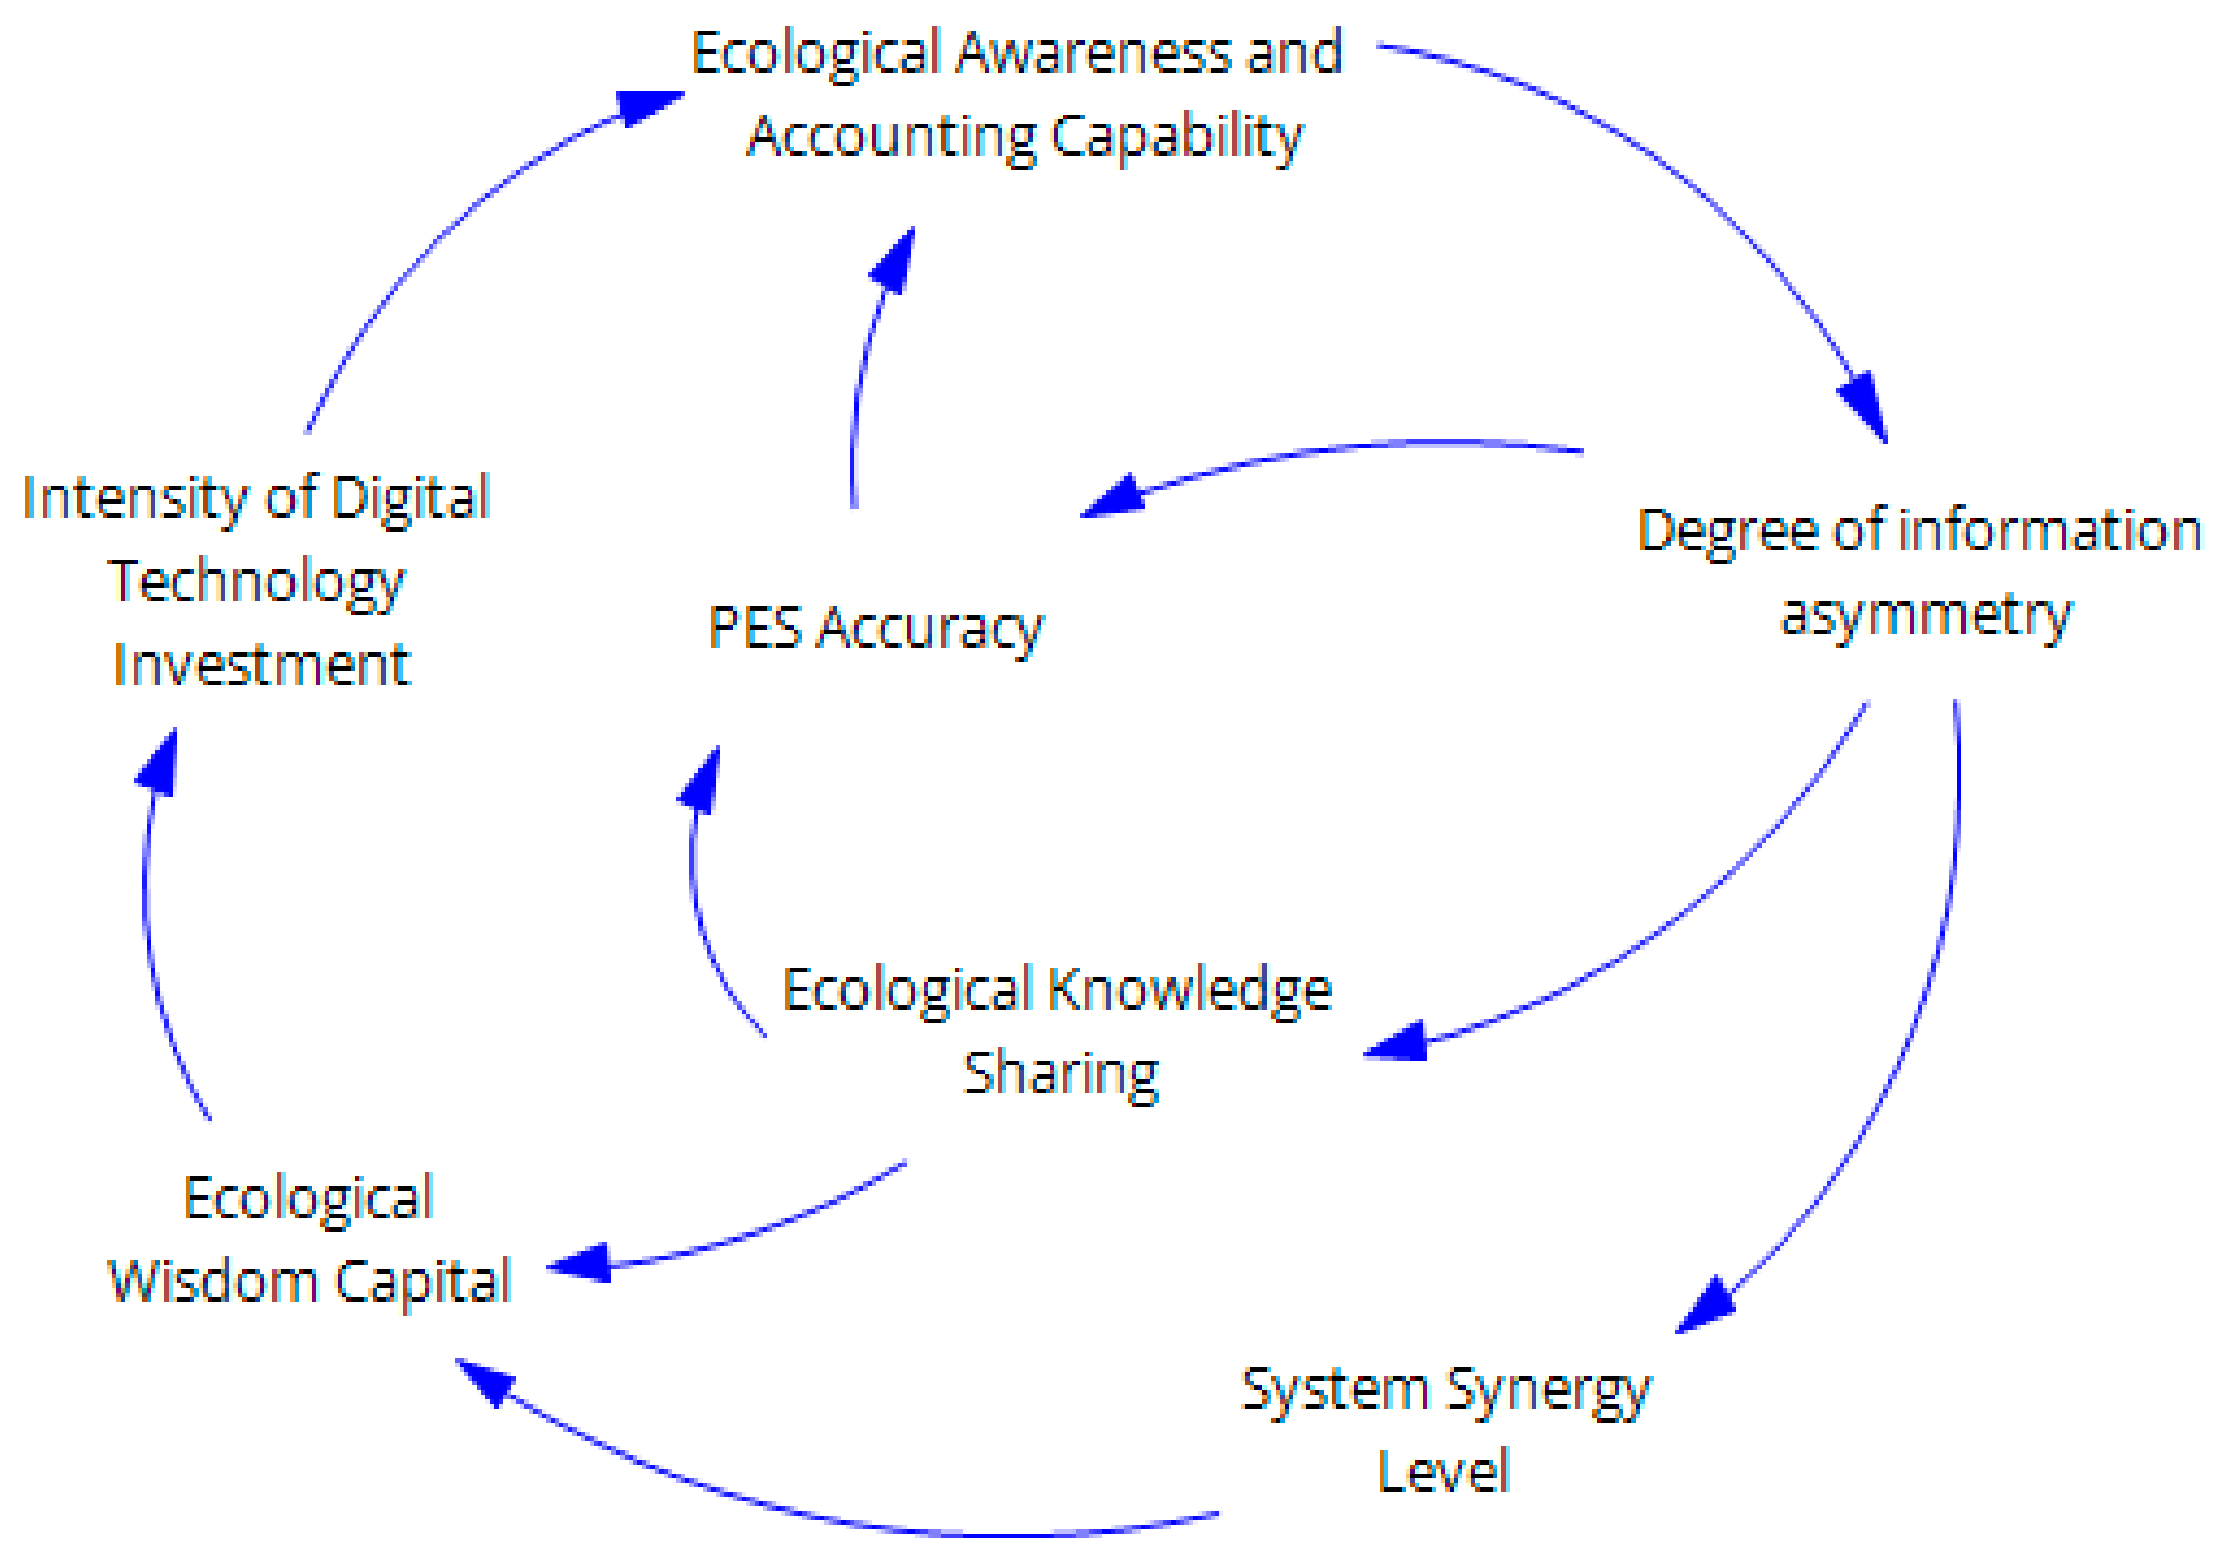
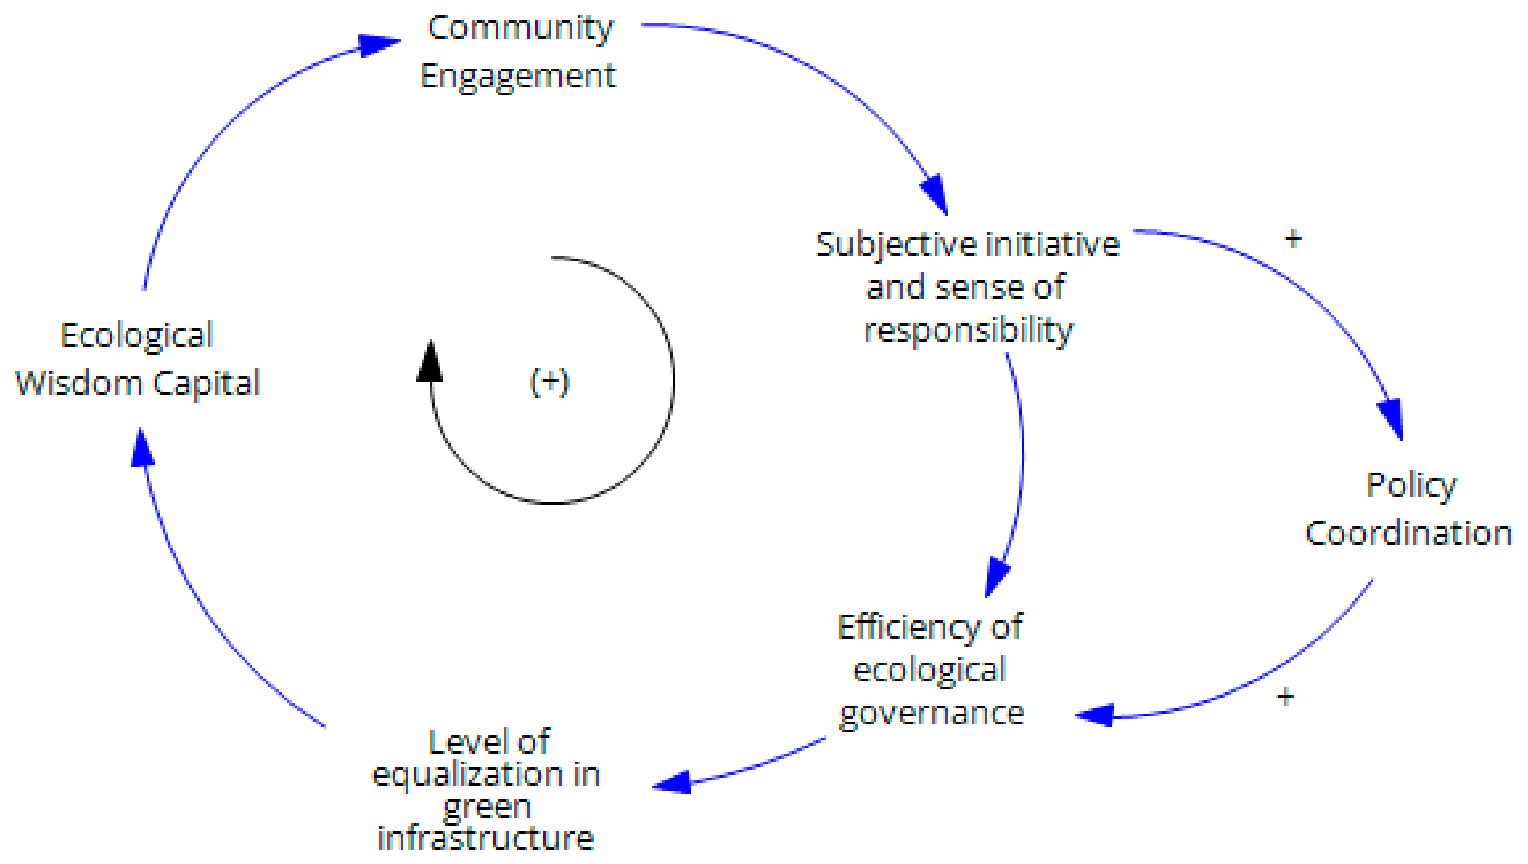
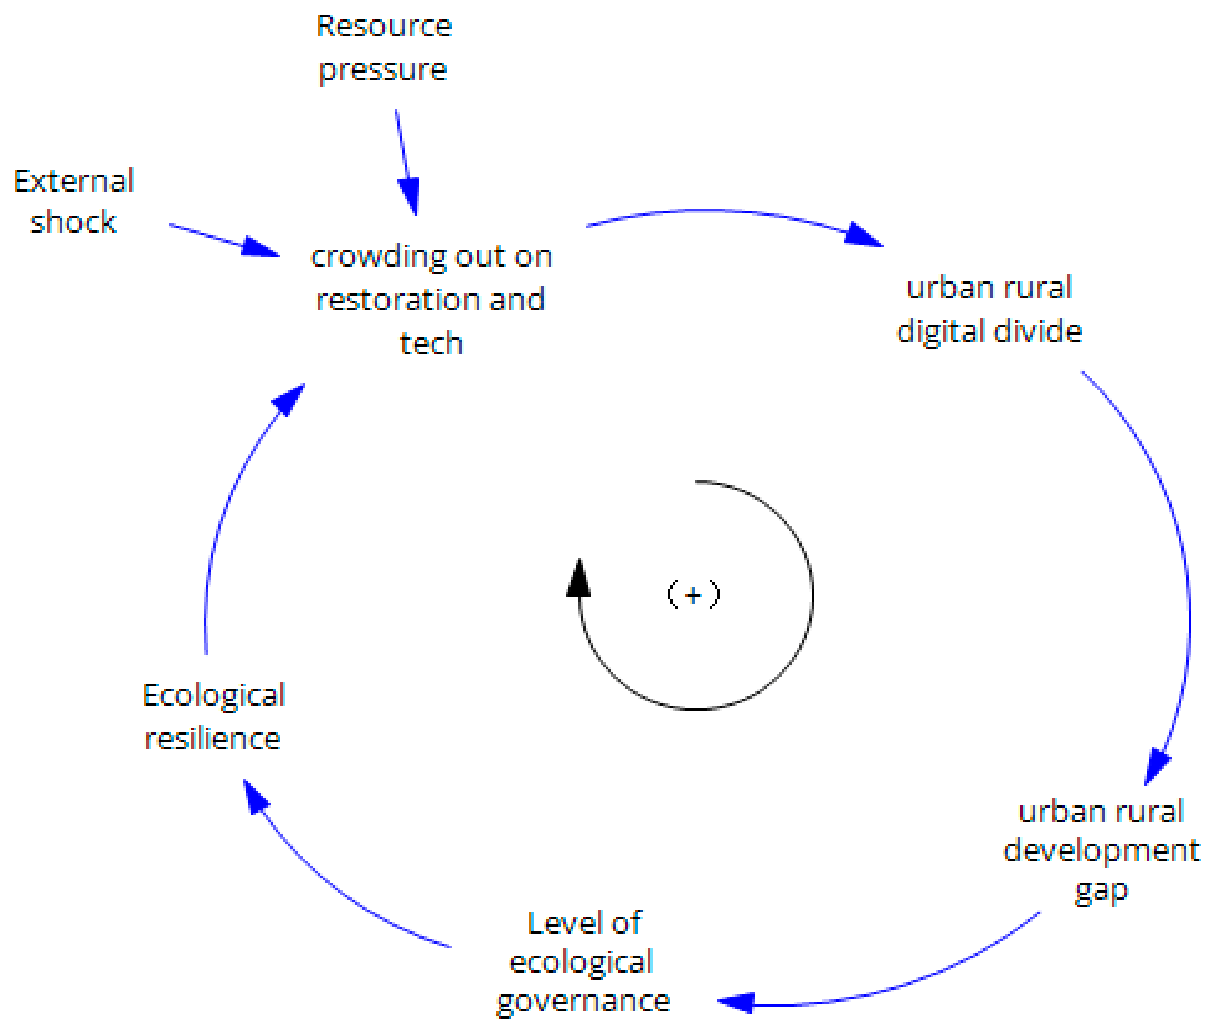
To identify key variable feedback loops in Figure 2, Figure 3, Figure 4, Figure 5 and Figure 6, this study establishes clear study set inclusion criteria: First, a closed causal chain must be formed (i.e., starting from a certain variable, the causal chain must ultimately return to that variable); second, the overall behavioral pattern of the closed loop must be comparable to existing system dynamics archetypes or cases of urban–rural governance. Paths that do not meet the closure condition or consist only of unidirectional causal chains are not included in the model as core feedback loops; instead, they are treated as exogenous variables or auxiliary chains in the simulation.

2.2.2. Core Feedback Loops of Core Feedback

On the basis of the principles of variable selection and polarity determination outlined in Section 2.2.1, this study identified the following four core feedback loops that represent the mechanisms of empowerment, activation, suppression, and metabolic promotion within the food system of urban–rural fringes as they resist habitat fragmentation.
(1) Brief Feedback Loop Driven by the Digital Technology-Driven Feedback Loop
As a fundamental driving force, digital technology plays an instrumental role in the entire urban–rural food system [44]. With increased societal investment in capital, talent, and time directed toward digital technology, the application scope of technologies such as the Internet of Things (IoT), environmental monitoring, satellite remote sensing mapping, and ecological credit blockchain has expanded. Through real-time monitoring, precise accounting, and data sharing, these technologies break the closed nature of the urban–rural food system, thereby promoting internal self-organizing phase transitions, reducing information asymmetry in food ecological governance, enhancing the accuracy of payments for food ecosystem services, and driving the system toward synergistic transformation. This, in turn, fosters a positive cycle of development between the food system–landscape resource metabolism subsystem and the ecological smart capital subsystem, promoting the equalization of green infrastructure and the accumulation of ecological smart capital. As shown in Figure 2.
(2) Activation and Reinforcement Cycle of Ecological Wisdom Capital-Community Engagement and Ecological Resilience
As ecological wisdom capital continues to accumulate, community engagement increases [45], enhancing people’s subjective initiatives and sense of responsibility. responsibility. Their motivation to take action is strengthened, improving the implementation efficiency and effectiveness of food ecological governance policies. Concrete measures for ecological protection in food production are effectively implemented, leading to a higher level of equity in green infrastructure. Simultaneously, the implementation of food ecological governance plans in urban–rural fringe areas and the improvement of governance efficiency enhance the resilience of the food–ecology–food coupling system, narrow the development gap, ease the pressure of urban–rural and rural development, and ultimately fuel the activation of synergistic mechanisms [46], as shown in Figure 3 and Figure 4.
(3) Brief Negative Feedback Loop of Resource Pressure:
In the early stages of system evolution, the coupled grain–ecology system in urban–rural fringe zones is fragile [47]. When subjected to external environmental shocks, such as climate disturbances, heat island intensity, and climate disturbance, the resource pressure of the grain system reaches a threshold (gap threshold [48], which forces the system to enter an emergency governance status and increases governance costs. This, in turn, crowds out investments in ecological grain production restoration and digital technology, further widening the urban–rural development gap. An excessively wide urban–rural development gap shrinks visible investment expectations, thereby reducing the willingness of communities, enterprises, and others to invest in digital technology. Consequently, the resource metabolic efficiency of the grain system and the level of intelligent urban–rural grain ecological governance have declined. The development of urban–rural fringe zones lags behind, weakening the resilience of the coupled grain–ecology system and its ability to resist habitat fragmentation. This further aggravates the resource pressure on the grain system, resulting in a vicious cycle of depletion. As shown in Figure 5.
(4) Brief Feedback Loop of “Resource Metabolic Efficiency—Ecological Wisdom Capital”
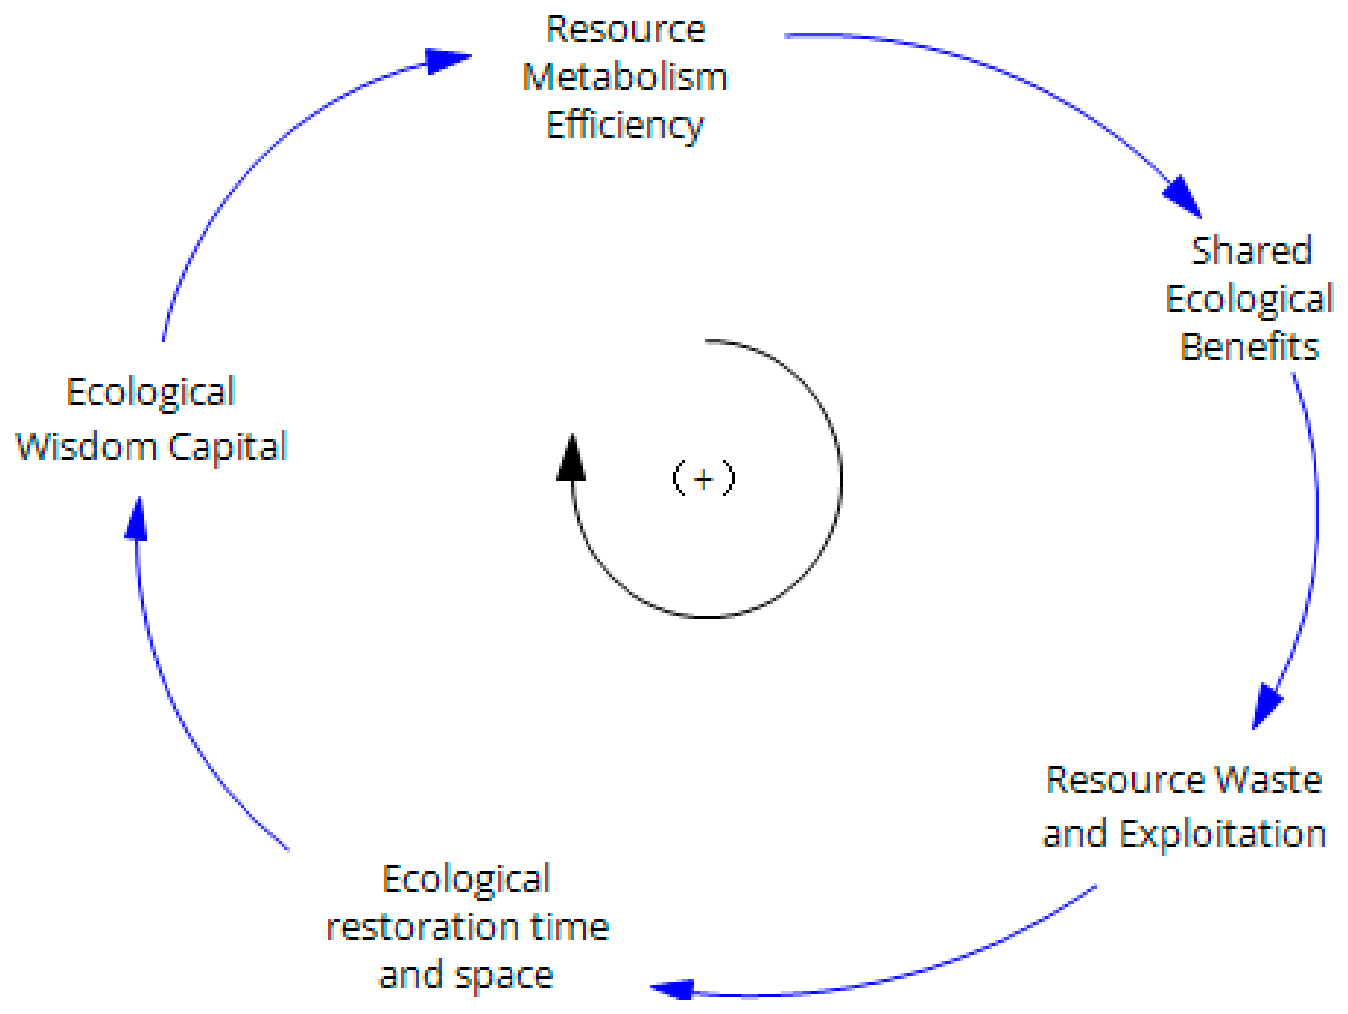
The improvement in resource metabolic efficiency in the urban–rural food system promotes the sharing of ecological benefits from food production between urban and rural areas. Communities and residents form common interest goals around food security and ecological protection, reducing conflicts of interest, facilitating the synergistic evolution of the system, and enhancing system coordination. Simultaneously, the waste and extraction of food production resources decrease, resulting in more time and space for the restoration of food production ecosystems. This, in turn, enhances the resilience of the food–ecology coupled system and ultimately contributes to the further accumulation of ecological wisdom capital [49], as illustrated in Figure 6.

2.3. System Dynamics Modelling Methods and Applicability for System Dynamics Modelling—Demo Dynamics and Applicability Argument

2.3.1. Applicability Analysis

The food system in urban–rural fringe areas, which resists habitat fragmentation and achieves synergistic sustainable development, is a dynamic process. This is a typical complex nonlinear feedback system. System dynamics is an effective tool for analysing such dynamic, nonlinear complex systems [50] and is widely applied in sustainable development strategy studies [51]. It has been extensively used in urban–rural and regional governance, such as for simulating China’s urbanization process [52], reviewing the application of system dynamics in sustainable cities [53], and assessing the dynamic effects of biofuel policies on urban–rural land use [54]. System dynamics can establish an abstract “variable laboratory” for urban–rural sustainable food systems. By changing key parameters and testing different scenarios, researchers can understand how food systems change over time. This helps support governance decisions and explains how urban–rural food systems move from fragmented and unstable states to more coordinated and sustainable states.
Various analytical tools can be used to study urban–rural food systems, including static demographic methods, FACS models, and SWARM simulation platforms. However, these methods struggle to fully capture the complete evolutionary process of the food system in urban–rural fringe areas, as they resist habitat fragmentation and move toward synergistic sustainable development. Additionally, this study involves abstract constructions such as ecological wisdom capital, ecological perception, and accounting capabilities, facing practical constraints where variables are difficult to directly observe and measure. In contrast, system dynamics integrates qualitative analysis with quantitative simulation, enabling the inclusion of these abstract constructs within a unified modelling framework for dynamic analysis. This aligns closely with the research objectives of revealing the evolutionary process of the urban–rural fringe food system from an ecologically wise perspective and identifying the effects of system phase transition thresholds. The causal loop and stock-flow diagrams were constructed and simulated using Vensim PLE (version 10.3.2). Vensim is a mainstream modelling tool in the field of system dynamics and is capable of fully implementing functions such as causal loop construction, stock-flow modelling, and scenario simulation, which meet the modelling and analysis needs of this study.
It should be further clarified that the SD model constructed in this study is a mechanism model at the level of theoretical abstraction rather than an empirical case model oriented toward a specific geographic unit. The model’s variable structure, causal loops, and parameter settings were derived from the general characteristics of the food system in urban–rural fringe zones, without focusing on the local particularities of any specific region. This abstract positioning helps the model eliminate region-specific factors and identify universal patterns of coevolution in the food system of urban–rural fringe zones. The baseline parameters of the model adopt typical values within theoretically reasonable ranges (e.g., a baseline growth rate of 0.12 and a baseline investment intensity of 1 million yuan/year·km2). The results of the sensitivity analysis indicate that the core research conclusions are robust to parameter variations (see Section 3.4 for details) and that the theoretical findings of the model hold reference values under different regional parameter conditions.
In summary, the second-order system dynamics model is suitable for system simulation in this study and can support the mechanism analysis of how the food system in urban–rural fringe zones resists habitat fragmentation and achieves synergistic sustainable development from the perspective of ecological wisdom.

2.3.2. Second-Order Model Construction Logic and Variable Operationalization

System dynamics, founded by Jay W. Forrester, emphasizes structural interconnections, dynamic evolution, and feedback mechanisms within a system. It combines qualitative theoretical narratives with quantitative simulation deductions to analyse the operational laws of complex systems, representing a typical theory-driven modelling paradigm [55]. The system dynamics model constructed in this study belongs to the category of second-order narrative models. The validity evaluation criteria focus on the rigor of theoretical logic, the rationality of feedback structures, and the explanatory power of system behavior rather than on the precise fit of historical time series data [56]. The entire modelling process is centered on ensuring the validity of the theoretical deduction and the internal logical consistency of the system [55].
The validation logic of second-order theoretical models is fundamentally different from that of traditional data-fitting econometric models. Conventional empirical models rely heavily on historical data reproduction and statistical goodness-of-fit tests, whereas second-order system dynamics models focus on mechanism explanation and trend deduction, making them unsuitable for quantitative validation paradigms that prioritize high-precision data fitting. Moreover, the core variables of this study, including ecological wisdom capital, ecological perception and accounting capability, and system synergy, are abstract latent variables that lack continuous and consistent publicly available historical observation sequences. Consequently, it is difficult to conduct behavioral reproduction tests based on traditional historical time series data.
Given the methodological attributes of second-order models and the characteristics of the variables in this study, we abandoned traditional data-fitting validation and instead adopted a multilayer robustness verification framework tailored to narrative theoretical models. Subsequent model validation will be conducted from multiple dimensions, including internal behavioral consistency, external theoretical validity, extreme condition testing, parameter sensitivity analysis, and multipolicy scenario testing, thereby ensuring the structural reliability of the model and the robustness of the simulation results.
Overall, this model relies on existing theories and cutting-edge research findings for variable selection, causal relationship specification, feedback loop construction, and multidimensional model validation. By combining theoretical deduction, logical self-checking, and multi-scenario robustness testing, subjective modelling bias is reduced, the internal validity and explanatory power of the second-order theoretical model are fully ensured, and the modelling standards and analytical requirements for studying the evolutionary mechanisms of complex urban–rural food–ecological coupling systems are met.

3. System Modelling and Simulation

3.1. Model Construction

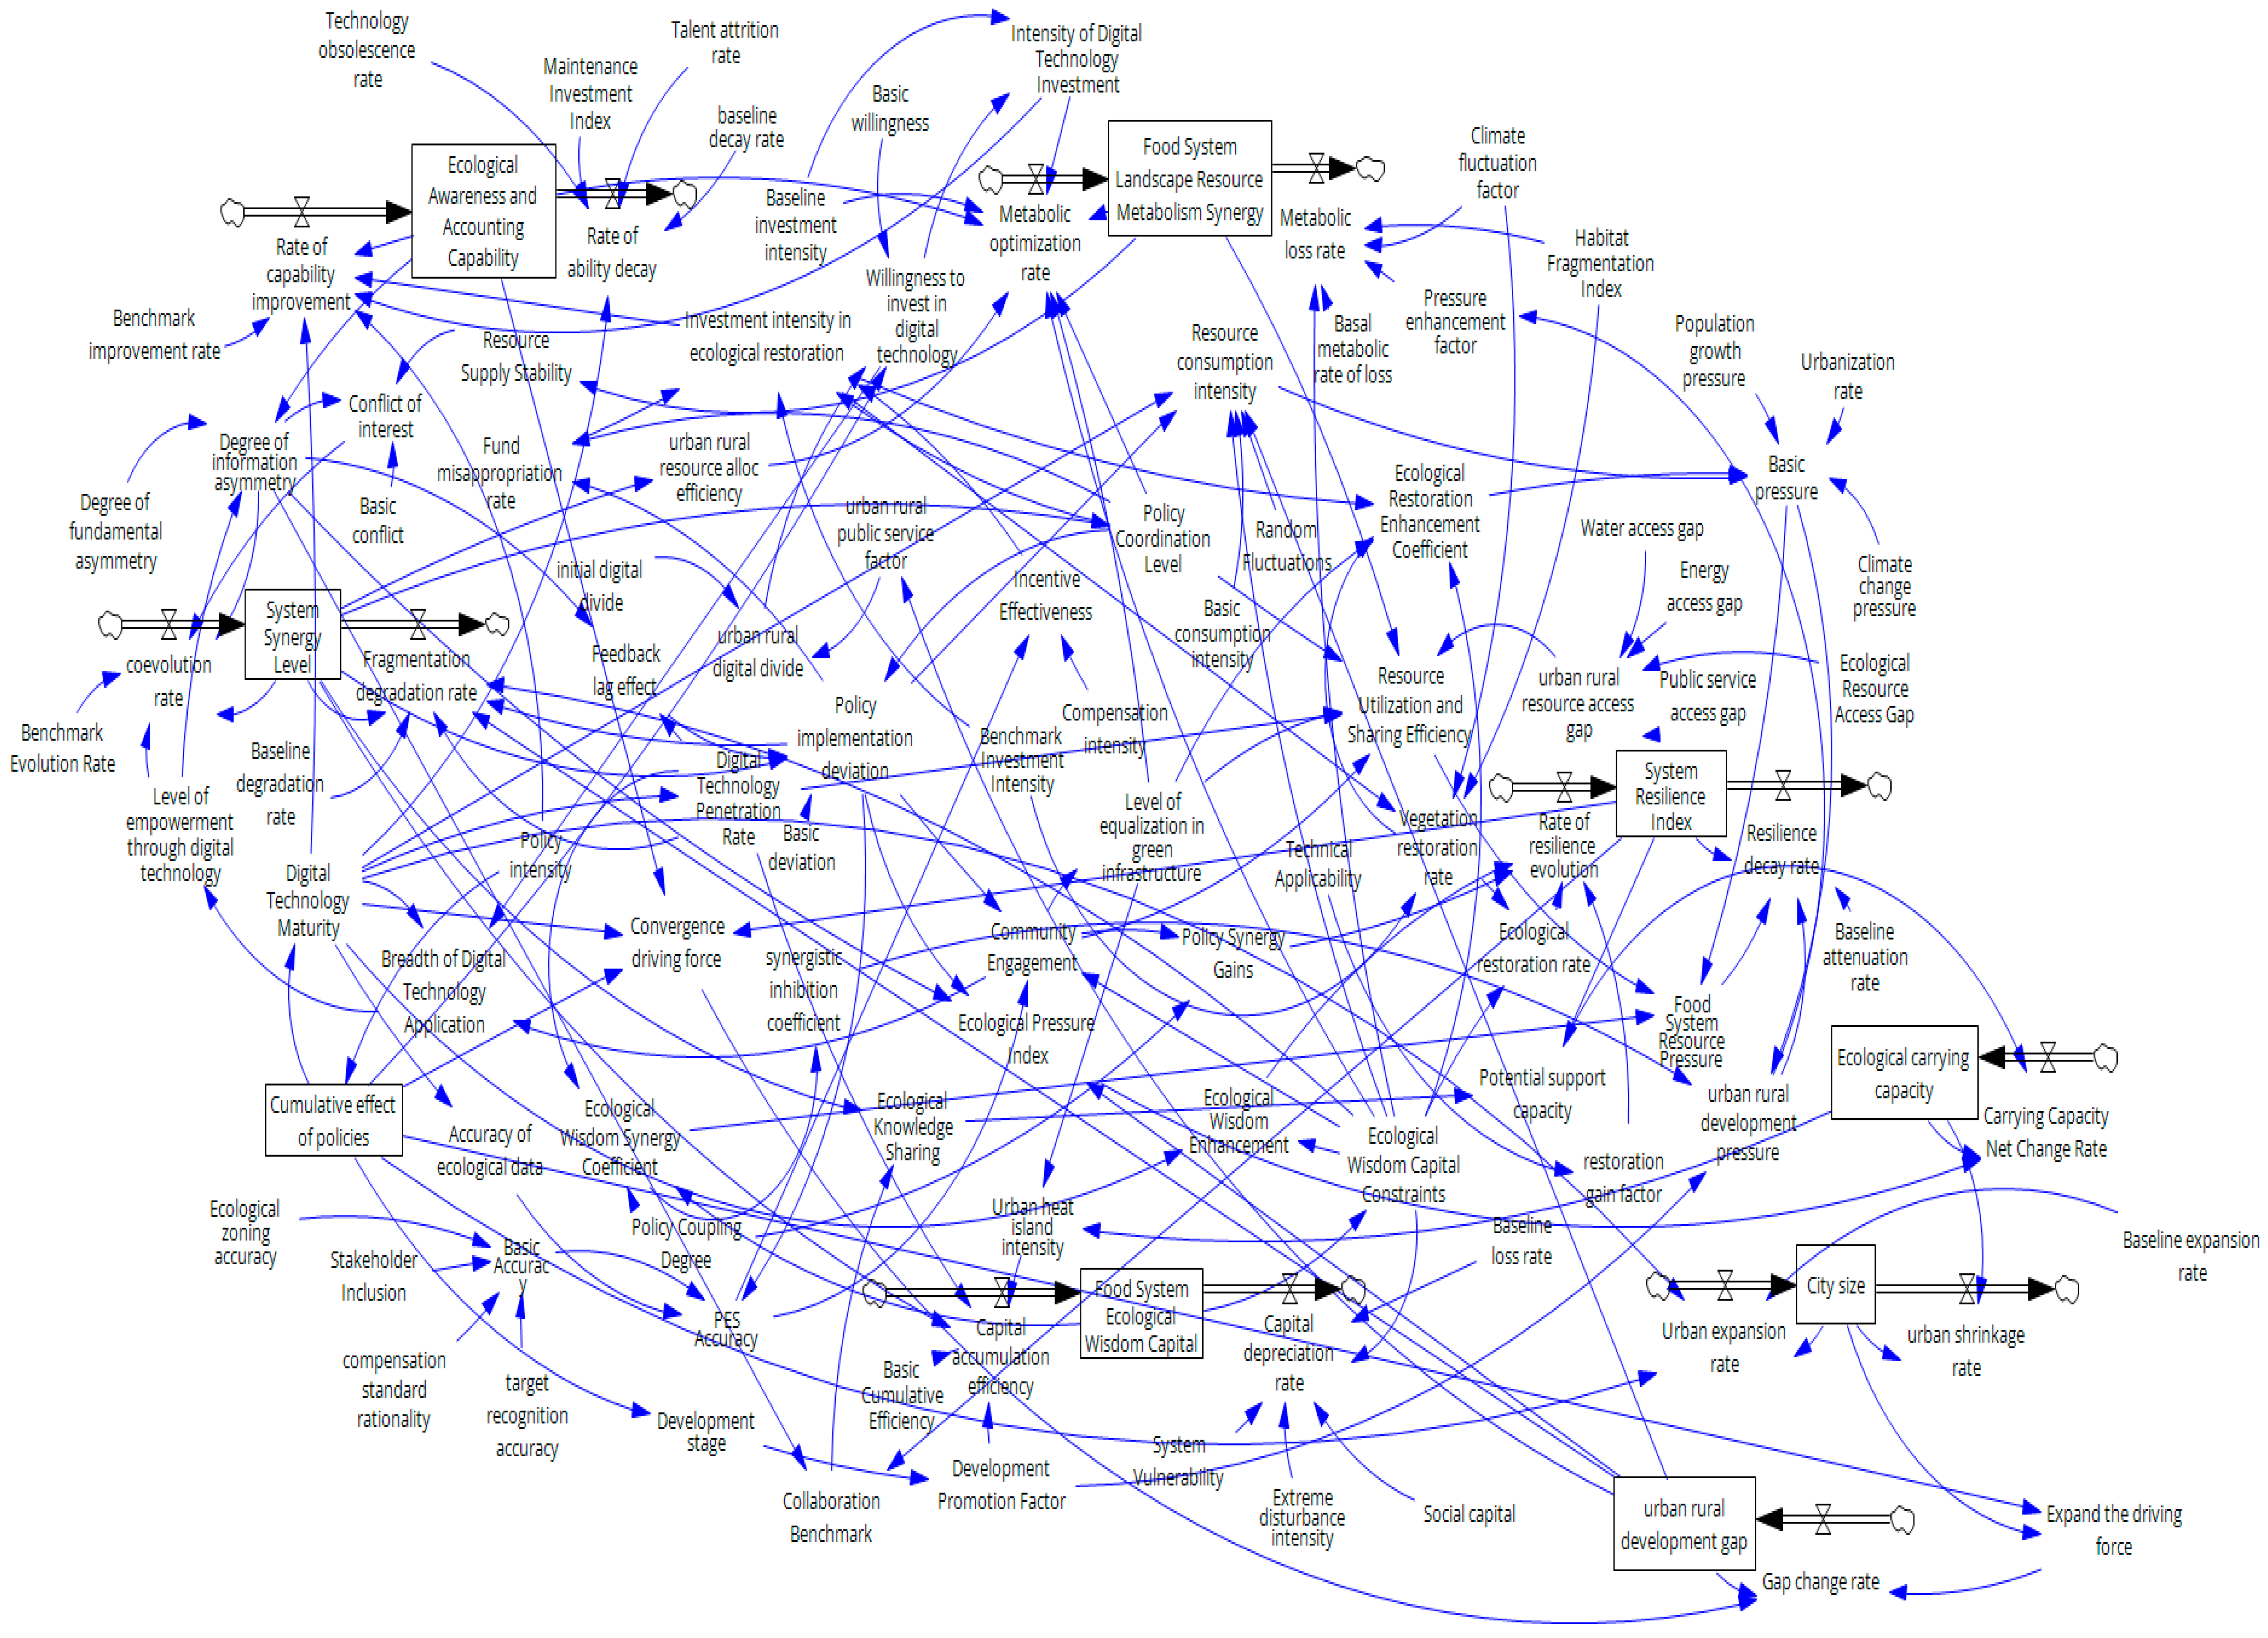
The six aforementioned main feedback loops collectively influence the evolutionary mechanism of sustainable food systems in urban–rural fringe areas from fragmentation to synergy. However, causal feedback loop relationships explain only the internal logic of the system at a qualitative level, making it difficult to effectively handle heterogeneous variables and express the quantitative relationships among various elements. To clearly describe the interaction process of system elements and conduct a quantitative analysis, in this study, on the basis of the social–ecological system (SES) framework, a second-order SD model that integrates digital technology, food system–landscape resource metabolism synergy, and ecological wisdom in a three-dimensional coupling manner is constructed. A flow diagram of the designed system dynamics is presented in Figure 7.
Co-evolution Process:
Step 1: Digital technology empowers the foundation, and the ecological perception and accounting capabilities of the food system begin to develop.
A. In the early stage of system evolution, which relies on digital tools such as IoT monitoring, satellite remote sensing, and ecological credit blockchains, the food system in urban–rural fringe areas gradually establishes basic ecological perception and accounting capabilities. This enables real-time identification of the ecological environmental conditions that support food production, including farmland quality, water resource supply, biomass energy cycling, and carbon emissions. As an external core empowering force, digital technology effectively reduces information asymmetry in food ecological governance, improves the accuracy of ecosystem service payment accounting, and enables the system to initially form a basic closed-loop structure of “perception-feedback-regulation,” steadily enhancing the precision of food ecological data governance.
B. With the initial accumulation of ecological perception and accounting capabilities, the cumulative effects of digital governance and supporting policies gradually unfold, effectively correcting execution deviations in the collaborative governance of food and ecology and improving policy implementation efficiency and subsystem coupling. However, constrained by factors such as lagging institutional development, insufficient breadth of digital applications, and incomplete social participation mechanisms, the overall synergy of the system remains low at this stage. The food system in urban–rural fringe areas still maintains a fragmented pattern characterized by broken farmland patches, imbalanced factor allocation, and weak coupling and synergy between the food and ecological subsystems. The system has not yet developed stable, self-organizing capabilities.
Step 2: Amplification of Systemic Metabolic Losses and Resource Pressure Accumulation to the Critical Threshold.
Under the phase-specific characteristic of misalignment between initial technological empowerment and institutional adaptation, the enabling effects of digital technology have not been fully realized, resulting in significantly high-loss and low-efficiency features in systemic resource metabolism. With the combined impact of climate fluctuations and external disturbances, resource metabolic losses in the food system continue to amplify, the efficiency of urban–rural resource allocation remains low, the space for food production is persistently squeezed, habitat fragmentation gradually intensifies, and the resilience of the food–ecology coupled system enters a fragile phase of development. The continuous accumulation of systemic pressure increases governance costs, crowding out resources for ecological restoration and digital quality improvement, further widening the urban–rural development gap and increasing systemic operational pressure, forming a phase-specific negative feedback loop. In this critical state, the system initiates adaptive regulation through a pressure-driven mechanism, enabling substantive alignment between the ecological perception system and the resource metabolism process and laying the foundation for subsequent systemic structural restructuring.
Step 3: Restructuring of Landscape Resource Metabolism Patterns, Achieving Preliminary Synergy of Perception-Guided Metabolism.
A. Systemic pressure drives the activation of policy coordination mechanisms, gradually increasing community participation enthusiasm, promoting sustained improvement in digital technology penetration and digital application levels, and effectively optimizing the spatial layout of green infrastructure and the allocation structure of urban–rural factors. The resource metabolism of the food system gradually sheds the fragmented characteristics of high input, high loss, and low conversion seen in the early stage, continuously optimizing resource recycling patterns, effectively controlling metabolic losses, and steadily improving the efficiency of systemic resource utilization.
B. The continuously improved ecological perception and accounting system provides precise data support for optimizing resource metabolism; effectively identifying and regulating imbalances in the allocation of production factors, such as water and energy, in urban and rural areas; and enhancing the precision of ecological zoning for grain production and investment in ecological restoration. The system gradually forms a synergistic logic of “precise ecological perception identification—dynamic regulation of resource metabolism—optimization and correction of factor allocation,” effectively alleviating systemic resource pressure, and the grain–ecology coupling system enters a phase of structural restoration.
Step 4: The continuous accumulation of ecological smart capital drives a steady increase in the resilience of the coupled grain–ecology system.
A. With the ongoing advancement of ecological perception, policy coordination, and resource metabolism optimization, the system’s ecological smart capital continues to accumulate. The ecological carrying capacity of core peri-urban grain production areas steadily increases, and the buffering and restoration capabilities of the system in response to heat island effects, climate fluctuations, and extreme disturbances significantly increase. The foundation for the development of the grain-ecology industry is being continuously consolidated, providing physical and ecological support for improving system resilience.
B. The accumulation of ecological smart capital further improves stakeholder participation mechanisms, steadily enhancing community engagement and social capital stock and forming a two-way empowerment pattern of “ecological capital—social capital.” The ecological compensation mechanism is becoming more scientific and precise, the benefits of ecological restoration continue to be released, and policy coordination is increasingly improved, effectively regulating the rate of system resilience evolution and driving the system from fragile imbalance toward steady restoration.
C. The deep accumulation of ecological intelligence capital continuously expands the application scenarios and empowerment depth of digital technologies, further optimizing the resource metabolism efficiency of urban and rural food systems, promoting the sharing of ecological benefits and responsibilities between urban and rural areas, and establishing a sustained positive feedback loop of “digital empowerment—perception upgrade—metabolism optimization—capital accumulation—resilience enhancement,” thereby continuously strengthening systematic collaborative governance capabilities.
Step 5: Three-Dimensional Coupling and Synergy Formation, Achieving Self-Organized Phase Transition and Steady-State Evolution of the Food System.
Ecological perception and accounting capabilities, food-landscape resource metabolism synergy, and ecological intelligence capital together constitute the core driving framework of system evolution, forming a complete synergistic evolutionary logic of ‘perception monitoring—metabolism carrying—regulation buffering.” The ecological perception system eliminates information uncertainty in system governance, resource metabolism synergy determines the flow efficiency and distribution fairness of food production factors, and ecological intelligence capital assumes the functions of system disturbance buffering and steady-state maintenance. The three dimensions are deeply coupled and mutually empowering, jointly driving the food system in urban–rural fringe areas to break through the critical threshold of fragmented development, complete the self-organized phase transition of the system, and ultimately achieve a sustainable evolution from disorder and fragmentation to orderly synergy and from fragile imbalance to a high-resilience steady state.

3.2. Main Model Parameters and Simulation Equations

3.2.1. Main Parameters

The system dynamics model constructed in this study includes 53 core variables covering three dimensions: ecological perception and accounting capacity, landscape and resource metabolism synergy, and ecological wisdom capital. The following systematically explains the basis for the parameter settings from three aspects: parameter classification and sources, the quantification logic of abstract variables, and a summary table of model parameters.
(1) Parameter Classification and Sources
The parameters involved in the model can be divided into three categories on the basis of their determination methods: the literature parameters, statistically estimated parameters, and system-endogenous calibration parameters, as shown in Table 1.
(2) Model Parameter Summary Table
On the basis of the three types of parameters mentioned above, the names, properties, dimensions, and initial values of all the variables in this research model are listed in Table 2.

3.2.2. Simulation Equations

The dynamic simulation equations for the core variables involved in this study, along with the programming basis for these equations, are shown in Table 3.

3.3. Model Results and Analysis

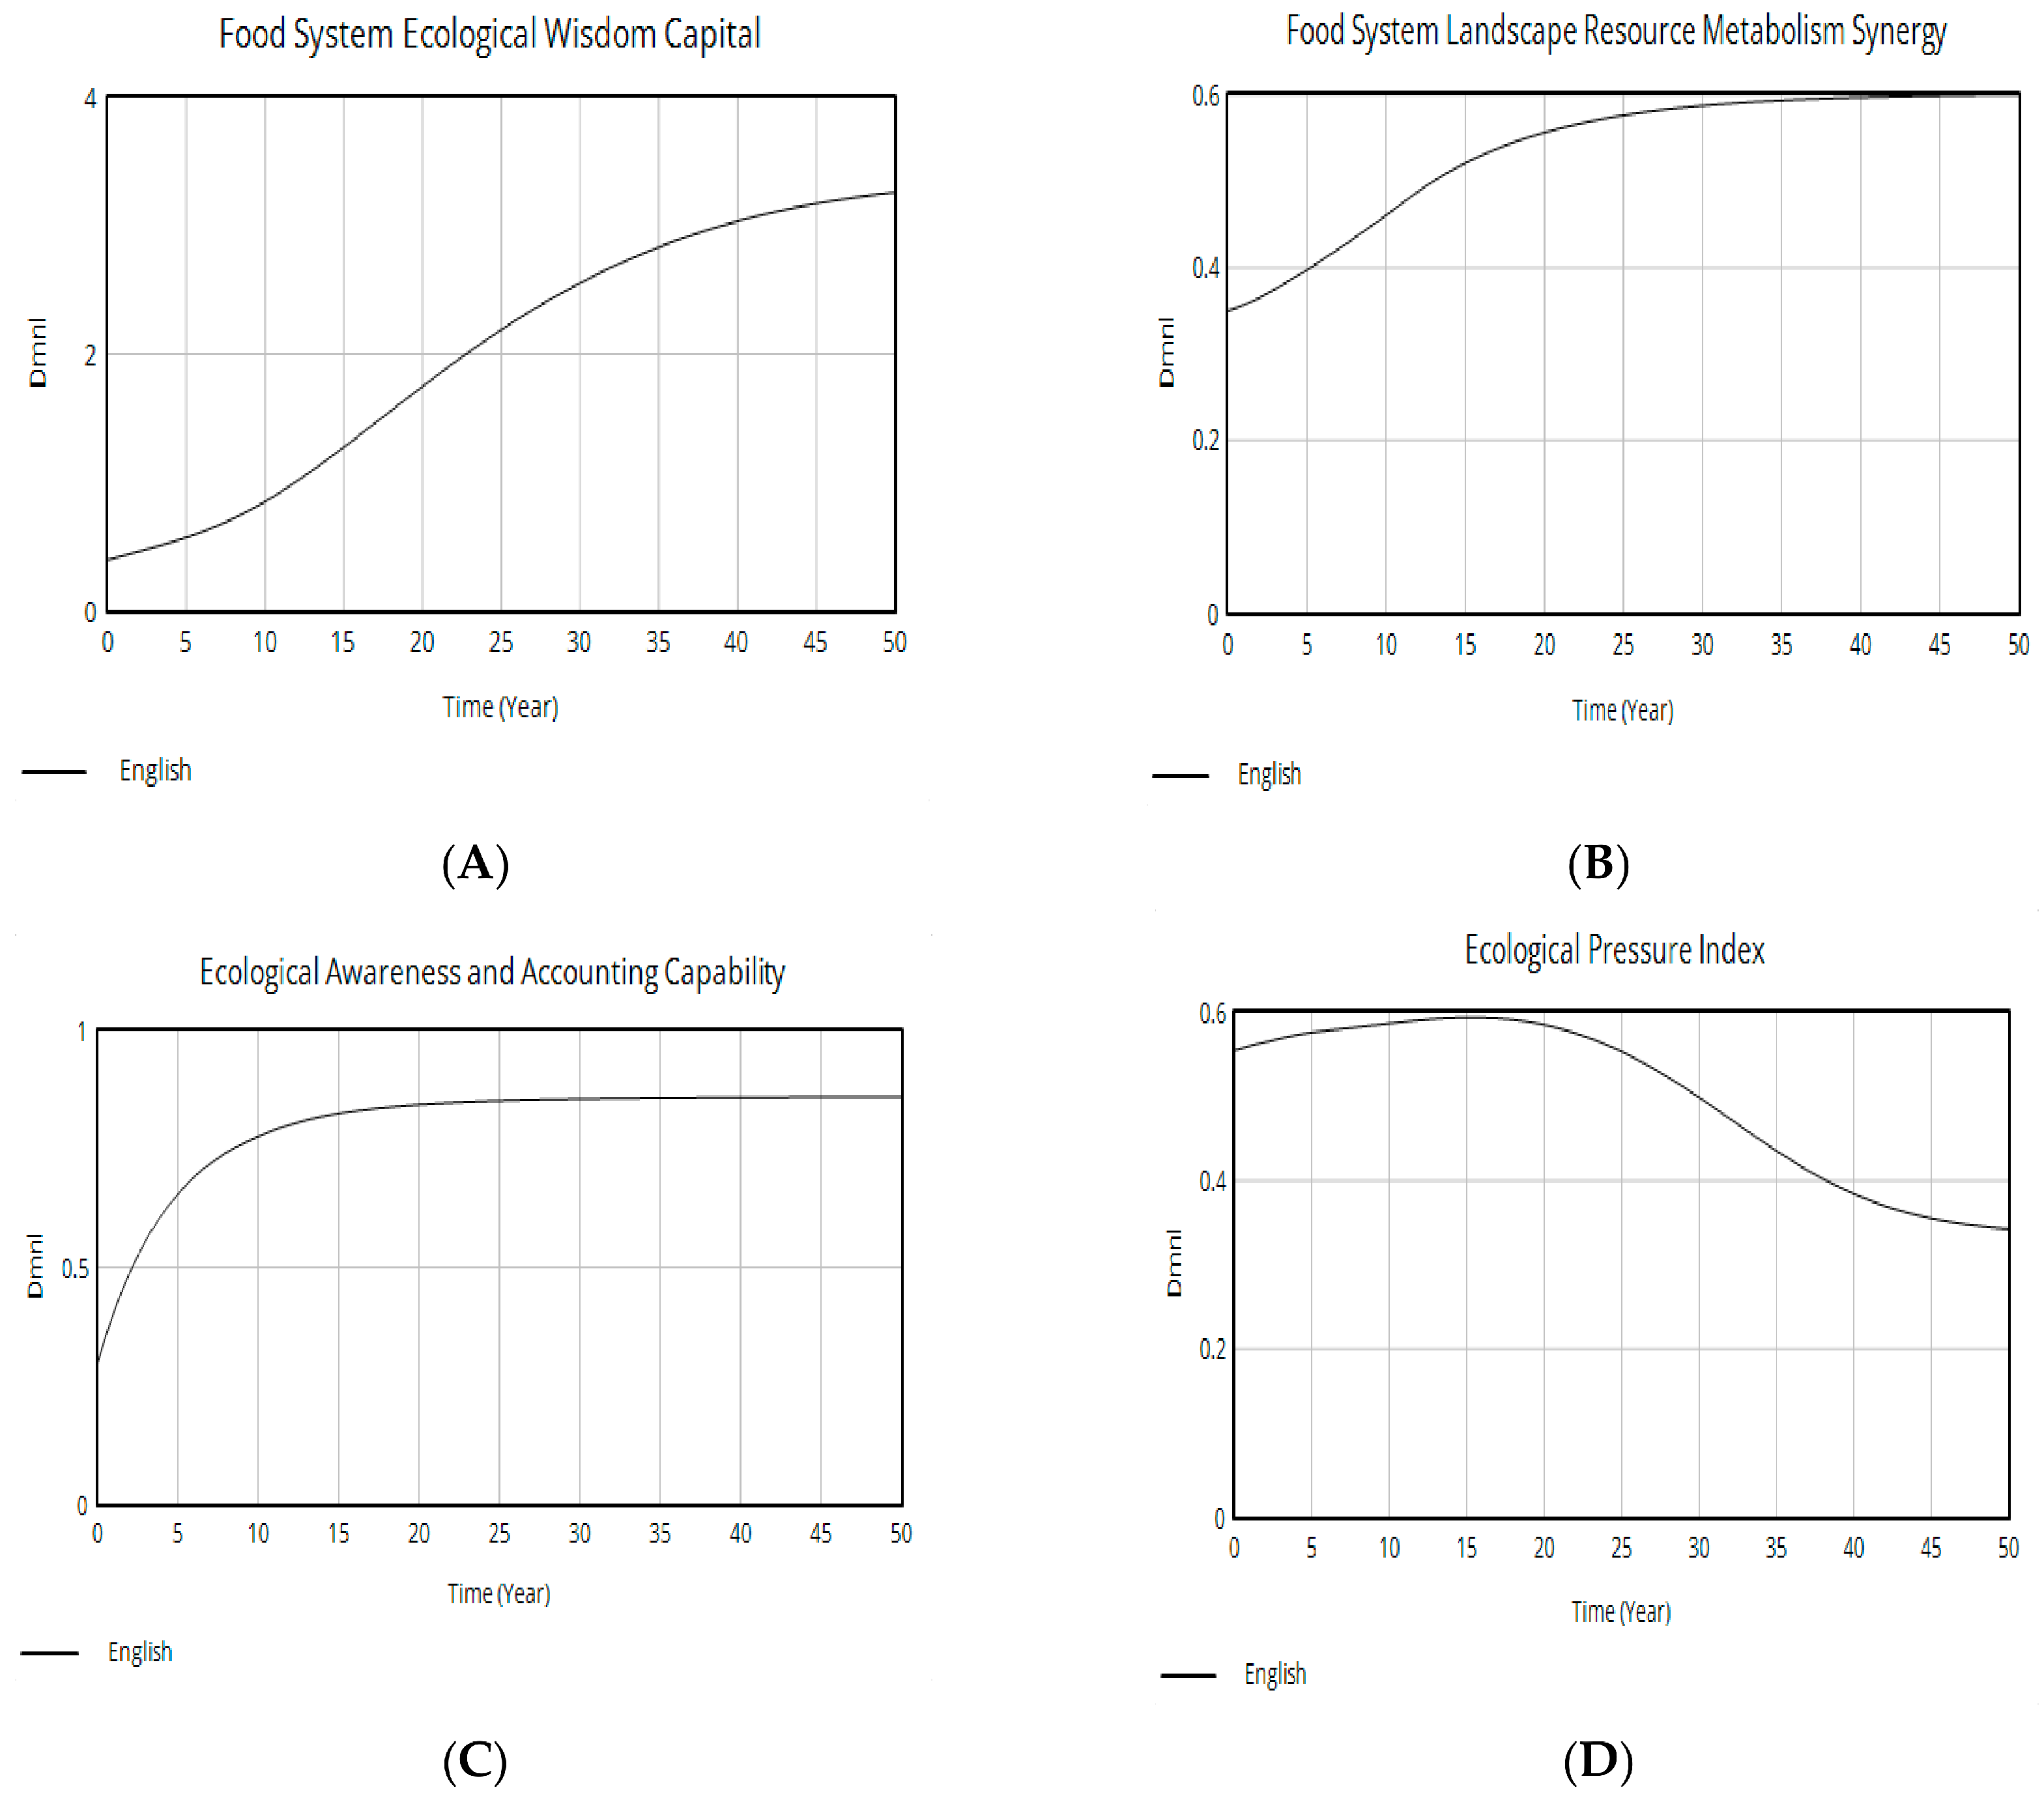
On the basis of symbiosis theory and synergetics, the transition of the food system in urban–rural fringe areas from a fragmented pattern to a synergistic steady state is essentially a process of system self-organizing phase transition driven by digital technology empowerment and the accumulation of ecological wisdom capital. The structural evolution of such complex social-ecological systems typically exhibits long cycles and lagging characteristics. To fully capture the phased evolutionary patterns and phase transition features of the peri-urban food ecosystem, this study sets the model simulation duration to 50 years, covering the classic Kondratiev long economic wave cycle, which can fully present the entire process from imbalance and adjustment to steady-state convergence. The simulation step was set to 0.25 (quarterly) to ensure the continuity of the variable iteration and result accuracy. All the calibrated parameters and simulation equations were substituted into the model for operation, yielding the long-term evolution results of the core variables of the system, as shown in Figure 8.
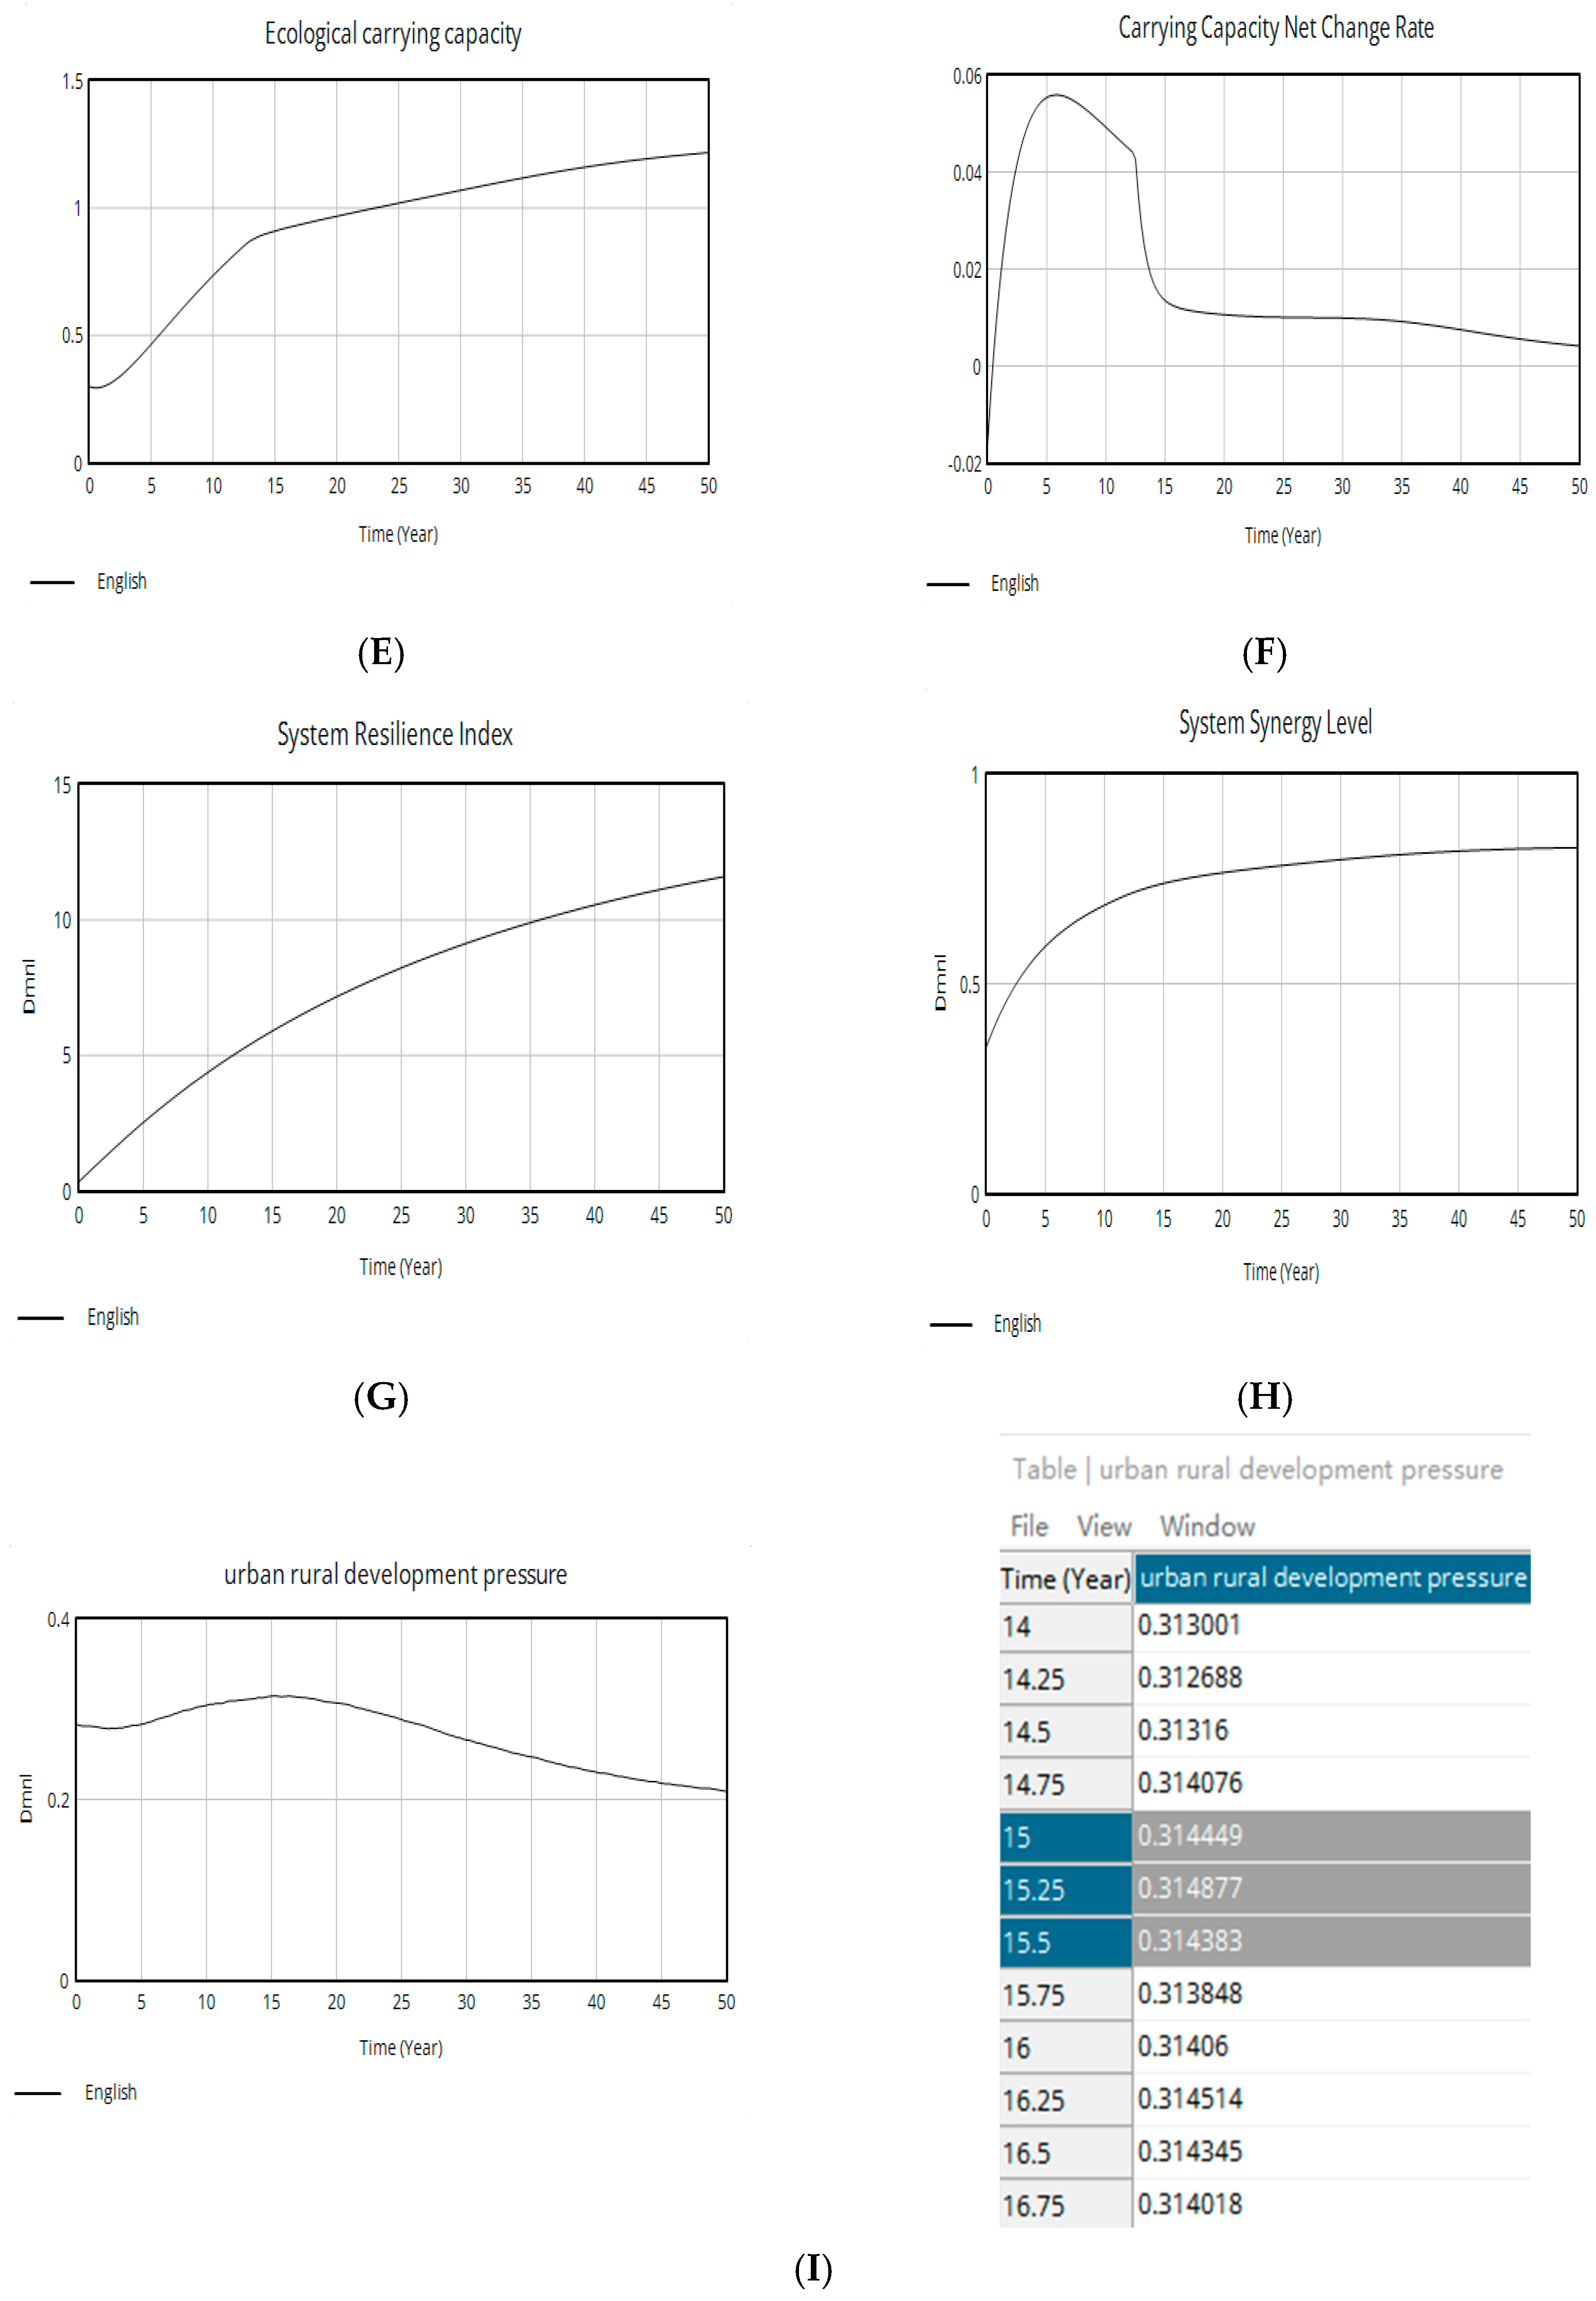
From Figure 8A–C,G, it can be observed that with the gradual improvement in ecological awareness and accounting capability, the digital technology maturity and the accumulation of food system ecological wisdom capital increase, and the system resilience index tends to steadily increase. These three factors form a positive and mutually beneficial symbiotic evolutionary relationship, which aligns with the core logic of symbiosis theory regarding the mutual benefit and synergistic gains of multiple agents [35]. The system gradually establishes a closed-loop operational mechanism of “ecological perception—dynamic feedback—adaptive regulation,” effectively identifying and repairing the degradation of fragile ecological foundations in urban–rural transition zones while continuously enhancing the disturbance resistance of the food system. Simultaneously, high-precision ecological monitoring and quantitative accounting effectively reduce the allocation gap of food production factors, optimize the regional resource distribution structure, and further consolidate the evolutionary foundation of system resilience.
The overall system synergy exhibited a typical inverted U-shaped evolution pattern, with three stages: phased decline, rebound from the bottom, and steady-state convergence (Figure 8G). From the perspective of system evolution mechanisms, digital technology empowerment has a classic time lag effect. Coupled with path dependence and institutional friction in urban–rural governance systems [59], the early stage of system transformation faces resistance from the alternation of old and new mechanisms, adjustment of interest structures, and learning adaptation costs, leading to a phased decline in synergy. As the simulation cycle progresses, the empowerment effect of digital technology continues to be released, and the cumulative effect of policies continues to stack, gradually increasing system synergy and approaching saturation convergence. The numerical results in Section 3.4.3 reveal that under the baseline scenario, the final system synergy stabilizes above 0.82; even when the digital technology empowerment pathway is closed, the final synergy value can still reach 0.782, exceeding the critical threshold of the system phase transition of 0.7. These results indicate that digital technology is not a decisive “switch” for system synergy transition but rather a key “booster” that significantly shortens the system’s vulnerability cycle and accelerates steady-state convergence.
The ecological carrying capacity shows an overall S-shaped growth trend (Figure 8D,F). It increases from an initial value of 0.300, enters a rapid growth stage after the second year, and reaches about 1.600 at the end of the simulation period. This indicates that the peri-urban food–ecological system has the ability to recover and improve its capacity over time. The change rate of carrying capacity shows an inverted U-shaped trend. It increases quickly from an initial negative value, reaches a peak of 0.052 in the sixth year, and then gradually decreases while remaining positive. This suggests that although the growth of ecological carrying capacity slows down at some stages, it is not greatly limited by development pressure. The ecological pressure index, which combines ecological stress and resource pressure, shows a similar trend to the urban–rural development gap. Both reach a peak of 0.618 in the 15.5th year and then decline gradually to 0.360. This result supports the pathway of “urban–rural development imbalance → ecological pressure increase → limited system recovery”. Overall, during the pressure accumulation stage, the system shows strong resilience. Although its growth slows down, its functions do not decline. The system maintains basic recovery ability under disturbances, providing a buffer for the later transition toward a more coordinated state.
Urban–rural development pressure exhibits significant phased fluctuation characteristics (Figure 8I), reflecting the dynamic game process between external disturbance shocks and the system’s self-organizing repair. In the early stage of system evolution, the peri-urban food–ecology coupling structure is relatively fragile, with resource metabolism pressure (as captured by food system resource pressure) approaching critical thresholds. Regional governance investment is forced to tilt toward emergency management, which, to some extent, crowds out resources for ecological restoration and digital construction, gradually increasing urban–rural development pressure. Simultaneously, influenced by the system’s self-organizing fine-tuning mechanism, the pressure decreased slightly in the early stage. After the pressure reaches a phase peak in the 15th year, the system forces a stronger collaborative governance response. Multidimensional mechanisms, such as digital monitoring, ecological accounting, and policy coordination, form a coupling empowerment effect, continuously promoting system repair and structural optimization, ultimately driving a sustained decline in urban–rural development pressure. This evolutionary pattern aligns with the core characteristics of self-organizing phase transitions in complex systems [64,65,66], confirming that the transformation of the peri-urban food system from fragmentation to a collaborative steady state is a typical endogenous self-organizing optimization process. Digital technology, through tools such as remote sensing monitoring, the Internet of Things, and blockchain ecological accounting, continuously reduces governance information asymmetry and enhances the precise measurement capability of ecological services, providing important external drivers for the system’s benign phase transition.
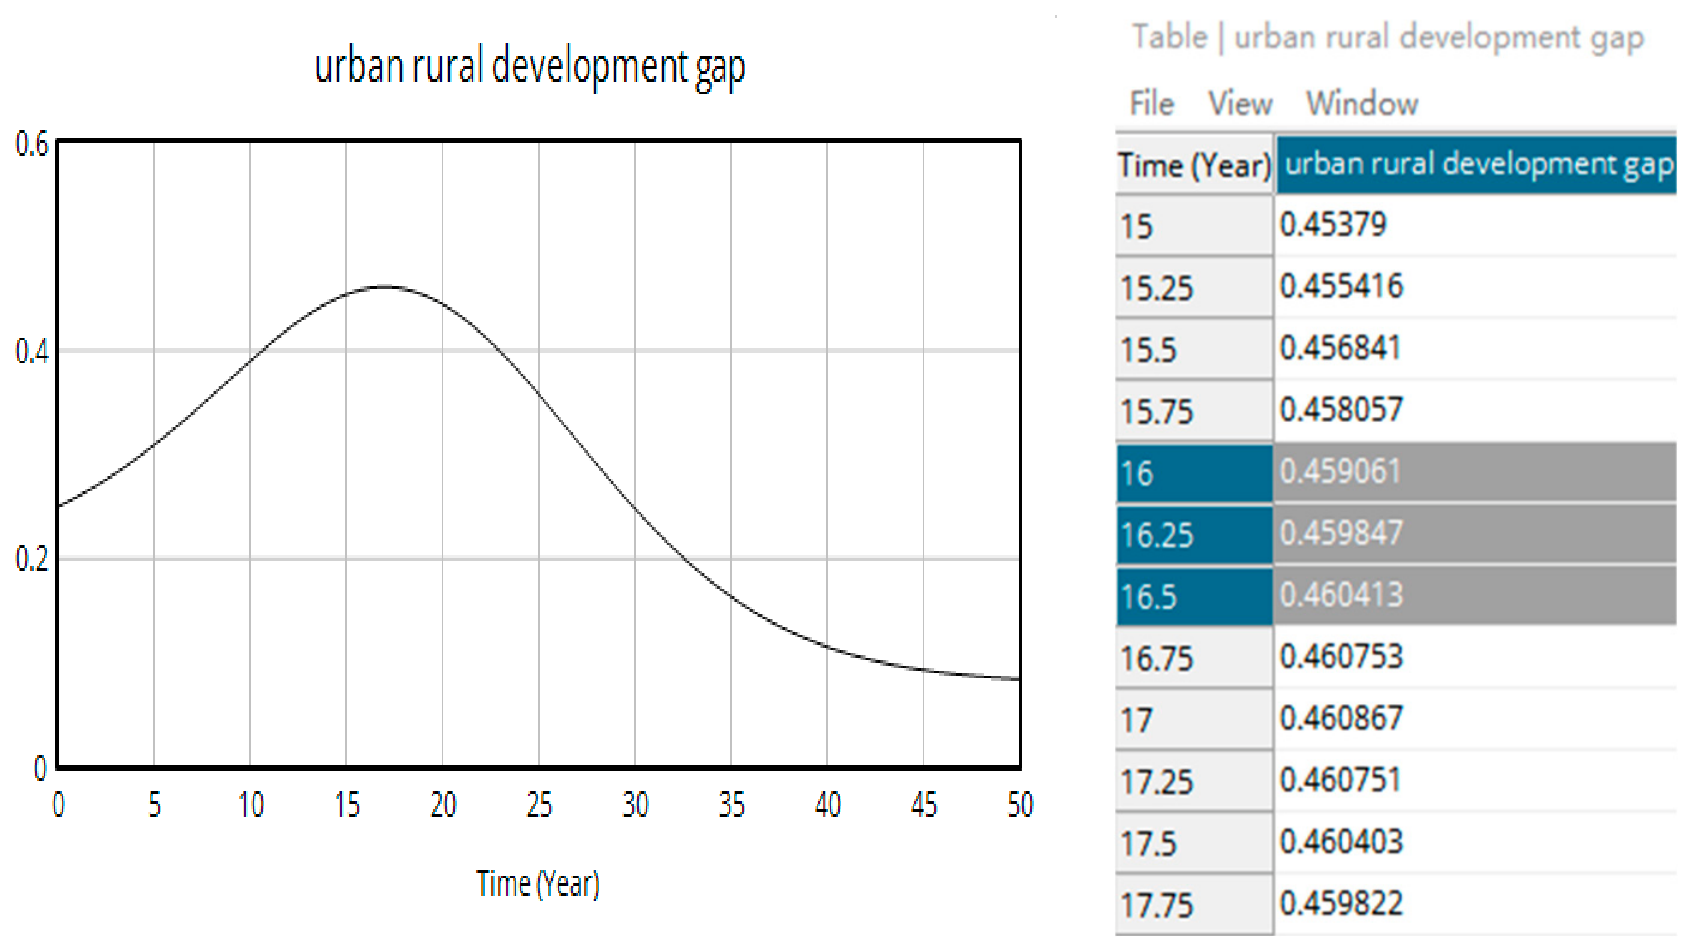
The simulation results of the urban–rural development gap are shown in Figure 9. Driven synergistically by the cumulative effect of policies, the system resilience index, ecological awareness and accounting capability, and digital technology maturity, the urban–rural development gap exhibits a typical inverted U-shaped evolutionary trajectory. Specifically, the urban–rural development gap expands from an initial value of 0.25, reaching a peak of 0.446 around the 16.5th year, representing a 78.4% increase from the initial level, reflecting the urban–rural polarization effect caused by factor agglomeration in the early stage of development. After crossing the inflection point, as the three-dimensional synergy mechanism continues to improve and the cumulative effect of policies accelerates, the urban–rural development gap enters a sustained convergence channel, stabilizing at a low level of 0.08 by the end of the period. This final value represents the structural difference formed by inherent factors such as geographical conditions, agricultural production risks, and public service endowments, without the extreme outcome of absolute equalization, reflecting the objectivity and rationality of the model simulation. The overall evolutionary pattern is highly consistent with the classic paradigm of the environmental Kuznets curve, which follows a “first deterioration, then improvement” trajectory, exhibiting a three-stage evolutionary characteristic of “transition pain period—synergistic improvement period—steady-state convergence period.”
Based on the analysis of the evolutionary trends of each variable and their core feedback loops in Table 4, combined with the simulation results in Figure 8 and Figure 9, the following conclusions can be drawn: the phased evolution of ecological carrying capacity, food system–landscape resource metabolic synergy, and system resilience index together constitute the core foundation for narrowing the urban–rural development gap. Among these, ecological carrying capacity provides the basic resource conditions for system operation. Food system–landscape resource metabolism synergy determines the efficiency and response speed of the perception–feedback–regulation process. The system resilience index helps maintain a stable development path under external disturbances. The changes in these three factors occur at different but complementary stages, creating temporal synergy. Ecological carrying capacity increases rapidly in the early stage and builds the ecological foundation of the system. Food system–landscape resource metabolism synergy recovers from a low point in the middle stage and improves system operation. The system resilience index provides continuous support and maintains system stability throughout the whole process. This complementary pattern shows that improving only one factor cannot achieve a stable transition of urban–rural food systems. Only when different mechanisms work together at key stages can the system move from passive imbalance toward an active and sustainable equilibrium.

3.4. Sensitivity Analysis of Key Variables

This study is a theoretical exploratory modelling effort in which core variables (such as ecological wisdom capital, ecological perception, and accounting capabilities) are highly abstract in nature, making it difficult to obtain continuous historical observation data from existing statistical sources for formal behavioral reproduction and validation. Given this, model validation focuses on structural rationality checks, theoretical consistency tests of behavioral patterns, and extreme condition tests, supplemented by sensitivity analysis, to systematically assess the model’s reliability and robustness through multidimensional cross-validation.

3.4.1. Dimensional Consistency Handling

Dimensional uniformity is a fundamental prerequisite for the effective operation of system dynamics equations and a core criterion for ensuring that model simulation results are physically interpretable [50]. The model in this study integrates variables from ecological, social, and economic dimensions, and the equation operations involve the coupling and iteration of multiple heterogeneous indicators, leading to scenarios in which variables of different dimensions are computed together. To avoid illegal cross-dimensional operations while maintaining model simplicity, this study follows domain-specific modelling conventions and applies standardized dimensionless processing to all core variables [50,67].
In the model, core stock variables such as ecological wisdom capital, system synergy, and the system resilience index were uniformly standardized to a 0–1 interval, and the corresponding flow rate variables were represented in dimensionless form. Auxiliary regulatory variables, such as the habitat fragmentation index and climate fluctuation factor, were also normalized before they were included in the equation operations. Various constant coefficients and adjustment factors in the model serve the functions of unit conversion and amplitude calibration, and all functional relationships are constructed within a unified dimensionless computational space, ensuring that the interaction mechanisms among the variables align with real-world theoretical logic.
The dimensional consistency of this study was verified using Vensim’s built-in dimensional checking function. However, Vensim can identify only explicit variable dimensions and cannot resolve the conversion calibration logic implied by the constant coefficients. Consequently, the system may generate a small number of formal dimensional mismatch warnings; however, this issue does not affect the actual operation of the model or the validity of the simulation. The core purpose of dimensional checking is to ensure that the relationships between variables have practical significance rather than merely achieving formal uniformity in formula symbols. All equations in this model were constructed on the basis of established theories and existing research, with parameter assignments and functional mechanisms derived through theoretical reasoning and the literature calibration. Subsequent cross-validation of the overall simulation mechanism and the robustness of the research conclusions will be conducted using methods such as model behavior consistency testing and sensitivity analysis.

3.4.2. External Validity Test, Behavioral Consistency Test, and Extreme Condition Test

(1) External Validity Test
To verify the scientific validity and generalizability of the model simulation results and ensure that the system’s evolutionary patterns align with real-world socioecological operational logic, this study systematically benchmarked the core evolutionary characteristics output by the model against classical theories and existing empirical findings both domestically and internationally. First, the inverted U-shaped evolutionary trend of the urban–rural development gap is highly consistent with the stage-specific patterns of the environmental Kuznets curve hypothesis, and the timing of the inflection point aligns with the general evolutionary logic of urban–rural structural transformation during regional urbanization processes [63]. Second, the degree of synergy of the system exhibits a lagged evolutionary characteristic of “initial institutional friction and decline, followed by the release of synergy dividends in later stages,” which is consistent with the stage-specific patterns and path dependence features of urban–rural spatial governance system optimization [22]. Third, the resilience of the ecosystem, which involves maintaining functional stability and achieving gradual restoration despite ongoing anthropogenic disturbances and development pressures, aligns with the core principles of socio-ecological system resilience theory [37] and is consistent with stage-specific restoration trends in peri-urban ecological restoration based on nature-based solutions [15]. Finally, the positive amplifying effect of digital technology on enhancing food system resilience and promoting sustainable transformation corroborates cutting-edge research findings on digital empowerment in food system governance [16]. On the basis of the comprehensive benchmarking results with theories and the literature, the simulation patterns of this model demonstrate strong theoretical consistency and external validity.
(2) Behavioral Consistency Test
Behavioral consistency testing is used to assess the rationality of the internal operating mechanisms of a model, avoiding pathological behaviors in the simulation process that violate the logic of the system dynamics. This study conducted a full-cycle trajectory review of all 53 core variables included in the model and systematically verified the dynamic evolution characteristics of the stock, flow, and auxiliary variables. The results show that all the variables evolve steadily within reasonable physical ranges, with no abnormal phenomena, such as negative value overflow, unbounded growth, severe oscillations, or abrupt divergence. The pace of the increase and decrease in each variable, the iterative relationships, and the operational logic of the feedback loops were self-consistent, with no simulation deviations converging to infeasible regions or violating real-world mechanisms. Overall, the internal behavior of this model is stable, its dynamic evolution is reasonable, and it meets the internal validity requirements for system dynamics simulation.
(3) Extreme Condition Testing
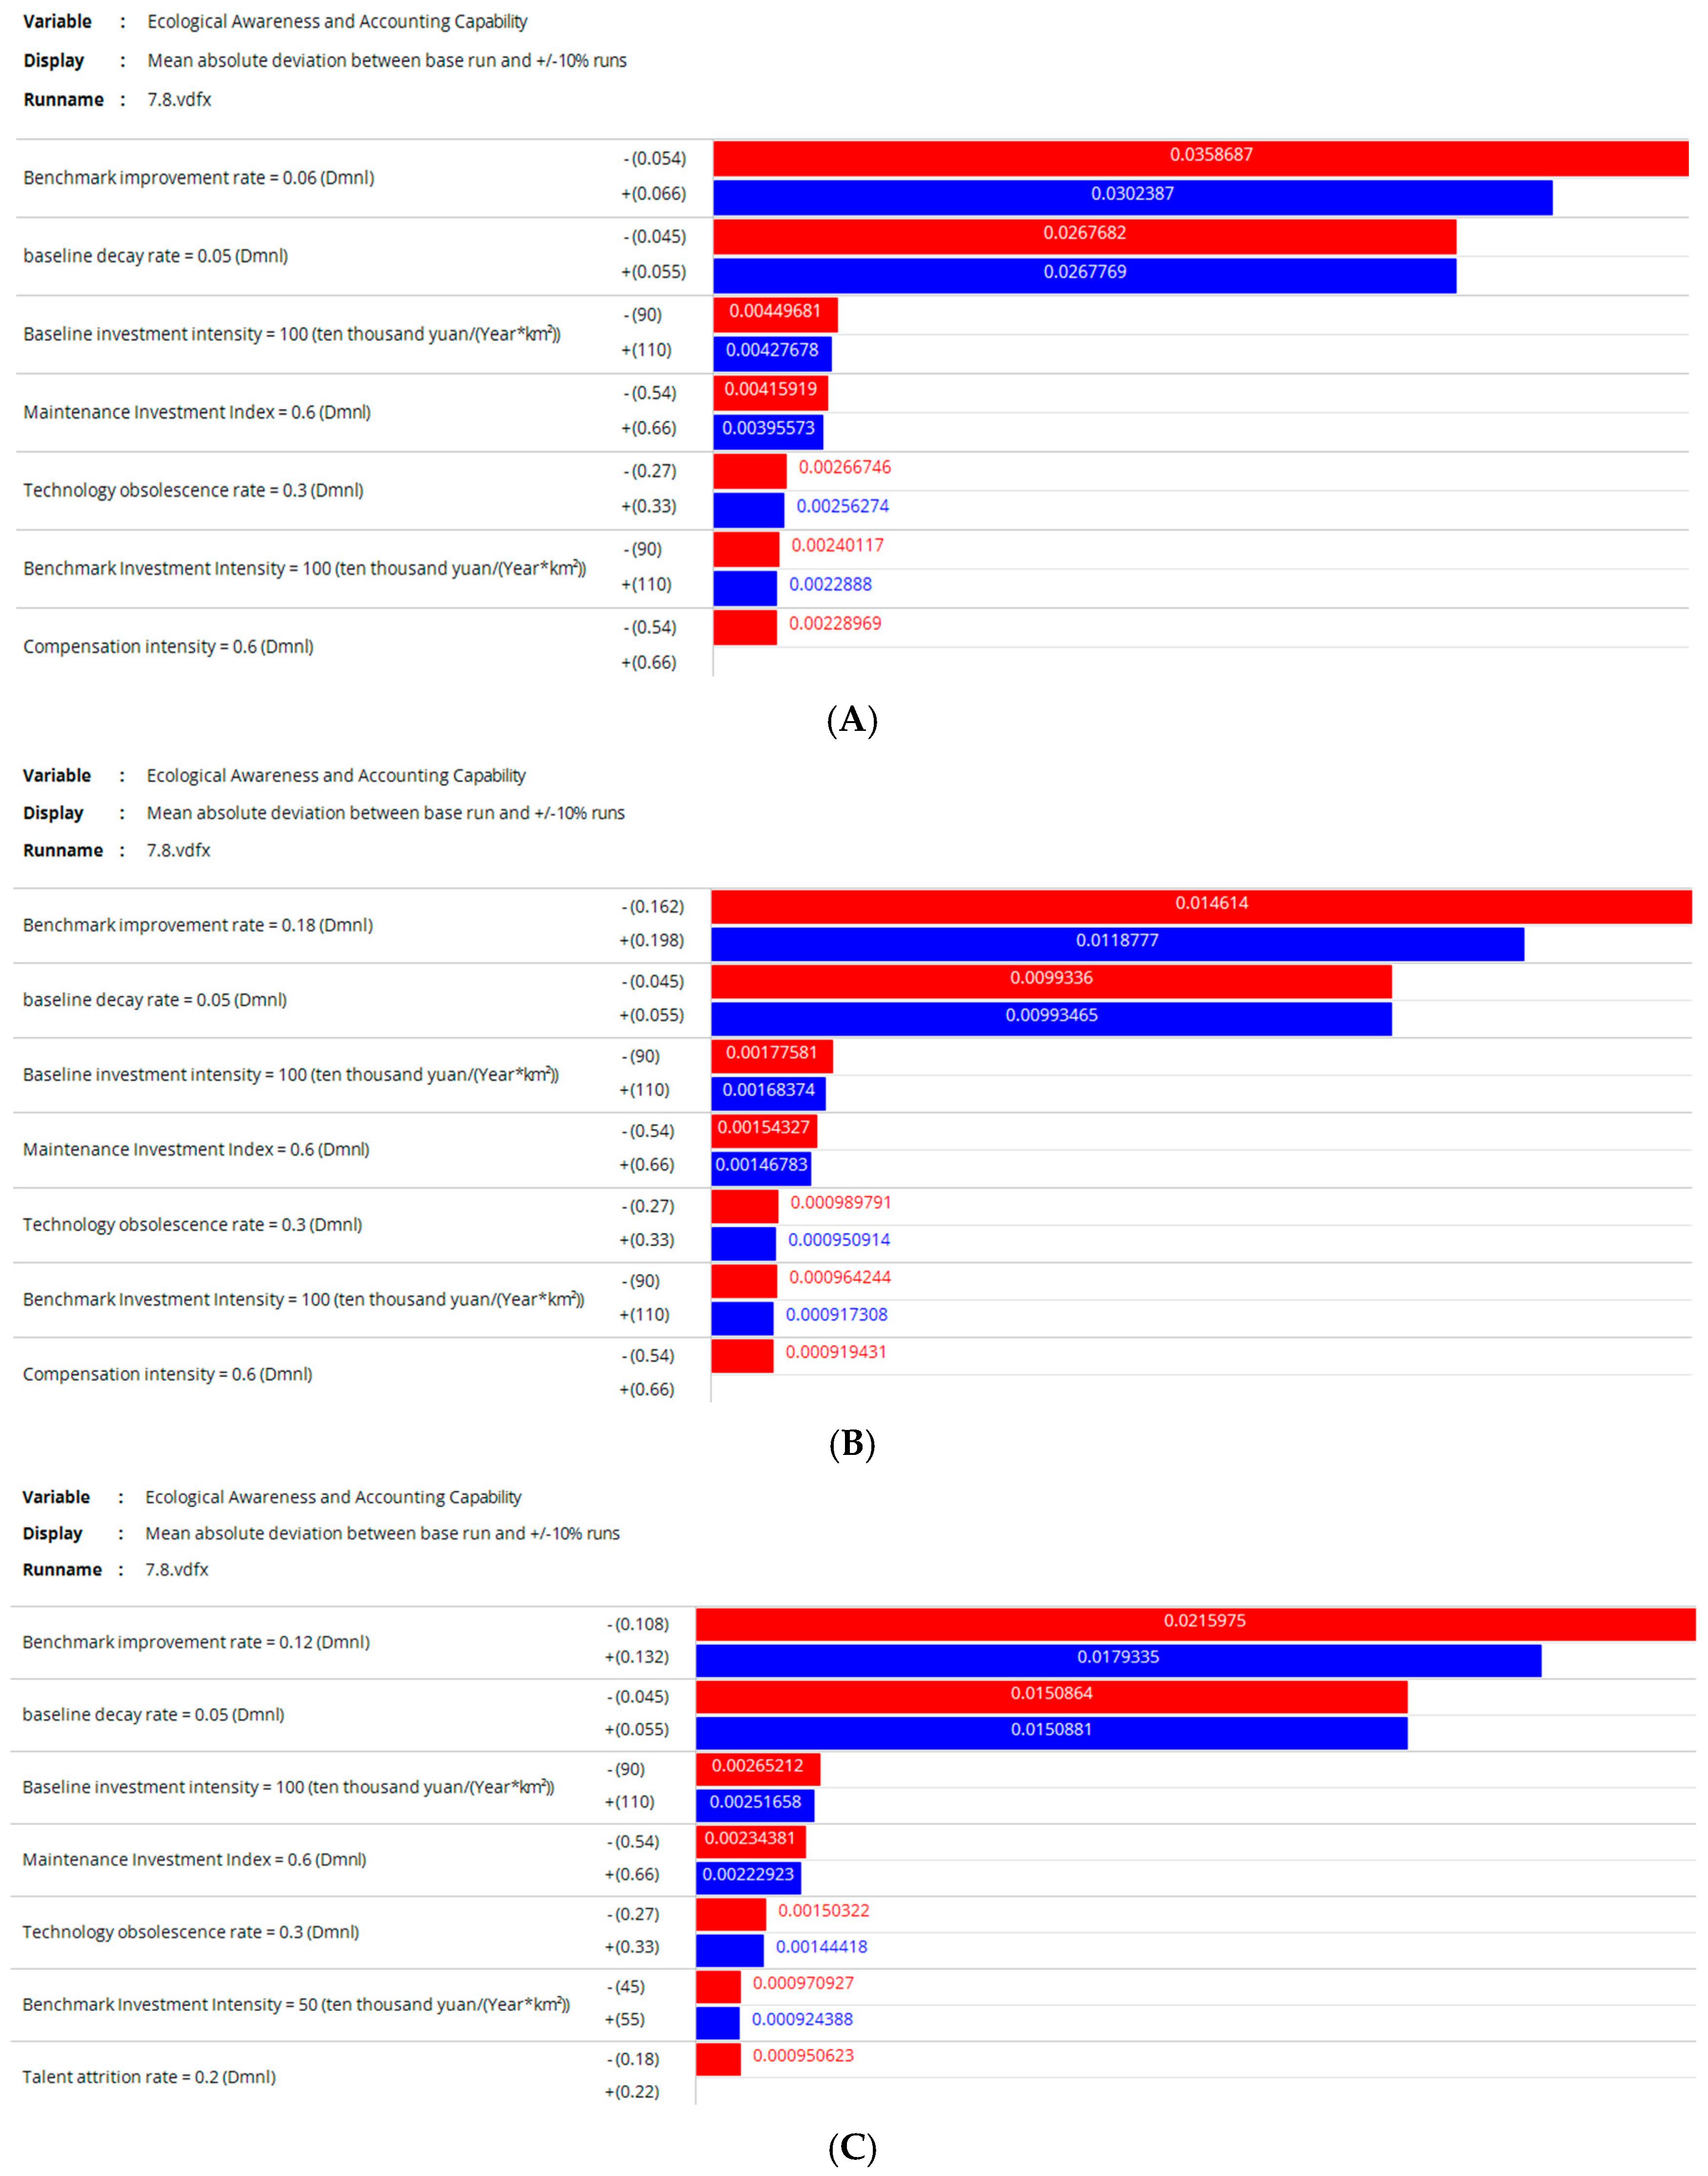
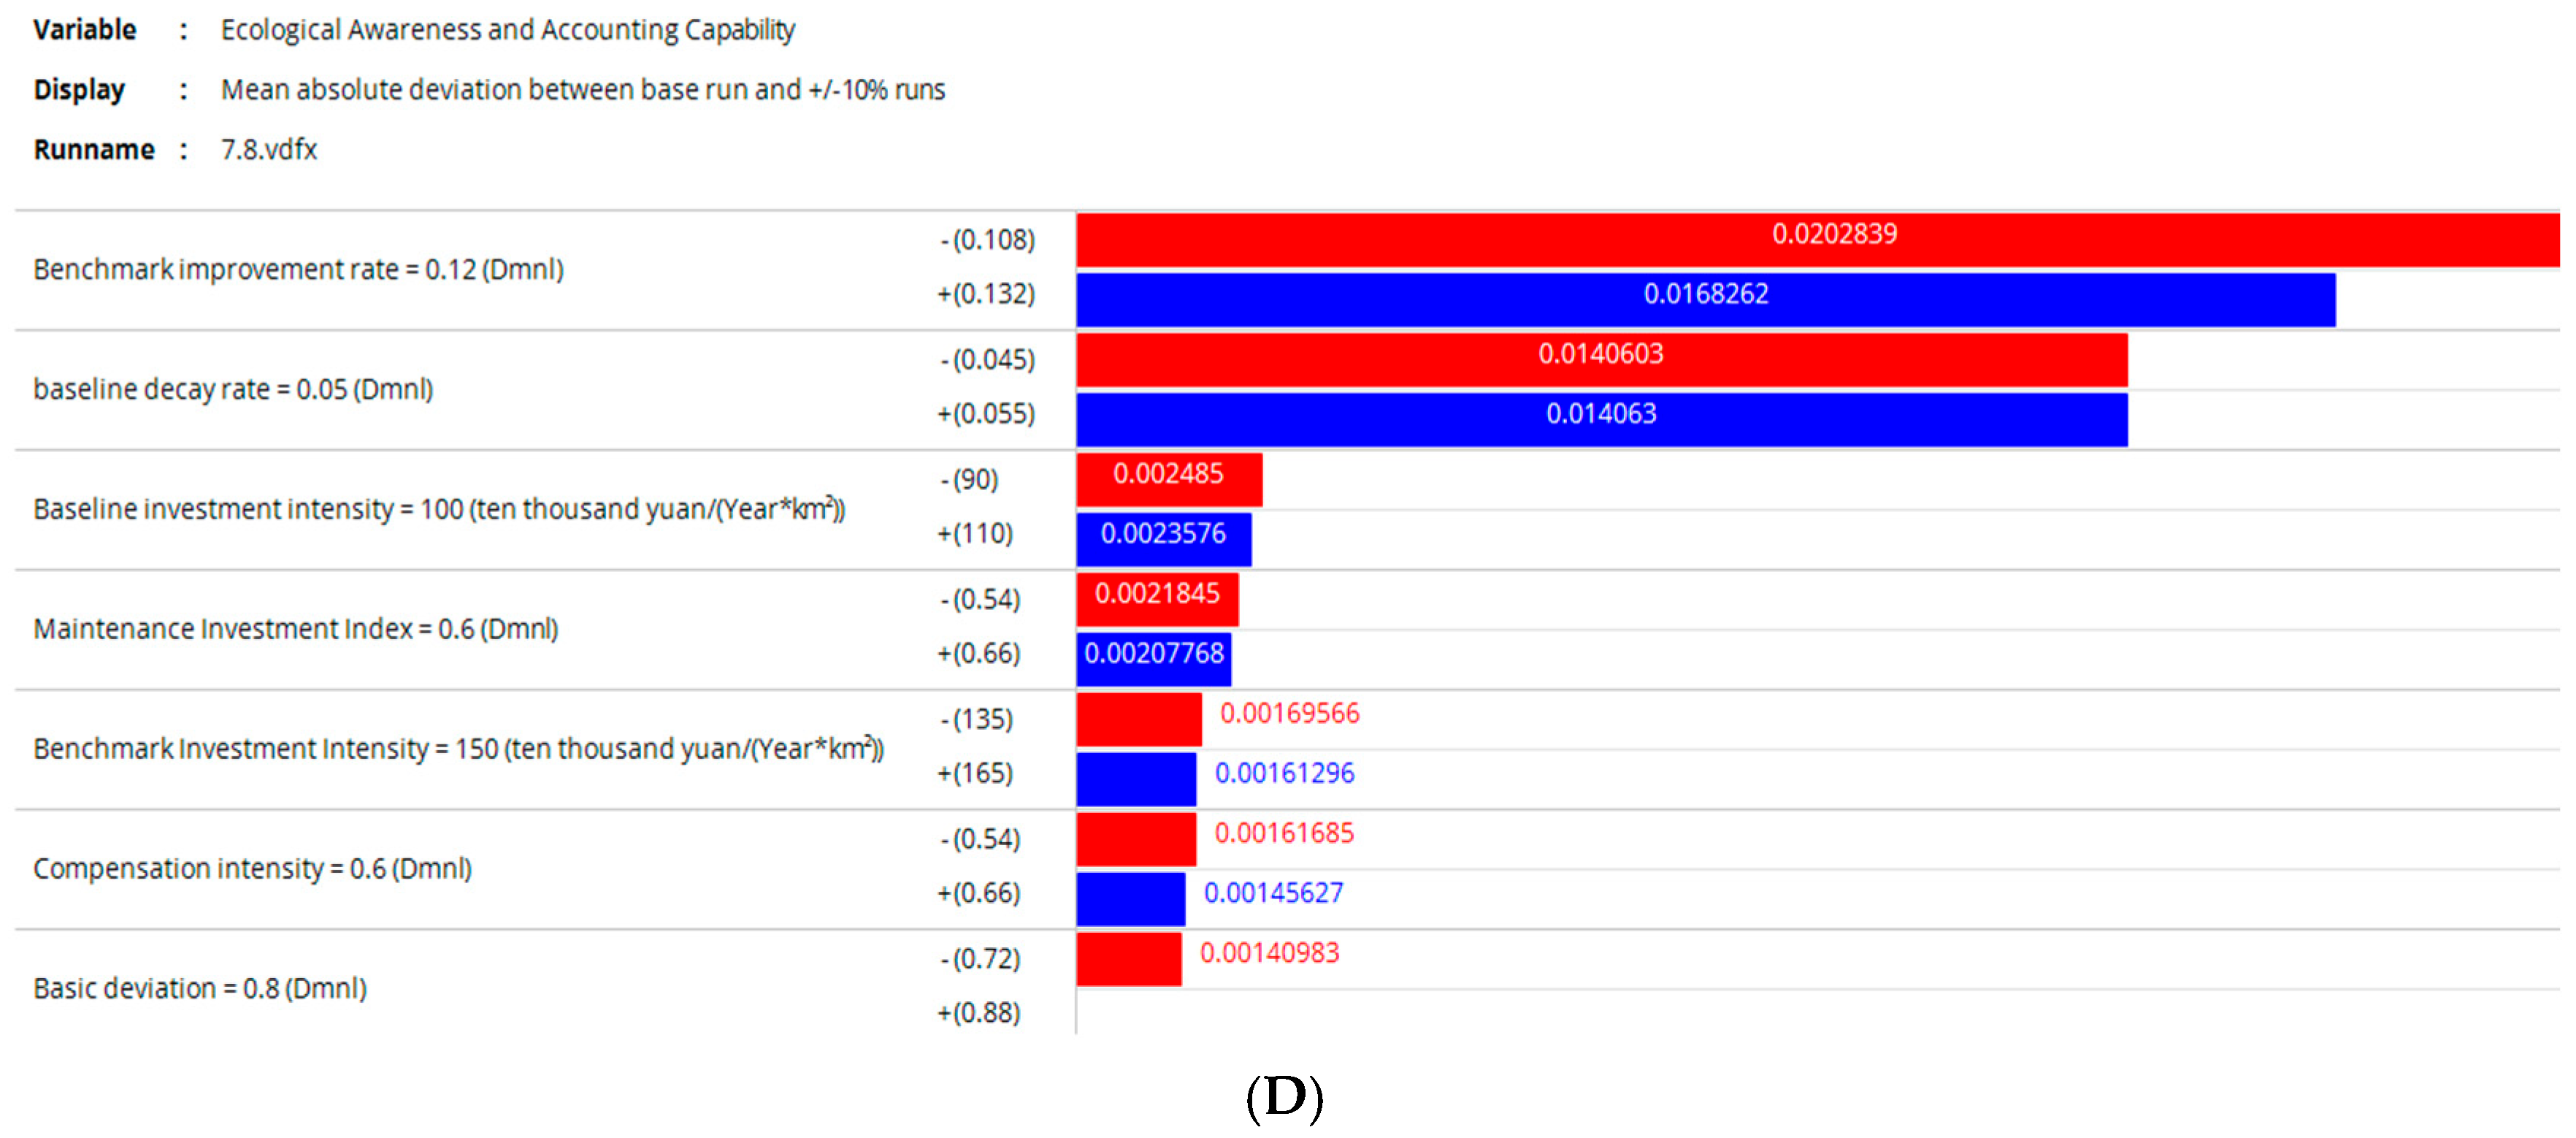
To further test the qualitative robustness of the model structure and avoid behavioral distortions caused by parameter value deviations, in this study, the core mediating variable linking digital empowerment and ecological capital accumulation—ecological perception and accounting capability—is selected, and four sets of extreme parameter scenarios are constructed for limit testing: extremely low baseline improvement rate, extremely high baseline improvement rate, extremely low digital investment intensity, and extremely high digital investment intensity. The simulation results are presented in Figure 10.
The extreme scenario results indicate that under an extremely low improvement rate, the accumulation rate of ecological perception capability significantly slows, and the steady-state peak decreases; however, overall, it still maintains positive growth without logical paradoxes. Under an extremely high improvement rate, the system’s accumulation process is significantly advanced, and the evolution curve exhibits S-shaped convergence characteristics without overshooting or oscillatory instability. In the extremely low investment intensity scenario, the system evolution trajectory shifts downwards overall, but the long-term growth trend remains stable. In the extremely high investment intensity scenario, the accumulation cycle of perception capability is notably shortened, and the system responds efficiently and in an orderly manner.
Overall, the model does not exhibit pathological operational behavior under extreme parameter perturbations, consistently adhering to the theoretical logic that “the stronger the investment, the faster the perception accumulation, and the better the system evolution,” with no reverse paradox relationships. The results of the extreme condition tests confirmed that the model structure was stable, that the feedback mechanism was reliable, and that it possessed strong structural robustness and scenario adaptability.
The sensitivity analysis results for ecological perception and accounting capabilities under extreme scenarios are shown in Figure 10.

3.4.3. Sensitivity Analysis of Key Parameters

To verify whether the core research conclusions depend on specific parameter values, three key parameters that dominate system evolution were selected in this study: the basic accumulation efficiency, the baseline loss rate, and the initial value of the urban–rural digital divide. Multiple perturbation scenarios were set, and while keeping the other parameters unchanged, their impacts on three core output variables, namely, the ecological wisdom capital, ecological carrying capacity, and system synergy level of the food system, were observed to systematically assess the robustness of the model. The baseline parameter values and perturbation ranges were set as follows: basic accumulation efficiency baseline of 0.07 (±30% perturbation), baseline loss rate of 0.03 (±30% perturbation), and initial digital divide of 0.7 (±20% perturbation). The multi-scenario simulation results are presented in Table 5.
(1) Sensitivity of the Basic Cumulative Efficiency
Basic cumulative efficiency is most sensitive to the steady-state level of ecological wisdom capital. Under the −30% disturbance scenario, the terminal value of ecological wisdom capital decreases from the baseline of 3.26 to 2.18, a decrease of approximately 33.2%; under the +30% disturbance scenario, the capital level increases to 4.33, an increase of approximately 32.9%. The asymmetric changes between positive and negative disturbances stem from the continuous effect of the system’s loss mechanism, where capital depletion does not decrease synchronously during the efficiency decline phase, resulting in a slightly stronger and more negative impact. Even under wide-range disturbance conditions, the degree of synergy and ecological carrying capacity of the system remained stable, and the system consistently surpassed the phase transition threshold of 0.7, demonstrating that system resilience can effectively offset the shocks caused by fluctuations in cumulative efficiency.
(2) Sensitivity of the Basic Loss Rate
The basic loss rate has a relatively limited effect on the system variables. When the loss rate is reduced by 30%, ecological wisdom capital increases slightly by 6.3%; when the loss rate is increased by 30%, capital decreases slightly by 6.4%. The weak sensitivity of the loss rate is due to the incorporation of multiple regulatory layers in the model, which buffer the direct impact of natural loss fluctuations on the capital stock. Under extreme scenarios of accelerated loss, both the carrying capacity and degree of synergy maintained steady-state levels, indicating that the model system possesses a relatively wide tolerance range for losses.
(3) Sensitivity to the Initial Value of the Urban–Rural Digital Divide.
The initial condition of the urban–rural digital divide has the weakest effect on system evolution. Within a ±20% perturbation range, the fluctuations in ecological wisdom capital, carrying capacity, and degree of synergy are less than 0.001, indicating almost no difference. These results indicate that the long-term evolution of the system is dominated by sustained positive feedback mechanisms. In the later stages, digital empowerment, ecological perception iteration, and capital accumulation can fully compensate for the disadvantages of the initial conditions, and the final steady state of the system does not depend on the initial level of the digital divide.
(4) Comprehensive Robustness Assessment
On the basis of multiple perturbation scenarios, robust conclusions can be drawn: First, under all the scenarios, the degree of system synergy remains consistently above the critical phase transition threshold (0.7), and the core conclusion does not depend on precise parameter values; second, the fluctuation range of the steady-state ecological carrying capacity is less than 0.3%, indicating that the evolution path of the ecological subsystem is highly robust; and third, the parameter sensitivity follows a clear gradient: basic accumulation efficiency > baseline loss rate > urban–rural digital divide, confirming that cumulative digital technology empowerment is the core leverage variable driving the synergistic transformation of the urban–rural food system, which is highly consistent with the theoretical framework of this study. Overall, the parameter configuration of this model was reasonable, and the conclusions were robust and reliable.

3.4.4. Comparative Analysis of Policy Intervention Scenarios

To quantify the differential effects of various governance strategies and provide a simulation basis for subsequent phased policy optimization, this study establishes two types of control scenarios on the basis of the baseline scenario: a scenario without digital technology empowerment (N) and a high-investment acceleration scenario (H), as follows: The differential characteristics of system co-evolution were compared and analysed, and the results are shown in Table 6.
(1) Scenario without digital technology empowerment (N)
In the extreme scenario, where digital empowerment is nearly turned off, the system’s end-of-period synergy can still reach 0.782, exceeding the phase transition threshold. This finding indicates that digital technology is not a necessary condition for the system’s synergistic transition; the system can rely on endogenous mechanisms such as policy synergy, ecological capital accumulation, and community participation to complete structural transformation. However, compared with the baseline scenario, the synergy in this scenario decreases by 5.2%, and there is a significant evolutionary lag: the baseline scenario achieves a synergy level of 0.78 by the 25th year, whereas the no-technology scenario only reaches this level by the end of the period. This suggests that the core value of digital technology lies in compressing the system’s vulnerable period and shortening the duration of the fragmented governance phase, acting as an efficient accelerator of the system’s benign phase transition. These results effectively respond to the governance logic of “avoiding technology-driven singularity and emphasizing system synergy evolution,” indicating that the absence of technology primarily poses a risk of time lag rather than transformation failure.
(2) High-Investment Accelerated Scenario (H)
In the high-intervention scenario with simultaneous improvements in cumulative efficiency and technology investment, the system’s end-state steady state only slightly increases by 0.1%, with extremely low marginal gains. The underlying reason is that the synergy of the system follows a logistic growth pattern, where the growth space narrows after it approaches the steady-state threshold, leading to rapidly diminishing marginal returns on additional investment. However, trajectory comparisons reveal that the high-investment scenario can advance the time for the system to exceed the high synergy threshold by 2–3 years. For ecologically sensitive urban–rural fringe areas, shortening the period of fragmented imbalance and entering a synergistic steady state earlier can significantly reduce cumulative ecological losses caused by habitat fragmentation and resource misallocation, offering important phased governance value.
(3) Policy Implications
A multi-scenario comparison yields three core governance insights. First, digital technology acts as an “accelerating variable” rather than an “on-off switch”; it cannot independently determine the success or failure of systemic transformation, but it can significantly optimize the transformation timeline and reduce ecological exposure risks. Second, the core of governance challenges lies in the temporal mismatch between technology and institutions rather than the failure of technological empowerment. To avoid the governance trap of “technology first, institutions lagging behind,” dynamic alignment between technological empowerment and institutional coordination through phased deployment is necessary. Third, peri-urban food system governance exhibits a significant window-of-opportunity effect, where uniform investment is relatively inefficient. Digital construction and ecological restoration resources should be concentrated in the critical 10–15-year window in the early stage of systemic transformation to achieve precise and efficient empowerment.

4. Conclusions and Implications

4.1. Main Conclusions

In this study, the system dynamics methodology, particularly the social–ecological system (SES) model, is adopted to explore the evolution of a sustainable food system in an urban–rural fringe zone under the dual influence of digital ecological monitoring and green infrastructure. The model is based on three aspects: ecological perception and accounting capacity, food system–landscape resource metabolic synergetic mechanisms, and ecological wisdom capital. The variables included in the model included ecological wisdom capital, ecological perception and accounting capacity, food-ecological coupling system resilience, and digital technologies. After the main indices, relevant parameters, and dynamic influence equations were determined, a 50-year simulation was conducted. The main research findings are as follows:
First, the transition of food systems from fragmentation to synergy, supported by the improved resilience of peri-urban areas, can be understood as a self-organized process driven by external forces. For example, digital technologies improve policy coordination and reduce information gaps in food–ecological governance. They also improve the accuracy of payments for food ecosystem services, helping build efficient resource circulation networks between urban and rural areas for food production. Through nonlinear interactions and synergies among system components, the food system can gradually move toward a stable and orderly state. According to symbiosis theory, ecological wisdom capital, system resilience, food system resource metabolic efficiency, and urban–rural development pressure interact through mutually beneficial relationships within the complex system. Together, these factors improve the system’s ability to maintain food production and supply under disturbances.
Second, ecological perception and accounting capabilities, which are stimulated by the maturity of digital technology, the scope of its use, and the rise in investment intensity, are the leading indicators of food system transformation. The improvement in ecological perception and accounting capabilities not only catalyzes the introduction and penetration of digital ecological monitoring in tandem with green infrastructure but also enhances the self-organizing recovery capability of the food–ecology coupled system in urban–rural fringe zones. Such improved system resilience renders it better equipped to guard against the perils of habitat fragmentation and secure food production space. Simultaneously, clear expectations regarding outcomes also encourage community participation, increasing the initiative and subjective agency of communities/residents, as well as policy efficiency and implementation. This further supports the implementation of smart urban–rural planning projects and related policies. It helps reduce the urban–rural development gap, strengthen connections among subsystems, and improve system resilience and resource metabolism efficiency in food systems. Measures such as gentrification control and anti-speculation policies can also support these improvements. These changes feed back into community participation, which continuously strengthens the ability of food systems to absorb and adapt to the impacts of habitat fragmentation.
Third, digital technology can be an instrumental and empowering factor in the evolution of food systems in the urban fringe from fragmentation to synergy, serving as an external energy source for self-organizing phase transitions and providing the driving force for this process. Digital technology can promote organizational synergy by deepening the breadth of digital applications and digital empowerment, thereby relaxing the energy barriers to food system metabolic efficiency. It can promote an efficient, closed-loop metabolic network of water resources and energy for food production between urban and rural areas and between functions, alleviate development pressure, and support such food systems in urban fringes to resist ecological fragmentation so that they move toward a steady state.
Fourth, the results of this study reveal that the core ecological carrying capacity for food production does not necessarily exhibit a monotonic growth trend; instead, it undergoes an adaptive cycle process, which is consistent with Holling’s ecological resilience theory. In the early stages of system evolution, restoration investments yield rapid results, with the load capacity curve increasing steeply. However, it soon reaches a peak and enters a brief adjustment period before eventually entering a phase of steady growth until it approaches saturation.
Fifth, the urban–rural development gap curve and the urban–rural development pressure curve both conform to the logic of the Environmental Kuznets Curve during the synergistic evolution of the food system, exhibiting an inverted U-shaped trend. In the early stages of rapid development, the system inevitably experiences a period of ecological pain. During this time, the empowering effects of digital technology and policy impacts failed to fully materialize because of lag effects, accompanied by friction between old and new institutions, policy conflicts, and interest divergences. This leads to a temporary decline in investment in ecological restoration for food production and the intensity of digital technology application, causing the urban–rural development gap and development pressure to also regress. However, over time, as ecological perception and accounting capabilities, along with ecological smart capital, cross a critical threshold, the empowering effects of digital technology and policy impacts help accelerate the system’s self-organizing phase transition. The core ecological carrying capacity for food production begins to recover, and the urban–rural development gap and development pressure return to an improvement trajectory.

4.2. Theoretical Contributions

In the literature, in-depth research has not yet been conducted on “ecological wisdom drives food systems in urban–rural fringe areas in urban–rural fringe areas.” Most related studies have conducted static empirical analyses, ignoring dynamic analyses. On the basis of social–ecological system (SES) theory, we constructed a model from three dimensions—ecological perception, resource metabolism synergy, and ecological wisdom capital—to identify co-evolutionary mechanisms among them. The theoretical contributions of this study are as follows:
First, from the perspective of complex system theory, this study demonstrates that the evolution of food systems in urban–rural fringe areas from fragmentation to synergy is, in essence, a self-organizing phase transition process of complex urban–rural systems. This cognitive model breaks from the traditional static city–rural dualism, revealing the fluctuation mechanism and mutation characteristics in the process of system evolution. The introduction of such systems thinking meets the urgent need for systematic assessment frameworks in food system transformation and innovation and promotes the expansion of synergy and symbiosis theories in the context of the digital transformation of food system governance. This discovery provides a dynamic and adaptive theoretical reference for enhancing the resilience of sustainable food systems in the context of global urban–rural integration.
Second, our research identifies and verifies that digital technology is a key incentive for food system resilience to habitat fragmentation and urban–rural knitting in urban–rural fringe areas. Digital technology is not an external tool but a stopping point and breakout point for overcoming the barriers to resource metabolism efficiency and activating the internal synergy effect of the food system. This is slightly a buckle effect on the data support point of digital technology promoting sustainable agriculture and the bioeconomy, revealing from a dynamic point of view the leverage effect of digital technology in food system governance and providing a verifiable digital theoretical pathway for the construction of globally sustainable food systems.
Finally, this study transcends the limitations of traditional food system governance, which often treats interconnections in a piecemeal fashion, by bringing together ecological wisdom, resilience, sense-making abilities, and digital empowerment into a single dynamic analysis paradigm. This study specifically addresses the high-priority sustainability problem of peri-urban agricultural food systems, considering their nonlinearities and transition dynamics during dynamic evolution. This extends the frontiers of food system governance theory to urban–rural fringe regions and lays the groundwork for the planning and design of consequent food systems.

4.3. Practical Implications

System simulation and co-evolution analysis show that food systems in urban–rural fringe areas have shifted from fragmented imbalance toward coordinated stability. This process includes five stages: building a digital perception foundation, increasing resource pressure, restructuring resource metabolism, accumulating smart capital, and achieving system stability through phase transition. Based on system feedback, element changes, and threshold effects, this study proposes four governance strategies: monitoring system development, digital technology adaptation, grassroots participation improvement, and targeted intervention at critical stages. These strategies provide practical guidance for improving the resilience of peri-urban food systems.
First, an integrated monitoring and early warning system for urban–rural food and ecological systems should be established to support collaborative governance. Ecological perception and accounting capabilities are important for reducing information gaps, improving resource management, and promoting food system transformation. Led by local natural resource and agricultural authorities, and supported by research institutes, sub-districts, and villages, this system can build on existing spatial monitoring platforms. It should include new modules for identifying habitat fragmentation, assessing food-related ecosystem services, and monitoring farmland quality. The system should also create data-sharing channels across different departments. This can reduce barriers between food production, ecological protection, and urban–rural development. It can help form a closed process of “dynamic monitoring, accurate assessment, and risk prediction.” The implementation can be divided into three stages. In the short term, monitoring facilities should be established in key peri-urban areas to collect basic indicators regularly. In the medium term, risk assessment and early warning modules should be developed to identify habitat fragmentation and ecological carrying capacity risks in advance. In the long term, monitoring results should be integrated into spatial planning, farmland management, and project approval. Different areas require different governance approaches. Rapidly expanding fringe areas need frequent monitoring to prevent habitat fragmentation caused by development. Stable peri-urban areas can use regular annual assessments to improve efficiency. Less-developed areas should first improve monitoring infrastructure and gradually enhance ecological accounting and spatial management. These actions can reduce differences among stakeholders and provide scientific support for resilient food system governance.
Second, digital technologies should be adapted to local conditions to avoid inefficient investment and resource waste. System simulations show that digital technology has different effects at different stages of system development. When system coordination is low, simply increasing digital infrastructure investment may not improve resource metabolism efficiency. It may also create a gap between technology and governance capacity. Local agricultural and rural authorities should work with technology providers and agricultural operators to promote digital development. A pre-assessment system for digital investment should be established. Digital tools should be selected based on regional institutions, governance capacity, and system development level. Practical applications, such as smart monitoring, precise management, production improvement, and food loss reduction, should be promoted. This can avoid excessive and unsuitable digital construction. Implementation can be divided into three stages. In the short term, the digital foundation and actual needs of peri-urban areas should be assessed. In the medium term, pilot areas should be selected for adaptive digital transformation. In the long term, a reusable evaluation system for digital investment should be developed. Different areas require different strategies. Rapidly growing peri-urban areas should improve digital infrastructure, strengthen data collection, and enhance dynamic monitoring. Mature areas can gradually promote smart agriculture and ecological monitoring. Shrinking areas should make better use of existing digital facilities, control unnecessary investment, and maximize the benefits of digital technology.
Third, community participation mechanisms should be improved to increase ecological wisdom capital and strengthen internal system drivers. The accumulation of ecological wisdom capital and active community participation are important for improving system resilience and maintaining long-term stability. Based on streets, towns, and villages, a multi-actor governance system should be established with support from agricultural, rural, and natural resource departments. This system should connect village collectives, social organizations, and farmers. A multi-level consultation platform should be developed. Incentive mechanisms, including ecological compensation and payments for ecosystem services, should be improved. Ecological education and policy communication should also be strengthened to increase local participation and cooperation. Implementation can be divided into three stages. In the short term, basic consultation channels should be established and ecological knowledge education should be provided. In the medium term, incentive and compensation mechanisms should be improved to increase participation. In the long term, a regular system of self-governance, self-adjustment, and collaborative governance should be formed. Different areas need different approaches. In high-pressure peri-urban areas, priority should be given to farmer compensation to reduce conflicts and protect grain production. In mature areas, efforts should focus on improving community self-governance capacity. In less-developed areas, attention should be given to protecting local rights, providing basic education, and building social capital to strengthen the system’s ability to resist habitat fragmentation.
Finally, targeted interventions based on system transition thresholds should be implemented to support the shift toward a stable state. Simulation results show that development pressure, factor gaps, and system synergy in urban–rural fringe food systems have nonlinear changes and critical transition points. Timely interventions can improve system performance with lower costs. Natural resource and agricultural authorities should coordinate actions, while planning institutions provide technical support for threshold assessment. Based on key transition points, pressure peaks, and changes in carrying capacity identified by simulations, interventions should be adjusted according to local conditions. When key factors approach critical thresholds, targeted policies, funding, and projects should be used to reduce resource losses and negative feedback effects. Implementation can be divided into three stages. In the short term, risks related to habitat fragmentation, carrying capacity changes, and development pressure should be identified. In the medium term, threshold-based thinking should be integrated into spatial planning, farmland protection, and ecological restoration plans. In the long term, a continuous governance system of “dynamic monitoring, threshold assessment, targeted intervention, and effect adjustment” should be established. Different areas require different interventions. Rapidly expanding peri-urban areas should focus on preventing habitat fragmentation risks by developing green infrastructure and ecological buffer zones in advance. Mature areas should maintain system stability and prevent declines in carrying capacity and synergy. Shrinking areas should restore key food production ecological spaces and rebuild healthy resource cycles. Through coordinated actions, regional management, and phased regulation, urban–rural fringe food systems can achieve a balance among ecological protection, food production, and urban–rural development, improving their resilience and sustainability.

5. Limitations and Future Directions

In this study, a system dynamics model based on the social–ecological system (SES) framework is constructed, and three-dimensionally and dynamically coupled digital technology, food system–landscape resource metabolism synergies, and ecological wisdom are developed. While it preliminarily reveals the evolutionary mechanisms through which food systems in urban–rural ecotones resist habitat fragmentation and achieve synergistic development, providing a quantitative reference for sustainable food system construction, several aspects still require further refinement. First, the second-order theoretical model used in this study lacks quantitative validation, such as structural or behavioral verification. This limitation stems from the nature of the second-order model, whose validity is primarily reliant on theoretical logical rigor rather than data fitting accuracy but is also constrained by data availability for core variables. Future studies could select typical urban–rural ecotone cases to obtain primary data through fieldwork and expert interviews for structural validation. Alternatively, once sufficient time series data are accumulated, behavior reproduction tests can be conducted to enhance the robustness of the model. Second, the modelling of digital technology and policy simulation remains aggregated without distinguishing or simulating system responses under different technological or policy combinations. Future work could attempt to decompose these variables multidimensionally and construct a library of diverse policy combination scenarios for in-depth analysis. Furthermore, the model, which is grounded in theory and simulation, has yet to be empirically tested at specific case study sites; both the external validity and generalizability of the conclusions warrant verification. Future research could select typical urban fringe or major grain-producing areas for case embedding, calibrate parameters through fieldwork, and test application effects in real decision-making contexts to facilitate the transformation into decision-support tools, thereby endowing the model with practical value and real guiding significance.

Author Contributions

Conceptualization, S.T., T.S. and H.W.; Methodology, S.T., T.S. and H.W.; Software, H.W.; Validation, S.T., T.S. and H.W.; Formal Analysis, Y.J.; Investigation, S.T.; Resources, H.W.; Data Curation, T.S. and Y.J.; Writing—Original Draft Preparation, S.T. and H.W.; Writing—Review & Editing, S.T., T.S. and H.W.; Visualization, T.S.; Supervision, H.W.; Project Administration, Y.J.; Funding Acquisition, H.W. All authors have read and agreed to the published version of the manuscript.

Funding

2024 Zhejiang Provincial Social Science Planning “Social Science Empowerment Action” Special Project (24FNSQ071YB).

Data Availability Statement

The data presented in this study are available on request from the corresponding author. The data are not publicly available due to privacy.

Conflicts of Interest

The authors declare no conflicts of interest.

References

  1. Zhong, Q.; Li, G.; Jiao, Y.; Li, J.; Li, C.; Yan, Q.; Wu, Z. Spatiotemporal Dynamics of Sustainable Development in Resource-Based Cities: Insights from an SDGs-Oriented Framework and its Link to Carbon Emissions. Appl. Spat. Anal. 2025, 18, 154. [Google Scholar] [CrossRef] [Scilit]
  2. Stafford-Smith, M.; Griggs, D.; Gaffney, O.; Ullah, F.; Reyers, B.; Kanie, N.; Stigson, B.; Shrivastava, P.; Leach, M.; O’connell, D. Integration: The key to implementing the Sustainable Development Goals. Sustain. Sci. 2017, 12, 911–919. [Google Scholar] [CrossRef] [Scilit] [PubMed]
  3. Bhasin, N.; Kumar, S.; Singh, G.S. Participatory nature-driven urbanism: A pathway to achieving SDG-11 through community-led action. Urban Ecosyst. 2025, 28, 187. [Google Scholar] [CrossRef] [Scilit]
  4. United Nations Human Settlements Programme (UN-Habitat). World Cities Report 2022: Envisaging the Future of Cities; United Nations Human Settlements Programme: Nairobi, Kenya, 2022. [Google Scholar]
  5. Chen, K.Z.; Mao, R.; Zhou, Y. Rurbanomics for common prosperity: New approach to integrated urban-rural development. China Agric. Econ. Rev. 2023, 15, 1–16. [Google Scholar] [CrossRef] [Scilit]
  6. Guo, Y.; Li, S. A policy analysis of China’s sustainable rural revitalization: Integrating environmental, social and economic dimensions. Front. Environ. Sci. 2024, 12, 1436869. [Google Scholar] [CrossRef] [Scilit]
  7. Shi, C.; Zhu, X.; Wu, H.; Li, Z. Urbanization Impact on Regional Sustainable Development: Through the Lens of Urban-Rural Resilience. Int. J. Environ. Res. Public Health 2022, 19, 15407. [Google Scholar] [CrossRef] [Scilit] [PubMed]
  8. Whitehead, M. (Re) Analysing the sustainable city: Nature, urbanisation and the regulation of socio-environmental relations in the UK. Urban Stud. 2003, 40, 1183–1206. [Google Scholar] [CrossRef] [Scilit]
  9. While, A.; Jonas, A.E.; Gibbs, D. The environment and the entrepreneurial city: Searching for the urban ‘sustainability fix’in Manchester and Leeds. Int. J. Urban Reg. Res. 2004, 28, 549–569. [Google Scholar] [CrossRef] [Scilit]
  10. Hodson, M.; Marvin, S. Intensifying or transforming sustainable cities? Fragmented logics of urban environmentalism. Local Environ. 2017, 22, 8–22. [Google Scholar] [CrossRef] [Scilit]
  11. Zimmerer, K.S.; Duvernoy, I.; Qiu, J.; Tutu, R.; WinklerPrins, A. Periurban agrifood systems as high-priority sustainability challenges. Front. Sustain. Food Syst. 2026, 10, 1773657. [Google Scholar] [CrossRef] [Scilit]
  12. Lyu, R.; Hussein, M.K.B.; Shukor, S.F.A.; Zhuang, Q.; Yang, H. Bridging the gap between policy logic and stakeholder perceptions: A dual assessment of ecosystem services in Chengdu’s peri-urban agricultural areas. Front. Sustain. Food Syst. 2026, 10, 1745089. [Google Scholar] [CrossRef] [Scilit]
  13. Seddon, N.; Smith, A.; Smith, P.; Key, I.; Chausson, A.; Girardin, C.; House, J.; Srivastava, S.; Turner, B. Getting the message right on nature-based solutions to climate change. Glob. Change Biol. 2021, 27, 1518–1546. [Google Scholar] [CrossRef] [Scilit] [PubMed]
  14. Zarei, M.; Shahab, S. Nature-based solutions in urban green infrastructure: A systematic review of success factors and implementation challenges. Land 2025, 14, 818. [Google Scholar] [CrossRef] [Scilit]
  15. Banzhaf, E.; Anderson, S.; Grandin, G.; Hardiman, R.; Jensen, A.; Jones, L.; Knopp, J.; Levin, G.; Russel, D.; Wu, W.; et al. Urban-rural dependencies and opportunities to design nature-based solutions for resilience in Europe and China. Land 2022, 11, 480. [Google Scholar] [CrossRef] [Scilit]
  16. Dutta, S.; Banerjee, S.; Mookherjee, A.; Abichandani, Y.; Siddhanta, S.; Sinha, A. Bridging Technology and Sustainability: A systematic review of AI applications in Global Food systems. Front. Sustain. Food Syst. 2026, 10, 1785515. [Google Scholar] [CrossRef] [Scilit]
  17. Sermuksnyte-Alesiuniene, K.; Ispiryan, A. The impact of digital technology on sustainable agriculture and bioeconomy. Front. Sustain. Food Syst. 2026, 10, 1655881. [Google Scholar] [CrossRef] [Scilit]
  18. Haddad, N.M.; Brudvig, L.A.; Clobert, J.; Davies, K.F.; Gonzalez, A.; Holt, R.D.; Lovejoy, T.E.; Sexton, J.O.; Austin, M.P.; Collins, C.D.; et al. Habitat fragmentation and its lasting impact on Earth’s ecosystems. Sci. Adv. 2015, 1, e1500052. [Google Scholar] [CrossRef] [Scilit] [PubMed]
  19. Fahrig, L. Effects of habitat fragmentation on biodiversity. Annu. Rev. Ecol. Evol. Syst. 2003, 34, 487–515. [Google Scholar] [CrossRef] [Scilit]
  20. Mitchell, M. Ecosystem services in the landscape. In The Routledge Handbook of Landscape Ecology; Routledge: Abingdon, UK, 2021; pp. 386–410. [Google Scholar]
  21. Foley, J.A.; DeFries, R.; Asner, G.P.; Barford, C.; Bonan, G.; Carpenter, S.R.; Chapin, F.S.; Coe, M.T.; Daily, G.C.; Gibbs, H.K.; et al. Global consequences of land use. Science 2005, 309, 570–574. [Google Scholar] [CrossRef] [Scilit] [PubMed]
  22. Rahmoun, T.; Zhao, W. A New Model of a Spatial Structural Map for Re-Building Urban-Rural Links a Case Study: Syrian Coastal Region. Int. Rev. Spat. Plan. Sustain. Dev. 2024, 12, 21–43. [Google Scholar]
  23. Aflaki Samani, E.; Fanni, Z.; Jafarpour Ghalehteimouri, K. Integrating informal settlements into sustainable land use planning: A phased development framework for addressing spatial inequalities in Chabahar, Iran. City Built Environ. 2025, 3, 26. [Google Scholar] [CrossRef] [Scilit]
  24. Food and Agriculture Organization of the United Nations. Sustainable Food Systems: Concept and Framework; Food and Agriculture Organization of the United Nations: Rome, Italy, 2018. [Google Scholar]
  25. Alexander, D.E. Resilience and disaster risk reduction: An etymological journey. Nat. Hazards Earth Syst. Sci. 2013, 13, 2707–2716. [Google Scholar] [CrossRef] [Scilit]
  26. Meerow, S.; Newell, J.P. Urban resilience for whom, what, when, where, and why? Urban Geogr. 2019, 40, 309–329. [Google Scholar] [CrossRef] [Scilit]
  27. Intergovernmental Panel on Climate Change. Climate change 2022: Impacts, adaptation and vulnerability. In Contribution of Working Group II to the Sixth Assessment Report of the Intergovernmental Panel on Climate Change; Pörtner, H.-O., Roberts, D.C., Tignor, M., Poloczanska, E.S., Mintenbeck, K., Alegría, A., Craig, M., Langsdorf, S., Löschke, S., Möller, V., et al., Eds.; Cambridge University Press: Cambridge, UK, 2022. [Google Scholar]
  28. United Nations Office for Disaster Risk Reduction. Sendai Framework for Disaster Risk Reduction 2015–2030. 2015. Available online: https://www.undrr.org/publication/sendai-framework-disaster-risk-reduction-2015-2030 (accessed on 9 August 2026).
  29. Holling, C.S. Resilience and Stability of Ecological Systems. Annu. Rev. Ecol. Evol. Syst. 1973, 4, 1–23. [Google Scholar] [CrossRef] [Scilit]
  30. Haken, H. Synergetics: An Introduction: Nonequilibrium Phase Transitions and Self-Organization in Physics, Chemistry, and Biology, 3rd ed.; Springer: Berlin/Heidelberg, Germany, 1983. [Google Scholar]
  31. Costanza, R.; d’Arge, R.; De Groot, R.; Farber, S.; Grasso, M.; Hannon, B.; Limburg, K.; Naeem, S.; O’Neill, R.V.; Paruelo, J.; et al. The value of the world’s ecosystem services and natural capital. Nature 1997, 387, 253–260. [Google Scholar] [CrossRef] [Scilit]
  32. Daily, G.C. (Ed.) Nature’s Services: Societal Dependence on Natural Ecosystems; Island Press: Washington, DC, USA, 1997. [Google Scholar]
  33. Barbier, E.B. The basic natural asset model. In Capitalizing on Nature: Ecosystems as Natural Assets; Cambridge University Press: Cambridge, UK, 2011; pp. 85–128. [Google Scholar]
  34. Fenichel, E.P.; Abbott, J.K. Natural capital: From metaphor to measurement. J. Assoc. Environ. Resour. Econ. 2014, 1, 1–27. [Google Scholar] [CrossRef] [Scilit]
  35. Ahmadjian, V.; Paracer, S. Symbiosis: An Introduction to Biological Associations; University Press of New England: Lebanon, NH, USA, 1986. [Google Scholar]
  36. Berkes, F.; Colding, J.; Folke, C. Rediscovery of traditional ecological knowledge as adaptive management. Ecol. Appl. 2000, 10, 1251–1262. [Google Scholar] [CrossRef] [Scilit]
  37. Folke, C.; Hahn, T.; Olsson, P.; Norberg, J. Adaptive governance of social-ecological systems. Annu. Rev. Environ. Resour. 2005, 30, 441–473. [Google Scholar] [CrossRef] [Scilit]
  38. Barthel, S.; Folke, C.; Colding, J. Social–ecological memory in urban gardens—Retaining the capacity for management of ecosystem services. Glob. Environ. Change 2010, 20, 255–265. [Google Scholar] [CrossRef] [Scilit]
  39. Xiang, W.N. Doing real and permanent good in landscape and urban planning: Ecological wisdom for urban sustainability. Landsc. Urban Plan. 2014, 121, 65–69. [Google Scholar] [CrossRef] [Scilit]
  40. Liao, K.H.; Chan, J.K.H. What is ecological wisdom and how does it relate to ecological knowledge? Landsc. Urban Plan. 2016, 155, 111–113. [Google Scholar] [CrossRef] [Scilit]
  41. Wang, J.; Meng, F.; Dong, L.; Yu, S.; Zhang, Y. A Comparative Study on the Identification Methods of Urban–Rural Integration Zones from the Perspective of Symbiosis Theory and Urban Expansion Theory. Land 2023, 12, 1272. [Google Scholar] [CrossRef] [Scilit]
  42. Brynjolfsson, E.; McAfee, A. The Second Machine Age: Work Progress and Prosperity in a Time of Brilliant Technologies; WW Norton & Company: New York, NY, USA, 2014. [Google Scholar]
  43. Romer, P.M. Endogenous technological change. J. Political Econ. 1990, 98, S71–S102. [Google Scholar] [CrossRef] [Scilit] [PubMed]
  44. Zhang, Y.; Zhang, G.; Liu, J.; Yang, J. Digital technology empowering integrated urban-rural development: Practical dilemmas and optimized paths—Based on the “Technology-Organization-Environment” framework. J. Beijing Inst. Technol. (Soc. Sci. Ed.) 2026, 28, 151–165. [Google Scholar] [CrossRef]
  45. Legun, K.; Keller, J.C.; Carolan, M.; Bell, M.M. (Eds.) The Cambridge Handbook of Environmental Sociology; Cambridge University Press: Cambridge, UK, 2020; Volume 2. [Google Scholar]
  46. Wu, H.; Tong, S.; Ren, B.; Mao, Y. System Dynamics Simulation of Collaborative Transformation for Urban–Rural Sustainable Development from the Perspective of Ecological Wisdom. Systems 2026, 14, 544. [Google Scholar] [CrossRef] [Scilit]
  47. Armendáriz, V.; Armenia, S.; Atzori, A.S. Systemic analysis of food supply and distribution systems in city-region systems—An examination of FAO’s policy guidelines towards sustainable agri-food systems. Agriculture 2016, 6, 65. [Google Scholar] [CrossRef] [Scilit]
  48. Gomez, M.; Mejia, A. Risk of simultaneous food shocks to cities increases with supply chain vulnerability to droughts. Environ. Res. Food Syst. 2025, 2, 025004. [Google Scholar] [CrossRef] [Scilit]
  49. Pickett, S.T.; Cadenasso, M.L.; Grove, J.M. Resilient cities: Meaning, models, and metaphor for integrating the ecological, socio-economic, and planning realms. Landsc. Urban Plan. 2004, 69, 369–384. [Google Scholar] [CrossRef] [Scilit]
  50. Sterman, J. System Dynamics: Systems thinking and modeling for a complex world. IEEE Eng. Manag. Rev. 2002, 30, 42. [Google Scholar] [CrossRef] [Scilit]
  51. Bockermann, A.; Meyer, B.; Omann, I.; Spangenberg, J.H. Modelling sustainability: Comparing an econometric (PANTA RHEI) and a systems dynamics model (SuE). J. Policy Model. 2005, 27, 189–210. [Google Scholar]
  52. Gu, C.; Guan, W.; Liu, H. Chinese urbanization 2050: SD modeling and process simulation. Sci. China Earth Sci. 2017, 60, 1067–1082. [Google Scholar] [CrossRef] [Scilit]
  53. Pejic Bach, M.; Tustanovski, E.; Ip, A.W.; Yung, K.L.; Roblek, V. System dynamics models for the simulation of sustainable urban development: A review and analysis and the stakeholder perspective. Kybernetes 2020, 49, 460–504. [Google Scholar]
  54. Espinoza, A.; Bautista, S.; Narváez, P.C.; Alfaro, M.; Camargo, M. Sustainability assessment to support governmental biodiesel policy in Colombia: A system dynamics model. J. Clean. Prod. 2017, 141, 1145–1163. [Google Scholar] [CrossRef] [Scilit]
  55. Lomi, A.; Larsen, E.R. (Eds.) Dynamics of Organizations: Computational Modeling and Organization Theories; Mit Press: Cambridge, MA, USA, 2001. [Google Scholar]
  56. Chen, L.T.; Xu, Q.R.; Wu, Z.Y. Strategic schema, innovation search and technological innovation capability evolution—Theoretical modeling and simulation based on system dynamics. Syst. Eng. Theory Pract. 2014, 34, 1705–1719. [Google Scholar] [CrossRef]
  57. Rogers, E.M. Diffusion of Innovations, 5th ed.; Free Press: New York, NY, USA, 2003. [Google Scholar]
  58. Jones, H.P.; Jones, P.C.; Barbier, E.B.; Blackburn, R.C.; Benayas, J.M.R.; Holl, K.D.; McCrackin, M.; Meli, P.; Montoya, D.; Mateos, D.M. Restoration and repair of Earth’s damaged ecosystems. Proc. R. Soc. B Biol. Sci. 2018, 285, 20172577. [Google Scholar] [CrossRef] [Scilit] [PubMed]
  59. North, D.C. Institutions, Institutional Change and Economic Performance; Cambridge University Press: Cambridge, UK, 1990. [Google Scholar] [CrossRef] [Scilit]
  60. Börner, J.; Baylis, K.; Corbera, E.; Ezzine-de-Blas, D.; Honey-Rosés, J.; Persson, U.M.; Wunder, S. The effectiveness of payments for environmental services. World Dev. 2017, 96, 359–374. [Google Scholar] [CrossRef] [Scilit]
  61. Barro, R.J.; Sala-i-Martin, X. Convergence. J. Political Econ. 1992, 100, 223–251. [Google Scholar] [CrossRef] [Scilit]
  62. Fang, C.; Chen, Z.; Liao, X.; Sun, B.; Meng, L. Urban-rural digitalization evolves from divide to inclusion: Empirical evidence from China. npj Urban Sustain. 2024, 4, 51. [Google Scholar] [CrossRef] [Scilit]
  63. Grossman, G.M.; Krueger, A.B. Economic growth and the environment. Q. J. Econ. 1995, 110, 353–377. [Google Scholar] [CrossRef] [Scilit]
  64. Scheffer, M.; Carpenter, S.R.; Lenton, T.M.; Bascompte, J.; Brock, W.; Dakos, V.; Van de Koppel, J.; Van de Leemput, I.A.; Levin, S.A.; Van Nes, E.H.; et al. Anticipating critical transitions. Science 2012, 338, 344–348. [Google Scholar] [CrossRef] [Scilit] [PubMed]
  65. Haken, H. Advanced Synergetics: Instability Hierarchies of Self-Organizing Systems and Devices; Springer Science & Business Media: Berlin/Heidelberg, Germany, 2012. [Google Scholar]
  66. Engert, M.; Hein, A.; Maruping, L.M.; Thatcher, J.B.; Krcmar, H. Self-Organization and Governance in Digital Platform Ecosystems: An Information Ecology Approach. MIS Q. 2025, 49, 91–122. [Google Scholar] [CrossRef] [Scilit]
  67. Barlas, Y. Teaching and advising in systems science and system dynamics—Personal experience, lessons, and reflections. Syst. Dyn. Rev. 2025, 41, e70003. [Google Scholar] [CrossRef] [Scilit]
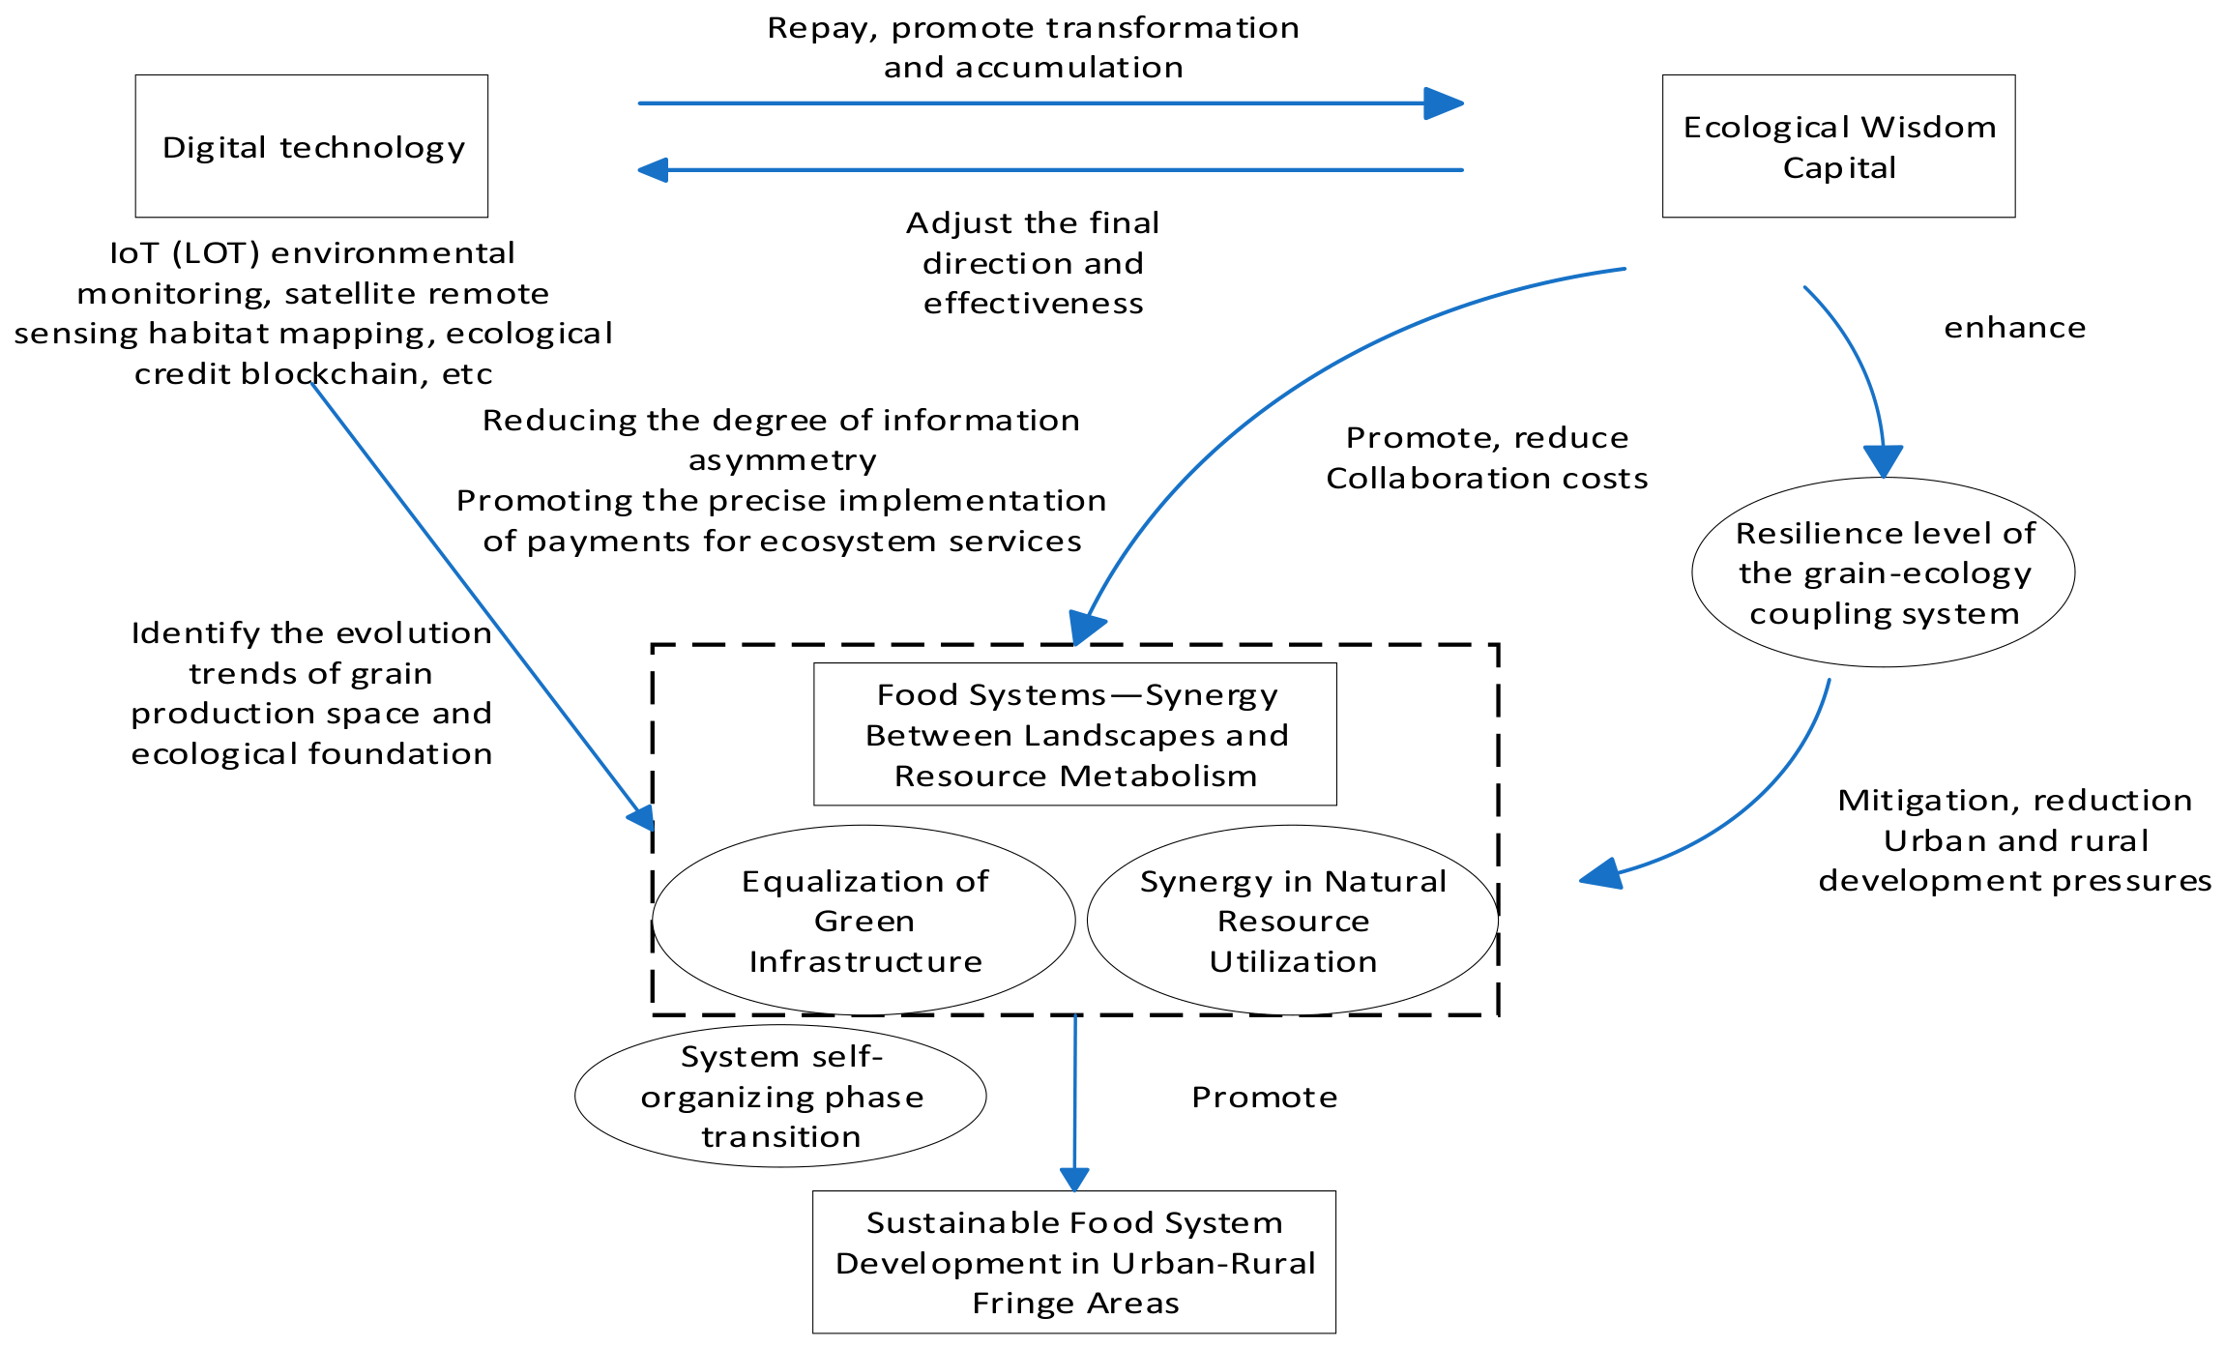
Figure 1. Conceptual model of sustainable food system development in urban–rural fringe areas driven by digital technology and regulated by ecological smart capital for resource metabolism synergy.
Land 15 01546 g001
Figure 2. Underlying positive feedback loop driven by digital technology.Arrows indicate causal directions, and the “+” and “−” signs denote positive (reinforcing) and negative (balancing) influences between connected variables, respectively.
Land 15 01546 g002
Figure 3. “Ecological Wisdom Capital-Community Participation” Activation and Reinforcement Cycle. Notations same as in Figure 2.
Land 15 01546 g003
Figure 4. “Food System Ecological Wisdom Capital-Ecological Resilience-Development Pressure” Strengthening Cycle. Notations same as in Figure 2.
Land 15 01546 g004
Figure 5. “External Shock-Resource Pressure” Suppression Brief Feedback Loop. Notations same as in Figure 2.
Land 15 01546 g005
Figure 6. “Food System Landscape Resource Metabolism Synergy—Food System Ecological Wisdom Capital” promotes circularity. Notations same as in Figure 2.
Land 15 01546 g006
Figure 7. Causal loop diagram of the resilience evolution of a sustainable food system in urban–rural fringe areas empowered by digitalization. Note: Causal loop diagram of the resilience evolution of a sustainable food system in urban–rural fringe areas driven by digitalization. The diagram illustrates the causal feedback relationships among key variables such as digital technology, ecological perception, ecological wisdom capital, resource metabolism, habitat disturbance, and policy coordination. The arrows represent the causal pathways between variables, depicting the system feedback logic of the food system in urban–rural fringe areas evolving from fragmentation to a synergistic steady state.
Land 15 01546 g007
Figure 8. Basic Model Operation Results: (A) Food System Ecological Wisdom Capital; (B) Food System Landscape Resource Metabolism Synergy; (C) Ecological Awareness and Accounting Capability; (D) Ecological Pressure Index; (E) Ecological carrying capacity; (F) Carrying Capacity Net Change Rate; (G) System Resilience Index; (H) System Synergy Level; (I) left: urban rural development pressure; right: urban rural development pressure (tabular version).
Land 15 01546 g008aLand 15 01546 g008b
Figure 9. Urban–Rural Development Gap Operation Results.
Land 15 01546 g009
Figure 10. Sensitivity analysis results of "ecological perception and accounting capability" under different parameter perturbation scenarios: (A) Baseline improvement rate (extremely low); (B) Baseline improvement rate (extremely high); (C) Digital investment intensity (extremely low); (D) Digital investment intensity (extremely high). Note: The asterisk (*) in the figure units denotes multiplication (e.g., year·hectare).
Land 15 01546 g010aLand 15 01546 g010b
Table 1. Parameter classification, definitions, and determination methods.
Parameter TypeCore DefinitionDetermination Method and Source of Key Parameters
Literature-based parametersEstimates directly adopted from published empirical studies or determined through comprehensive comparison.Benchmark improvement rate (0.12) is set at the median of the theoretically reasonable range of synergistic improvement rates in the early stage of NbS implementation. Baseline degradation rate (0.055) is set at the median of the theoretically reasonable range of natural degradation rates under no-intervention conditions. Both are baseline scenario settings, and the influence of their specific values on model conclusions will be tested through sensitivity analysis. Technical Applicability (0.8) is set at a relatively high level to reflect the general assessment that current digital agricultural technologies are fairly applicable in peri-urban areas.
Statistically derived parametersDetermined based on publicly available statistical data or typical values from the landscape pattern analysis literature.The initial value of Habitat Fragmentation Index is set at 0.4, with reference to the fragmentation measurement method proposed by Fahrig (2003) [19] and adopting the median of the range of landscape pattern index values reported in the literature for typical peri-urban areas. The initial value of Cumulative effect of policies (0.16) is converted from the annualized average growth rate of agricultural eco-compensation fiscal expenditures reported for comparable regions.
System-endogenous calibration parametersStock initial values and rate variables required by the model logic. Precise values cannot be directly obtained from a single literature source, but their reasonable ranges can be constrained through theoretical deduction and empirical analogy.Following the principle of consistency with the qualitative judgment of the system’s initial state, the core stocks are all placed at the lower end of the 0–1 standardized dimensionless range to reflect the typical characteristic that the peri-urban food system is currently in a transitional stage between fragmentation and synergy. Specifically: Ecological Awareness and Accounting Capability (0.3), Food System Landscape Resource Metabolism Synergy (0.35), urban–rural resource metabolic efficiency (0.35), Food System Ecological Wisdom Capital (0.4), and System Resilience Index (0.35). Benchmark Evolution Rate (0.08) is set at the median of the theoretically reasonable range of synergistic evolution rates. Policy Coupling Degree (0.7) is set at a moderately high level to characterize the general judgment that current ecological protection and food security policies are reasonably compatible at the institutional design level. The impact of such parameters on the model has been verified through sensitivity analysis to ensure that key conclusions do not depend on the precise setting of specific initial values.
Table 2. Model Design Parameters and Their Properties.
LevelVariable NamePropertiesInitial Value
Ecological Perception Capability DimensionEcological awareness and accounting capabilityStock0.3
Rate of capability improvementFlow---
Rate of ability decayFlow---
Accuracy of ecological dataAuxiliary---
PES accuracyAuxiliary---
Level of equalization in green infrastructureAuxiliary---
Benchmark improvement rateConstant0.12
Ecological knowledge sharingAuxiliary---
Intensity of digital technology investmentAuxiliary---
Degree of information asymmetryAuxiliary---
Digital penetration rateAuxiliary---
Willingness to invest in digital technologyAuxiliary---
Digital technology maturityAuxiliary---
Urban–rural digital divideAuxiliary---
Breadth of digital technology applicationAuxiliary---
Technical applicabilityConstant0.8
Landscape and Metabolism Synergistic DimensionSystem synergy levelStock0.35
Coevolution rateFlow
Fragmentation degradation rateFlow
Benchmark evolution rateConstant0.08
Baseline degradation rateConstant0.055
Urban–rural resource metabolic efficiencyStock0.35
Metabolic optimization rateFlow---
Metabolic loss rateFlow---
Resource consumption intensityAuxiliary
Urban–rural resource access gapAuxiliary---
Resource supply stabilityAuxiliary
Conflict of interestAuxiliary---
Urban–rural development gapStock---
Urban–rural development pressureAuxiliary---
Habitat fragmentation indexConstant0.4
Development promotion factorAuxiliary
Policy implementation deviationAuxiliary
Policy coordination levelAuxiliary---
Cumulative effect of policiesStock0.16
Policy coupling degreeConstant0.7
Policy effectivenessAuxiliary---
Community engagementAuxiliary---
Ecological Wisdom Capital DimensionFood system ecological wisdom capitalStock0.4
Capital accumulation efficiencyFlow---
Capital depreciation rateFlow---
Ecological restoration rateAuxiliary---
Vegetation restoration rateAuxiliary---
Ecological carrying capacityStock---
Urban heat island intensityAuxiliary---
Ecological wisdom enhancementAuxiliary---
Ecological wisdom synergy coefficientAuxiliary---
Food system resource pressureAuxiliary---
Climate fluctuation factorConstant0.3
Investment intensity in ecological restorationAuxiliary---
System resilience indexStock0.35
Rate of resilience evolutionFlow---
Resilience decay rateFlow---
Table 3. Simulation Equations and Programming Basis.
Variable NameSimulation Equation FormulaProgramming Basis and Equations
Capital accumulation efficiency=Base Cumulative Efficiency * (1 + 0.3 * (SMOOTH3(Digital Technology Penetration Rate, 8)^0.6)) * (1 − 0.18 * (Urban Heat Island Intensity^0.8)) * (1 + 0.4 * (SMOOTH3(System Synergy Level, 8)^0.6)) * (1 + 0.12 * SMOOTH3(Digital Technology Penetration Rate, 8) * SMOOTH3(System Synergy Level, 8)) * Development Promotion Factor(1) SMOOTH3 (variable, 8)—applies third-order smoothing to the variable, simulating the lag and inertia in the accumulation of ecological wisdom capital in the food system, with a lag period set to 8 years, same below.
(2) The digital technology penetration coefficient is 0.3—referencing the elasticity range of digital input contribution to ecological efficiency in existing studies (0.2–0.5), and taking the median value of 0.3 based on the current state of digital agriculture development in the study area.
(3) Digital technology penetration rate index 0.6—the power exponent reflects diminishing marginal returns. According to technology diffusion theory, the marginal contribution of technology penetration to the accumulation of food ecological capital is highest in the early stage and decreases in the later stage [57].
Vegetation restoration rate=0.14 * (1 + 0.4 * Ecological Restoration Investment Intensity/Baseline Investment Intensity) * (1 − 0.3 * Habitat Fragmentation Index) * (1 − 0.2 * Climate Fluctuation Factor) * (1 − 0.2 * Habitat Fragmentation Index * Climate Fluctuation Factor)(1) Baseline recovery rate 0.14—indicates that under natural, non-intervention conditions, the annual vegetation restoration rate in core grain production areas is approximately 14%. Ecosystem recovery rates vary between 2% and 15% per year; this study adopts 0.14 based on relevant research [58].
(2) Investment-driven coefficient 0.4—for every doubling of investment intensity in ecological restoration for grain production (relative to the baseline), the restoration rate increases by 40%.
(3) Smart regulation coefficient 0.3—for each unit increase (after standardization) in grain-ecology smart capital, the restoration rate increases by 30%.
(4) Climate fluctuation factor 0.2—for every 0.1 increase in the climate fluctuation factor, the vegetation restoration rate in grain-producing areas decreases by 2%.
Coevolution rate=Benchmark Evolution Rate * (1 − 0.38 * (SMOOTH3(Information Asymmetry Degree, 8)^0.7)) * (1 − 0.28 * (SMOOTH3(Conflict of Interest, 8)^0.8)) * (1 + 0.65 * (SMOOTH3(Digital Technology Empowerment Level, 8)^0.5)) *(1 − System Synergy Level)(1) SMOOTH3(variable, 8)—Co-evolution is influenced by institutional inertia, interest structures, and technological transmission lags, exhibiting cumulative effects. Institutional change theory [59] points out that institutional synergy requires a long adaptation period, while synergetics [30] emphasizes the time lag in order parameter changes, hence the smoothing treatment.
(2) (1 − System Synergy Degree)—The closer the system is to synergy, the slower the evolution rate, showing a trend of convergence toward a steady state, which aligns with the nonlinear evolution of sustainable food systems from fragmentation to synergy.
Digital Technology Maturity=WITH LOOKUP(Policy Cumulative Effect, ([(0, 0.15)−(1, 0.95)], (0, 0.2), (0.1, 0.26), (0.2, 0.33), (0.3, 0.41), (0.4, 0.5), (0.5, 0.6), (0.6, 0.69), (0.7, 0.77), (0.8, 0.83), (0.9, 0.87), (1, 0.9)))(1) Input variable—cumulative policy effect.
(2) Coordinate range—X-axis: 0–1; Y-axis: 0–1.
(3) When the cumulative policy effect is in the range of 0–0.3, technology maturity increases from 0.15 to 0.41, indicating a slow start for digital technology in the food system; in the range of 0.3–0.6, it rises from 0.41 to 0.69, signifying rapid breakthroughs in technological innovation and maturity in food ecological governance; in the range of 0.6–1, it increases from 0.69 to 0.9, suggesting that technology is approaching saturation.
Community Engagement=MIN(1, MAX(0, 0.2 * 0.25 + 0.3 * (PES Accuracy^0.6) + 0.25 * (1 − Policy Implementation Deviation^0.7) + 0.15 * (Ecological Wisdom Capital Constraint^0.5) + 0.1 * (PES Accuracy * Ecological Wisdom Capital Constraint) * (1 − Policy Implementation Deviation)))(1) Baseline constant term 0.05—In the absence of any food-ecological policy intervention or technical support, the baseline level of community participation is 5%.
(2) Precision incentive coefficient 0.3—Drawing on empirical research in the field of Payments for Ecosystem Services (PES) regarding the relationship between incentive intensity and participation rates, for every 10% increase in compensation precision, community participation rates rise by approximately 3 percentage points, yielding a coefficient of 0.3 [60].
Degree of information asymmetry=MIN(1, MAX(0, Basic Asymmetry Degree * (1 − 0.3 * (SMOOTH3(Ecological Perception and Accounting Capability, 5)^0.85)) * (1 − 0.2 * (SMOOTH3(Digital Technology Empowerment Level, 5)^0.95)) * (1 − 0.07 * SMOOTH3(Ecological Perception and Accounting Capability, 5) * SMOOTH3(Digital Technology Empowerment Level, 5))))(1) The SMOOTH3 function—third-order exponential smoothing—captures the inertia, delay, and cumulative effects of ecological perception and accounting capabilities, as well as the level of digital technology empowerment, in reducing information asymmetry in the food system.
(2) Baseline asymmetry level of 0.88—without technological intervention, there is a high degree of information asymmetry in the food-ecological governance domain.
Food System Resource Pressure=MIN(1, Base Pressure * EXP(−0.5 * Ecological Wisdom Synergy Coefficient)/(1 + 2 * Resource Utilization and Sharing Efficiency))(1) Resource pressure characterizes the degree of resource constraints faced by grain production in urban–rural fringe zones.
(2) Exponential decay coefficient 0.5—For every one-unit increase in the ecological wisdom synergy coefficient, the resource pressure on the food system is alleviated by a factor of e^{−0.5} ≈ 0.607, reflecting the pressure-reducing effectiveness of collaborative governance.
Urban–rural digital divide=MIN(1, MAX(0, initial gap * (1 − 0.65 * (urban–rural public service coefficient^0.6)/(urban–rural public service coefficient^0.6 + 0.35^0.6))))(1) Public service coefficient 0.65—According to conditional convergence theory, relatively underdeveloped regions can catch up with developed regions by improving public services and policy stability [61]. Here, the balanced stock of public services and policy intensity are introduced, affecting the urban–rural digital infrastructure gap, which in turn influences the coverage of smart monitoring facilities in the food system.
(2) Initial gap 0.7—The initial digital infrastructure gap between urban and rural areas in developing countries is generally between 50% and 100% [62]. This paper references and adopts a value of 0.7.
Resource consumption intensity=MIN(1, MAX(0.05, Base Consumption Intensity * (1 + 0.7 * (Urban–Rural Development Gap^0.4)) * (1 − 0.4 * (Digital Technology Maturity^0.4)) * (1 − 0.3 * (Ecological Wisdom Capital Constraint^0.5)) * (1 + 0.4 * (Policy Implementation Deviation^0.6)) * (1 − 0.2 * Digital Technology Maturity * Ecological Wisdom Capital Constraint) + SMOOTH(Random Fluctuation, 1)))(1) Resource consumption intensity characterizes the level of consumption in the resource metabolism process of the food system, covering key elements such as water, energy, and biomass.
(2) The driving coefficient of urban–The Environmental Kuznets Curve (EKC) hypothesis suggests that in the early stages of economic development, resource consumption and environmental pressure increase with rising income [63]. Drawing on this theoretical framework, this study hypothesizes that during periods of uneven urban–rural development, the resource metabolism intensity of the food system may also increase. Accordingly, this paper sets the driving coefficient of the urban–rural development gap at 0.7, indicating that the maximum amplification effect of this gap on consumption intensity is 70%.
(3) The interaction between digital technology maturity and food-ecological smart capital can reduce the resource metabolism loss of the food system.
Convergence driving force=(0.02 + 0.1 * (System Resilience Index^0.5) * (Ecological Awareness and Accounting Capability^0.6) * (Digital Technology Maturity^0.7)) * (Cumulative effect of policies^2)(1) System resilience index 0.5—The contribution of food system resilience to narrowing the urban–rural development gap follows a law of diminishing marginal returns. Using an index of 0.5 means that when the resilience level is low, its improvement has a very significant promoting effect on convergence; however, as the resilience level continues to increase, the additional convergence benefits brought by further enhancement gradually weaken. This aligns with the development laws of most systems—the improvement effect from “fragile” to “having basic resilience” is most pronounced, while the upgrade from “good” to “excellent” is more difficult and yields lower marginal benefits. This is consistent with the nonlinear response characteristics of systems when facing disturbances, as proposed by Holling (1973) in the theory of ecosystem resilience [29].
Urban–rural development pressure=MIN(1, MAX(0.05,Basic pressure * (0.8 + 0.5 * Development Promotion Factor)/(1 + 2 * synergistic inhibition coefficient^0.8)))(1) The power exponent reflects the diminishing marginal effect.
(2) Excessive pressure from urban and rural development can squeeze investments in ecological restoration and digitalization of the food system; this equation is used to characterize the transmission of such pressure.
Ecological restoration rateVegetation restoration rate * IF THEN ELSE (Ecological Wisdom Capital Constraints > 0.6, 0.05 + 0.2 * (1 − EXP(−5 * (Ecological Wisdom Capital Constraints − 0.6))), 0.05 * (Ecological Wisdom Capital Constraints/0.6))(1) When the ecological wisdom capital constraint of the food system is ≤0.6: The restoration rate increases linearly, indicating the stage of quantitative accumulation in the ecological restoration of the food system.
(2) When the ecological wisdom capital constraint of the food system is >0.6: It enters the stage of qualitative leap, with the restoration rate accelerating. The formula is 0.05 + 0.2 * (1 − EXP(−5 * (constraint-0.6))), strengthening the ecological foundation restoration of the sustainable food system.
Note: Asterisks (*) in the equations denote multiplication, consistent with the software syntax.
Table 4. Cross-reference of simulation result labels (A–H) with core feedback loops.
Simulation LabelCore VariableMain Trend DescriptionInvolved Core Feedback Loops (see Section 2.2.2)
AEcological Awareness and Accounting CapabilitySteady upwards trend driven by the accumulation of ecological perception capabilities and the maturation of digital technology, exhibiting sustained growth.R1; R4
BDigital Technology MaturityGradually increases, coevolving with Food System Ecological Wisdom Capital in a mutually reinforcing manner.R1
CFood System Ecological Wisdom CapitalSteady accumulation, continuously enhancing the overall resilience of the peri-urban food system.R2; R4
DSystem Resilience IndexOverall steady upwards trend, reflecting the evolutionary characteristics of multifactor positive synergy and mutual reinforcement.R2; R4
EUrban–Rural Development PressureFluctuating trajectory: rising continuously in the early stage, peaking around year 15, then gradually declining.R2; R3
FEcological Carrying CapacityRapid initial increase, followed by steady growth after a short-term adjustment phase, and eventually approaching saturation.R4; R3
GFood System Landscape Resource Metabolism SynergyU-shaped evolutionary trajectory with three phases of decline–trough–rise, with growth decelerating in the later stage.R1; R2; R4
HUrban–Rural Development GapInverted U-shaped evolution: continuously expands in the early stage and peaks around year 16, then steadily declines and converges to a low steady-state level.R2; R3; R4
Note: The abbreviations for the four core feedback loops in this table are as follows: R1 represents the positive feedback loop driven by digital technology (see Figure 2); R2 represents the ecological wisdom capital activation enhancement loop, covering the two dimensions of community participation and ecological resilience (see Figure 3 and Figure 4); R3 represents the external shock-resource pressure suppression feedback loop (see Figure 5); and R4 represents the resource metabolism efficiency-ecological wisdom capital enhancement loop (see Figure 6). This table supports the traceability between the feedback loop structure and simulation outputs and enables consistency checks between qualitative causal loop diagrams and quantitative simulation results.
Table 5. Multi-Scenario Sensitivity Analysis Results.
ScenarioParameter ChangedParameter ValueEcological Wisdom Capital (End Period)Carrying Capacity Steady-State Value (End Period)System Synergy Degree (End Period)Phase Transition Successful
BaseNoneBaseline3.259981.217150.824819Yes
S1Basic Accumulation Efficiency0.049 (−30%)2.178611.215390.824783Yes
S2Basic Accumulation Efficiency0.091 (+30%)4.333411.218470.824836Yes
S3Baseline Loss Rate0.021 (−30%)3.466051.217430.824824Yes
S4Baseline Loss Rate0.039 (+30%)3.051091.216840.824813Yes
S5Digital Divide0.56 (−20%)3.259941.217050.824334Yes
S6Digital Divide0.84 (+20%)3.259991.217230.825162Yes
Table 6. Results of the evolution of system synergy under policy intervention scenarios.
ScenarioSystem Synergy Degree (Year 50)Exceeds 0.7Difference from Baseline Scenario
Baseline Scenario0.824819Yes----
Scenario without Digital Technology Empowerment N0.782088Yes−0.0427 (approx. 5.2%)
High-Investment Accelerated Scenario H0.825701Yes+0.0009 (approx. 0.1%)
Disclaimer/Publisher’s Note: The statements, opinions and data contained in all publications are solely those of the individual author(s) and contributor(s) and not of MDPI and/or the editor(s). MDPI and/or the editor(s) disclaim responsibility for any injury to people or property resulting from any ideas, methods, instructions or products referred to in the content.