Article

Field-Based Soil Organic Carbon Stock Assessment and RothC-Based Scenario Modelling in a Mountain Micro-Catchment, Eastern Türkiye

1
Department of Soil Science and Plant Nutrition, Faculty of Agriculture, Bingöl University, 12060 Bingöl, Türkiye
2
Department of Landscape Architecture, Faculty of Agriculture, Bingöl University, 12060 Bingöl, Türkiye
3
Department of Biosystem Engineering, Faculty of Agriculture, Bingöl University, 12060 Bingöl, Türkiye
*
Author to whom correspondence should be addressed.
Land 2026, 15(9), 1535; https://doi.org/10.3390/land15091535
Submission received: 15 July 2026 / Revised: 19 August 2026 / Accepted: 20 August 2026 / Published: 22 August 2026

Abstract

Soil organic carbon (SOC) stocks are strongly influenced by land use, vegetation condition and climate, particularly in heterogeneous mountain catchments. This study quantified SOC stocks and simulated long-term SOC dynamics in the Çapakçur micro-catchment, eastern Türkiye, by integrating field assessment, geostatistical prediction, uncertainty analysis, inverse RothC calibration and scenario modelling. A total of 428 soil samples were collected from the 0–30 cm layer across forest, degraded forest, and pasture areas. SOC stocks were calculated from SOC concentration, bulk density and soil depth, and spatially predicted using ordinary kriging of log-transformed SOC stocks. RothC was calibrated for each land-use class to estimate the annual carbon inputs required to maintain observed SOC stocks, followed by 50-year restoration and climate-sensitivity simulations. SOC stocks ranged from 7.69 to 247.68 Mg C ha−1, averaging 55.52 Mg C ha−1. Forest had the highest mean SOC stock (78.5 Mg C ha−1), followed by pasture (55.9) and degraded forest (50.2 Mg C ha−1). Required annual carbon inputs were 5.17, 4.58 and 3.29 Mg C ha−1 yr−1, respectively. Increasing degraded forest carbon inputs to forest-equivalent levels increased SOC by 14.76 Mg C ha−1 over 50 years, equivalent to 37.77 Gg C or 138.49 Gg CO2eq at the catchment scale. A stronger restoration scenario increased this potential to 63.77 Gg C. Warming caused SOC losses, with +2 °C reducing catchment SOC by 56.78 Gg C. These findings demonstrate the potential of degraded forest restoration for SOC sequestration while highlighting the vulnerability of long-term SOC gains to climate warming.

1. Introduction

Soil organic carbon (SOC) is a central component of terrestrial carbon cycling and plays a key role in soil fertility, aggregate stability, water retention, nutrient cycling and climate-change mitigation [1,2,3]. Because SOC stocks reflect the balance between carbon inputs from vegetation and carbon losses through decomposition, erosion, and leaching, even relatively small changes in SOC can influence the exchange of carbon between soil and atmosphere [4,5,6]. Recent studies have emphasized that SOC storage is controlled by the interaction of climate, land use, vegetation productivity, soil properties and management practices [7,8,9]. Therefore, accurate quantification of SOC stocks is essential for evaluating ecosystem functioning, land degradation status and the potential contribution of soils to climate-change mitigation.
Land use and land-cover change (LUCC) are among the most important drivers of SOC variability [10,11,12]. Changes in vegetation cover, litter return, root biomass, soil disturbance and erosion exposure can strongly alter SOC storage. Large-scale studies have shown that woodlands and semi-natural systems generally maintain higher soil carbon stocks than more disturbed land-use systems, while deforestation and degradation can cause substantial SOC losses [8,13]. Similarly, LUCC-based assessments have demonstrated that land conversion can produce either carbon losses or gains, depending on the direction of conversion, vegetation recovery and management intensity [14,15]. In Türkiye, Korkanç et al. [16] showed that conversion from degraded rangeland to poplar plantation increased organic carbon, aggregate stability and porosity, indicating that vegetation recovery may improve soil carbon-related properties.
In mountain catchments, SOC distribution is further influenced by topographic factors such as slope, elevation and aspect [17,18]. These variables affect soil depth, erosion intensity, microclimate, moisture availability and vegetation structure. Previous work in the Çapakçur catchment showed that land use type significantly affected SOC content, with forest land having the highest SOC values, while SOC decreased with increasing slope, probably due to erosion-driven soil loss [19]. However, SOC content alone does not fully represent soil carbon storage because SOC stock also depends on bulk density and soil depth. Therefore, SOC stock-based assessment is required to quantify carbon storage capacity and to compare land-use classes on a common basis.
Spatially explicit SOC stock estimation is particularly important in heterogeneous landscapes where land use, degradation status and topography vary over short distances. Digital soil mapping, geostatistical approaches and environmental covariates have increasingly been used to quantify SOC patterns and identify priority areas for conservation or restoration [20,21]. Wang et al. [9], for example, combined field samples, environmental variables and machine-learning approaches to predict SOC stocks under future land-use and climate scenarios. Li et al. [15] also used high-resolution SOC and LUCC maps to evaluate SOC storage changes, highlighting the value of spatially explicit approaches for understanding carbon dynamics across contrasting land-use systems.
Although SOC stock mapping provides essential information on the current carbon status of soils, it does not directly explain how SOC may respond to future changes in carbon input, restoration or climate. Process-based SOC models are therefore needed to simulate long-term SOC trajectories under alternative scenarios. The Rothamsted Carbon model (RothC) is widely used to simulate SOC turnover under different soil, climate, land-use and management conditions [22]. The model has been applied to cropland, grassland, plantation, and forest-related systems to evaluate the effects of carbon inputs, organic amendments, land management and climate scenarios on SOC dynamics [23,24,25]. RothC is also useful for estimating the carbon input required to maintain observed SOC stocks and for evaluating whether increased organic matter return can support future SOC accumulation [26,27].
Management and restoration practices that increase carbon input to soil can enhance SOC accumulation, but the magnitude of this response depends on vegetation type, soil properties, climate and time scale. RothC-based studies have shown that residue incorporation, cover vegetation, organic amendments and diversified vegetation systems can increase SOC stocks when carbon inputs are sustained over long periods [25,28,29,30]. These findings are particularly relevant for degraded forest areas, where restoration may increase litter production, root biomass and soil cover, thereby improving SOC storage capacity.
Climate change may constrain this restoration potential. Rising temperatures can accelerate organic matter decomposition and reduce SOC stocks, particularly when increased decomposition is not compensated by higher carbon inputs [31,32,33]. Climate-sensitive SOC modelling studies have shown that warming can reduce SOC stocks or weaken long-term SOC gains under different land-use and management scenarios [34,35,36]. Recent RothC-based climate scenarios studies also indicate that future warming may substantially reduce the long-term sequestration efficiency of soils, even when SOC stocks continue to increase at lower rates [37]. Therefore, SOC-oriented restoration planning should consider both carbon input enhancement and climate sensitivity.
Although SOC stock mapping, RothC-based carbon input estimation, restoration modelling and climate sensitivity analysis have each been addressed in previous studies [9,23,25,37], these components are rarely combined within a single field-based mountain micro-catchment framework. This limitation is important because mountain catchments often contain small-scale mosaics of forest, degraded forest, and pasture, where vegetation condition, land degradation, erosion processes, soil properties, and climate sensitivity interact to shape SOC storage and future SOC trajectories. In addition, few studies explicitly link current SOC stock patterns with the carbon input required to maintain existing SOC, the carbon input required to reach a defined SOC target, and the vulnerability of restoration gains to warming. The Çapakçur micro-catchment provides a suitable case for this integrated assessment because it includes contrasting land-use classes, steep topographic gradients and degraded forest areas with potential for SOC-oriented restoration.
Therefore, the objectives of this study were to: (i) quantify SOC stocks across forest, degraded forest and pasture land-use classes; (ii) predict the spatial distribution of SOC stocks using ordinary kriging and assess spatial prediction uncertainty; (iii) calibrate the RothC model to estimate land-use-specific carbon input requirements for maintaining current SOC stocks; (iv) estimate the carbon input required to reach approximately 2% SOC; (v) simulate the effects of increased carbon input and degraded forest restoration on long-term SOC sequestration potential; and (vi) assess the sensitivity of SOC stocks to temperature increase and rainfall reduction scenarios. By integrating field-based SOC stock estimation, kriging-based spatial uncertainty assessment and RothC-based scenario modelling, this study provides a framework for evaluating current SOC status, carbon-input requirements, SOC target feasibility, restoration potential and climate-related SOC vulnerability in heterogeneous mountain catchments.

2. Materials and Methods

2.1. Study Area and Land-Use Classes

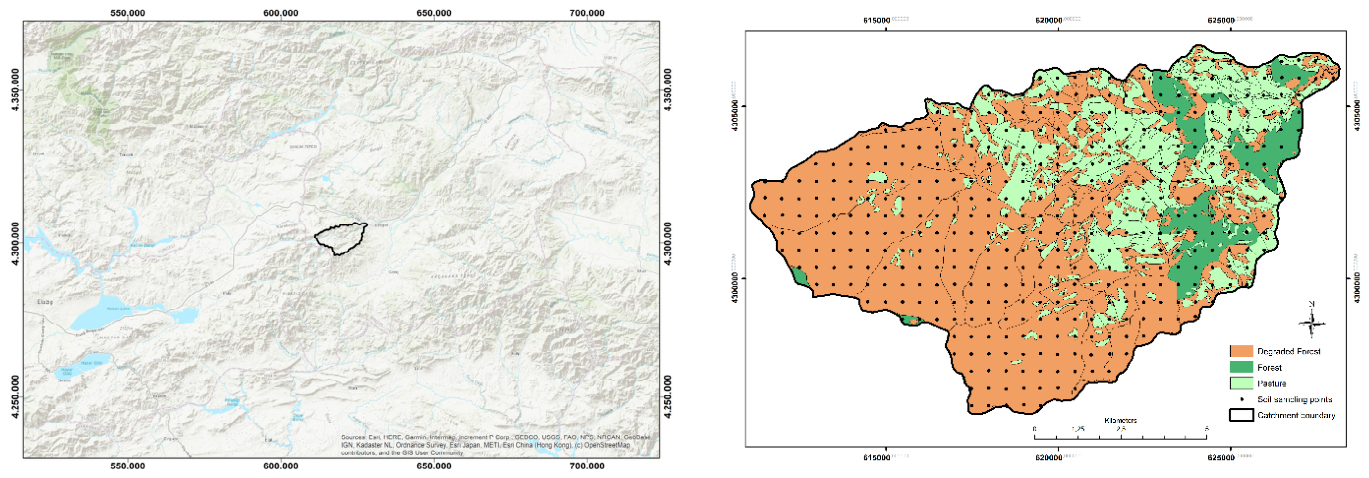
The study was conducted in the Çapakçur micro-catchment, located in Bingöl Province, eastern Türkiye. The catchment extends approximately between 38°53′58″–38°48′15″ N and 40°16′49″–40°28′35″ E and covers an area of about 10,675 ha (Figure 1). The area has a rugged physiographic structure and is prone to erosion due to the combined effects of climate, topography and geological characteristics. The catchment includes forest, degraded forest and pasture areas, which represent contrasting vegetation conditions and land-use intensities [19].
The main land-use classes evaluated in this study were forest, degraded forest and pasture. Forest areas are mainly represented by oak-dominated vegetation and associated woody species, whereas degraded forest areas correspond to zones where forest structure, canopy cover and vegetation density have been weakened. Pasture areas occupy a large part of the catchment and represent semi-natural grazing lands. These land-use classes were selected to evaluate the effects of vegetation condition and land degradation on SOC stocks and long-term SOC dynamics.

2.2. Hydroclimatic Data

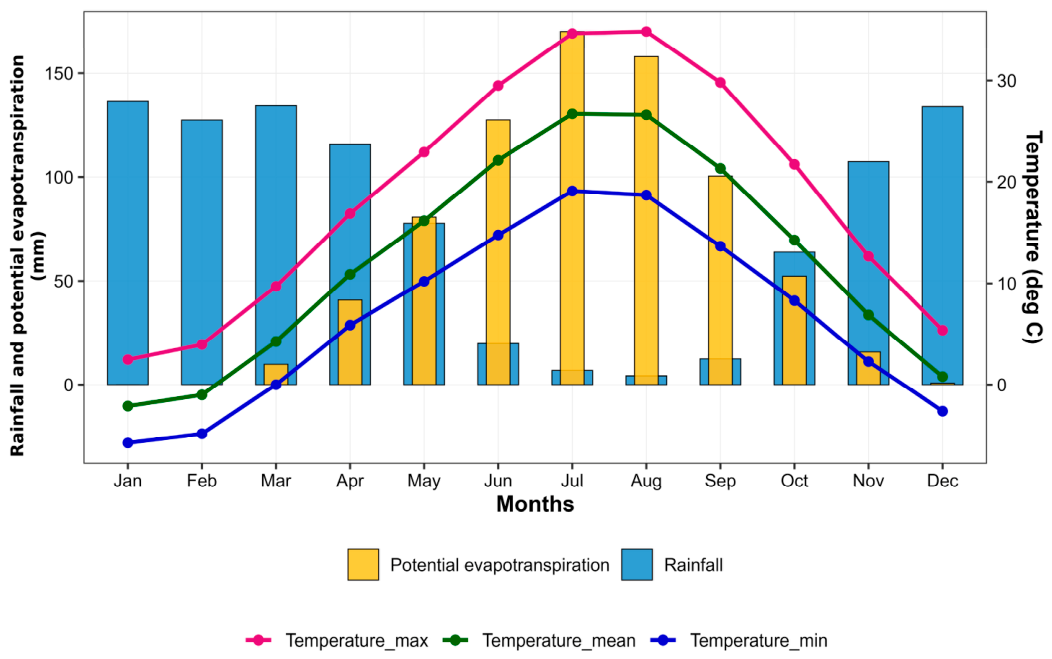
Monthly hydroclimatic data for Bingöl Province covering the 1961–2025 period were obtained from the Turkish State Meteorological Service [38]. The dataset included monthly mean, minimum, and maximum air temperature; monthly precipitation; mean sunshine duration; and number of rainy days. These data were used to characterize the climatic setting of the Çapakçur micro-catchment and to provide climate inputs for the RothC simulations.
Potential evapotranspiration (PET) was estimated using the Thornthwaite method based on mean monthly air temperature and latitude-corrected day length [39]. The long-term hydroclimatic data indicate that the study area is characterized by cold winters, warm to hot summers, and a marked seasonal contrast between wet and dry periods. Mean annual air temperature was 12.3 °C, while mean annual maximum and minimum temperatures were 18.7 °C and 6.7 °C, respectively. Mean annual precipitation was 941.2 mm, and the calculated annual PET was approximately 756.4 mm. Monthly precipitation, PET and temperature patterns were illustrated using a hydroclimatic diagram (Figure 2).

2.3. Soil Sampling and Laboratory Analysis

Soil sampling was carried out using a regular grid-based sampling design. A total of 428 soil samples were collected from the 0–30 cm soil layer across the Çapakçur micro-catchment. For each sampling point, geographic coordinates, land-use class, elevation, slope, aspect, SOC concentration, clay content, bulk density and sampling depth were recorded.
The collected soil samples were air-dried, gently crushed and passed through a 2 mm sieve prior to laboratory analysis. SOC concentration was determined using the Walkley–Black wet oxidation method [40]. Soil particle-size distribution, including clay content, was determined using the Bouyoucos hydrometer method [41]. Bulk density was determined using the paraffin-coated clod method [42]. Clay content and bulk density were used together with SOC concentration and soil depth to calculate SOC stocks for the 0–30 cm soil layer.

2.4. Calculation of SOC Stocks

SOC stocks were calculated for the 0–30 cm soil layer using SOC concentration, bulk density and sampling depth. The following equation (Equation (1)) was applied
S O C s t o c k M g   C   h a 1 = S O C       B D × S o i l   d e p t h
where SOC (%) is the measured soil organic carbon concentration, BD (g cm−3) is bulk density, and soil depth (cm) represents the thickness of the sampled layer. This calculation provides SOC stock values on an area basis and allows direct comparison of carbon storage among land-use classes. Similar SOC stock calculations based on SOC concentration, bulk density and depth have been used in RothC-based SOC modelling studies [25].

2.5. Spatial Prediction and Validation of SOC Stocks

The spatial distribution of SOC stocks was predicted using ordinary kriging in ArcGIS Pro 3.5 (CA/USA) Geostatistical Analyst. Because SOC stock values showed a positively skewed distribution, ordinary kriging was applied to log-transformed SOC stock values. Sampling coordinates were first imported into ArcMap and projected to WGS 1984 UTM Zone 37N before geostatistical analysis. Experimental semivariograms were calculated using log-transformed SOC stock values, and a spherical semivariogram model was fitted. The final ordinary kriging prediction surface was back-transformed to the original SOC stock scale using the exponential transformation and clipped to the Çapakçur micro-catchment boundary. The final SOC stock prediction map was expressed in Mg C ha−1.
The performance of the ordinary kriging model was evaluated using leave-one-out cross-validation. The following validation statistics were recorded: mean error, root-mean-square error, average standard error, mean standardized error and root-mean-square standardized error. In addition, a prediction standard error map was produced to represent the spatial uncertainty of the kriging prediction. The spatial prediction map was used to evaluate SOC stock patterns together with the associated prediction uncertainty across the catchment. Spatially explicit SOC mapping is widely used to represent SOC variability in heterogeneous landscapes and to support land degradation and restoration assessments [19,43].

2.6. Statistical Analysis

Descriptive statistics were calculated for SOC stocks within each land-use class, including mean, standard deviation, median, minimum and maximum values. The normality of SOC stock data was evaluated before group comparisons. One-way analysis of variance was used to test overall land-use effects, and Welch ANOVA was additionally evaluated to account for potential heterogeneity in group variances. Because the data did not meet the normality assumption, the Kruskal–Wallis test was applied as a non-parametric alternative, followed by pairwise Wilcoxon tests where appropriate. Spearman rank correlation analysis was performed to evaluate relationships between SOC stock and selected environmental variables, including clay content, bulk density, elevation and slope. Spearman correlation was preferred because it does not require a normal distribution and is suitable for assessing monotonic relationships among non-normally distributed variables. Statistical analyses and graphical outputs were performed in R. To evaluate the representativeness of the uneven number of samples among land-use classes, sampling density was calculated for each land-use class as the number of samples per 100 ha and the area represented by each sample. In addition, uncertainty in mean SOC stock estimates was assessed using bootstrap resampling. For each land-use class, 95% bootstrap confidence intervals were calculated from 5000 resampled means. The coefficient of variation was also calculated to quantify within-class variability in SOC stock.
To further evaluate the combined effects of land use and soil-topographic variables on SOC stock, a multivariate linear model was fitted using log-transformed SOC stock as the response variable. Land use, clay content, bulk density, elevation, slope and aspect were used as explanatory variables. Log transformation was applied to reduce the influence of positive skewness in SOC stock values. Predictor contribution was evaluated using model summary statistics and drop-one F tests. This analysis was used to assess whether land-use effects remained important after accounting for soil and topographic variables.

2.7. RothC Model Structure and Input Data

Long-term SOC dynamics were simulated using the Rothamsted Carbon model, RothC-26.3. RothC is a process-based soil carbon model developed to simulate the turnover of organic carbon in non-waterlogged topsoils under different soil, climate, land-use and management conditions [22,44]. Although RothC has frequently been applied in agricultural soils, its structure is not restricted to cropland systems, and it has also been used to simulate SOC turnover in grassland, plantation and forest-related land-use systems when appropriate assumptions on carbon input, DPM/RPM ratio, soil cover and climate modifiers are defined. In RothC, SOC is divided into four active organic carbon pools and one inert pool. The active pools are decomposable plant material (DPM), resistant plant material (RPM), microbial biomass (BIO) and humified organic matter (HUM), while inert organic matter (IOM) is assumed to be resistant to decomposition [22,44].
The decomposition of each active carbon pool follows first-order kinetics (Equation (2)):
d C i d t = I i + T i k i   ×   ξ   ×   C i
where Ci is the carbon stock of pool i, Ii is the external carbon input entering the pool, Ti represents carbon transferred from other decomposing pools, ki is the pool-specific decomposition rate constant, and ξ is the decomposition modifier controlled by temperature, soil moisture and soil cover. The pool-specific decomposition constants were not calibrated in this study; instead, the standard RothC rate constants were adopted for all simulations, as summarized in Table 1.
Thus, total SOC at any simulation time was calculated as in Equation (3):
S O C T o t a l = D P M + R P M + B I O + H U M + I O M
The main input data required by RothC include monthly air temperature, monthly precipitation, monthly evapotranspiration, clay content, initial SOC stock, soil depth, soil cover, monthly carbon input and the DPM/RPM ratio. In this study, RothC was parameterized separately for each land-use class using land-use-specific mean SOC stock, mean clay content and calibrated annual carbon input. The soil layer depth was fixed at 0–30 cm. The DPM/RPM ratio was assigned according to land-use type. Forest and degraded forest were represented by woody vegetation input, while pasture was represented by grassland-type organic input.

2.8. Initialization of SOC Pools and Model Assumptions

Initial SOC stock was calculated from measured SOC concentration, bulk density and soil depth. The inert organic matter pool was estimated using the empirical equation (Equation (4)) proposed by Falloon et al. [45]:
I O M = 0.049   ×   S O C 1.139
where SOC is the initial total SOC stock. This relationship is widely used in RothC applications to estimate the biologically inert organic matter pool from total SOC stock when radiocarbon-based pool information is not available. Prudil et al. [25] also used this equation to calculate IOM from initial SOC stock in a RothC-based SOC simulation study.
The active SOC pool was calculated as (Equation (5)):
A c t i v e   S O C =   S O C T o t a l I O M
Because site-specific radiocarbon data and measured SOC fractions were not available, the active SOC stock was distributed among active RothC pools using a fixed initialization assumption (Equations (6)–(9)):
D P M 0 = 0.02   ×   A c t i v e   S O C
R P M 0 = 0.13 × A c t i v e   S O C
B I O 0 = 0.02 × A c t i v e   S O C
H U M 0 = 0.83 × A c t i v e   S O C
This initialization allowed the model to start from the observed SOC stock while maintaining separation between labile, resistant, microbial and humified carbon pools. The IOM pool was kept constant throughout the simulations.
External annual carbon input was partitioned into DPM and RPM according to the DPM/RPM ratio (Equations (10) and (11)):
D P M i n p u t   =   C i n p u t   ×   r ( 1 + r )
R P M i n p u t   = C i n p u t   × 1 ( 1 + r )
where r is the DPM/RPM ratio. In this study, r = 0.25 was used for forest and degraded forest, reflecting woody vegetation-derived organic input, whereas r = 1.44 was used for pasture, reflecting grassland-type organic input.
The decomposition modifier was represented as in Equation (12):
ξ = f T × f W × f C
where fT is the temperature modifier, fW is the moisture modifier, and fC is the soil-cover modifier. Monthly temperature, precipitation and PET data were used to calculate climate-related decomposition controls. In the applied model setup, soil cover was assumed to be present for forest, degraded forest and pasture land-use classes; therefore, the cover modifier was kept constant. Moisture limitation was represented using monthly precipitation and PET, and decomposition was constrained under dry conditions. This assumption was used to isolate the SOC response to hydroclimatic variation while avoiding confounding effects from unmeasured seasonal plant productivity.

2.9. RothC Calibration and Baseline Simulation

RothC was calibrated separately for each land-use class to estimate the annual carbon input required to maintain the observed initial SOC stock under baseline climate conditions. For each land-use class, the mean SOC stock and mean clay content were used as initial soil parameters. The annual carbon input was optimized by minimizing the difference between the simulated SOC stock at year 50 and the observed initial SOC stock for each land-use class.
The calibration objective was expressed as (Equation (13)):
M i n i m i z e =   S O C s i m , 50   S O C i n i t i a l 2
where SOCsim,50 is the simulated SOC stock at the end of the 50-year baseline simulation, and SOCinitial is the observed initial SOC stock for the relevant land-use class. The optimized value was interpreted as the model-derived annual carbon input required to maintain current SOC stocks. It should therefore be regarded as an inverse-model estimate rather than a direct measurement of litterfall, root biomass or belowground carbon input.
This calibration approach is consistent with RothC applications in which long-term SOC, climate and land-management data are used to evaluate current and future SOC dynamics. For example, Geremew et al. [23] calibrated RothC with long-term SOC, land management and climate data and then applied the model to simulate SOC under land-use and carbon-input scenarios. A 50-year baseline simulation was then performed for each land-use class using the calibrated annual carbon input and baseline climate data. The baseline simulation was used as the reference condition for all subsequent scenario analyses. Because annual carbon input was optimized to maintain the observed initial SOC stock, the baseline simulation was interpreted as an equilibrium-constrained calibration rather than as an independent model validation. No independent temporal SOC observations were available for validating long-term SOC trajectories.
To ensure transparency in the interpretation of RothC outputs, the main assumptions used during model calibration, baseline simulation, and scenario analysis were explicitly defined. These assumptions relate to soil depth, land-use representation, SOC pool initialization, DPM/RPM ratios, soil cover, baseline climate representation, carbon input calibration and the processes not explicitly simulated by the model. The main assumptions used in the RothC simulations are summarized in Table 2.

2.10. Carbon Input, Restoration and Climate Scenarios

After calibration, three groups of scenarios were simulated. First, carbon input scenarios were developed by increasing the calibrated baseline carbon input by 10%, 25% and 50% for each land-use class. These scenarios were used to evaluate how sustained increases in organic carbon input may affect long-term SOC accumulation. In addition to the proportional carbon input scenarios, a target SOC scenario was developed to estimate the annual carbon input required to increase mean SOC concentration to approximately 2% after 50 years. For each land-use class, the SOC stock equivalent of 2% SOC was calculated using the observed mean bulk density and the 0–30 cm soil depth. RothC was then used inversely to estimate the annual carbon input required to reach this target SOC stock at the end of the 50-year simulation period. Second, degraded forest restoration scenarios were simulated. In the first restoration scenario, the calibrated carbon input of degraded forest was increased to the forest-equivalent carbon input level. In the stronger restoration scenario, the forest-equivalent carbon input was further increased by 25%. These scenarios were designed to represent potential vegetation recovery pathways in which forest restoration increases litter return, root biomass, soil cover and organic carbon input. Third, climate sensitivity scenarios were simulated by modifying baseline temperature and rainfall conditions. Temperature scenarios included +1.5 °C and +2.0 °C warming. Rainfall scenarios included 10% and 20% precipitation reductions. Combined temperature and rainfall scenarios were also simulated. In all climate scenarios, annual carbon input was kept constant at the calibrated baseline level. This assumption was used to isolate the decomposition-driven response of SOC to altered temperature and rainfall. Therefore, rainfall-reduction scenarios should be interpreted as model responses under fixed carbon input, not as full ecosystem drought responses.

2.11. Area-Scaled SOC and CO2-Equivalent Calculations

Scenario outputs were first expressed as SOC stock changes per unit area (Equation (14)):
S O C = S O C s c e n e r i o   S O C b a s e l i n e
where ΔSOC is the SOC stock change in Mg C ha−1. For catchment-scale calculations, SOC changes were multiplied by the corresponding land-use area (Equation (15)):
T o t a l   S O C   C h a n g e   M g   C =   S O C   ×   A r e a  
For degraded forest restoration scenarios, the SOC gain was scaled to the degraded forest area. For climate scenarios, land-use-specific SOC changes were scaled to the corresponding areas of forest, degraded forest and pasture, and then summed to obtain catchment-scale SOC change. Carbon stock changes were converted to CO2-equivalent values using the molecular mass ratio of CO2 to C (Equation (16)):
C O 2 e q = C   ×   44 12

3. Results

3.1. Soil Organic Carbon Stocks Across Land-Use Classes

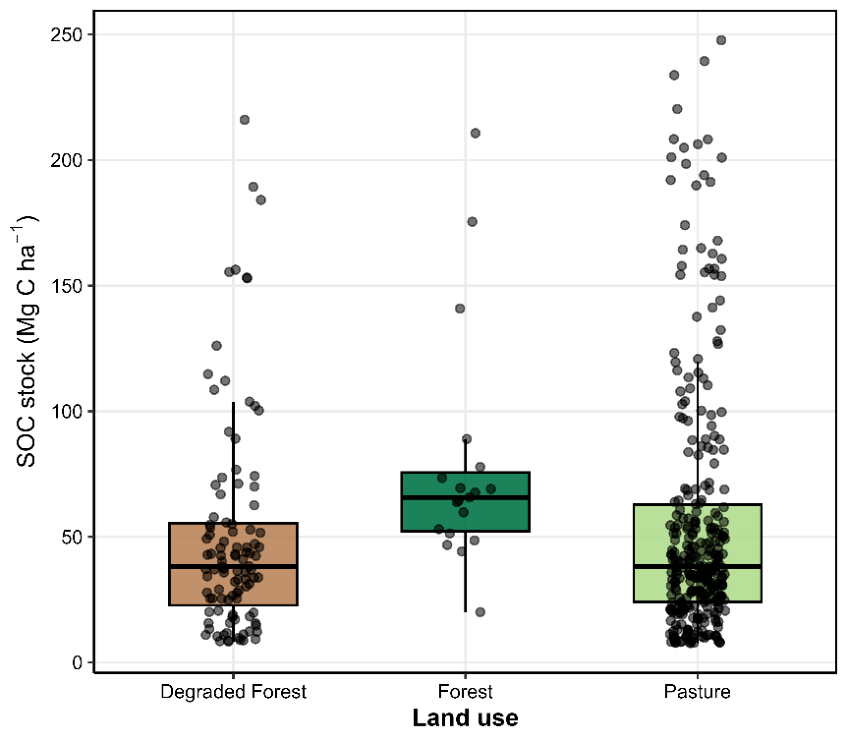
Soil organic carbon stock showed substantial variability across the Çapakçur micro-catchment. Across all sampling points, SOC stock ranged from 7.69 to 247.68 Mg C ha−1, with a mean value of 55.52 Mg C ha−1 and a median value of 39.74 Mg C ha−1. The higher mean relative to the median indicates a positively skewed distribution, suggesting that some sampling locations contained markedly higher SOC stocks. The frequency distribution of SOC stock values is provided in Supplementary Figure S1. Land-use-based descriptive statistics are presented in Table 3. Forest soils had the highest mean SOC stock (78.5 Mg C ha−1), followed by pasture (55.9 Mg C ha−1) and degraded forest (50.2 Mg C ha−1). Median SOC stock followed the same pattern, with forest showing the highest median value (65.7 Mg C ha−1), whereas pasture and degraded forest had similar median values (38.1 Mg C ha−1). Although forest soils showed the highest mean and median SOC stocks, this estimate should be interpreted together with its wider uncertainty range because the forest class occupied a smaller area and had fewer sampling points than pasture and degraded forest.
Because the number of samples differed among land-use classes, sampling density was calculated to evaluate whether this imbalance reflected differences in land-use area. Although the absolute number of forest samples was lower (n = 19), forest covered a smaller area within the catchment. Sampling density was comparable among land-use classes, ranging from 3.74 samples per 100 ha in forest to 4.03 and 4.05 samples per 100 ha in degraded forest and pasture, respectively. Therefore, the lower number of forest samples mainly reflected the smaller spatial extent of the forest class rather than a substantially lower sampling intensity. Detailed sampling density values are provided in Supplementary Table S5.
Bootstrap uncertainty analysis showed that the 95% confidence interval of mean SOC stock was wider for forest than for the other land-use classes. Mean SOC stock was 78.5 Mg C ha−1 in forest, with a 95% bootstrap confidence interval of 59.8–100.0 Mg C ha−1. In degraded forest and pasture, mean SOC stocks were 50.2 and 55.9 Mg C ha−1, with 95% confidence intervals of 42.4–58.5 and 50.3–61.8 Mg C ha−1, respectively. The wider confidence interval for forest indicates greater uncertainty in the forest SOC stock estimate and should be considered when interpreting land-use comparisons. Detailed uncertainty statistics are provided in Supplementary Table S6.
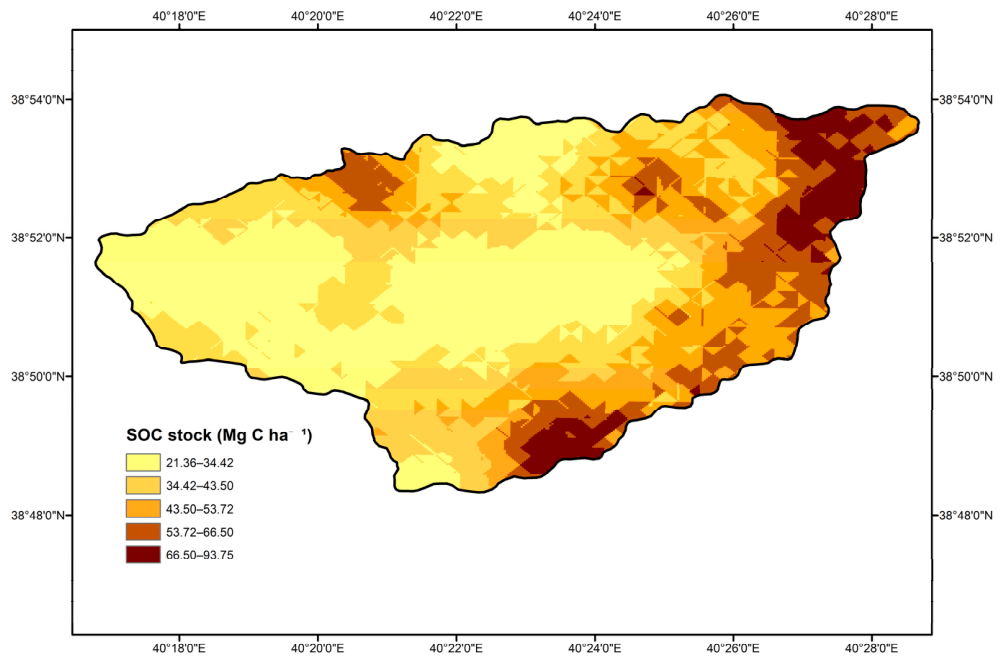
The spatial distribution of SOC stocks predicted by ordinary kriging is presented in Figure 3. The kriging-based map indicated clear spatial heterogeneity in SOC stocks across the Çapakçur micro-catchment. Predicted SOC stocks ranged from 21.36 to 93.74 Mg C ha−1. Relatively higher SOC stocks were predicted in parts of the eastern and southeastern catchment, whereas lower predicted SOC stocks were more prominent in the western and central parts. This pattern indicates that SOC stock distribution was spatially variable and should be interpreted together with land-use, soil, and topographic controls. Leave-one-out cross-validation of the ordinary kriging model produced a mean error of 0.00045, root-mean-square error of 0.79060, average standard error of 0.79487, mean standardized error of 0.00069 and root-mean-square standardized error of 0.99500 on the log-transformed SOC stock scale. The close agreement between the root-mean-square error and average standard error, together with a root-mean-square standardized error close to 1, indicates that the kriging uncertainty estimates were reasonably calibrated on the log-transformed scale. The spatial distribution of prediction standard error is provided in Supplementary Figure S6, and the leave-one-out cross-validation statistics are summarized in Supplementary Table S9.
The distribution of SOC stocks by land-use class is shown in Figure 4. Forest sites generally exhibited higher SOC stocks, while pasture and degraded forest areas showed lower and more widely dispersed values. The overlap between pasture and degraded forest suggests that degradation of forest cover may reduce SOC stocks to levels comparable with pasture-dominated areas.
Because SOC stock values were not normally distributed, non-parametric tests were used to compare land-use classes. The Kruskal–Wallis test indicated a significant difference in SOC stocks among land-use classes (χ2 = 12.861, p = 0.0016). Pairwise Wilcoxon comparisons showed that forest soils had significantly higher SOC stocks than degraded forest (p = 0.0010) and pasture (p = 0.0018), whereas no significant difference was detected between pasture and degraded forest (p = 1.000).
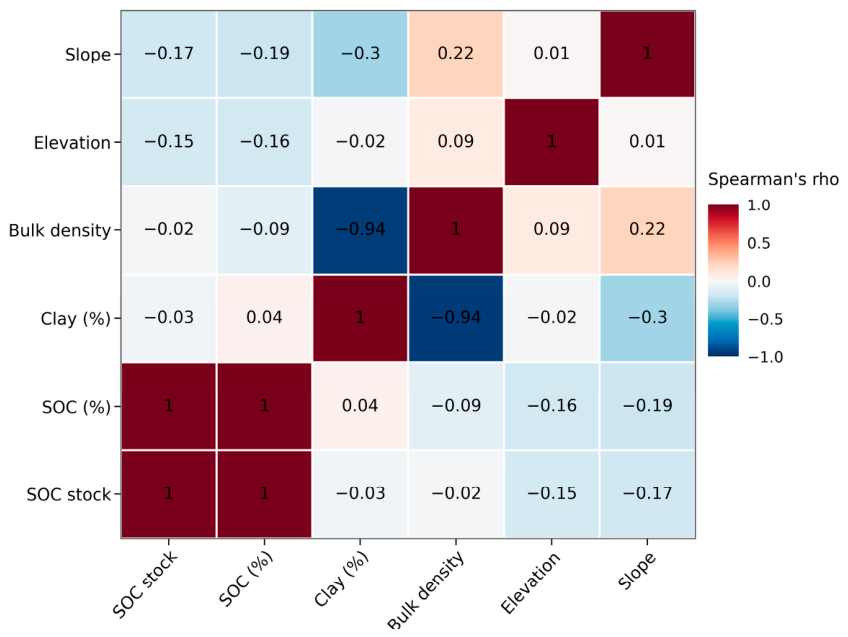
The relationships between SOC stock and selected soil-topographic variables were evaluated using Spearman correlation analysis. The correlation matrix is presented in Figure 5. SOC stock was strongly correlated with SOC concentration (ρ = 0.996), which is expected because SOC stock was calculated using SOC concentration, bulk density, and sampling depth. The corresponding correlation coefficients and significance levels are provided in Supplementary Table S1. Scatterplots showing the relationships between SOC stock and selected soil-topographic variables are provided in Supplementary Figure S2.
SOC stock showed no meaningful relationship with clay content (ρ = −0.03) or bulk density (ρ = −0.02). In contrast, weak but statistically significant negative correlations were observed between SOC stock and elevation (ρ = −0.154, p = 0.0014) and slope (ρ = −0.172, p < 0.001). These relationships indicate that SOC stocks tended to decrease slightly with increasing elevation and slope. Although the correlation coefficients were weak, the negative association with slope may reflect the influence of erosion, reduced soil depth and limited organic matter retention on steeper terrain. Therefore, SOC stock variation in the catchment should be interpreted as the combined outcome of land-use condition and soil-topographic controls rather than as the effect of a single dominant factor. The multivariate model provided additional evidence that SOC stock variability was controlled by both land-use condition and soil-topographic variables. The model explained 12.3% of the variation in log-transformed SOC stock, with an adjusted R2 of 0.096. Drop-one F tests showed that slope (p < 0.001), elevation (p < 0.001), clay content (p = 0.0026), land use (p = 0.0093) and bulk density (p = 0.0329) were significant predictors, whereas aspect was not significant (p = 0.137). These results indicate that land use was an important explanatory factor, but SOC stock patterns were also significantly associated with slope, elevation, clay content and bulk density. Detailed multivariate model outputs are provided in Supplementary Table S7.

3.2. RothC Calibration and Baseline Carbon Inputs

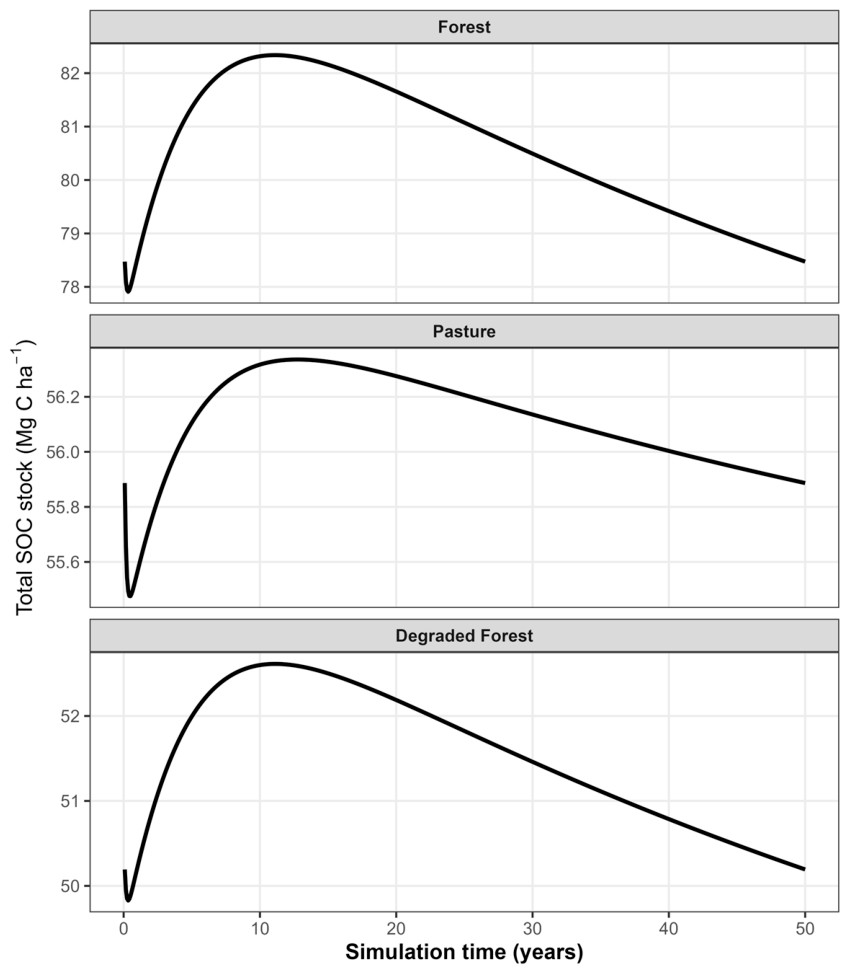
The RothC model was calibrated separately for each land-use class to estimate the annual carbon input required to maintain the observed SOC stock over a 50-year simulation period. The calibrated carbon inputs and baseline equilibrium SOC values are summarized in Table 4, while the baseline SOC trajectories are shown in Figure 6.
The calibrated annual carbon input was highest in forest (5.17 Mg C ha−1 yr−1), followed by pasture (4.58 Mg C ha−1 yr−1) and degraded forest (3.29 Mg C ha−1 yr−1). Under these calibrated inputs, simulated SOC stocks remained close to the initial SOC values after 50 years, as expected from the inverse calibration procedure. Therefore, the baseline trajectories should be interpreted as calibrated equilibrium reference conditions rather than as independent validation of RothC performance. The RothC pool structure showed that humified organic matter was the dominant carbon pool in all land-use classes. At the end of the calibrated baseline simulation, HUM values were 52.1 Mg C ha−1 in forest, 41.5 Mg C ha−1 in pasture and 33.6 Mg C ha−1 in degraded forest. Detailed RothC pool outputs are provided in Supplementary Table S2.

3.3. SOC Responses to Increased Carbon Input Scenarios

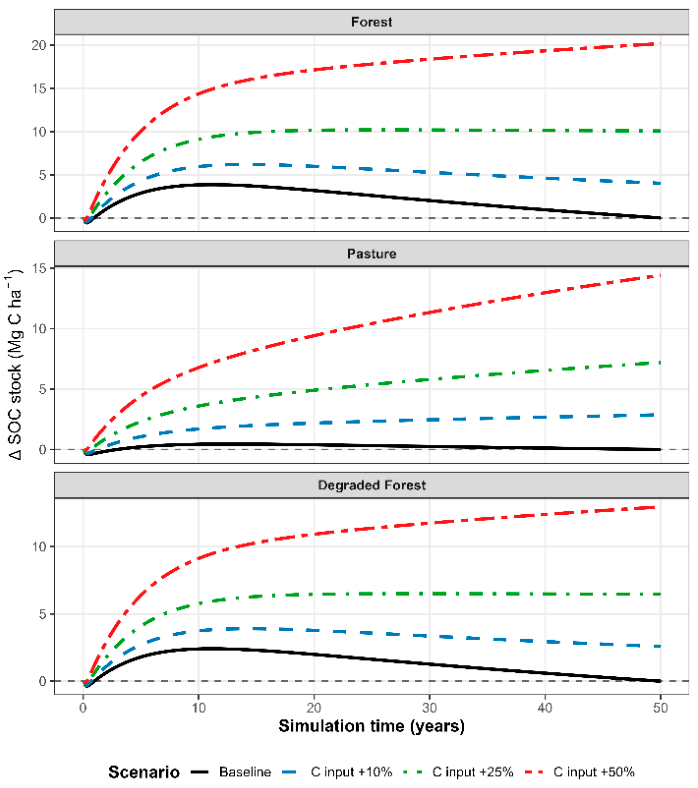
After baseline calibration, carbon input was increased by 10%, 25% and 50% to evaluate the SOC sequestration potential of each land-use class. The temporal SOC responses are shown in Figure 7.
All land-use classes responded positively to increased carbon input. The baseline scenario remained close to zero SOC change, whereas the increased-input scenarios produced progressive SOC accumulation over time. The separation among scenario curves became more pronounced with simulation time, indicating that the SOC response to additional carbon input was cumulative. The strongest SOC gain was observed under the C input +50% scenario. This pattern demonstrates that SOC stocks in the Çapakçur micro-catchment are highly sensitive to changes in organic carbon return to the soil. In practical terms, this response may represent the effects of increased litter input, improved vegetation cover, enhanced root biomass production, organic amendments, or reduced disturbance. Detailed scenario outputs are provided in Supplementary Table S3, while total SOC stock trajectories under increased carbon input scenarios are shown in Supplementary Figure S3. An additional target SOC scenario was simulated to evaluate the annual carbon input required to reach approximately 2% SOC after 50 years. Based on the observed mean bulk density and 0–30 cm soil depth, 2% SOC corresponded to 80.6–80.9 Mg C ha−1 among land-use classes. Forest soils were already close to this threshold, with a current mean SOC concentration of 1.97% and an additional SOC stock requirement of only 2.15 Mg C ha−1. The annual carbon input required to reach the 2% SOC target in forest was 5.44 Mg C ha−1 yr−1, representing a 5.28% increase above the calibrated baseline input. In contrast, degraded forest and pasture required SOC stock gains of 30.63 and 25.04 Mg C ha−1, respectively. The required annual carbon inputs were 7.18 Mg C ha−1 yr−1 for degraded forest and 8.55 Mg C ha−1 yr−1 for pasture, corresponding to increases of 118.33% and 86.78% above their calibrated baseline inputs. These results indicate that reaching 2% SOC is theoretically achievable within the RothC scenario framework, but would require sustained and substantial increases in organic carbon input, particularly in degraded forest and pasture. Detailed target SOC scenario outputs are provided in Supplementary Table S8.

3.4. Degraded Forest Restoration Scenarios

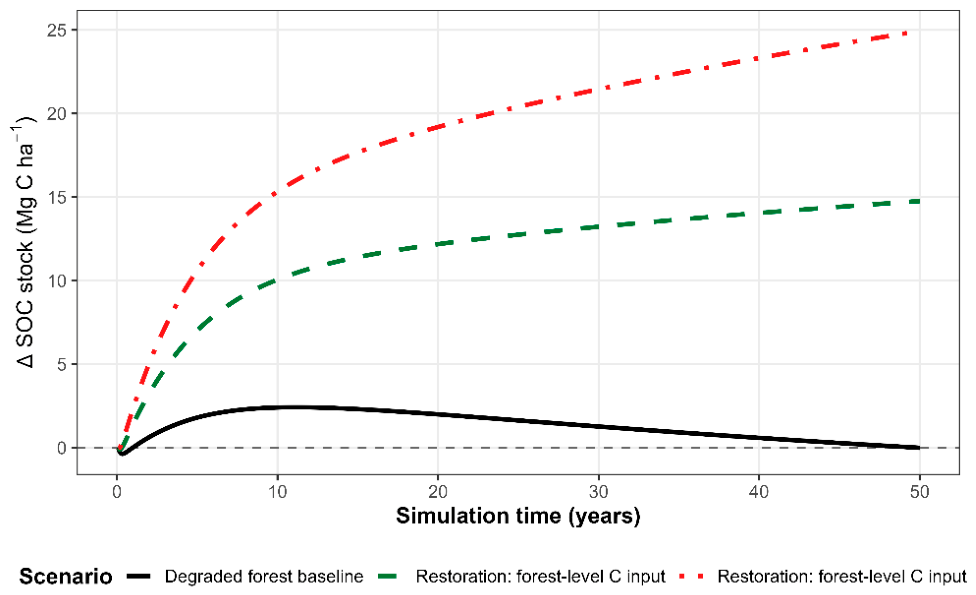
Because degraded forest had lower SOC stock and lower calibrated carbon input than forest, restoration scenarios were developed by increasing degraded forest carbon input to forest-equivalent levels. The plot-scale and catchment-scale restoration results are presented in Table 5, and the temporal SOC trajectories are shown in Figure 8.
Under the forest-level carbon input restoration scenario, degraded forest SOC increased from 50.19 to 64.96 Mg C ha−1, corresponding to a gain of 14.76 Mg C ha−1 over 50 years (Table 5). When scaled to the degraded forest area of 2558 ha, this increase represented 37.77 Gg C, equivalent to 138.49 Gg CO2eq. The stronger restoration scenario increased SOC to 75.12 Mg C ha−1, corresponding to a gain of 24.93 Mg C ha−1. At the catchment scale, this corresponded to 63.77 Gg C or 233.85 Gg CO2eq. These scenario results indicate that degraded forest restoration could provide substantial SOC sequestration potential in the Çapakçur micro-catchment under sustained increases in organic carbon input.

3.5. SOC Responses to Climate Change Scenarios

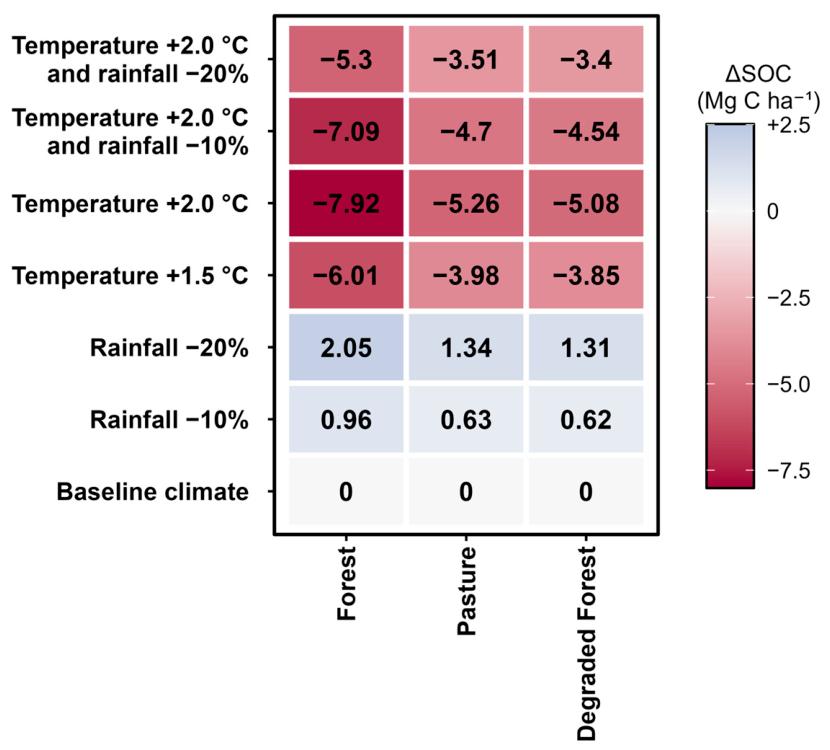
Climate change scenarios were simulated by modifying temperature and rainfall while keeping annual carbon input constant at the calibrated baseline level for each land-use class. Land-use-specific SOC responses to climate scenarios are summarized in Figure 9, while catchment-scale SOC and CO2-equivalent changes are provided in Table 6. Detailed land-use-specific climate scenario outputs are provided in Supplementary Table S4, while temporal SOC-change and total SOC trajectories are shown in Supplementary Figures S4 and S5. Temperature increase caused consistent SOC losses across all land-use classes. Under the +1.5 °C scenario, SOC decreased by 3.86 Mg C ha−1 in degraded forest, 6.01 Mg C ha−1 in forest and 3.98 Mg C ha−1 in pasture. Under the +2.0 °C scenario, SOC losses increased to 5.08 Mg C ha−1, 7.92 Mg C ha−1 and 5.26 Mg C ha−1, respectively. In relative terms, the +2.0 °C scenario reduced SOC stocks by approximately 10.1% in forest and degraded forest and 9.4% in pasture.
Values represent SOC changes relative to the baseline climate scenario after 50 years of RothC simulation. Carbon input was kept constant at the calibrated baseline level for each land-use class. CO2-equivalent values were calculated using a conversion factor of 3.667.
Rainfall reduction alone produced slight SOC gains under the fixed carbon input assumption. A 10% reduction in rainfall increased SOC by 0.62–0.96 Mg C ha−1, while a 20% reduction increased SOC by 1.31–2.04 Mg C ha−1, depending on land-use class. This response reflects the reduction in the RothC moisture modifier, which slows decomposition when soil moisture becomes more limiting. Combined warming and rainfall reduction scenarios still resulted in net SOC losses, although the magnitude of loss was lower than under warming alone. For example, the +2.0 °C and rainfall −20% scenario produced SOC losses of 3.40 Mg C ha−1 in degraded forest, 5.30 Mg C ha−1 in forest and 3.51 Mg C ha−1 in pasture. At the catchment scale, the +1.5 °C scenario resulted in a total SOC loss of 43.0 Gg C, equivalent to 157.6 Gg CO2eq. The +2.0 °C scenario caused a larger loss of 56.8 Gg C, equivalent to 208.2 Gg CO2eq. In contrast, rainfall reduction scenarios produced positive SOC changes under the constant carbon input assumption, with gains of 6.84 Gg C for rainfall −10% and 14.5 Gg C for rainfall −20%. The heatmap in Figure 9 highlights this contrasting pattern: warming scenarios consistently produced negative SOC responses across land-use classes, whereas rainfall reduction scenarios produced small positive responses due to reduced decomposition under fixed carbon input conditions.

4. Discussion

4.1. Effects of Land Use and Topography on SOC Stocks

The results of this study showed that SOC stocks varied considerably among land-use classes in the Çapakçur micro-catchment. Forest soils had the highest mean SOC stock, whereas degraded forest and pasture showed lower and relatively similar values. This pattern indicates that intact forest cover contributes to greater SOC storage capacity, while forest degradation may reduce SOC stocks to levels comparable with pasture-dominated areas [46]. In the present study, mean SOC stock was 78.5 Mg C ha−1 in forest, compared with 55.9 Mg C ha−1 in pasture and 50.2 Mg C ha−1 in degraded forest. This result is consistent with regional and land-use-based studies showing that vegetation recovery, forest cover and reduced disturbance can increase soil organic carbon storage. Nave et al. [13] found that deforestation caused regionally consistent declines in soil carbon stocks, whereas reforestation led to significant increases. These findings suggest that the higher SOC stock observed in forest soils in the Çapakçur micro-catchment may be associated with continuous vegetation cover, greater litter input, root-derived carbon input and lower disturbance intensity [8,13,19]. This result is consistent with regional and land-use-based studies showing that vegetation recovery, forest cover and reduced disturbance can increase soil organic carbon storage. In Türkiye, Korkanç et al. [16] reported that conversion from degraded rangeland to poplar plantation improved organic carbon and soil structural properties, indicating that vegetation recovery can enhance soil carbon-related functions. Previous work in the Çapakçur catchment also showed that forest land had higher SOC content than other land-use classes, while SOC tended to decrease with increasing slope, probably due to erosion-driven soil loss. Therefore, the higher SOC stock observed in forest soils in the present study can be associated with continuous vegetation cover, greater litter input, root-derived carbon input and lower disturbance intensity. However, the wider bootstrap confidence interval for forest indicates that forest SOC stock estimates contain greater uncertainty than pasture and degraded forest estimates, and land-use comparisons should therefore be interpreted with this uncertainty in mind.
The similarity between degraded forest and pasture SOC stocks is also important. It suggests that forest degradation may substantially weaken the soil carbon storage function of forest ecosystems. Land-use and land-cover change studies have repeatedly shown that changes in vegetation structure and land management can strongly affect terrestrial carbon pools and soil organic carbon storage [15,16,17]. Chang et al. [14] reported that LUCC significantly affected terrestrial carbon storage in China, with deforestation causing large carbon losses and afforestation-related activities contributing to carbon gains. Li et al. [15] also showed that SOC storage in Northwest China was strongly affected by LUCC, climate-related processes and agricultural activities. Therefore, the SOC pattern observed in the present study can be interpreted as a combined outcome of land-use structure, vegetation degradation and site-specific environmental conditions.
The correlation and multivariate analyses indicate that SOC stock variability in the Çapakçur micro-catchment was controlled by the combined effects of land-use condition, soil properties and topographic gradients. Spearman correlation analysis showed weak negative relationships between SOC stock and both elevation and slope, suggesting that steeper and higher-elevation areas may be associated with lower SOC retention. However, the weak correlation coefficients indicate that bivariate relationships alone were insufficient to explain SOC stock variability. The multivariate model provided a more integrated interpretation, showing that slope, elevation, clay content, land use and bulk density were significant predictors of log-transformed SOC stock, whereas aspect was not significant. Therefore, SOC stock variation in this heterogeneous mountain catchment should not be attributed to a single dominant factor. Instead, it should be interpreted as the combined outcome of vegetation condition, land-use degradation, soil physical properties, erosion-related redistribution and topographic setting [15,18,19].

4.2. RothC Calibration and SOC Response to Carbon Input

The RothC model was calibrated to estimate the annual carbon input required to maintain the observed SOC stock under each land-use class. The calibrated C input was highest for forest, followed by pasture and degraded forest. Under these calibrated inputs, modelled SOC stocks remained close to initial values after 50 years, as expected from the inverse calibration procedure. Therefore, the baseline trajectories should be interpreted as calibrated equilibrium reference conditions rather than as independent validation of RothC performance. This result should be interpreted as a model-derived estimate rather than a direct field measurement of litterfall or root input. The calibrated C input represents the annual carbon input required by RothC to maintain the current SOC stock under the given clay content, climate modifier and decomposition structure. Therefore, the lower calibrated C input in degraded forest reflects its reduced SOC maintenance capacity relative to intact forest.
A key limitation of the RothC modelling component is the absence of independent temporal SOC observations. In this study, annual carbon input was inversely calibrated to maintain observed SOC stocks under baseline climate conditions. Therefore, the baseline simulation does not constitute independent model validation. The RothC outputs should be interpreted as scenario-based estimates of SOC response under defined carbon-input and climate assumptions rather than as validated long-term forecasts.
The use of RothC for this purpose is supported by recent applications in different landscapes [23,25]. Geremew et al. [23] calibrated RothC using long-term SOC, land management and climatic data in north-west Ethiopia and reported satisfactory agreement between observed and simulated SOC values. Prudil et al. [25] used RothC to assess SOC sequestration under different management scenarios and found that carbon stocks were mainly influenced by plant residue inputs and exogenous organic material application. These findings support the use of RothC in the present study to evaluate how land-use-specific carbon inputs influence SOC maintenance and long-term SOC dynamics. Therefore, the use of RothC in the present mountain micro-catchment should be interpreted as a scenario-based SOC turnover assessment under explicitly defined assumptions, rather than as a crop-growth or vegetation-dynamics model.
The increased carbon input scenarios showed that SOC stocks responded positively to higher organic carbon inputs. All land-use classes exhibited progressive SOC accumulation when calibrated baseline carbon inputs were increased by 10%, 25% and 50%. The separation among scenario curves became more pronounced over time, indicating that SOC response to increased carbon input is cumulative and time-dependent.
This response is consistent with RothC-based scenario studies showing that management practices which increase organic matter return, residue incorporation, cover vegetation or external organic inputs can enhance SOC sequestration potential [25,28,29,30]. Abera et al. [28] simulated SOC dynamics under different sustainable soil management and climate scenarios using RothC and found that all sustainable soil management scenarios increased SOC under current climate, with the largest gains under the highest carbon input scenario. Similarly, Prudil et al. [25] showed that scenarios involving straw incorporation, intercrops and organic material inputs supported SOC stock increase under modelled climate conditions. In the Çapakçur micro-catchment, this means that SOC sequestration potential is strongly dependent on sustained increases in carbon return to the soil. In practical terms, this may be achieved through improved vegetation cover, increased litter input, greater root biomass, reduced soil disturbance and protection of degraded forest areas from further degradation. However, SOC accumulation should not be considered immediate; the modelled trajectories show that SOC gains develop gradually over decadal time scales.
The 2% SOC target scenario further showed that the feasibility of SOC improvement differed strongly among land-use classes. Forest soils were already close to the 2% SOC threshold and required only a small increase in annual carbon input. In contrast, degraded forest and pasture required substantially larger increases in carbon input to reach the same target. This indicates that the 2% SOC threshold may be a realistic short- to medium-term objective for forest soils, whereas degraded forest and pasture would require long-term restoration, sustained biomass return and reduced disturbance to approach this level.

4.3. Restoration Potential of Degraded Forest Areas

The degraded forest restoration scenarios demonstrated measurable SOC sequestration potential. When degraded forest carbon input was increased to forest-equivalent levels, SOC stock increased from 50.19 to 64.96 Mg C ha−1 after 50 years, corresponding to a gain of 14.76 Mg C ha−1. When scaled to the degraded forest area of 2558 ha, this represented 37.77 Gg C, equivalent to 138.49 Gg CO2eq. Under the stronger restoration scenario, SOC stock increased to 75.12 Mg C ha−1, corresponding to 63.77 Gg C or 233.85 Gg CO2eq at the catchment scale.
These results should be interpreted as scenario-based restoration potential, not as guaranteed field accumulation. Achieving forest-equivalent carbon input in degraded forest areas would require sustained improvement in vegetation structure, canopy cover, litter production, root biomass and protection from further disturbance [47,48]. Nevertheless, the results are ecologically meaningful because forest restoration, reforestation and land-use conversion studies consistently show that recovery of vegetation cover and tree-based systems can increase soil carbon stocks [13,16]. Nave et al. [13] reported significant soil carbon gains following reforestation, while deforestation produced consistent declines.
Therefore, degraded forest areas in the Çapakçur micro-catchment can be considered priority zones for SOC-oriented restoration planning. The modelled gains suggest that even partial recovery of forest-like carbon input could provide a relevant contribution to catchment-scale carbon sequestration. However, the magnitude and timing of actual SOC gains would depend on restoration success, vegetation recovery rate, soil depth, erosion control and future climate conditions [13,36].

4.4. Climate Sensitivity of SOC Stocks and Interpretation of Rainfall Scenarios

The climate scenario results showed that warming caused consistent SOC losses across all land-use classes. At the catchment scale, the +1.5 °C scenario resulted in a SOC loss of 42.99 Gg C, equivalent to 157.64 Gg CO2eq, whereas the +2.0 °C scenario caused a larger loss of 56.78 Gg C, equivalent to 208.23 Gg CO2eq. This response is consistent with RothC-based and process-based scenario studies showing that temperature increase can reduce SOC stocks or constrain SOC sequestration by accelerating decomposition and weakening long-term carbon accumulation [35,36,37]. Kaushal et al. [35] simulated SOC dynamics under +1 °C and +2 °C temperature regimes using RothC and reported that increased temperature resulted in SOC decreases across bamboo species. Paramesh et al. [24] also showed that future climate scenarios can produce land-use-specific SOC losses or gains, depending on the emission scenario and land-use system. Similarly, Wang et al. [9] predicted SOC stocks under future land-use and climate conditions and found that future SOC responses varied depending on scenario, time period and dominant land-use type.
In the present study, warming-induced SOC losses occurred while carbon input was kept constant at the calibrated baseline level. This indicates that, if additional carbon inputs do not compensate for enhanced decomposition, warming may reduce SOC stocks and partially offset the gains expected from restoration [49,50]. This is particularly important for degraded forest restoration, because successful SOC recovery depends not only on increasing vegetation-derived carbon inputs but also on maintaining conditions that limit excessive decomposition losses.
Rainfall reduction scenarios produced slight SOC gains under the fixed carbon input assumption. This result should be interpreted cautiously. In the RothC setup used here, reduced rainfall decreased the moisture modifier and slowed decomposition, while plant productivity and organic carbon input were held constant. Therefore, the modelled SOC increase under rainfall reduction reflects a decomposition-driven response under fixed carbon input conditions.
This should not be interpreted as evidence that drought enhances SOC sequestration. In real ecosystems, reduced rainfall may suppress vegetation growth, litterfall, root biomass production and microbial activity. These changes may reduce carbon inputs to soil and alter the long-term SOC balance. Previous RothC applications also indicate that SOC responses under future climate scenarios are land-use-, management- and scenario-dependent [9,24,34]. Paramesh et al. [24] reported both increases and decreases in SOC stocks under projected climate change conditions depending on land-use type and emission scenario. Abera et al. [28] also showed that SOC gains under improved management scenarios declined under future climate conditions, indicating that climate change can constrain the benefits of higher carbon input. Thus, in the present study, rainfall reduction scenarios should be interpreted as decomposition-limited RothC responses under fixed carbon input conditions rather than as full ecosystem responses to drought. Climate effects on SOC depend strongly on carbon input assumptions, vegetation productivity and management responses [24,28,34,36]. This limitation should be clearly stated when interpreting the climate scenario outputs.

4.5. Implications for Soc-Oriented Land Management

Overall, the findings indicate that SOC dynamics in the Çapakçur micro-catchment are controlled by the interaction of land-use condition, organic carbon input and climate sensitivity. Forest soils stored more SOC than degraded forest and pasture, while degraded forest restoration scenarios showed substantial carbon sequestration potential. At the same time, warming scenarios indicated that climate-driven decomposition may reduce SOC stocks and constrain restoration gains.
These results support the integration of field-based SOC stock assessment, spatial mapping and process-based SOC modelling for evaluating restoration priorities in heterogeneous mountain catchments. The combination of observed SOC stocks and RothC-based scenario analysis allows not only the quantification of current SOC status but also the estimation of potential SOC trajectories under restoration and climate change scenarios. Similar integrated approaches have been used in recent studies combining land-use information, SOC mapping and modelling to assess future SOC dynamics and carbon sequestration potential. For example, Li et al. [15] used high-resolution SOC and LUCC maps to evaluate SOC storage changes, while Wang et al. [9] combined digital soil mapping and future land-use/climate scenarios to predict SOC stocks. From a management perspective, degraded forest areas should be treated as key targets for SOC recovery. However, restoration planning should be long-term and climate-sensitive. Increasing vegetation cover and carbon input alone may not be sufficient if future warming accelerates decomposition. Therefore, SOC-oriented restoration should combine vegetation recovery, erosion control, protection from further disturbance and monitoring of SOC changes over time [13,19,36].
These findings are consistent with recent carbon-balance assessments in the Upper Murat River Basin, where forest rehabilitation, afforestation and pasture improvement were identified as important measures for enhancing carbon sequestration and climate resilience [51]. Such studies also emphasize the importance of long-term, site-specific monitoring for evaluating the persistence of carbon gains. Therefore, integrating vegetation restoration with sustained carbon inputs, erosion control and long-term SOC monitoring may provide an effective strategy for enhancing and maintaining SOC sequestration in degraded mountain landscapes [52].

5. Conclusions

This study showed that SOC stocks in the Çapakçur micro-catchment varied substantially among land-use classes, with forest soils storing more carbon than degraded forest and pasture. RothC calibration indicated that the annual carbon input required to maintain current SOC stocks was highest in forest and lowest in degraded forest, reflecting the reduced SOC maintenance capacity of degraded forest areas. Scenario simulations showed that increasing carbon input could generate progressive SOC gains over 50 years, and that degraded forest restoration may provide substantial catchment-scale sequestration benefits. Climate sensitivity analysis indicated that warming may reduce SOC stocks and constrain restoration gains if increased decomposition is not offset by higher carbon inputs. Rainfall reduction scenarios produced slight SOC gains only under the fixed carbon input assumption and should not be interpreted as evidence that drought enhances SOC sequestration. Overall, degraded forest areas should be considered priority zones for SOC-oriented restoration, but restoration planning should combine vegetation recovery, erosion control, protection from disturbance and long-term SOC monitoring. The integration of field-based SOC stock assessment with RothC-based scenario modelling provides a practical framework for evaluating restoration potential and climate-related SOC vulnerability in mountain micro-catchments.

Supplementary Materials

The following supporting information can be downloaded at: https://www.mdpi.com/article/10.3390/land15091535/s1, Figure S1: Frequency distribution of SOC stock values across the Çapakçur micro-catchment; Figure S2: Scatterplots showing relationships between SOC stock and selected soil-topographic variables: (a) clay content, (b) bulk density, (c) slope, and (d) elevation; Figure S3: RothC-simulated total SOC stock trajectories under increased carbon input scenarios for each land-use class; Figure S4: RothC-simulated SOC stock changes under climate sensitivity scenarios, with carbon input fixed at calibrated baseline levels; Figure S5: RothC-simulated total SOC stock trajectories under climate sensitivity scenarios, with carbon input fixed at calibrated baseline levels; Figure S6: Spatial distribution of the prediction standard error of log-transformed SOC stock obtained from the ordinary kriging model; Table S1: Spearman correlation coefficients between SOC stock and selected soil-topographic variables; Table S2: Detailed RothC carbon pool outputs under calibrated baseline conditions by land-use class; Table S3: Detailed SOC stock responses to increased carbon input scenarios by land-use class after 50 years of RothC simulation; Table S4: Land-use-specific SOC responses to climate sensitivity scenarios relative to the baseline climate; Table S5: Sampling density by land-use class in the Çapakçur micro-catchment; Table S6: Bootstrap uncertainty statistics for mean SOC stock by land-use class; Table S7: Multivariate model outputs for log-transformed SOC stock using land-use and soil-topographic variables as predictors; Table S8: RothC-estimated annual carbon input required to reach approximately 2% SOC after 50 years; Table S9: Leave-one-out cross-validation statistics of the ordinary kriging model applied to log-transformed SOC stock values.

Author Contributions

Conceptualization, Y.D.; methodology, Y.D.; software, Y.D. and A.M.; validation, Y.D., A.M. and A.D.D.; formal analysis, Y.D. and A.D.D.; investigation, Y.D. and A.M.; resources, Y.D. and A.D.D.; data curation, Y.D. and A.M.; writing—original draft preparation, Y.D., A.M. and A.D.D.; writing—review and editing, Y.D., A.M. and A.D.D.; visualization, Y.D. and A.M.; supervision, Y.D.; project administration, Y.D.; funding acquisition, Y.D. All authors have read and agreed to the published version of the manuscript.

Funding

This study was supported by The Scientific Research Projects Corrdination Unit of Bingol University (Project No: Pikom-Bitki.2018.001).

Data Availability Statement

The data presented in this study are available from the corresponding author upon reseonable request.

Conflicts of Interest

The authors declare no conflict of interests.

References

  1. Lal, R.; Monger, C.; Nave, L.; Smith, P. The role of soil in regulation of climate. Philos. Trans. R. Soc. B Biol. Sci. 2021, 376, 20210084. [Google Scholar] [CrossRef] [Scilit] [PubMed]
  2. Rocci, K.S.; Lavallee, J.M.; Stewart, C.E.; Cotrufo, M.F. Soil organic carbon response to global environmental change depends on its distribution between mineral-associated and particulate organic matter: A meta-analysis. Sci. Total Environ. 2021, 793, 148569. [Google Scholar] [CrossRef] [Scilit] [PubMed]
  3. Voltr, V.; Menšík, L.; Hlisnikovský, L.; Hruška, M.; Pokorný, E.; Pospíšilová, L. The soil organic matter in connection with soil properties and soil inputs. Agronomy 2021, 11, 779. [Google Scholar] [CrossRef] [Scilit]
  4. Zhang, H.; Lauerwald, R.; Ciais, P.; Oost, K.V.; Guenet, B.; Regnier, P. Global changes alter the amount and composition of land carbon deliveries to European rivers and seas. Commun. Earth Environ. 2022, 3, 245. [Google Scholar] [CrossRef] [Scilit]
  5. Yang, Y.; Sun, H.; Zhang, P.; Wu, F.; Qiao, J.; Li, T.; Wang, Y.; An, S. Review of Managing Soil Organic C Sequestration from Vegetation Restoration on the Loess Plateau. Forests 2023, 14, 1964. [Google Scholar] [CrossRef] [Scilit]
  6. Min, K.; Yang, Y.; Wahab, L.; Oh, M.; Ghezzehei, T.A.; Berhe, A.A. Soil organic matter dynamics under changing precipitation regimes. New Phytol. 2025, 249, 2179–2195. [Google Scholar] [CrossRef] [Scilit] [PubMed]
  7. Blanco-Moure, N.; Gracia, R.; Bielsa, A.; López, M.V. Long-term no-tillage effects on particulate and mineral-associated soil organic matter under rainfed M editerranean conditions. Soil Use Manag. 2013, 29, 250–259. [Google Scholar] [CrossRef] [Scilit]
  8. Levy, P.; Bentley, L.; Danks, P.; Emmett, B.; Garbutt, A.; Heming, S.; Henrys, P.; Keith, A.; Lebron, I.; McNamara, N.; et al. The effects of land use on soil carbon stocks in the UK. Biogeosciences 2024, 21, 4301–4315. [Google Scholar] [CrossRef] [Scilit]
  9. Wang, S.; Zhang, X.; Adhikari, K.; Bol, R.; Zhuang, Q.; Wang, Z.; Shi, D.; Jin, X.; Qian, F. Predicting soil organic carbon stocks under future land use and climate change conditions in Northeast China. Environ. Impact Assess. Rev. 2023, 103, 107278. [Google Scholar] [CrossRef] [Scilit]
  10. Smith, P. Land use change and soil organic carbon dynamics. Nutr. Cycl. Agroecosyst. 2008, 81, 169–178. [Google Scholar] [CrossRef] [Scilit]
  11. Guimarães, D.V.; Gonzaga, M.I.S.; da Silva, T.O.; da Silva, T.L.; da Silva Dias, N.; Matias, M.I.S. Soil organic matter pools and carbon fractions in soil under different land uses. Soil Tillage Res. 2013, 126, 177–182. [Google Scholar] [CrossRef] [Scilit]
  12. Doğan Demir, A.; Demir, Y.; Şahin, Ü. Contamination and potential mobility assessment of potentially toxic elements (PTEs) in soils in relationship with different geographic factors and soil erosion class. Environ. Geochem. Health 2025, 47, 500. [Google Scholar] [CrossRef] [Scilit] [PubMed]
  13. Nave, L.E.; DeLyser, K.; Domke, G.M.; Holub, S.M.; Janowiak, M.K.; Keller, A.B.; Peters, M.P.; Solarik, K.A.; Walters, B.F.; Swanston, C.W. Land use change and forest management effects on soil carbon stocks in the Northeast U.S. Carbon Balance Manag. 2024, 19, 5. [Google Scholar] [CrossRef] [Scilit] [PubMed]
  14. Chang, X.; Xing, Y.; Wang, J.; Yang, H.; Gong, W. Effects of land use and cover change (LUCC) on terrestrial carbon stocks in China between 2000 and 2018. Resour. Conserv. Recycl. 2022, 182, 106333. [Google Scholar] [CrossRef] [Scilit]
  15. Li, Y.; Liu, W.; Feng, Q.; Zhu, M.; Yang, L.; Zhang, J. Effects of land use and land cover change on soil organic carbon storage in the Hexi regions, Northwest China. J. Environ. Manag. 2022, 312, 114911. [Google Scholar] [CrossRef] [Scilit] [PubMed]
  16. Korkanç, S.Y.; Şahin, H.; Özden, A.O.; Özkurt, B. The effects of land use conversion on soil organic carbon and selected properties of soils: A case of Nigde province. Turk. J. For. 2018, 19, 362–367. [Google Scholar] [CrossRef] [Scilit]
  17. Kobler, J.; Zehetgruber, B.; Dirnböck, T.; Jandl, R.; Mirtl, M.; Schindlbacher, A. Effects of aspect and altitude on carbon cycling processes in a temperate mountain forest catchment. Landsc. Ecol. 2019, 34, 325–340. [Google Scholar] [CrossRef] [Scilit]
  18. Borůvka, L.; Vašát, R.; Šrámek, V.; Hellebrandová, K.N.; Fadrhonsová, V.; Šáňka, M.; Pavlů, L.; Sáňka, O.; Vacek, O.; Němeček, K.; et al. Predictors for digital mapping of forest soil organic carbon stocks in different types of landscape. Soil Water Res. 2022, 17, 69–79. [Google Scholar] [CrossRef] [Scilit]
  19. Demir, Y.; Ersoy Mirici, M. Effect of land use and topographic factors on soil organic carbon content and mapping of organic carbon distribution using regression kriging method. Carpathian J. Earth Environ. Sci. 2020, 15, 311–322. [Google Scholar] [CrossRef] [Scilit]
  20. Martin, M.P.; Orton, T.G.; Lacarce, E.; Meersmans, J.; Saby, N.; Paroissien, J.-B.; Jolivet, C.; Boulonne, L.; Arrouays, D. Evaluation of modelling approaches for predicting the spatial distribution of soil organic carbon stocks at the national scale. Geoderma 2014, 223–225, 97–107. [Google Scholar] [CrossRef] [Scilit]
  21. Szatmári, G.; Pásztor, L.; Heuvelink, G.B.M. Estimating soil organic carbon stock change at multiple scales using machine learning and multivariate geostatistics. Geoderma 2021, 403, 115356. [Google Scholar] [CrossRef] [Scilit]
  22. Coleman, K.; Jenkinson, D.S. RothC-26.3: A model for the turnover of carbon in soil. In Evaluation of Soil Organic Matter Models; Powlson, D.S., Smith, P., Smith, J.U., Eds.; Springer: Berlin/Heidelberg, Germany, 1996; pp. 237–246. [Google Scholar]
  23. Geremew, B.; Tadesse, T.; Bedadi, B.; Gollany, H.T.; Tesfaye, K.; Aschalew, A.; Tilaye, A.; Abera, W. Evaluation of RothC model for predicting soil organic carbon stock in north-west Ethiopia. Environ. Chall. 2024, 15, 100909. [Google Scholar] [CrossRef] [Scilit]
  24. Paramesh, V.; Kumar, P.; Nath, A.J.; Francaviglia, R.; Mishra, G.; Arunachalam, V.; Toraskar, S. Simulating soil organic carbon stock under different climate change scenarios: A RothC model application to typical land-use systems of Goa, India. Catena 2022, 213, 106129. [Google Scholar] [CrossRef] [Scilit]
  25. Prudil, J.; Pospíšilová, L.; Dryšlová, T.; Barančíková, G.; Smutný, V.; Sedlák, L.; Ryant, L.; Hlavinka, P.; Trnka, M.; Halas, J.; et al. Assessment of carbon sequestration as affected by different management practices using the RothC model. Plant Soil Environ. 2023, 69, 532–544. [Google Scholar] [CrossRef] [Scilit]
  26. Wang, G.C.; Luo, Z.; Han, P.; Chen, H.; Xu, J. Critical carbon input to maintain current soil organic carbon stocks in global wheat systems. Sci. Rep. 2016, 6, 19327. [Google Scholar] [CrossRef] [Scilit] [PubMed]
  27. Mesfin, S.; Gebresamuel, G.; Haile, M.; Zenebe, A. Modelling spatial and temporal soil organic carbon dynamics under climate and land management change scenarios, northern Ethiopia. Eur. J. Soil Sci. 2021, 72, 1298–1311. [Google Scholar] [CrossRef] [Scilit]
  28. Abera, W.; Tilaye, A.; Tibebe, D.; Abegaz, A. Modelling SOC dynamics on cropland under different regenerative agriculture practices and climate change scenario using RothC model in the Abbay basin of Ethiopia. Environ. Sustain. Indic. 2025, 28, 100957. [Google Scholar] [CrossRef] [Scilit]
  29. D’Avino, L.; Di Bene, C.; Farina, R.; Razza, F. Introduction of cardoon (Cynara cardunculus L.) in a rainfed rotation to improve soil organic carbon stock in marginal lands. Agronomy 2020, 10, 946. [Google Scholar] [CrossRef] [Scilit]
  30. Nieto, O.M.; Castro, J.; Fernández, E.; Smith, P. Simulation of soil organic carbon stocks in a Mediterranean olive grove under different soil-management systems using the RothC model. Soil Use Manag. 2010, 26, 118–125. [Google Scholar] [CrossRef] [Scilit]
  31. Kirschbaum, M.U.F. The temperature dependence of organic-matter decomposition—Still a topic of debate. Soil Biol. Biochem. 2006, 38, 2510–2518. [Google Scholar] [CrossRef] [Scilit]
  32. Conant, R.T.; Ryan, M.G.; Ågren, G.I.; Birge, H.E.; Davidson, E.A.; Eliasson, P.E.; Evans, S.E.; Frey, S.D.; Giardina, C.P.; Hopkins, F.M.; et al. Temperature and soil organic matter decomposition rates–synthesis of current knowledge and a way forward. Glob. Change Biol. 2011, 17, 3392–3404. [Google Scholar] [CrossRef] [Scilit]
  33. Radočaj, D.; Gašparović, M.; Jurišić, M. Open Remote Sensing Data in Digital Soil Organic Carbon Mapping: A Review. Agriculture 2024, 14, 1005. [Google Scholar] [CrossRef] [Scilit]
  34. Jebari, A.; del Prado, A.; Pardo, G.; Rodríguez Martín, J.A.; Álvaro-Fuentes, J. Modelling regional effects of climate change on soil organic carbon in Spain. J. Environ. Qual. 2018, 47, 644–653. [Google Scholar] [CrossRef] [Scilit] [PubMed]
  35. Kaushal, R.; Panwar, P.; Durai, J.; Tomar, J.M.S.; Mandal, D.; Dogra, P.; Gupta, A.; Reza, S.; Singh, C.; Madhu, M. Simulating SOC dynamics under different temperature regimes and FYM addition in bamboo species using RothC-model. Forests 2023, 14, 722. [Google Scholar] [CrossRef] [Scilit]
  36. Wiltshire, S.; Beckage, B. Integrating climate change into projections of soil carbon sequestration from regenerative agriculture. PLoS Clim. 2023, 2, e0000130. [Google Scholar] [CrossRef] [Scilit]
  37. Adeel, A.; Hasani, M.; Sonal Chonde, G.; Jadhav, A.S. Measuring carbon sequestration and climate change mitigation potential of croplands under different climatic scenarios using RothC model. Front. Clim. 2026, 8, 1801916. [Google Scholar] [CrossRef] [Scilit]
  38. General Directorate of Meteorology. Cities & Holiday Resorts. 2026. Available online: https://www.mgm.gov.tr/veridegerlendirme/il-ve-ilceler-istatistik.aspx?k=A&m=BINGOL (accessed on 10 July 2026).
  39. Thornthwaite, C.W. An approach toward a rational classification of climate. Geogr. Rev. 1948, 38, 55–94. [Google Scholar] [CrossRef] [Scilit] [PubMed]
  40. Walkley, A.; Black, I.A. An examination of the Degtjareff method for determining soil organic matter, and a proposed modification of the chromic acid titration method. Soil Sci. 1934, 37, 29–38. [Google Scholar] [CrossRef] [Scilit]
  41. Bouyoucos, G.J. Hydrometer method improved for making particle size analyses of soils 1. Agron. J. 1962, 54, 464–465. [Google Scholar] [CrossRef] [Scilit]
  42. Blake, G.R. Bulk density. In Methods of Soil Analysis: Part 1. Physical and Mineralogical Properties, Including Statistics of Measurement and Sampling; Black, C.A., Ed.; American Society of Agronomy: Madison, WI, USA, 1965; pp. 374–390. [Google Scholar]
  43. Hengl, T.; Heuvelink, G.B.; Rossiter, D.G. About regression-kriging: From equations to case studies. Comput. Geosci. 2007, 33, 1301–1315. [Google Scholar] [CrossRef] [Scilit]
  44. Coleman, K.; Jenkinson, D.S.; Crocker, G.J.; Grace, P.R.; Klír, J.; Körschens, M.; Poulton, P.R.; Richter, D.D. Simulating trends in soil organic carbon in long-term experiments using RothC-26.3. Geoderma 1997, 81, 29–44. [Google Scholar] [CrossRef] [Scilit]
  45. Falloon, P.; Smith, P.; Coleman, K.; Marshall, S. Estimating the size of the inert organic matter pool from total soil organic carbon content for use in the Rothamsted carbon model. Soil Biol. Biochem. 1998, 30, 1207–1211. [Google Scholar] [CrossRef] [Scilit]
  46. Reyes, S.; Cristóbal-Acevedo, D.; Hernández-Acosta, E.; Lozano, J.L.R. Influencia de la cobertura, pendiente y profundidad, sobre el carbono y nitrógeno del suelo. Rev. Mex. Cienc. For. 2019, 10, 201–223. [Google Scholar] [CrossRef] [Scilit]
  47. He, J.; Li, W.; Zhao, Z.; Zhu, L.; Du, X.; Xu, Y.; Sun, M.; Zhou, J.; Ciais, P.; Wigneron, J.; et al. Recent advances and challenges in monitoring and modeling of disturbances in tropical moist forests. Front. Remote Sens. 2024, 5, 1332728. [Google Scholar] [CrossRef] [Scilit]
  48. Waring, B.G.; Lancastle, L.; Bell, T.; Bidartondo, M.I.; García-Díaz, P.; Lambin, X.; Vanguelova, E.; Windram, F.A. Windthrow disturbance impacts soil biogeochemistry and bacterial communities in a temperate forest. Plant Soil 2024, 512, 395–408. [Google Scholar] [CrossRef] [Scilit] [PubMed]
  49. Sreekumar, K.K.; Kumar, K.S.A.; Nair, K.P.M.; Kalaiselvi, B.; Lalitha, M.; Sreekumar, P.; Ramamurthy, V. Assessing changes in soil organic carbon stocks and vulnerability to land degradation in Western Ghats, South India: Is it restorative enough? Soil Use Manag. 2024, 40, e13056. [Google Scholar] [CrossRef] [Scilit]
  50. Worden, S.; Fu, R.; Bloom, A.A.; Bauters, M.; Verbeeck, H.; Fatoyinbo, T.; Hubau, W.; Koutika, L.; Kengdo, S.K.; Maes, S.L.; et al. Congo Basin Carbon Cycle Responses to Global Change. Glob. Change Biol. 2026, 32, e70688. [Google Scholar] [CrossRef] [Scilit] [PubMed]
  51. Yılmaz, M.; Meral, A.; Yüksel, A.; Avşaroğlu, M.M. Nature-based solutions and the carbon cycle: Analysis of Murat River watershed rehabilitation utilising the Ex-Act model. Int. J. Energ. Water Res. 2025, 9, 2527–2547. [Google Scholar] [CrossRef] [Scilit]
  52. Meral, A.; Özkan, D.G.; Demirci, Ö.; Yazıcı, İ. Ex-ACT Tabanlı Bir Yaklaşımla Kentsel Peyzaj Dönüşümlerinin Karbon Bütçesi Değerlendirmesi: Bingöl Genç Millet Bahçesi Örneği. Çevre İklim ve Sürdürülebilirlik 2026, 1791864, 1–9. [Google Scholar]
Figure 1. Study area map showing the Çapakçur micro-catchment, major land-use classes, and spatial distribution of soil sampling points used for SOC stock assessment.
Land 15 01535 g001
Figure 2. Monthly hydroclimatic characteristics of Bingöl Province during 1961–2025, including precipitation, potential evapotranspiration, and minimum, mean and maximum air temperature.
Land 15 01535 g002
Figure 3. Spatial distribution of soil organic carbon (SOC) stocks in the Çapakçur micro-catchment predicted using ordinary kriging of log-transformed SOC stock values.
Land 15 01535 g003
Figure 4. Boxplot and point distribution of soil organic carbon (SOC) stocks across degraded forest, forest and pasture land-use classes.
Land 15 01535 g004
Figure 5. Spearman correlation heatmap showing relationships among SOC stock, SOC concentration and selected soil-topographic variables.
Land 15 01535 g005
Figure 6. Calibrated RothC baseline SOC dynamics for forest, pasture and degraded forest over the 50-year simulation period.
Land 15 01535 g006
Figure 7. RothC-simulated SOC stock changes under increased carbon input scenarios.
Land 15 01535 g007
Figure 8. RothC-simulated SOC stock changes under degraded forest restoration scenarios.
Land 15 01535 g008
Figure 9. Heatmap of SOC responses to climate scenarios relative to the baseline climate across land-use classes.
Land 15 01535 g009
Table 1. Standard RothC organic carbon pools and first-order annual decomposition rate constants used in this study.
SOC PoolDescriptionDecomposition Rate Constant, k (yr−1)
DPMDecomposable plant material10.0 yr−1
RPMResistant plant material0.30 yr−1
BIOMicrobial biomass0.66 yr−1
HUMHumified organic matter0.02 yr−1
IOMInert organic matter0 yr−1
Note: Decomposition rate constants are expressed on an annual basis (yr−1) and represent standard RothC first-order decomposition constants. The IOM pool was assumed to be inert and therefore assigned a decomposition rate constant of 0 yr−1.
Table 2. Main assumptions used in the RothC simulations.
No.Model AssumptionSupporting Basis/Reference
1RothC simulations were performed for the 0–30 cm soil layer.This study is consistent with SOC stock modelling for 30 cm soil depth in RothC applications.
2Each land-use class was represented by its mean SOC stock and mean clay content.This study used land-use-level model simplification.
3IOM was estimated using the Falloon et al. [45] equation.[25,45]
4Site-specific radiocarbon data were not available; therefore, active SOC pools were initialized using fixed pool-distribution assumptions.[22,25,45]
5Forest and degraded forest were assigned a woody vegetation DPM/RPM ratio of 0.25.[22,23,24,44]
6Pasture was assigned a grassland-type DPM/RPM ratio of 1.44.[22,23,24,44]
7Soil cover was assumed to be present in all three land-use classes.This study was based on forest, degraded forest and pasture vegetation cover.
8Baseline climate was represented by long-term monthly climate means.This study uses a common baseline-climate approach in RothC scenario simulations.
9Carbon input was calibrated inversely to maintain observed SOC stocks over 50 years.This study is consistent with RothC calibration approaches using observed SOC stocks.
10In climate scenarios, carbon input was kept constant to isolate decomposition-driven SOC responses.This study: controlled scenario assumption.
11The model did not explicitly simulate plant growth, erosion, deposition or land-use change dynamics during the 50-year simulation period.RothC model limitation; [24]
IOM: inert organic matter; DPM: decomposable plant material; RPM: resistant plant material. Assumptions marked as “This study” represent study-specific modelling decisions. Standard RothC assumptions and DPM/RPM ratios were adopted from the RothC model structure and previous RothC applications.
Table 3. Descriptive statistics of soil organic carbon stocks across land-use classes in the Çapakçur micro-catchment.
LandusenSOC (mg C ha−1)Clay (%)
(Mean)
BD (g cm−3)
(Mean)
MeanSDMinMaxMedian
Degraded Forest10350.19442.7348.373216.03738.08814.6301.347
Forest1978.47247.14720.012210.71665.68913.6321.344
Pasture30655.88750.7107.685247.68038.09414.1451.349
Table 4. RothC-calibrated annual carbon inputs and equilibrium-constrained baseline SOC stocks by land-use class.
Land UseInitial SOC Stock (Mg C ha−1)Clay (%)DPM/RPM RatioClimate Modifier, ξCalibrated C Input (Mg C ha−1 yr−1)Final SOC After 50 Years (Mg C ha−1)ΔSOC After 50 Years (Mg C ha−1)
Degraded forest50.1914.630.250.7653.2950.190.00
Forest78.4713.630.250.7655.1778.470.00
Pasture55.8914.151.440.7654.5855.890.00
Note: Baseline SOC values represent equilibrium-constrained RothC calibration outputs. They should not be interpreted as independent historical validation data, because no temporal SOC observations were available.
Table 5. RothC-simulated SOC gains under degraded forest restoration scenarios at plot and catchment scales after 50 years.
Restoration ScenarioInitial SOC Stock (Mg C ha−1)Final SOC Stock (Mg C ha−1)SOC Gain (Mg C ha−1)SOC Gain (%)Area (ha)Total SOC Gain (Gg C)Total CO2eq Gain (Gg CO2eq)
Degraded forest baseline50.1950.190.000.0025580.000.00
Restoration: forest-level C input50.1964.9614.7629.41255837.77138.49
Restoration: forest-level C input +25%50.1975.1224.9349.67255863.77233.85
Note: SOC gains represent scenario-based RothC outputs calculated as the difference between final and initial SOC stock after 50 years of simulation. These values indicate restoration potential under defined carbon-input assumptions and should not be interpreted as measured historical SOC changes. CO2-equivalent values were calculated by multiplying C stock changes by 3.667.
Table 6. Catchment-scale SOC and CO2-equivalent changes under climate change scenarios.
Climate ScenarioBasin SOC
Change (Gg C)
Basin CO2eq
Change (Gg CO2eq)
Baseline climate0.000.00
Rainfall −10%6.8425.07
Rainfall −20%14.5253.26
Temperature +1.5 °C−42.99−157.64
Temperature +2.0 °C−56.78−208.23
Temperature +2.0 °C and rainfall −10%−50.75−186.09
Temperature +2.0 °C and rainfall −20%−37.93−139.07
Disclaimer/Publisher’s Note: The statements, opinions and data contained in all publications are solely those of the individual author(s) and contributor(s) and not of MDPI and/or the editor(s). MDPI and/or the editor(s) disclaim responsibility for any injury to people or property resulting from any ideas, methods, instructions or products referred to in the content.