Article

Biodiversity and Carbon Storage in a Tropical Urban Park: Implications for Nature-Based Solutions in Jakarta, Indonesia


by
Nur Muhammad Heriyanto
1,
Laode Alhamd
1,
I Wayan Susi Dharmawan
1,*,
Hendra Gunawan
1,
Pratiwi
1,
R. Garsetiasih
2,
Rozza Tri Kwatrina
1,
Nina Mindawati
1,
Mahfudz
3,
Imawan Wahyu Hidayat
1,
Reny Sawitri
1,
Budi Hadi Narendra
1,
Marfuah Wardani
1,
Sona Suhartana
1,
Lutfy Abdulah
1,
Titiek Setyawati
2,
Darwo
1,
Mariana Takandjandji
2 and
Yunita Lisnawati
1
1
Research Center for Ecology, The National Research and Innovation Agency (BRIN), Bogor 16911, West Java, Indonesia
2
Research Center for Biota Systems, The National Research and Innovation Agency (BRIN), Bogor 16911, West Java, Indonesia
3
Ministry of Forestry (MoF), Central Jakarta 10270, Jakarta, Indonesia
*
Author to whom correspondence should be addressed.
Land 2026, 15(8), 1514; https://doi.org/10.3390/land15081514
Submission received: 19 June 2026 / Revised: 6 August 2026 / Accepted: 14 August 2026 / Published: 20 August 2026

Abstract

Urban green open spaces play a critical role in mitigating greenhouse gas emissions and enhancing biodiversity in rapidly urbanizing tropical megacities. This study aims to characterize vegetation structure and species diversity, as well as quantify above-ground carbon stocks in Taman Bendera Pusaka, South Jakarta, Indonesia. The results are expected to inform evaluations of urban parks’ contribution as nature-based solutions. A complete tree census was conducted between August and September 2025, recording diameter at breast height, height, and species identity for all individuals. Above-ground biomass (AGB) for woody trees was estimated using a widely applied pantropical allometric model developed for humid tropical forests, while separate generalized equations were applied respectively to the palms and bamboos groups to account for their distinct morphological characteristics. The estimated biomass values were subsequently converted into carbon stocks and CO2 equivalents. Biodiversity was evaluated using Margalef richness, Shannon–Wiener diversity, and Pielou’s evenness indices. A total of 2459 individuals were recorded. Langsat Park had the highest species richness (S = 79) with diversity (H′ = 3.38; E = 0.77), and Leuser (S = 78) with highest diversity (H′ = 3.44; E = 0.79), whereas Ayodya Parks showed the lowest structures and diversity values (S = 33; H′ = 2.18; E = 0.68). Total AGB reached 5873.63 Mg, with a mean carbon density of 444.64 Mg C ha−1 or 1631.82 Mg CO2 ha−1. Carbon storage was largely driven by a few dominant ornamental palms, particularly Roystonea regia, although native canopy trees contributed to structural stability. These findings show that even relatively small tropical urban parks can serve as significant localized carbon storage while sustaining urban biodiversity, underscoring the value of structurally diverse, native-enriched planting strategies for resilient urban forest management.

1. Introduction

Tropical megacities are at the epicenter of intertwined environmental crises, where rapid urbanization, industrial growth, and soaring vehicle numbers drastically amplify greenhouse gas (GHG) emissions. This leads to a cascade of adverse effects, including deteriorating air quality, the intensification of urban heat islands, and profound environmental discomfort for millions of inhabitants [1]. The convergence of dense populations and concentrated anthropogenic activities in these metropolises makes them disproportionately large contributors to global carbon emissions, while simultaneously diminishing the very natural buffers that could mitigate these impacts [2,3].
In response to these challenges, Green Open Spaces (GOS), when strategically planned, designed, and managed according to Nature-based Solutions (NbS) principles, can serve as important components of sustainable urban green infrastructure. Defined under Indonesia’s Law No. 11 of 2020 as areas for vegetation development with ecological and socio-cultural functions, GOS serve as the “lungs of the city.” GOS, including urban forests, provide various ecosystem services that are beneficial to human well-being, including improving air quality, carbon absorption, microclimate regulation, biodiversity conservation, and recreational benefits. Vegetation, especially trees, acts as a critical biofilter, absorbing pollutants and hazardous substances [4,5]. More importantly, through photosynthesis, urban trees sequester atmospheric carbon dioxide (CO2) and store it as biomass, thus functioning as dynamic carbon storage that regulate microclimates and offset some urban emissions [6,7,8]. The diversity and structural complexity of this vegetation are crucial metrics for evaluating a GOS’s ecological quality, as they enhance productivity, ecosystem stability, and habitat provision [9,10].
Carbon stocks in urban ecosystems are primarily stored in above-ground vegetation biomass, including trunks, branches, leaves, and roots [11]. In tropical urban parks, large trees with significant diameter and height contribute most dominantly to total carbon stocks, as the allometric relationship between diameter at breast height (DBH) and biomass is exponential [12]. Several studies in Indonesian cities have shown that urban parks can store carbon in the range of 50–150 Mg of carbon per hectare, depending on species composition, stand density, and the vertical structure of the vegetation [13,14,15].
Despite the established importance of GOS, a significant research gap persists, particularly in rapidly developing Southeast Asian megacities like Jakarta. While Jakarta has committed to a 50% reduction in GHG emissions by 2030 (Governor Regulation No. 90/2021), its green space has paradoxically declined from 33.7% in 2000 to just 5.2–5.6% in 2024–2025 [16]. Although recent studies in other tropical cities underscore the dual role of urban green spaces in biodiversity conservation and carbon storage [17,18], systematic, plot-based field assessments that simultaneously quantify vegetation diversity and carbon stock potential at the park scale remain scarce in Jakarta. Most contemporary research in the region relies on large-scale remote sensing, which, while valuable for broad-scale analysis, often fails to capture the detailed, ground-level data needed to inform local management [19].
One of the objectives of this research is to assess the diversity of plants cultivated in urban areas, which are relatively limited in size compared to natural forests. It is anticipated that by planting trees in these increasingly constrained spaces—driven by urban expansion and population growth—researchers can determine plant diversity and quantify biomass and carbon stocks. Furthermore, the diversity and biomass of vegetation in well-managed urban green spaces can be compared with those found in natural forests. A key advantage of urban green spaces is the ability to achieve the aesthetic appeal and landscape design desired by management without compromising plant diversity or carbon storage capabilities.
This study aims to address this knowledge gap by conducting a comprehensive field assessment in the Langsat, Leuser, and Ayodya Parks within the Bendera Pusaka Green Open Space in South Jakarta. This particular study does not evaluate the study area against the formal criteria of the IUCN Global Standard for Nature-based Solutions. Rather, it assesses two key ecological attributes—biodiversity and carbon storage—that underpin the effectiveness of urban Nature-based Solutions and Green Infrastructure. The findings provide baseline ecological evidence to support future planning and evaluation of the Bendera Pusaka Park within an NbS framework. Therefore, the objectives are threefold: (1) to characterize the vegetation structure and species diversity within the park; (2) to estimate the above-ground carbon stock; and (3) to compare the biodiversity and carbon storage patterns across the three parks. By integrating biodiversity and carbon assessments, this research provides empirical evidence to support urban ecological planning and nature-based climate mitigation strategies in tropical megacities. The findings are expected to underscore the critical role of city parks in enhancing urban environmental quality and offer data-driven recommendations for the future development and management of urban green open spaces.
Beyond its immediate relevance to Jakarta’s green-space policy, the scientific novelty of this study extends to an international scale. Urban carbon and biodiversity assessments have so far concentrated largely on temperate cities or on tropical forests dominated by dicotyledonous trees, so that palm-dominated urban green spaces–a vegetation type common not only in Jakarta but across many tropical and subtropical cities in Southeast Asia, Latin America, and parts of Africa–remain poorly represented by field-based, empirically grounded baselines. By explicitly quantifying the contribution of ornamental palms alongside native canopy trees to above-ground carbon storage, and by testing the applicability of pantropical allometric approaches within a palm-rich urban setting, this study offers a transferable methodological reference for other palm-dominated tropical megacities. In this sense, the present work moves beyond a single-city case study to address a broader, internationally relevant gap in tropical urban forestry research.

2. Materials and Methods

2.1. Location of the Study

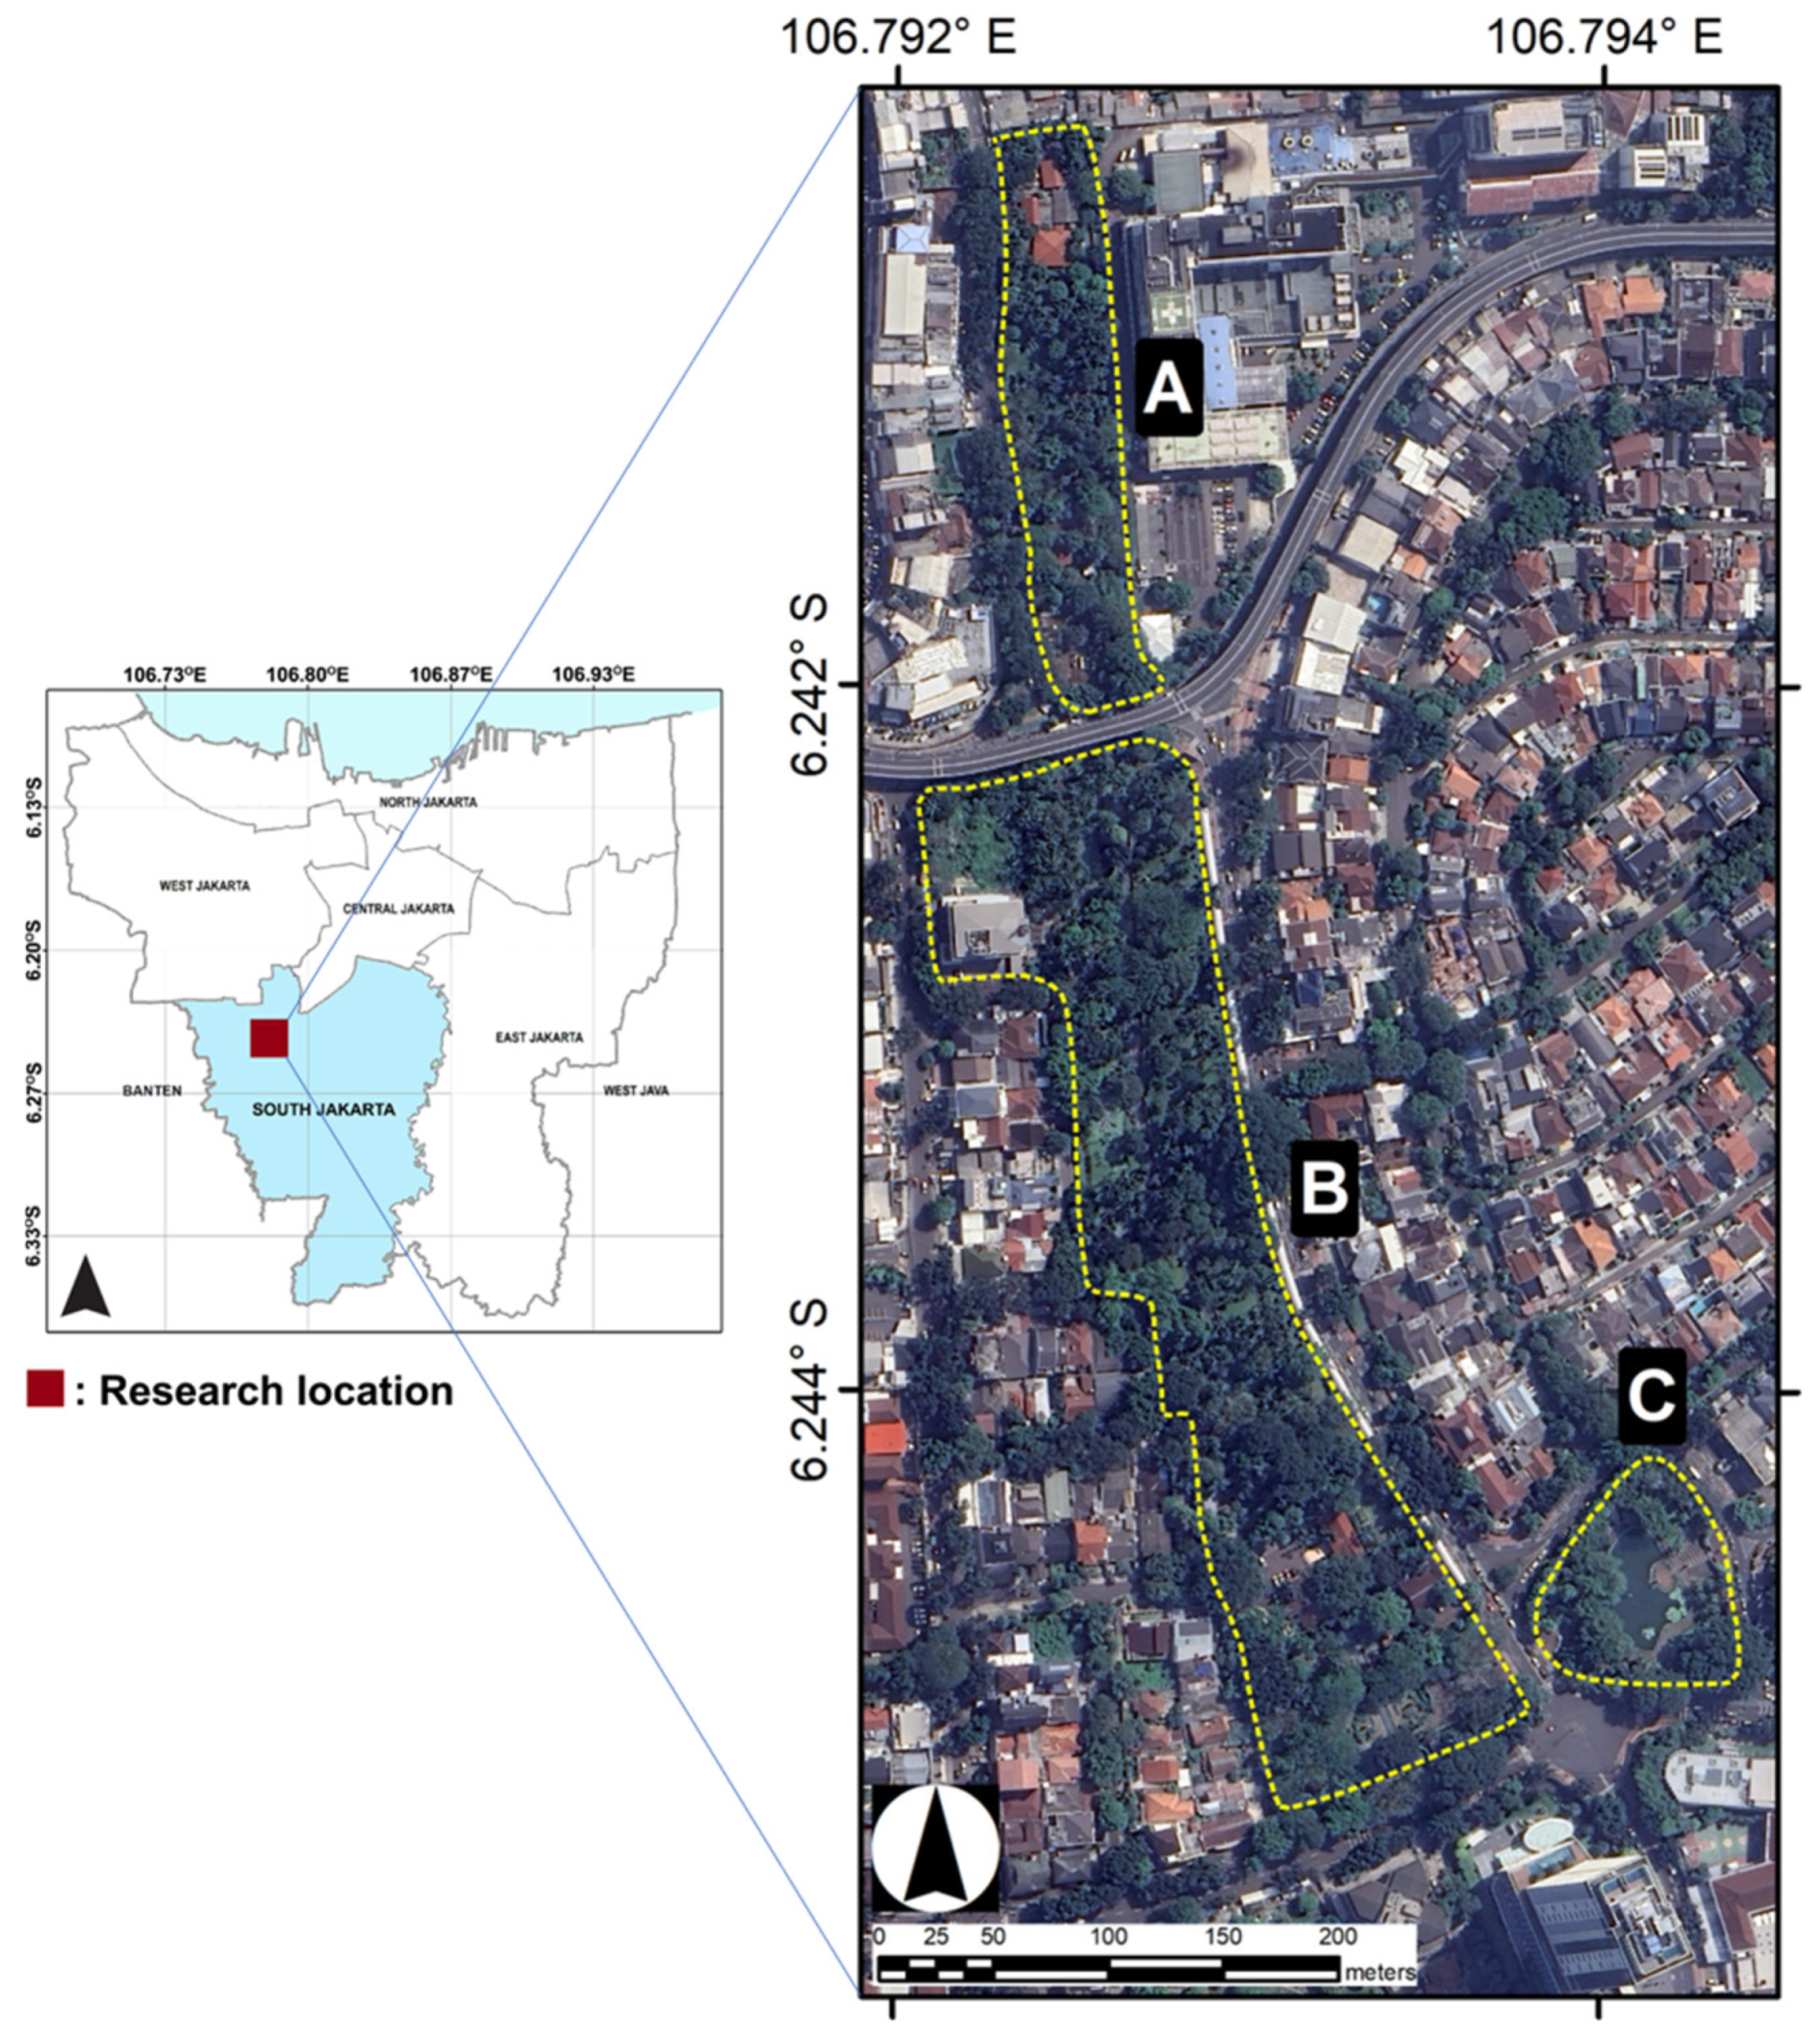
The research was conducted from August 2025 to September 2025 in the GOS of Langsat, Leuser and Ayodya Parks, all of which are now Bendera Pusaka Park, Jakarta (Figure 1). These parks were selected due to their designation as part of the GOS of the Special Capital Region Government (DKI), with an altitude of 20 m above sea level (asl) and an area of: The total area of Langsat Park is 3.95 hectares (ha), Leuser Park is 1.25 ha, and Ayodya Park is 0.70 ha.
The study sites, Ayodya and Langsat Parks, are administratively located in Keramat Pela Village, Kebayoran Baru District, South Jakarta, while Leuser Park is situated in Gunung Village within the same district. These three parks have been officially consolidated by the Jakarta Provincial Government into a single management unit known as the Bendera Pusaka Park. The topography is characterized by its flatness, slopes ranging from 0 to 3%.
The soil at the research site is categorized as an Alluvial-Red Yellow Podzolic-Red Brown Podzolic association [20,21]. This soil type classification is identical to the WRB-FAO soil type classification. The parent material consists of acid tuff, sandstone, and sand deposits. The soil solum is characterized by a substantial thickness, exhibiting a red to yellow hue and a consistent, variable texture. Red-Yellow Alluvial soils generally have high fertility and varied textures, whereas Red-Brown podzolic soils tend to be more acidic with a distinct leaching layer. Both are influenced by climate, vegetation, and parent material, which affect their morphology and chemical composition [22].
According to the Schmidt & Ferguson classification, this area’s climate is classified as type A, with a recorded precipitation total of 2676.7 mm in 2024, equivalent to a monthly mean of 290 mm, and an average of 22 rainy days. The mean monthly minimum air temperature ranged from 23 °C to 33 °C across the study period, while the mean air humidity is 76% [23]. The research was conducted between August 2025 and September 2025.

2.2. Tree Inventory and Measurement

A complete census was conducted to record all trees within the study area. Initial plantings consisted of seedlings 60–100 cm in height and palms approximately 150 cm tall. Vegetation was classified into seedlings, saplings, and trees following the criteria [24,25,26], consisting of: (1) trees, woody plants with diameter of breast-height (DBH) ≥ 10 cm measured at 1.3 m above-ground, (2) saplings, woody plants ≥ 1.5 m height with DBH 2 - < 10 cm, and (3) seedlings, woody plants < 1.5 m height. For trees with buttresses, the diameter was measured 20 cm above the buttress using a diameter tape (phi band). DBH for all other individuals was measured at 1.3 m above-ground level. Total tree height was measured using a Haga meter.
To ensure accuracy in the densely vegetated and structurally complex urban park setting, where overlapping canopies and proximity to park infrastructure could potentially obscure the tree top, multiple measurement positions were taken for each tree until three consistent readings were obtained. The final height was recorded as the average of these consistent measurements. Measured heights were subsequently categorized into three vertical strata: <5 m, 5–10 m, and >10 m for structural analysis. Species identification was conducted in the field using regional floristic guides and verified using botanical reference databases when necessary. Nomenclature followed the World Flora Online [27].

2.3. Biodiversity Estimation

Vegetation diversity was evaluated using commonly applied ecological diversity indices to assess species composition and community structure. Species density and relative density (RD) were calculated per-species and per-site using the following formula [26]:
Density   =   N u m b e r   o f   i n d i v i d u a l s   o f   s p e c i e s   i T o t a l   a r e a   s a m p l e d
RD = n i N × 100
where RD is relative density, ni is the number of individuals of species i and N is the total individuals of all species.
Basal area (BA) and relative dominance (RDom) were calculated using the following formula:
BA   =   1 4 π D 2
RDom = B A i B A × 100
where BA is basal area of a tree species, D is DBH or diameter of breast height (cm), RDom is the relative dominance, BAi is basal area of species i, and ΣBA is the total basal area of all species.
Furthermore, to calculate the importance value index (IVI), we need to include the sum of three components [28]: IVI = relative density (RD) + relative frequency (RF) + relative dominance (RDom). However, because this study employed a complete census rather than plot-based sampling, conventional frequency—defined as the proportion of sampling units containing a species—could not be calculated. Therefore, following standard practice for single-plot or complete census designs (cf. Curtis & McIntosh (1951) [28], who note that frequency requires discrete sampling units), calculated a modified IVI was calculated using only relative density and relative dominance: IVI = RD + RDom. This approach follows an established precedent for single-plot vegetation studies where frequency cannot be meaningfully defined. This modified index ranges from 0 to 200. Readers should exercise caution when comparing these values with studies reporting the full three-component IVI (0–300 scale).
Next, three biodiversity indices were calculated. Species richness that were calculated using the Margalef index [29,30], as follows:
R   =   S 1 l n l n   N  
Here, S represents the total number of species and N represents the total number of individuals recorded. Then, the species diversity was estimated using the Shannon–Wiener diversity index [31] expressed as follows:
H   =   i = 1 S           p i   l n   l n   p i  
where  p i   n i N , ni = number of individuals of species i, and N is the total number of individuals. The last, species evenness was calculated using Pielou’s evenness index [32] as follows:
E   =   H l n l n   ( S )  
where H′ is the Shannon diversity index and S is the total number of species.
All these indices were calculated separately for each park to allow comparison of biodiversity patterns among Langsat, Leuser, and Ayodya Parks.

2.4. Biomass, Carbon Stock, and CO2 Equivalents

Above-ground biomass (AGB) was estimated using plant functional group-specific allometric equations based on diameter and height measurements for trees, palms, and bamboo. For tree species, species-specific wood density values were incorporated whenever available. The AGB was estimated using the following equations:
  • Trees with DBH < 10 cm [33]:
AGB = 1 4 π D 2 × H × f × ρ
2.
Trees with DBH ≥ 10 cm [34]:
AGB = 0.0673 ρ D B H 2 H 0.976
3.
Palms [35]:
AGB = ρ D B H 2 H
4.
Bamboo [36]:
AGB = 0.22095 D 2.05661
where D is the diameter at 10 cm above the root collar (cm), DBH is the diameter at breast height (cm), H is total height (m), f is the form factor = 0.6, and ρ is wood density (g cm−3). Species-specific wood density values were obtained from the World Agroforestry Centre [37], and supplemented with regional datasets where necessary [38,39]. When species-specific density values were unavailable, genus level or family-level averages were used.
Biomass values were calculated for each individual tree and then summed to estimate total biomass for each park. Above-ground carbon stock was estimated by converting biomass values into carbon content using a standard carbon fraction coefficient. Carbon stock was estimated by multiplying AGB by growth form-specific carbon fractions. A value of 0.47 was applied for woody trees, 0.44 for palms, and 0.50 for bamboo based on published empirical studies. The calculation was based on the following formula [40,41,42,43]:
Carbon stock   ( for woody trees )   =   A G B   ×   0.47
Carbon stock   ( for palms )   = A G B × 0.44
Carbon stock   ( for bamboo )   = A G B × 0.5
To estimate the equivalent amount of carbon dioxide (CO2) sequestered, carbon values were converted into CO2 using the molecular weight ratio between carbon dioxide and carbon:
CO 2 - equivalent of stored carbon   =   C a r b o n   s t o c k   ×   44 12
Total carbon stock and CO2 sequestration values were calculated for each park and standardized per hectare to allow comparison among sites.

2.5. Data Analysis

Data on vegetation structure, diversity indices, biomass estimates, and carbon stocks were compiled in Microsoft Excel 2019 for preliminary processing; and descriptive statistical analyses, meanwhile pairwise tests Games-Howell Bars between number of species and diameter distribution were performed using IBM United States ® SPSS® Statistics 26. Descriptive statistics were used to summarize species richness, diversity indices, the five dominant species, stand structure by diameter and height classes, and biomass distribution in each park. Carbon stocks are reported in mega grams of carbon per hectare (Mg C ha−1) to facilitate cross-study comparisons.

3. Results

3.1. Vegetation Composition

A total of 2459 individual trees were recorded within the Bendera Pusaka GOS system, representing 79 species across several botanical families. Langsat Park contained the largest number of individuals and displayed the most structurally complex vegetation community. The park supported a mixture of mature canopy trees, mid-sized ornamental species, and younger individuals occupying lower canopy layers. In contrast, Leuser Park exhibited a more balanced distribution of individuals across species, resulting in a relatively even vegetation structure. Ayodya Park showed a simpler vegetation composition, with fewer species and a more open spatial arrangement associated with recreational landscape design. The distribution of species and individuals across the three parks is summarized in Table 1, which highlights differences in species composition and stand density among the study sites.
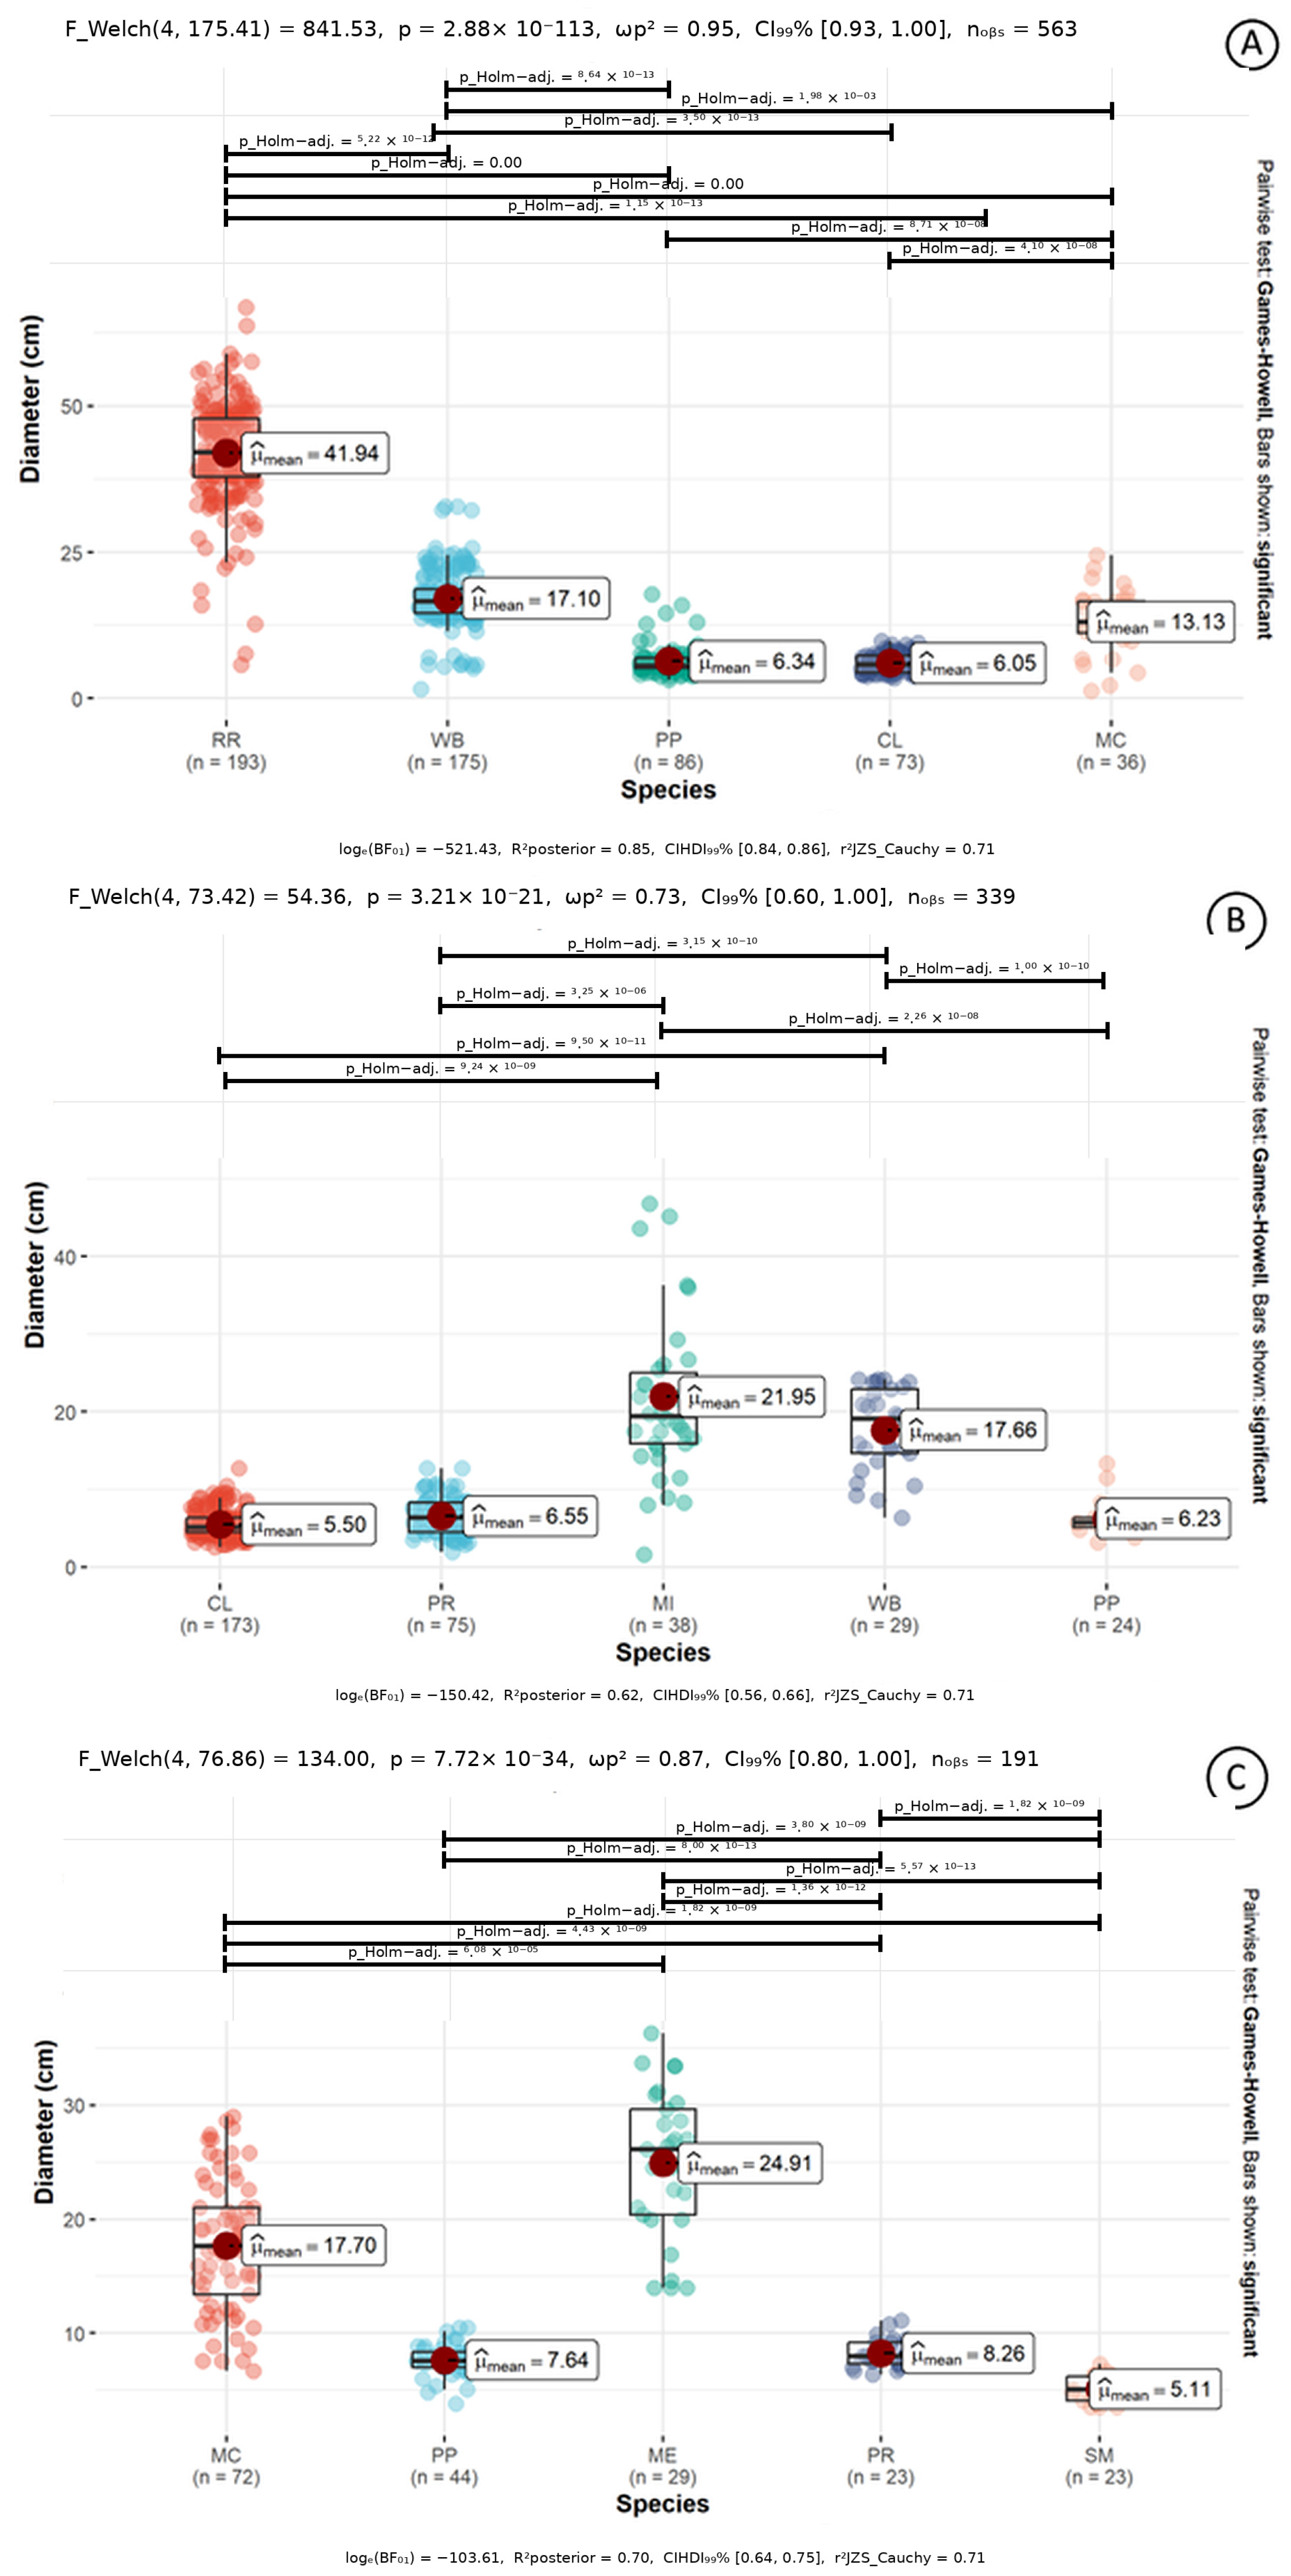
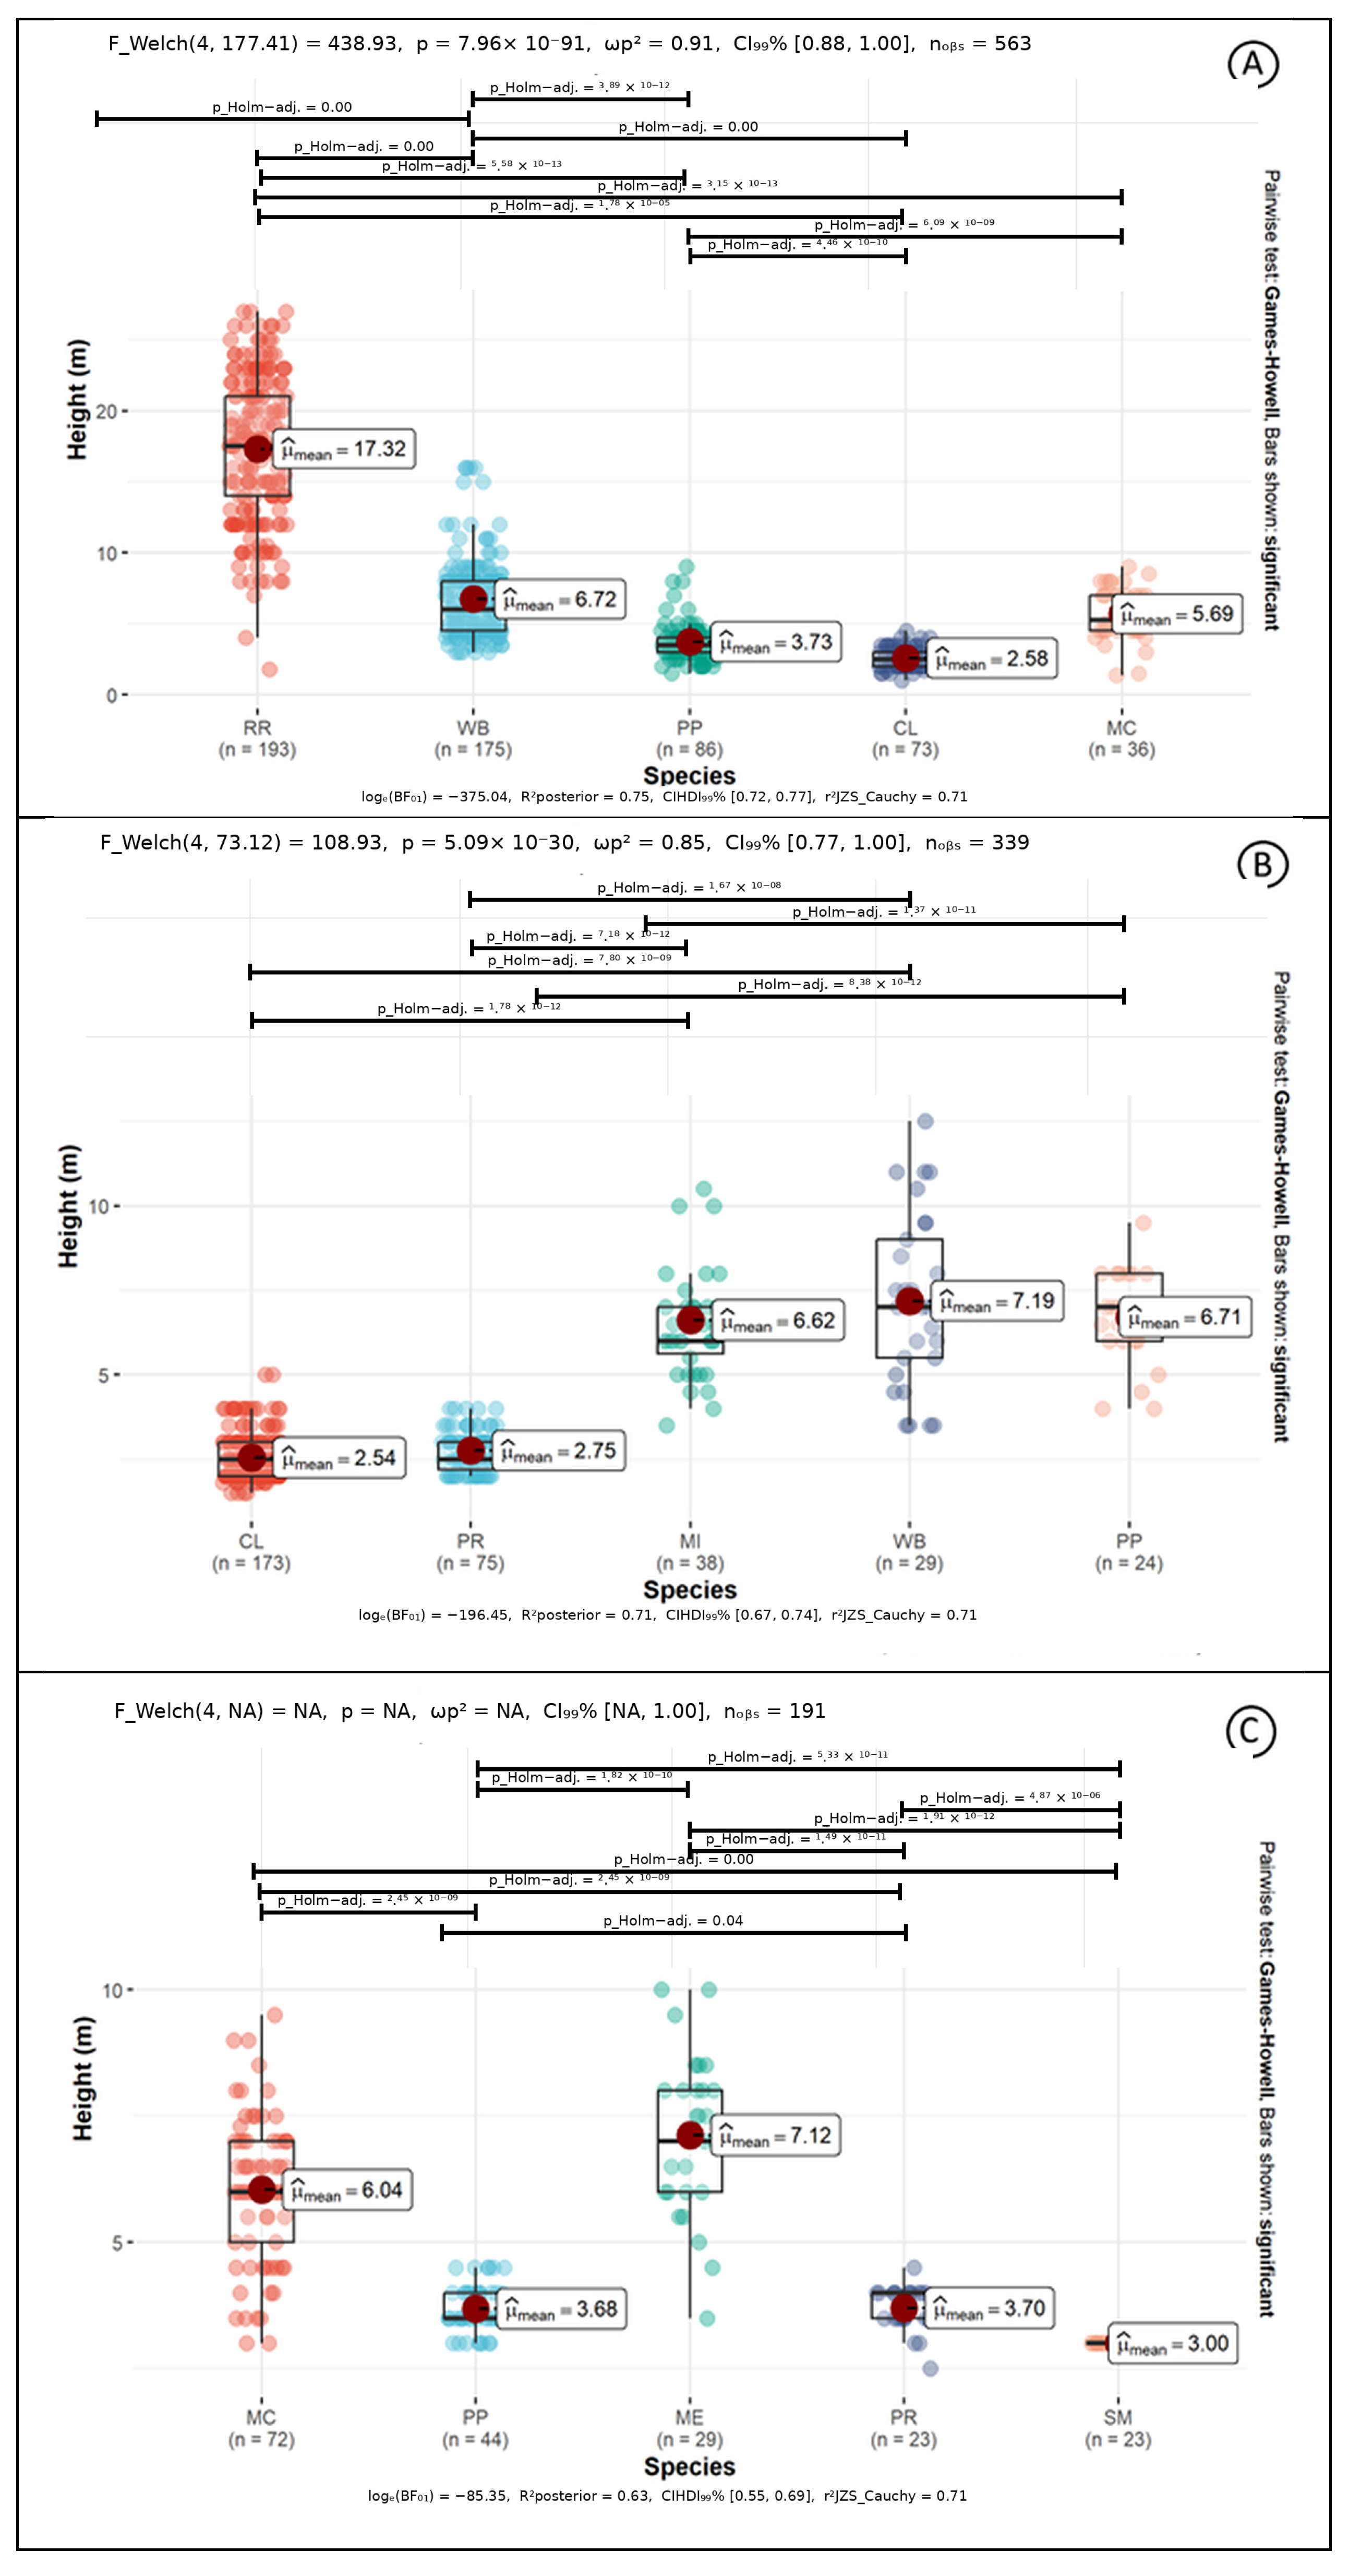
In Langsat Park, the stand was clearly dominated by the royal palm, R. regia, with 193 individuals and substantial structural dimensions (mean DBH 41.94 cm; mean height 17.32 m), indicating its major contribution to canopy architecture and biomass. Other dominant palms include W. bifurcata (93 individuals; mean DBH 16.42 cm; mean height 6.58 m), P. propinquum (86), and C. lutescens (71). The ornamental shrub-tree M. citrina was also relatively abundant (36 individuals), but large-canopy native hardwood species were comparatively limited.
In Leuser Park, vegetation composition was even more concentrated, with C. lutescens dominating overwhelmingly (173 individuals), followed by P. roebelenii (75). Fruit-bearing trees such as M. indica (38 individuals) were present but less structurally dominant, alongside smaller populations of W. bifurcata (29) and P. propinquum (24). In Ayodya Park, dominance shifts slightly toward M. citrina (72 individuals), followed by P. propinquum (43). Other common species include M. elengi (29), S. myrtifolium (23), and P. roebelenii (23).
The IVI revealed clear differences in dominance patterns among the three urban parks (Table 2). In Langsat Park, W. bifurcata exhibited the highest IVI (42.65), followed by P. indicus (31.65), indicating that both ornamental palms and large canopy trees contribute substantially to stand structure.
In contrast, Leuser Park showed strong dominance by R. regia (IVI = 71.96), reflecting its disproportionately large biomass and structural prominence within the park. This pattern suggests a simplified canopy composition driven by a single dominant species. Ayodya Park exhibited a more moderate dominance hierarchy, with S. rotundifolius (IVI = 34.84) and C. nucifera (IVI = 25.96) representing the most structurally important species. Overall, the dominance of several palm species across all sites highlights the influence of ornamental planting practices in shaping the structural composition of these tropical urban forests.

3.2. Species Diversity

Vegetation diversity indices revealed distinct differences among the three parks (Table 3). Langsat Park exhibited the highest species richness (S = 79).
Despite having slightly lower species richness, Leuser Park showed the highest diversity and evenness values, with a Shannon–Wiener diversity index of H′ = 3.38 and an evenness value of E = 0.77. Although it has fewer individuals and species than Langsat National Park, Leuser National Park exhibits higher diversity and evenness, with a Shannon–Wiener diversity index of H′ = 3.44 and an evenness index of E = 0.79.
These values suggest a relatively balanced distribution of individuals among species, with no single species dominating the vegetation community. In contrast, Ayodya Park recorded the lowest diversity and evenness values among the three sites. The vegetation community in this park is characterized by a smaller number of dominant ornamental species planted in relatively high abundance.

3.3. Stand Structure and Size-Class Distribution

The height-class distribution across the three urban parks reveals vegetation structures that are generally dominated by small to medium-sized trees, suggesting relatively young stands or intensively managed landscapes rather than mature forest systems. The diameters of the five dominant plant species at the research location are presented in Figure 2.
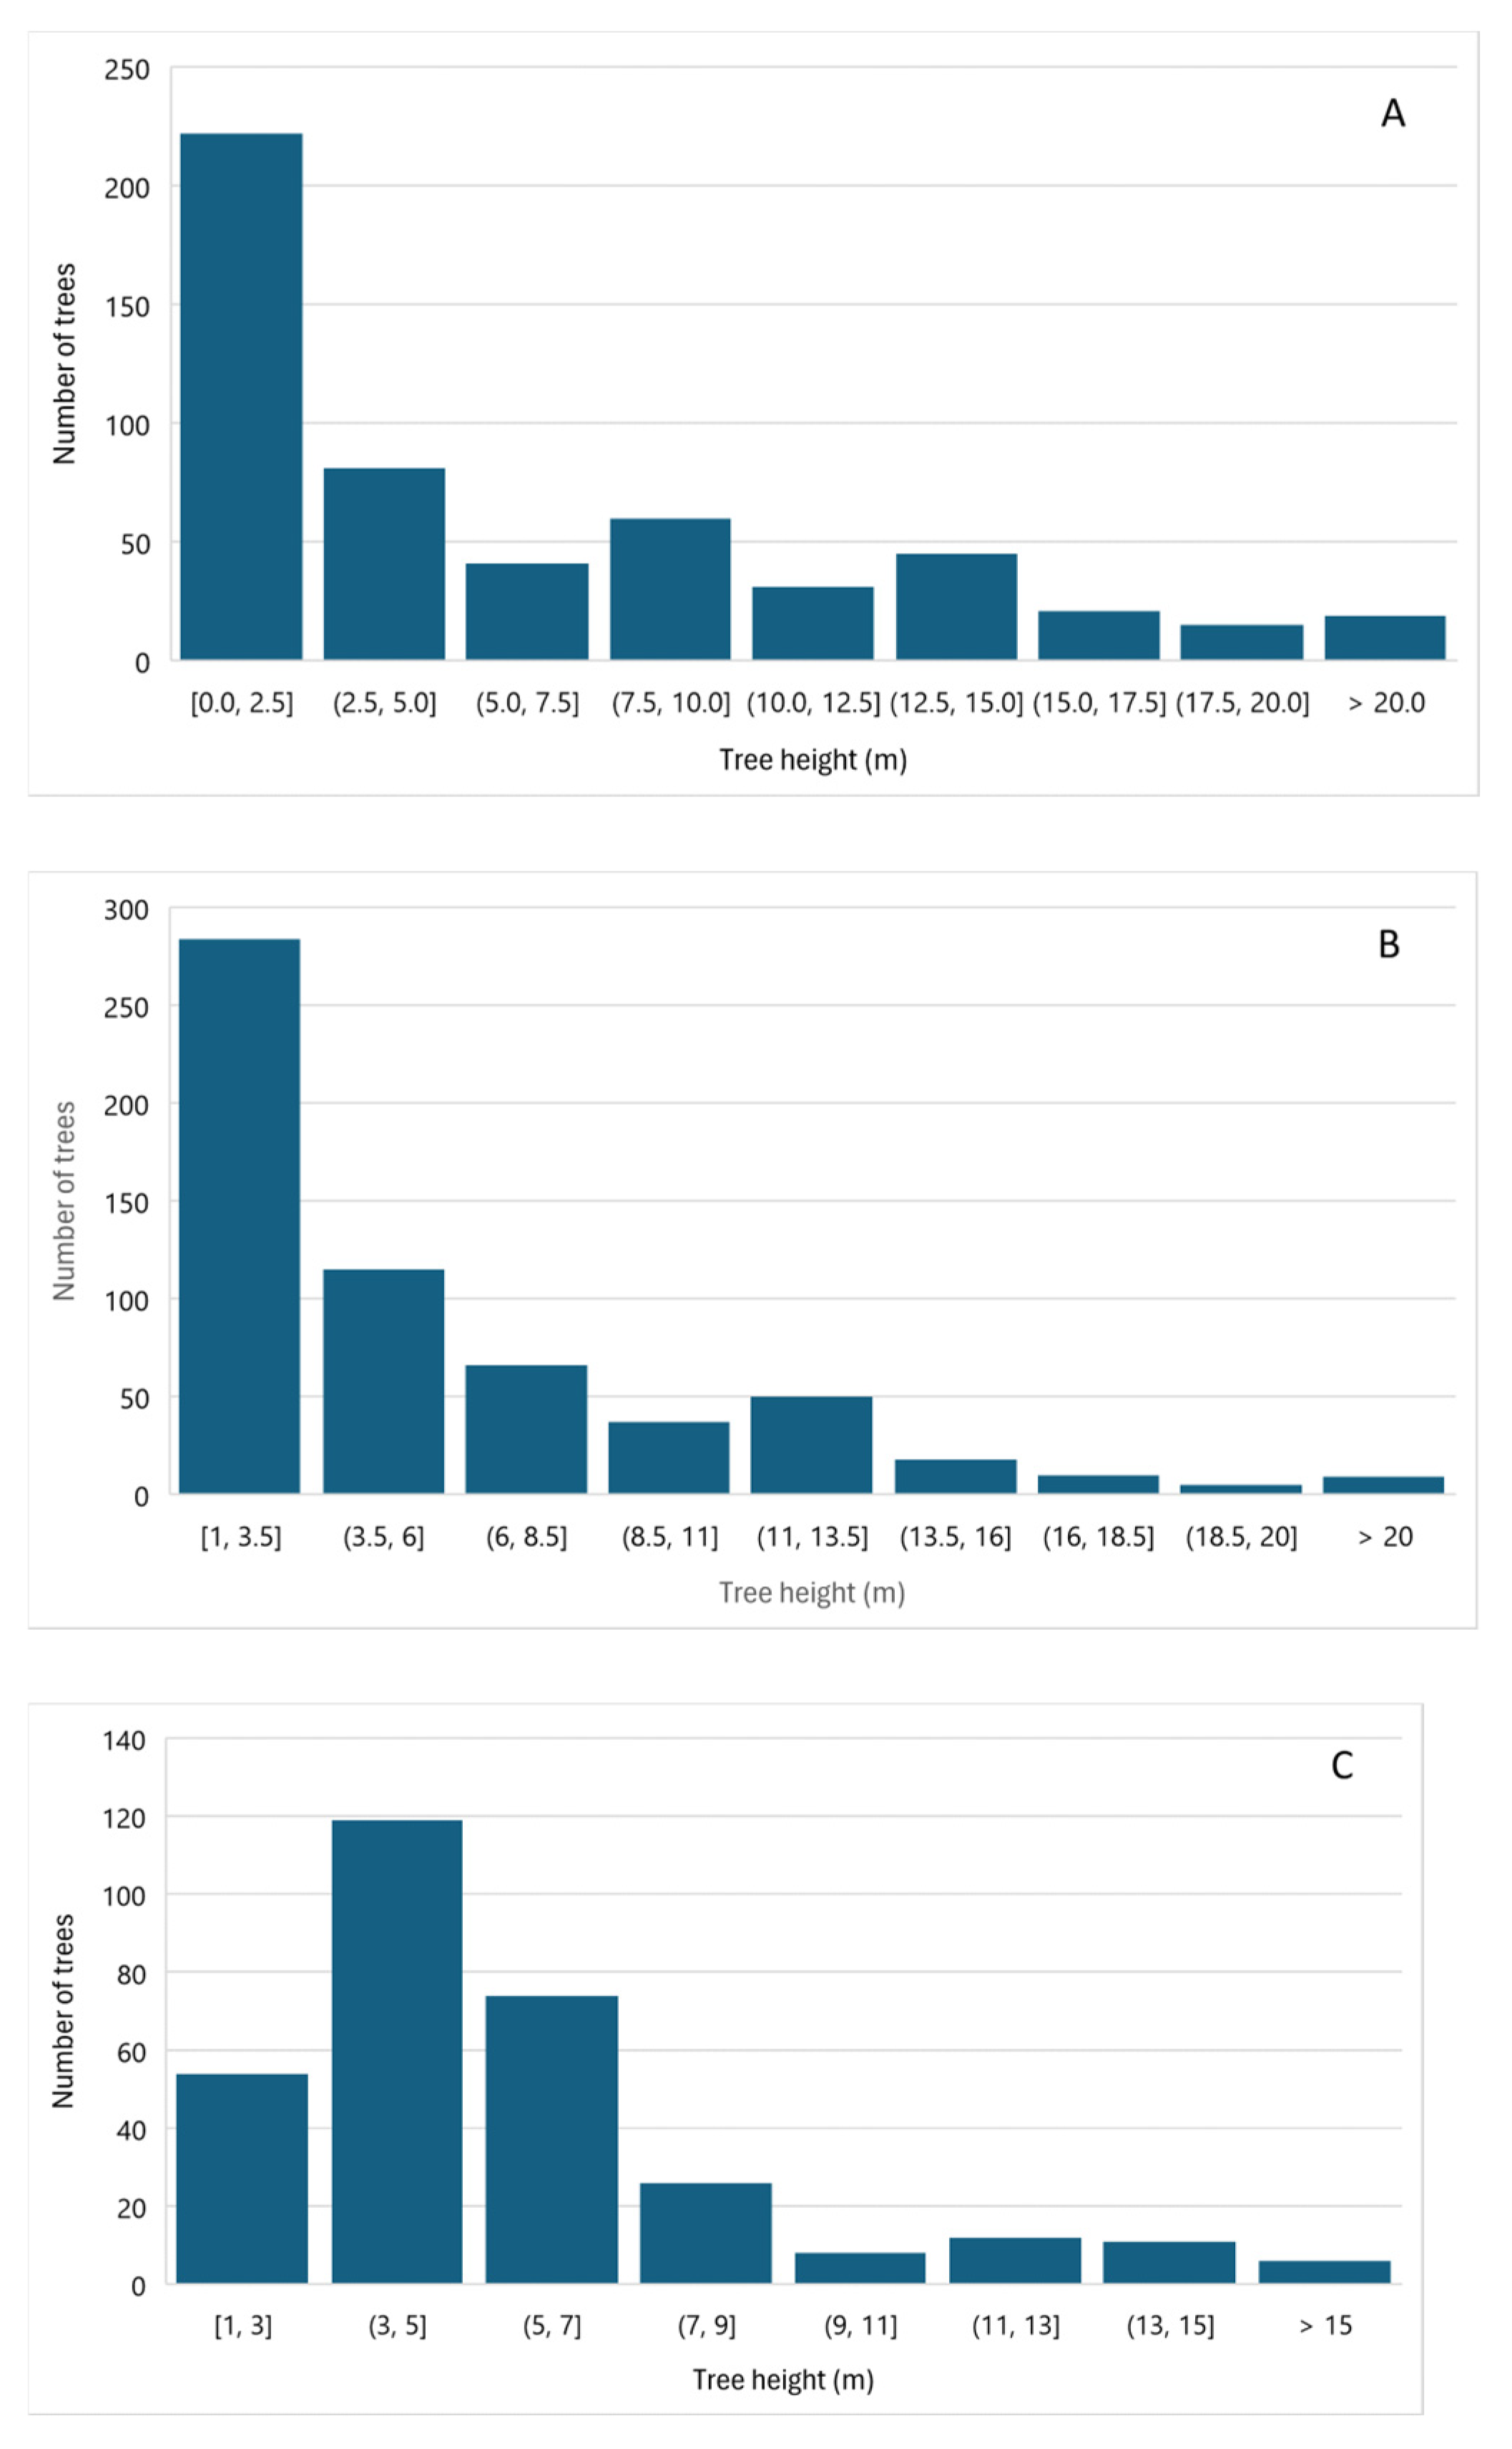
The dominance of large diameters by a limited number of species, particularly ornamental palms, indicates design-driven structural simplification in urban stands. In Langsat Park, tree distribution was relatively balanced across height classes, with 399 individuals under 5 m, 313 trees between 5–10 m, and 382 trees exceeding 10 m in height. In contrast, Leuser Park was strongly dominated by small trees, with 487 individuals under 5 m, while only 79 trees fell within the 5–10 m class and just 27 individuals exceeded 10 m. Similarly, Ayodya Park showed a predominance of smaller trees, with 163 individuals under 5 m, 114 trees between 5–10 m, and only 32 trees taller than 10 m. The average height of the five dominant tree species at the research location is presented in Figure 3.
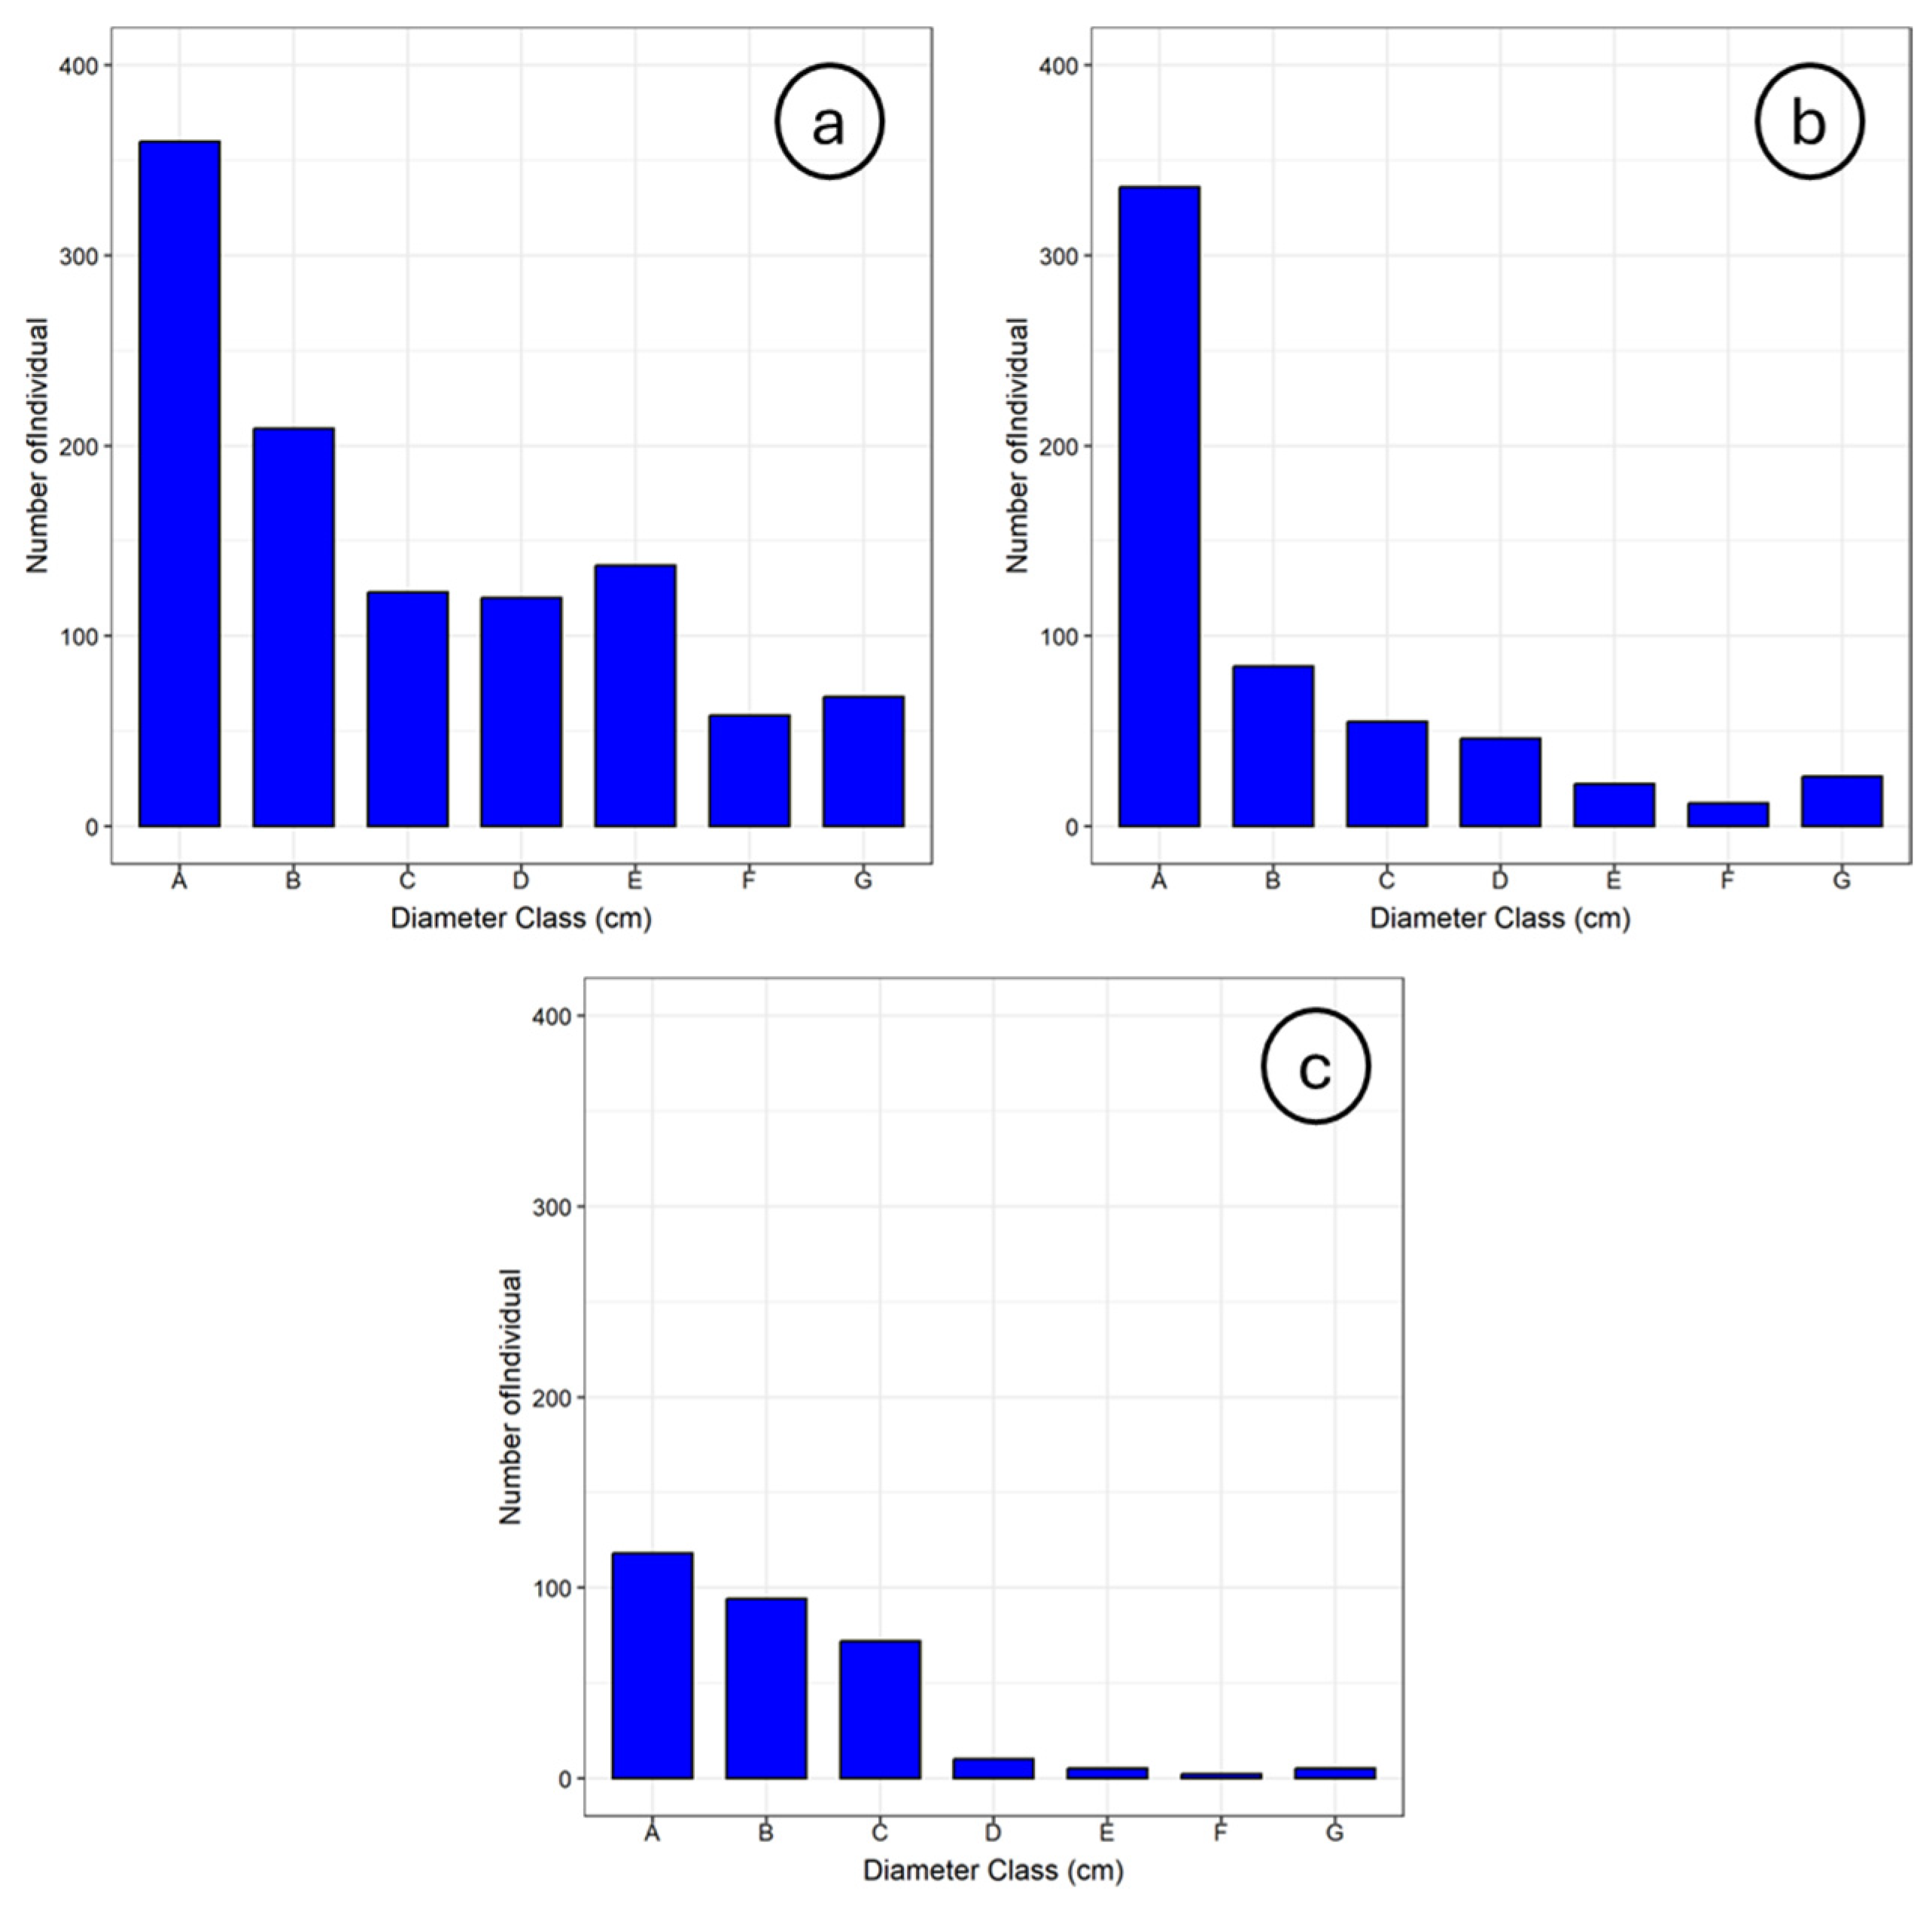
Across all parks, the limited representation of large-diameter trees further confirms that these stands were shaped primarily by landscaping and maintenance regimes. Species dominating the larger height and diameter classes include the royal palm, R. regia, the foxtail palm, W. bifurcata, and the native tree M. elengi. The distribution of tree height classes at the research location is presented in Figure 4 and the distribution of diameter classes for seedlings and trees at the research site is presented in Figure 5.

3.4. Carbon Stock and CO2-Equivalent of Stored Carbon

The overall AGB reached 5873.63 Mg, corresponding to a total carbon stock of 2623.36 Mg C and an estimated CO2 absorption capacity of 9627.53 Mg CO2. On a per-hectare basis, this represents an average biomass of 995.53 Mg ha−1, carbon content of 444.64 Mg C ha−1, and CO2 sequestration potential of 1631.78 Mg CO2 ha−1. These values highlight the significant contribution of urban forests to climate mitigation at the city scale.
At the site level, Langsat Park demonstrated the largest contribution to carbon storage, with a total carbon stock of 2006.00 Mg C and CO2 absorption reaching 7361.83 Mg. In comparison, Leuser Park stored 318.39 Mg C (1168.50 Mg CO2), while Ayodya Park contained 298.97 Mg C (1097.20 Mg CO2). The substantially higher carbon stock in Langsat Park was attributable to its larger area and greater abundance of large-diameter individuals.
At the species level, R. regia contributed the highest carbon stock in both Langsat and Leuser Parks, reflecting its dominance and relatively large structural dimensions. In Ayodya Park, the native palm S. rotundifolius showed the highest carbon contribution among dominant species. Overall, palm species collectively accounted for a substantial proportion of total biomass and carbon stock due to their high abundance and consistent presence across all sites. The results of the calculation of the carbon potential of the five highest tree species at the research location are presented in Table 4. Meanwhile, distribution of tree species (stems), biomass, carbon content and CO2-equivalent of stored carbon at the research location is presented in Table 5.

4. Discussion

Langsat and Leuser Park function as urban biodiversity reservoirs with high richness and diversity, while Ayodya Park exhibits lower diversity due to its smaller area and intensive horticultural management; the composition in all three parks is dominated by ornamental species—particularly palms—which form the canopy structure and account for the majority of biomass, but the representation of large native canopy trees is relatively low, thereby limiting vertical complexity and long-term carbon sequestration; although the presence of many young individuals enhances short-term carbon sequestration, sustainable climate mitigation requires the protection of mature trees, diversification toward long-lived native canopy species, and landscape designs that enhance habitat connectivity, while this study is limited to above-ground biomass and a single point in time. Hence, recommendations need to be supported by long-term monitoring and soil carbon measurements.
In this study, descriptive statistical analysis was used to compare species richness, diversity indices, the five dominant species, stand structure based on diameter and height classes, and biomass distribution. Based on the descriptive statistical analysis, it was found that the relationship between vegetation diversity indicators and carbon storage potential indicates that carbon stocks tend to increase as the complexity of the vegetation community increases. However, the strength of this relationship is strongly influenced by stand structure, particularly the presence of large individuals and dominant species with high biomass.

4.1. Species Composition and Urban Ecology

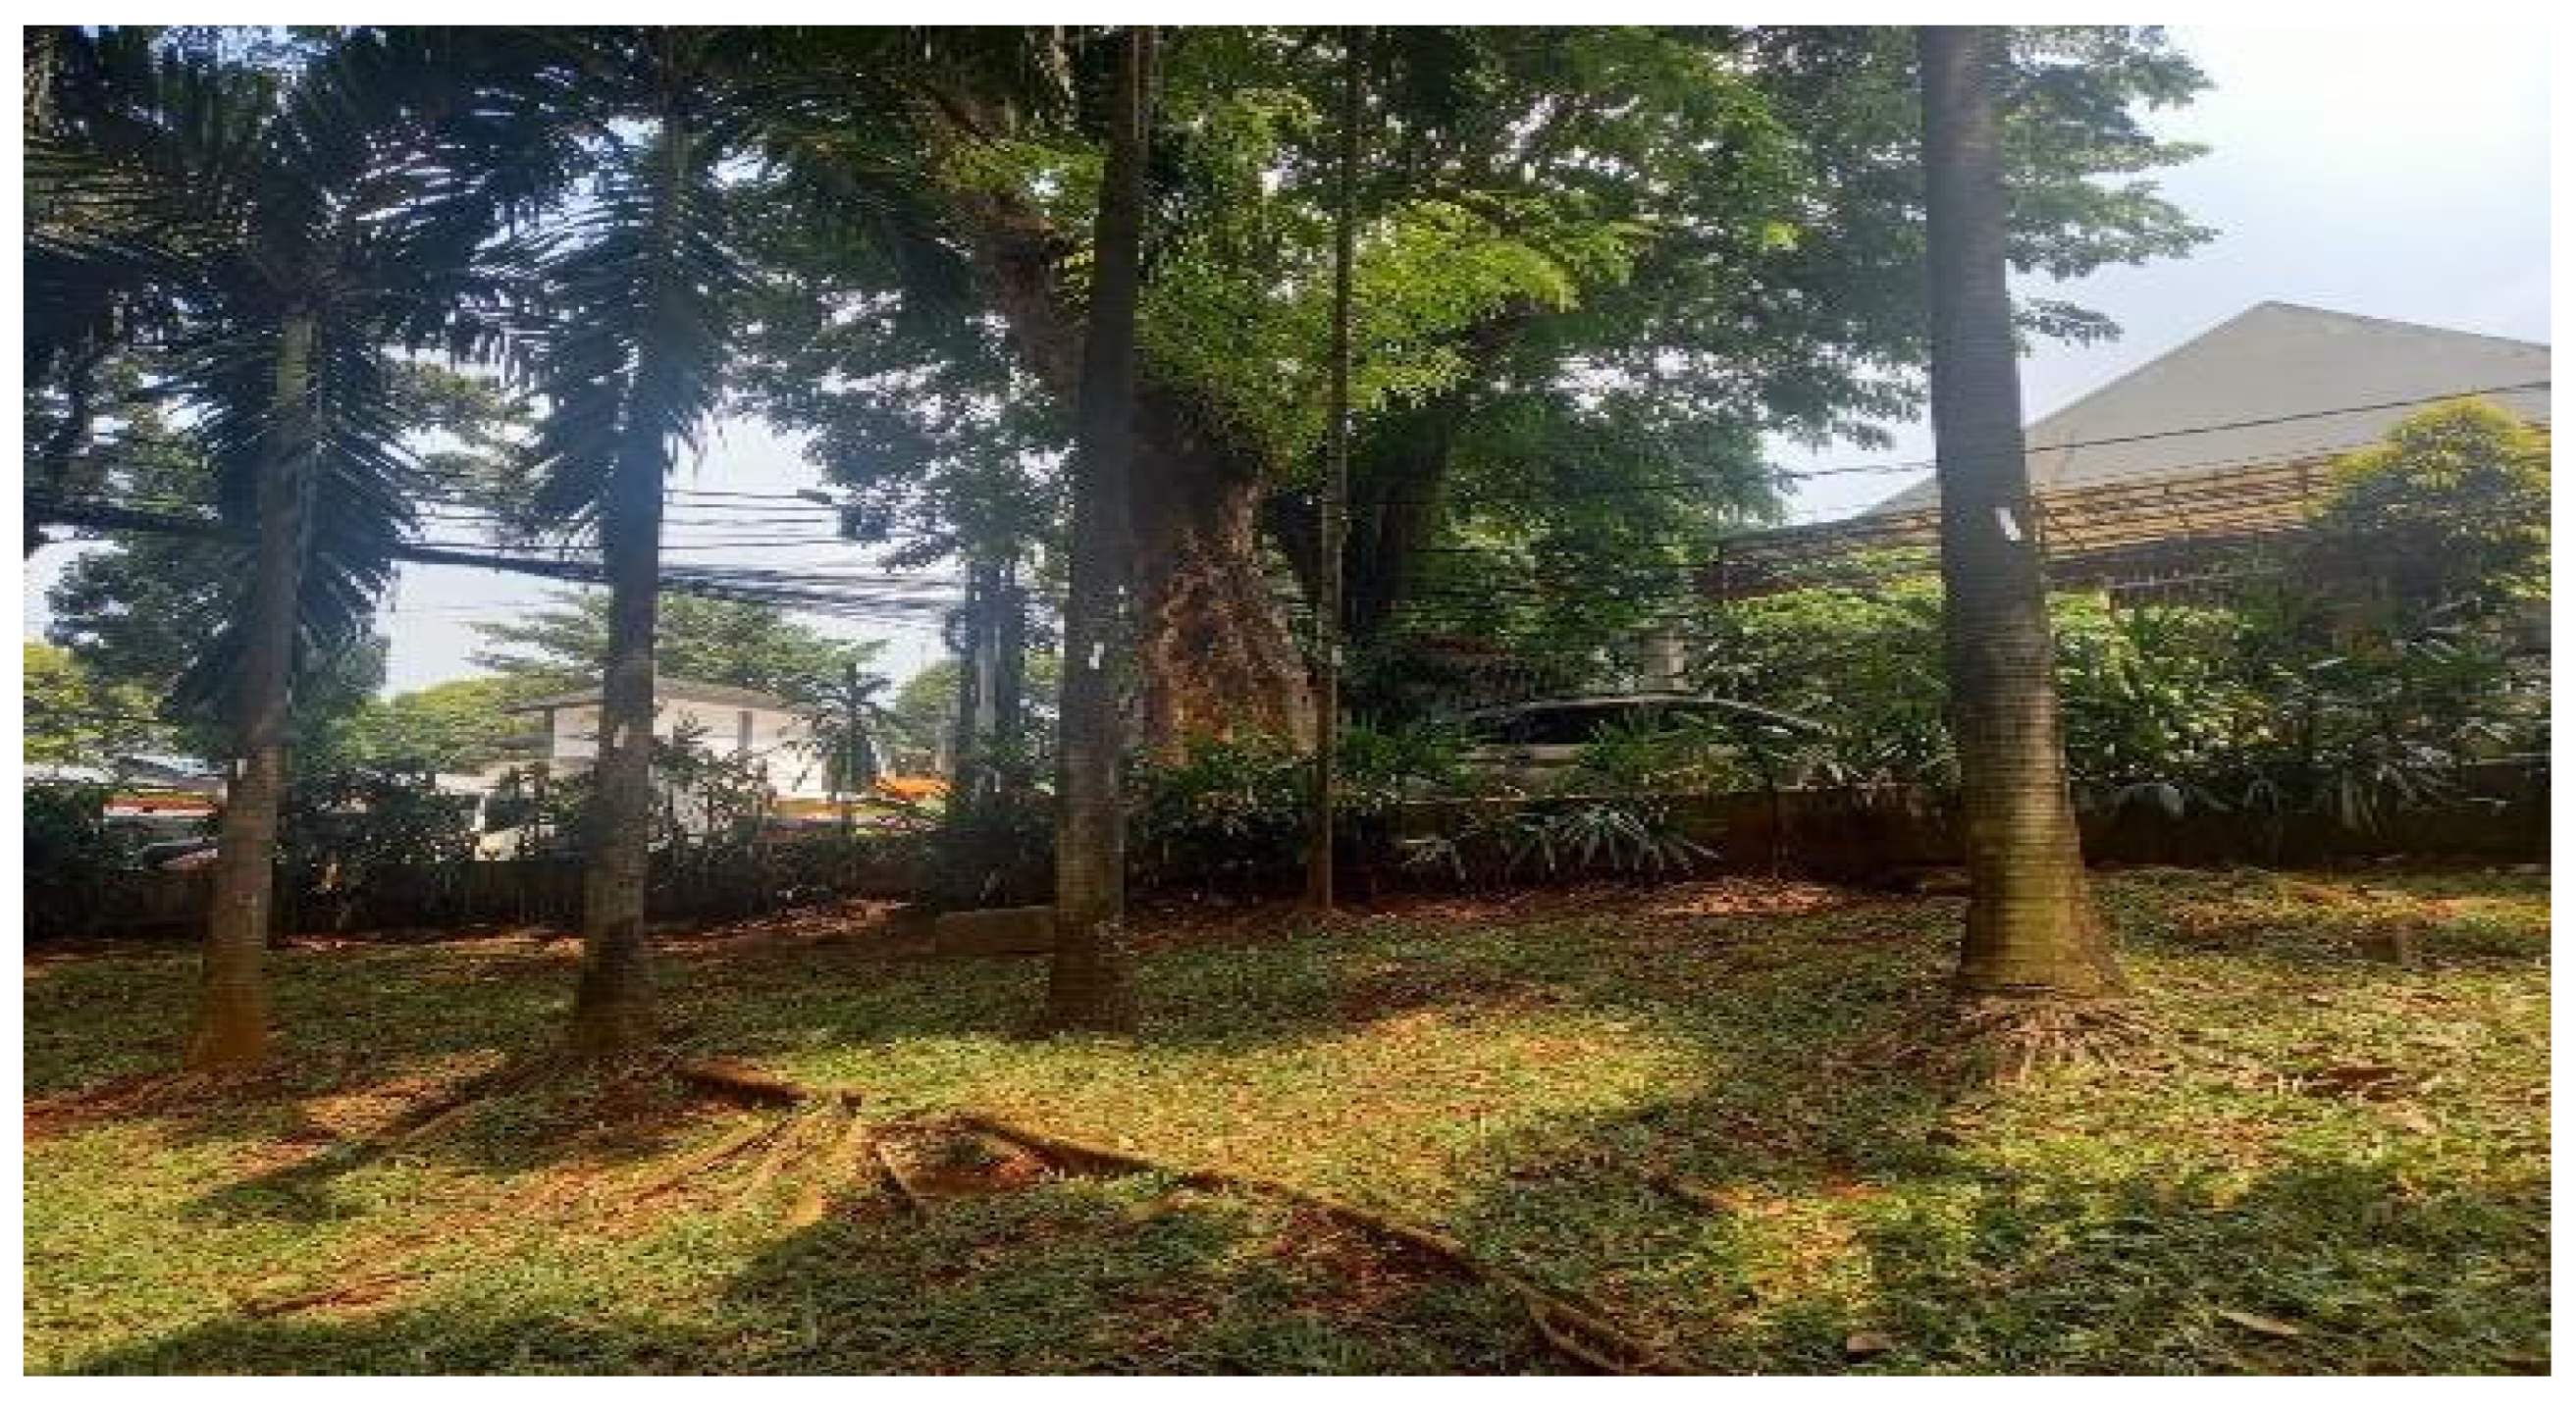
The relatively high species richness in Langsat Park reflects the role of large urban parks as biodiversity reservoirs in metropolitan landscapes [44,45]. However, compositional evenness was low due to strong dominance by ornamental palms such as R. regia, W. bifurcata, C. lutescens, and P. roebelenii. Langsat Park field condition is presented in Figure 6.
Despite the reduction in biomass estimates, palms remained an important carbon pool because of their high abundance throughout the study area. Nevertheless, large native broad-leaved trees contributed proportionally more biomass per individual than ornamental palms, reinforcing the ecological importance of maintaining structurally diverse urban forests.
Palms dominated both in terms of abundance and vertical structure, while large-canopy native tree species, which are typically associated with higher long-term carbon storage capacity and habitat complexity, were relatively underrepresented. This pattern suggests that urban design priorities have tended to emphasize aesthetic appeal and visual uniformity over structural diversity and ecological functionality.
Similar compositional skewness has been reported in tropical urban forests where aesthetic and maintenance considerations drive species selection [46,47]. Although ornamental palms perform well under urban stress (heat tolerance, limited lateral root systems), reduced representation of native broad-leaved species may constrain canopy complexity, vertical stratification, and habitat heterogeneity [48,49].
The structural dominance of several species is further reflected in their IVI, which integrates relative density and dominance to identify the most influential taxa within the urban forest community. Across the three parks, ornamental palms such as R. regia and W. bifurcata exhibited high IVI values, indicating their disproportionate contribution to stand structure. In Langsat Park, W. bifurcata and P. indicus played major structural roles, whereas R. regia strongly dominated Leuser Park. In Ayodya Park, dominance was distributed among several taxa, including S. rotundifolius and C. nucifera. These patterns indicate that species with high IVI values largely determine canopy architecture and biomass distribution in the park system, highlighting the influence of ornamental planting strategies on urban forest structure.
The integration of native and exotic species reflects an ex situ conservation strategy in urban landscapes. Urban green spaces can function as complementary biodiversity conservation areas [44,45]. Species such as M. elengi and P. indicus provide additional habitat and food resources, enhancing ecological value [50,51]. Increasing the structural prominence of native, large-canopy species would enhance resilience to climatic stressors such as heatwaves and altered rainfall regimes [52,53].

4.2. Biodiversity Indices Across Urban Forest Blocks

The comparative analysis of three urban forest blocks, Langsat Park, Leuser Park, and Ayodya Park, revealed distinct patterns in species richness, diversity, and community evenness that reflect differences in ecological structure, management history, and potentially landscape context. Table 2 presents a quantitative synthesis of these biodiversity attributes, offering insights into the ecological stability and complexity of each urban forest fragment.

4.2.1. Species Richness and Abundance Patterns

The most striking observation is the substantial difference in species richness between Langsat Park (S = 79) and Leuser Park (S = 78) compared to Ayodya Park (S = 33). This disparity became even more pronounced when considered alongside total individuals (N): Langsat supported 79 species across 1549 individuals, Leuser supported 78 species across 600 individuals, while Ayodya supported only 33 species across 310 individuals.
Despite having similar species richness, Langsat and Leuser differ in species-to-individual ratios, with Leuser showing a higher species packing (approximately one species per 7.6 individuals) compared to Langsat (one per 13.8 individuals). This suggests a greater coexistence of species within a smaller population size in Leuser, potentially indicating greater floristic diversity and structural complexity within the forest stand [54].
In contrast, Ayodya Park exhibits lower species richness and a less heterogeneous composition, likely influenced by its smaller area, more intensive management, and stronger emphasis on ornamental planting. Although the three parks are spatially adjacent, their vegetation compositions differ markedly due to landscape design strategies. Plant assemblages across the parks include fruit- and seed-producing species that support fauna, shade trees that contribute to carbon storage and microclimate regulation, and ornamental species that enhance aesthetic value. Notably, the proportion of exotic species varies considerably, reaching approximately 48% in Langsat Park but only around 7% in Leuser Park. In Ayodya Park, the dominance of ornamental plants is particularly evident, with 272 clumps representing only about 20 species, compared to Leuser Park, which contains 333 ornamental clumps across 22 species.
These findings indicate that vegetation diversity in urban parks is strongly shaped by planting design, management intensity, and site characteristics, with more diverse and less intensively managed systems supporting higher species richness and more complex community structures.

4.2.2. Margalef Species Richness Index (R)

The Margalef index, which accounts for sample size effects by incorporating both species count and total individuals, provides a standardized measure of richness. Leuser Park exhibited the highest value (R = 12.07), followed by Langsat Park (R = 10.23), with Ayodya Park was substantially lower (R = 5.57). This gradient, Leuser > Langsat > Ayodya Parks, suggests that Leuser Park maintains the greatest species richness relative to its population size. The Leuser Park value of 12.07 is notably high compared to other urban forest studies.
For comparison, research along the urban-rural gradient in Qingdao, China, found that Margalef indices in urban forests varied significantly with urbanization intensity, with less urbanized areas exhibiting lower values [55]. The negative correlation between urbanization density and Margalef index (r = −0.589) reported in that study suggests that more urbanized sites typically support fewer species relative to individual counts.
The high Margalef values for Langsat and Leuser indicated that both parks function as important biodiversity reservoirs within the urban matrix. This is ecologically significant because urban forests with high species richness contribute disproportionately to ecosystem services including carbon sequestration, air purification, and temperature regulation [56]. The Ayodya value of 5.57, while lower, remains within ranges reported for urban parks in other tropical contexts, such as Metro Cebu, Philippines, where park diversity indices showed considerable variation based on park category and management intensity [57].

4.2.3. Shannon-Wiener Diversity Index (H′)

The Shannon index incorporates both species richness and the evenness of species abundance distributions. Leuser Park again showed the highest value (H′ = 3.44), followed closely by Langsat Park (H′ = 3.38), with Ayodya Park was substantially lower (H′ = 2.38). These values are ecologically meaningful. Shannon values above 3.0 are generally considered indicative of high diversity, while values between 2.0 and 3.0 represent moderate diversity.
The Langsat and Leuser values (3.38–3.44) were comparable to those reported for less disturbed suburban forests in the Pearl River Delta, China, where urban forests showed significantly reduced diversity (H′ = 2.1–2.8) compared to suburban counterparts (H′ = 3.2–3.7) [58]. This comparison suggests that Langsat and Leuser may represent relatively mature, urban forest fragments, while Ayodya’s moderate diversity (2.38) aligns more closely with typical urban park values.
The similarity between Langsat and Leuser despite their different individual counts (1094 vs. 593) is noteworthy. Leuser achieved nearly equivalent diversity with approximately half the population size, indicating more equitable resource partitioning or greater habitat heterogeneity. This pattern mirrors findings from the Pearl River Delta study, where diversity differences between urban and suburban forests were most pronounced in the tree layer, suggesting that canopy structure strongly influences overall diversity patterns [58].

4.2.4. Pielou’s Evenness Index (E)

Evenness measures the equity of abundance distribution among species, with values approaching 1.0 indicating perfectly equitable distributions. Leuser Park showed the highest evenness (E = 0.79), followed closely by Langsat Park (E = 0.77), with Ayodya Park lower (E = 0.68). These values indicate that all three parks maintained relatively equitable species distributions, with no extreme dominance by a single species. Evenness values between 0.6–0.8 are typical of stable where competitive exclusion has not produced strong dominance hierarchies. For comparison, urban parks in Gaziantep showed evenness values ranging from 0.67 to 0.83, with the more balanced park (Festival Park, E = 0.83) demonstrating greater structural stability despite lower species richness [54].
The slightly lower evenness in Ayodya Park (0.68) suggested moderate dominance by certain species. Examination of the raw data indicated that M. citrinus and M. elengi were the most abundant species in Ayodya Park, together comprising a substantial proportion of total individuals. This pattern of moderate dominance by ornamental species is common in urban parks where management practices favour selected taxa for aesthetic or functional reasons [57].
A study on the Pearl River Delta found that urban forests exhibited significantly lower evenness (0.45–0.60) compared to suburban forests (0.70–0.80), with urbanization promoting species homogenization through the selection of drought- and nutrient-poor tolerant 25 species [58]. The relatively high evenness values in Langsat and Leuser Parks (0.77–0.79) suggest these parks have resisted such homogenization pressures, maintaining more natural community structures.
Biodiversity patterns alone remain abstract without linking them to physical structure and functional outcomes. We therefore first examine how species richness and evenness translate into stand structure–height classes, diameter distributions, and canopy layering (Section 4.3). Next, we quantify above-ground carbon stocks and CO2 sequestration, testing whether high diversity automatically delivers high carbon storage (Section 4.4). Only after presenting this complete evidence chain–biodiversity → structure → function–do we offer an integrated synthesis (Section 4.5). This synthesis does not repeat results but builds a causal explanation: why Leuser’s high evenness yields modest carbon, why Langsat’s moderate diversity achieves maximum storage, and what management follows. Such sequential logic ensures that every interpretive claim rests on demonstrated evidence, satisfying both rigor and coherence.

4.3. Stand Structure and Functional Resilience

The height-class distribution observed in this study deviates from the classical reverse-J pattern typically associated with self-regenerating natural forests [59]. Instead, the distribution is skewed toward smaller height classes, reflecting the managed establishment history of urban park vegetation, where tree populations arise primarily from landscaping programs rather than continuous natural recruitment [60]. Similar structural patterns have been reported in urban forest inventories where a large proportion of trees occur in early developmental stages due to periodic planting cycles [61,62].
Although the dominance of short-stature individuals reduces the proportion of large mature trees, it also indicates that a substantial fraction of the population is currently in active growth stages. Young and immature trees generally exhibit high relative growth rates and rapid biomass accumulation, which can contribute significantly to annual carbon uptake [63]. Empirical studies have shown that forest carbon productivity is strongly influenced by the presence of immature trees, which drive net primary production and ecosystem carbon exchange [64,65,66].
In urban forests, recently established tree cohorts often display particularly high carbon sequestration rates because their rapid growth allows them to accumulate biomass quickly during early developmental phases [67,68]. As these individuals mature and transition into larger size classes, they will progressively increase total biomass and long-term carbon storage capacity, ultimately enhancing the role of urban green spaces as climate-mitigation infrastructure [66,67]. The distribution of tree heights across the three parks reveals clear differences in vertical structure and stand development.
Overall structural complexity across all three parks remains moderate, underscoring their managed urban character rather than functioning as fully developed forest ecosystems. These variations in tree height among dominant species highlight differences in canopy development and vertical stratification, with important implications for shade provision, microclimate regulation, and habitat availability.

4.4. Carbon Storage and Climate Mitigation Potential

Carbon storage patterns were influenced more by species traits and stand structure than by tree abundance alone. A limited number of structurally prominent species accounted for a disproportionate share of carbon storage [69]. Young and sub-mature trees contributed significantly to active carbon sequestration due to high growth rates [70,71]. However, sustained climate mitigation requires structurally durable species capable of maintaining biomass over longer time scales [72]. Although palms contributed substantially to total biomass due to abundance, their architecture differs from broad-leaved woody species, potentially limiting lateral canopy complexity and long-term carbon retention [73]. Native hardwood species provide more stable carbon reservoirs and co-benefits such as shading and habitat provision [74].
However, aside from contributing to being aesthetically pleasing, palm trees are also selected for safety, considering their branches are relatively resistant to falling and generally difficult to break. As a result of this, palm trees are frequently combined with other broadleaf plants in urban forests. In the present study, the area was dominated by palm species, which exhibit a relatively high wood specific gravity (approximately 0.7) compared to the average value of 0.6 reported for tropical forest tree species [34]. This higher wood density likely contributes to the relatively high carbon content observed in the study site.
Compared to Mount Gede Pangrango National Park (560.47 Mg C ha−1) [75], and Sarawak, Malaysia (165–202.5 Mg C ha−1) [76], the carbon stock of 444.64 Mg C ha−1 indicates strong mitigation potential for an urban green space. Therefore, strategic diversification, prioritization of long-lived native species, and protection of mature trees are essential to maximize climate mitigation performance [45,77,78,79].
Although prioritizing carbon absorption in plant species in green open spaces, the city does not specifically implement certain strategies that sacrifice functional diversity. The dominance of the R. regia palm in Langsat Park is believed to be linked to the characteristics of this species, which is frequently employed as a reforestation plant due to its fast growth rate and ornamental palm status. However, for future management, cities need to consider enriching plant species with local non-palm species, which also have high carbon sequestration potential and ecological value. The selection of plant species in green open spaces must meet physical, ecological, and even social aspects.
Ecologically, flowering plants attract urban birds, but their tree canopies also provide shade for the local microclimate [80]. According to Yulia et al. (2023), several plant species suitable for green open spaces based on silviculture, management, and aesthetic indicators are Melaleuca leucadendra, Azadirachta indica, and Calophyllum inophyllum [81].

4.5. Comparative Synthesis and Ecological Implications

The three urban forest blocks formed a clear gradient: Leuser and Langsat Parks represented high-diversity, high-evenness communities with substantial species richness, while Ayodya Park represented a moderate-diversity community with somewhat lower evenness. This gradient likely reflects differences in management history and intensity, habitat area and connectivity, and successional stage and disturbance history.
Studies in Danzhou demonstrated that cultivated species consistently outnumbered spontaneous species across urban functional units, and management practices such as watering and fertilization significantly influenced plant diversity patterns [82]. If Ayodya Park receives more intensive horticultural management indicated by domination of M. citrinus and M. elengi, this could explain both the lower richness (through selective planting) and the moderate evenness (through maintenance of dominant ornamental species).
Leuser’s ability to maintain high diversity with relatively few individuals (593) suggests superior habitat. Research in Qingdao demonstrated that urban forests with greater landscape connectivity maintain higher diversity indices [55]. If Leuser Park benefits from proximity to larger habitat patches or wildlife corridors, this could facilitate species immigration and reduce local extinction rates.
The high diversity and evenness in Langsat and Leuser Park suggest these represent relatively mature forests that have undergone succession without major disturbances. The positive correlation between construction age and species richness documented in Danzhou supports the interpretation that older urban forests accumulate species diversity over time [82].
Unlike Langsat Park and Leuser Park, Ayodya Park features a pond within its park area. This difference in the physical characteristics of the environment, including the presence of wetlands, may affect the vegetation’s ability to sequester carbon. Water level fluctuations, soil moisture, sediment characteristics, anaerobic decomposition, methane emissions, hydrological carbon transport, and the interplay between wetland hydrology and vegetation significantly impact carbon dynamics in urban wetland ecosystems, resulting in varied biomass accumulation patterns [83].

4.6. Policy and Management Implications

Urban green spaces function as active components of the urban carbon cycle and biodiversity networks, making them central to emission reduction strategies. Increasing the extent of green open spaces, enhancing the productivity of existing parks, strategically diversifying species composition, incorporating native and rare local species, and protecting structurally mature trees are essential policy directions. Fast-growing species contribute significantly to short-term CO2 uptake due to their rapid growth rates [33,84,85,86], as photosynthesis converts CO2 and water into carbohydrates that are further transformed into structural plant biomass [87,88].
However, long-term climate stability depends on maintaining balanced age structures and canopy complexity, since mature trees act as stable carbon reservoirs while also regulating temperature and improving air quality [77,89,90].
Urban forests also provide critical habitat functions. Shade trees with broad canopies not only reduce carbon emissions and moderate microclimate, but also support birds and small mammals by providing nesting sites, shelter, and food resources [91]. The ecological integrity of highly visited parks, such as Bendera Pusaka Park in Indonesia’s capital, must therefore be safeguarded to prevent habitat degradation while maintaining their multifunctional role in climate mitigation, biodiversity conservation, ecotourism, and public well-being.
Strategically, climate-responsive urban management should integrate park expansion, vegetation health improvement, rooftop and vertical greening, and multifunctional landscape design. In rapidly urbanizing tropical cities such as Jakarta, strengthening the ecological quality of urban forests represents a cost-effective and synergistic pathway toward low-carbon development, biodiversity conservation, and sustainable urban resilience.
However, there are several limitations of this study that should be acknowledged. First, the study focused only on above-ground biomass, while belowground carbon and soil organic carbon, physical characteristics and environmental conditions were not quantified. Second, carbon sequestration rates were inferred from biomass rather than long-term growth monitoring. Finally, the analysis represents a snapshot in time and does not capture temporal dynamics of urban forest development.

5. Conclusions

This study demonstrates that urban green open spaces function as significant carbon storage while simultaneously supporting urban biodiversity within a highly developed metropolitan landscape. Across 5.9 ha, the three parks collectively stored substantial biomass and carbon, with marked variation among sites driven primarily by differences in stand structure, tree density, and park area. Langsat Park exhibited the highest carbon stock and CO2-equivalent of stored carbon capacity, largely attributable to its greater abundance of large individuals, whereas Leuser and Ayodya Parks showed comparatively lower but still meaningful contributions.
Structural analysis indicates that vegetation composition is strongly shaped by planting design and management interventions rather than natural succession. Palm species dominated both abundance and biomass contributions, playing a disproportionate role in carbon storage. However, the limited representation of large-canopy native trees and the moderate structural complexity suggest that long-term carbon stability and ecological resilience could be further enhanced through strategic diversification and structural enrichment.
Overall, the findings highlight the multifunctional role of urban forests as nature-based solutions that integrate climate program, biodiversity conservation, and human well-being. Strengthening species composition, promoting structural heterogeneity, and protecting mature trees are essential strategies to optimize the ecological performance of urban green spaces and support the transition toward low-carbon, sustainable cities.

Author Contributions

Conceptualization, N.M.H., H.G., and R.T.K.; methodology, N.M.H., L.A. (Laode Alhamd), H.G., P., I.W.S.D., and R.T.K.; software, L.A. (Laode Alhamd); validation, N.M.H., L.A. (Laode Alhamd), H.G., P., R.T.K., N.M., I.W.H., M., L.A. (Lutfi Abdulah), and R.S.; formal analysis, N.M.H., L.A. (Laode Alhamd), I.W.S.D., B.H.N., D., Y.L., R.G., T.S., M.T., S.S., M.W., M., L.A. (Lutfi Abdulah), and I.W.H.; investigation, N.M.H. and L.A. (Laode Alhamd); data curation, N.M.H. and L.A. (Laode Alhamd); writing—original draft preparation, N.M.H. and L.A. (Laode Alhamd); writing—review and editing H.G., P., R.T.K., N.M., I.W.H., I.W.S.D., S.S., B.H.N., M.W., D., Y.L., R.G.,T.S., M., M.T., L.A. (Lutfi Abdulah), and R.S.; visualization, L.A. (Laode Alhamd) and I.W.H.; supervision, N.M.H., I.W.S.D., and H.G. All authors have read and agreed to the published version of the manuscript.

Funding

This research received no external funding.

Data Availability Statement

The original contributions presented in this study are included in the article; further inquiries can be directed to the corresponding author.

Acknowledgments

The authors sincerely thank the Head of Research Centre for Ecology-BRIN, and the Integrasi Transit Jakarta (ITJ), Ismayadi Samsoedin for granting permission and providing valuable guidance throughout this study. We also express our gratitude to two anonymous reviewers for their constructive comments and suggestions, which significantly improved the quality of this paper. During the preparation of this manuscript/study, the authors used Chat-GPT 5.3 for the purposes of improvement the readability and language of the manuscript. The authors have reviewed and edited the output and take full responsibility for the content of this publication.

Conflicts of Interest

The authors declare no conflicts of interest.

References

  1. Intergovernmental Panel on Climate Change (IPCC). Climate Change 2022—Impacts, Adaptation and Vulnerability: Working Group II Contribution to the Sixth Assessment Report of the Intergovernmental Panel on Climate Change; Cambridge University Press: Cambridge, UK, 2023. [Google Scholar]
  2. Turner, P.A.; Mach, K.J.; Lobell, D.B.; Benson, S.M.; Baik, E.; Sanchez, D.L.; Field, C.B. The Global Overlap of Bioenergy and Carbon Sequestration Potential. Clim. Change 2018, 148, 1–10. [Google Scholar] [CrossRef] [Scilit]
  3. Nowak, D.J.; Hirabayashi, S.; Bodine, A.; Greenfield, E. Tree and Forest Effects on Air Quality and Human Health in the United States. Environ. Pollut. 2014, 193, 119–129. [Google Scholar] [CrossRef] [Scilit] [PubMed]
  4. Garsetiasih, R.; Heriyanto, N.M.; Adinugroho, W.C.; Gunawan, H.; Dharmawan, I.W.S.; Sawitri, R.; Yeny, I.; Mindawati, N. Denny Connectivity of Vegetation Diversity, Carbon Stock, and Peat Depth in Peatland Ecosystems. Glob. J. Environ. Sci. Manag. 2022, 8, 369–388. [Google Scholar] [CrossRef] [Scilit]
  5. Zain, A.F.M.; Pribadi, D.O.; Indraprahasta, G.S. Revisiting the Green City Concept in the Tropical and Global South Cities Context: The Case of Indonesia. Front. Environ. Sci. 2022, 10, 787204. [Google Scholar] [CrossRef] [Scilit]
  6. Salbitano, F.; Borelli, S.; Conigliaro, M.; Chen, Y. Guidelines on Urban and Peri-Urban Forestry; FAO of the United Nations: Rome, Italy, 2016.
  7. Shadman, S.; Ahanaf Khalid, P.; Hanafiah, M.M.; Koyande, A.K.; Islam, M.A.; Bhuiyan, S.A.; Sin Woon, K.; Show, P.-L. The Carbon Sequestration Potential of Urban Public Parks of Densely Populated Cities to Improve Environmental Sustainability. Sustain. Energy Technol. Assess. 2022, 52, 102064. [Google Scholar] [CrossRef] [Scilit]
  8. Zhao, J.; Ai, J.; Zhu, Y.; Huang, R.; Peng, H.; Xie, H. Carbon Budget of Different Forests in China Estimated by An Individual-Based Model and Remote Sensing. PLoS ONE 2023, 18, e0285790. [Google Scholar] [CrossRef] [Scilit] [PubMed]
  9. Gómez-Baggethun, E.; Gren, Å.; Barton, D.N.; Langemeyer, J.; McPhearson, T.; O’Farrell, P.; Andersson, E.; Hamstead, Z.; Kremer, P. Urban Ecosystem Services. In Urbanization, Biodiversity and Ecosystem Services: Challenges and Opportunities; Elmqvist, T., Fragkias, M., Goodness, J., Güneralp, B., Marcotullio, P.J., McDonald, R.I., Parnell, S., Schewenius, M., Sendstad, M., Seto, K.C., et al., Eds.; Springer: Dordrecht, The Netherlands, 2013; pp. 175–251. [Google Scholar]
  10. Zhang, L.; Gao, Y.; Ren, Q.; Ge, S.; Wang, B.; Du, C.; Liu, Y.; Kong, D. Evaluation of Urban Green Space Plant Landscape Quality in Zhengzhou City Using the AHP-SBE Method. PLoS ONE 2025, 20, e0329119. [Google Scholar] [CrossRef] [Scilit] [PubMed]
  11. Davies, Z.G.; Edmondson, J.L.; Heinemeyer, A.; Leake, J.R.; Gaston, K.J. Mapping an Urban Ecosystem Service: Quantifying Above-Ground Carbon Storage at a City-Wide Scale. J. Appl. Ecol. 2011, 48, 1125–1134. [Google Scholar] [CrossRef] [Scilit]
  12. Nandal, A.; Rani, S.; Rao, A.S.; Yadav, S.S. Carbon Stock Evaluation in Native and Exotic Tree Species Using Multiple Allometric Equations: Insights from India’s Greenest University. Holist. Approach Environ. 2026, 16, 1–15. [Google Scholar] [CrossRef] [Scilit]
  13. Darlina, I.; Wilujeng, S.; Nurmajid, F. Estimation of Carbon Stocks and Carbon Sequestration in Maluku Park, Bandung City. Paspalum J. Ilm. Pertan. 2023, 11, 163–171. [Google Scholar] [CrossRef] [Scilit]
  14. Putra, K.S.N.D.; Hizqiyah, I.Y.N.; Gurnita, G. Analysis of Stored Carbon Reserves in Trees in the Green Open Spaces of Panatayuda Park, Bandung City, and Surrounding Areas. J. Mangifera Edu 2024, 9, 87–96. [Google Scholar] [CrossRef] [Scilit]
  15. Margawuk, M.; Astiani, D.; Dewantara, I. Estimation of Carbon Stock in the Green-Open Space of the Pontianak City Governor’s Hall. J. Hutan Lestari 2024, 12, 351–361. [Google Scholar] [CrossRef] [Scilit]
  16. Nurfadhil, R.; Zain, A.F.M. Evaluation of Green Open Space Availability and Green City Concept Implementation in DKI Jakarta Province. J. Reg. Rural Dev. Plan. 2024, 8, 76–95. [Google Scholar] [CrossRef] [Scilit]
  17. Nero, B.F.; Kuusaana, E.D.; Ahmed, A.; Campion, B.B. Carbon Storage and Tree Species Diversity of Urban Parks in Kumasi, Ghana. City Environ. Interact. 2024, 24, 100156. [Google Scholar] [CrossRef] [Scilit]
  18. Heriyanto, N.M.; Priatna, D.; Samsoedin, I. Plant Diversity and Carbon Stock in Tembawang Alak Forest, Sintang, West Kalimantan. Bot. Gard. Bull. 2022, 25, 142–155. [Google Scholar] [CrossRef] [Scilit]
  19. Ahumada, R.A.; Cantón, M.A.; Martinez, C.F. The Role of Urban Forests in CO2 Sequester as An Ecosystem Service: Current Knowledge Analysis. Bosque 2025, 46, 3–14. [Google Scholar] [CrossRef] [Scilit]
  20. Balai Penelitian Tanah (Balittanah). Peta Tanah Pulau Jawa; Balai Penelitian Tanah (Balittanah): Bogor, Indonesia, 2018. [Google Scholar]
  21. Soil Survey Staff. Keys to Soil Taxonomy, 13th ed.; USDA: Washington DC, USA, 2022.
  22. Urushadze, T.F.; Blum, E.H.; Machavariani, J.S.; Pirskhalauri, R.D.; Kvrivishvili, T.O. Soils of Georgia and Problems of Their Use. Ann. Agrar. Sci. 2015, 13, 8–23. [Google Scholar]
  23. BPS-Statistics Jakarta Selatan Municipality. Jakarta Selatan Municipality in Figures 2024; BPS-Statistics Jakarta Selatan Municipality: Jakarta Selatan Municipality, Indonesia, 2025; Volume 33.
  24. Kartawinata, K.; Siregar, M.; Sugiarti; Yuzammi; Triono, T. Diversitas Ekosistem Alami Indonesia, 2nd ed.; LIPI Press—Pustaka Obor Indonesia: Jakarta, Indonesia, 2016. [Google Scholar]
  25. Mansur, M.; Kartawinata, K. Phytosociology of a Lower Montane Forest on Mt. Batulanteh, Sumbawa, Indonesia. Reinwardtia 2017, 16, 77. [Google Scholar] [CrossRef] [Scilit]
  26. Heriyanto, N.M.; Priatna, D.; Kartawinata, K.; Samsoedin, I. Forest Structure and Composition in the Rantau Bertuah Protected Area, Siak Regency, Riau Province. Bot. Gard. Bull. 2020, 23, 69–81. [Google Scholar] [CrossRef] [Scilit]
  27. World Flora Online World Flora Online Database. Available online: https://www.worldfloraonline.org/ (accessed on 12 September 2025).
  28. Curtis, J.T.; McIntosh, R.P. An Upland Forest Continuum in the Prairie-Forest Border Region of Wisconsin. Ecology 1951, 32, 476–496. [Google Scholar] [CrossRef] [Scilit]
  29. Magurran, A.E. Measuring Biological Diversity; Blackwell Science Ltd.: Oxford, UK, 2004. [Google Scholar]
  30. Margalef, R. Information Theory in Ecology. Ann. R. Acad. Arts Sci. Barc. 1957, 32, 373–449. [Google Scholar]
  31. Shannon, C.E.; Wiener, W. The Mathematical Theory of Communication; University of Illinois Press: Champaign, IL, USA, 1949. [Google Scholar]
  32. Pielou, E.C. The Measurement of Diversity in Different Types of Biological Collections. J. Theor. Biol. 1966, 13, 131–144. [Google Scholar] [CrossRef] [Scilit]
  33. Heriyanto, N.M.; Samsoedin, I.; Kartawinata, K. Tree Species Diversity, Structural Characteristics and Carbon Stock in One-Hectare Plot of the Protection Forest Area in West Lampung Regency, Indonesia. Reinwardtia 2025, 18, 1–18. [Google Scholar] [CrossRef] [Scilit]
  34. Chave, J.; Réjou-Méchain, M.; Búrquez, A.; Chidumayo, E.; Colgan, M.S.; Delitti, W.B.C.; Duque, A.; Eid, T.; Fearnside, P.M.; Goodman, R.C.; et al. Improved Allometric Models to Estimate the Aboveground Biomass of Tropical Trees. Glob. Change Biol. 2014, 20, 3177–3190. [Google Scholar] [CrossRef] [Scilit] [PubMed]
  35. Goodman, R.C.; Phillips, O.L.; Del Castillo Torres, D.; Freitas, L.; Cortese, S.T.; Monteagudo, A.; Baker, T.R. Amazon Palm Biomass and Allometry. For. Ecol. Manag. 2013, 310, 994–1004. [Google Scholar] [CrossRef] [Scilit]
  36. Kigomo, J.N.; Mukovi, J.; Bor, N.; Leshaye, B.; Cheruiyot, T.; Kuria, M. Allometric Equations for Estimating Biomass and Carbon Stocks of On-Farm Bamboo Species in the Agricultural Landscapes of Kenya. Adv. Bamboo Sci. 2025, 11, 100139. [Google Scholar] [CrossRef] [Scilit]
  37. Carsan, S.; Orwa, C.; Harwood, C.; Kindt, R.; Stroebel, A.; Neufeldt, H.; Jamnadass, R. African Wood Density Database. Available online: https://apps.worldagroforestry.org/treesnmarkets/wood/index.php (accessed on 2 February 2026).
  38. Hairiah, K.; Rahayu, S. Measurement of Carbon Stored in Different Land Uses; ICRAF Southeast Asia: Bogor, Indonesia, 2007. [Google Scholar]
  39. CIFOR-ICRAF Wood Density Database. Available online: https://www.worldagroforestry.org/output/wood-density-database (accessed on 18 December 2025).
  40. Intergovernmental Panel on Climate Change (IPCC). 2019 Refinement to the 2006 IPCC Guidelines for National Greenhouse Gas Inventories; Calvo Buendia, E., Tanabe, K., Kranjc, A., Baasansuren, J., Fukuda, M., Ngarize, S., Osako, A., Pyrozhenko, Y., Shermanau, P., Federici, S., Eds.; IPCC: Geneva, Switzerland, 2019; Volume 4.
  41. Martin, A.R.; Thomas, S.C. A Reassessment of Carbon Content in Tropical Trees. PLoS ONE 2011, 6, e23533. [Google Scholar] [CrossRef] [Scilit] [PubMed]
  42. Avalos, G.; Emilio, T.; Andersen, K.M.; Alvarez-Clare, S. Editorial: Functional Ecology and Conservation of Palms. Front. For. Glob. Chang. 2022, 5, 1021784. [Google Scholar] [CrossRef] [Scilit]
  43. Yen, T.-M.; Lee, J.-S. Comparing Aboveground Carbon Sequestration between Moso Bamboo (Phyllostachys heterocycla) and China Fir (Cunninghamia lanceolata) Forests Based on the Allometric Model. For. Ecol. Manag. 2011, 261, 995–1002. [Google Scholar] [CrossRef] [Scilit]
  44. Lepczyk, C.A.; Aronson, M.F.J.; Evans, K.L.; Goddard, M.A.; Lerman, S.B.; Macivor, J.S. Biodiversity in the City: Fundamental Questions for Understanding the Ecology of Urban Green Spaces for Biodiversity Conservation. Bioscience 2017, 67, 799–807. [Google Scholar] [CrossRef] [Scilit]
  45. Wang, D.; Xu, P.Y.; An, B.W.; Guo, Q.P. Urban Green Infrastructure: Bridging Biodiversity Conservation and Sustainable Urban Development through Adaptive Management Approach. Front. Ecol. Evol. 2024, 12, 1440477. [Google Scholar] [CrossRef] [Scilit]
  46. Hwang, Y.H.; Yue, Z.E.J.; Ling, S.K.; Tan, H.H.V. It’s Ok to Be Wilder: Preference for Natural Growth in Urban Green Spaces in A Tropical City. Urban For. Urban Green. 2019, 38, 165–176. [Google Scholar] [CrossRef] [Scilit]
  47. Singh, O. Species Selection in Urban Forestry—Towards Urban Metabolism. In Urban Metabolism and Climate Change; Bhadouria, R., Tripathi, S., Singh, P., Joshi, P.K., Singh, R., Eds.; Springer: Cham, Switzerland, 2023; pp. 275–293. [Google Scholar]
  48. Pretzsch, H.; Schütze, G. Tree Species Mixing Can Increase Stand Productivity, Density and Growth Efficiency and Attenuate the Trade-off Between Density and Growth throughout the Whole Rotation. Ann. Bot. 2021, 128, 767–786. [Google Scholar] [CrossRef] [Scilit] [PubMed]
  49. Coverdale, T.C.; Davies, A.B. Unravelling the Relationship Between Plant Diversity and Vegetation Structural Complexity: A Review and Theoretical Framework. J. Ecol. 2023, 111, 1378–1395. [Google Scholar] [CrossRef] [Scilit]
  50. Conway, T.M.; Almas, A.D.; Coore, D. Ecosystem Services, Ecological Integrity, and Native Species Planting: How to Balance These Ideas in Urban Forest Management? Urban For. Urban Green. 2019, 41, 1–5. [Google Scholar] [CrossRef] [Scilit]
  51. Toscano, S.; Romano, D.; Lazzeri, V.; Leotta, L.; Bretzel, F. How Can Plants Used for Ornamental Purposes Contribute to Urban Biodiversity? Sustainability 2025, 17, 4061. [Google Scholar] [CrossRef] [Scilit]
  52. Goodness, J.; Andersson, E.; Anderson, P.M.L.; Elmqvist, T. Exploring the Links Between Functional Traits and Cultural Ecosystem Services to Enhance Urban Ecosystem Management. Ecol. Indic. 2016, 70, 597–605. [Google Scholar] [CrossRef] [Scilit]
  53. Campos-Silva, L.A.; Piratelli, A.J. Vegetation Structure Drives Taxonomic Diversity and Functional Traits of Birds in Urban Private Native Forest Fragments. Urban Ecosyst. 2021, 24, 375–390. [Google Scholar] [CrossRef] [Scilit]
  54. Çakir, M.; Gülsoy, S. Assessment of Woody Plant Diversity in Urban Parks of Gaziantep, Türkiye, Using Biodiversity Indices. Urban Ecosyst. 2025, 28, 204. [Google Scholar] [CrossRef] [Scilit]
  55. Zhu, R.; Xiu, D.; Xue, R.; Teng, S. How Did the Diversity of Woody Plants in Urban Forests Vary with the Urban-Rural Gradient in Qingdao, China? Heliyon 2024, 10, e36901. [Google Scholar] [CrossRef] [Scilit] [PubMed]
  56. Roeland, S.; Moretti, M.; Amorim, J.H.; Branquinho, C.; Fares, S.; Morelli, F.; Niinemets, Ü.; Paoletti, E.; Pinho, P.; Sgrigna, G.; et al. Towards An Integrative Approach to Evaluate the Environmental Ecosystem Services Provided by Urban Forest. J. For. Res. 2019, 30, 1981–1996. [Google Scholar] [CrossRef] [Scilit]
  57. Flores, P.M.C.; Fernandez, A.I.; Orozco, K.J.U.; Endino, R.M.C.; Picardal, J.P.; Garces, J.J.C. Ornamental Plant Diversity, Richness and Composition in Urban Parks: Studies in Metro Cebu, Philippines. Environ. Exp. Biol. 2020, 18, 183–192. [Google Scholar] [CrossRef] [Scilit]
  58. Hu, L.; Li, Z.; Liao, W.; Fan, Q. Values of Village Fengshui Forest Patches in Biodiversity Conservation in the Pearl River Delta, China. Biol. Conserv. 2011, 144, 1553–1559. [Google Scholar] [CrossRef] [Scilit]
  59. Rodrigo, R.M.; Pettit, J.L.; Janda, P.; Pavlin, J.; Ralhan, D.; Kozak, D.; Matula, R.; Marchand, W.; Bače, R.; Dušátko, M.; et al. Past Disturbances Shape Present Tree Size Distribution in European Temperate Primary Beech-Dominated Forests. For. Ecol. Manag. 2024, 574, 122364. [Google Scholar] [CrossRef] [Scilit]
  60. Thaiutsa, B.; Puangchit, L.; Kjelgren, R.; Arunpraparut, W. Urban Green Space, Street Tree and Heritage Large Tree Assessment in Bangkok, Thailand. Urban For. Urban Green. 2008, 7, 219–229. [Google Scholar] [CrossRef] [Scilit]
  61. Morgenroth, J.; Nowak, D.J.; Koeser, A.K. DBH Distributions in America’s Urban Forests-An Overview of Structural Diversity. Forests 2020, 11, 135. [Google Scholar] [CrossRef] [Scilit]
  62. Sanders, J.; Grabosky, J.; Cowie, P. Establishing Maximum Size Expectations for Urban Trees with Regard to Designed Space. Arboric. Urban For. 2013, 39, 68–73. [Google Scholar] [CrossRef] [Scilit]
  63. Stephenson, N.L.; Das, A.J.; Condit, R.; Russo, S.E.; Baker, P.J.; Beckman, N.G.; Coomes, D.A.; Lines, E.R.; Morris, W.K.; Rüger, N.; et al. Rate of Tree Carbon Accumulation Increases Continuously with Tree Size. Nature 2014, 507, 90–93. [Google Scholar] [CrossRef] [Scilit] [PubMed]
  64. Fischer, S.M.; Wang, X.; Huth, A. Distinguishing Mature and Immature Trees Allows Estimating Forest Carbon Uptake from Stand Structure. Biogeosciences 2024, 21, 3305–3319. [Google Scholar] [CrossRef] [Scilit]
  65. Jenerette, G.D.; Herrmann, D.L. A Global Synthesis of Reported Urban Tree Carbon Production Rates and Approaches. Front. Ecol. Evol. 2024, 11, 1244418. [Google Scholar] [CrossRef] [Scilit]
  66. Nowak, D.J.; Greenfield, E.J.; Hoehn, R.E.; Lapoint, E. Carbon Storage and Sequestration by Trees in Urban and Community Areas of the United States. Environ. Pollut. 2013, 178, 229–236. [Google Scholar] [CrossRef] [Scilit] [PubMed]
  67. McPherson, E.G.; Xiao, Q.; van Doorn, N.S.; de Goede, J.; Bjorkman, J.; Hollander, A.; Boynton, R.M.; Quinn, J.F.; Thorne, J.H. The Structure, Function and Value of Urban Forests in California Communities. Urban For. Urban Green. 2017, 28, 43–53. [Google Scholar] [CrossRef] [Scilit]
  68. Pretzsch, H.; Forrester, D.I.; Rötzer, T. Representation of Species Mixing in Forest Growth Models: A Review and Perspective. Ecol. Modell. 2015, 313, 276–292. [Google Scholar] [CrossRef] [Scilit]
  69. Ferrini, F.; Fini, A.; Mori, J.; Gori, A. Role of Vegetation as A Mitigating Factor in the Urban Context. Sustainability 2020, 12, 4247. [Google Scholar] [CrossRef] [Scilit]
  70. Imran, M.; Zhou, G.; Jing, G.; Xu, C.; Tan, Y.; Ishaq, R.A.F.; Lodhi, M.K.; Yasinzai, M.; Akbar, U.; Ali, A. Assessing Above-Ground Biomass Dynamics and Carbon Sequestration Potential Using Machine Learning and Spaceborne LiDAR in Hilly Conifer Forests of Mansehra District, Pakistan. Forests 2025, 16, 330. [Google Scholar] [CrossRef] [Scilit]
  71. Martens, C. Modelling Future Global Change Impacts on African Ecosystems and Their Carbon Dynamics and Associated Uncertainties and Challenges; Johann Wolfgang Goethe-Universität: Frankfurt, Germany, 2023. [Google Scholar]
  72. Johnson, D.J.; Needham, J.; Xu, C.; Massoud, E.C.; Davies, S.J.; Anderson-Teixeira, K.J.; Bunyavejchewin, S.; Chambers, J.Q.; Chang-Yang, C.H.; Chiang, J.M.; et al. Climate Sensitive Size-Dependent Survival in Tropical Trees. Nat. Ecol. Evol. 2018, 2, 1436–1442. [Google Scholar] [CrossRef] [Scilit] [PubMed]
  73. Clark, D.B.; Oberbauer, S.F.; Clark, D.A.; Ryan, M.G.; Dubayah, R.O. Physical Structure and Biological Composition of Canopies in Tropical Secondary and Oldgrowth Forests. PLoS ONE 2021, 16, e0256571. [Google Scholar] [CrossRef] [Scilit] [PubMed]
  74. Edwards, D.P.; Cerullo, G.R. Biodiversity Is Central for Restoration. Curr. Biol. 2024, 34, R371–R379. [Google Scholar] [CrossRef] [Scilit] [PubMed]
  75. Sawitri, R.; Heriyanto, N.M.; Dharmawan, I.W.S.; Kwatrina, R.T.; Gunawan, H.; Garsetiasih, R.; Takandjandji, M.; Rianti, A.; Sihombing, V.S.; Mindawati, N.; et al. Ecological Dynamics of Forest Stands with Castanopsis argentea (Blume) A.DC. in A Mountain Ecosystem: Vegetation Structure, Diversity, and Carbon Stock Under Tourism Pressure. Land 2025, 14, 1187. [Google Scholar] [CrossRef] [Scilit]
  76. Brown, S. Estimating Biomass and Biomass Change of Tropical Forests: A Primer; FAO of the United Nations: Rome, Italy, 1997; Volume 134.
  77. Lindenmayer, D.B.; Laurance, W.F. The Ecology, Distribution, Conservation and Management of Large Old Trees. Biol. Rev. 2017, 92, 1434–1458. [Google Scholar] [CrossRef] [Scilit] [PubMed]
  78. Ohse, B.; Compagnoni, A.; Farrior, C.E.; McMahon, S.M.; Salguero-Gómez, R.; Rüger, N.; Knight, T.M. Demographic Synthesis for Global Tree Species Conservation. Trends Ecol. Evol. 2023, 38, 579–590. [Google Scholar] [CrossRef] [Scilit] [PubMed]
  79. Elliott, H.; Eon, C.; Breadsell, J.K. Improving City Vitality through Urban Heat Reduction with Green Infrastructure and Design Solutions: A Systematic Literature Review. Buildings 2020, 10, 219. [Google Scholar] [CrossRef] [Scilit]
  80. Gülçin, D. Spatial Distribution of Urban Vegetation: A Case Study of a Canadian University Campus Using LiDAR-Based Metrics. Forestist 2021, 71, 196–209. [Google Scholar] [CrossRef] [Scilit]
  81. Yulia, I.T.; Permatasari, D.P.; Igustita, I.; Berlin, G.E.; Safira, R.N.; Sugiyarto, S.; Nazar, I.A.; Himawan, W.; Sunarto, S.; Pradhan, P.; et al. Assessing the Suitability of Tree Species for Urban Green Space in A Tropical University Campus in Surakarta, Indonesia. Biodiversitas 2023, 24, 1713–1723. [Google Scholar] [CrossRef] [Scilit]
  82. Zhu, M.-H.; Li, Q.; Yuan, J.-L.; Padullés Cubino, J.; Johnson, J.B.; Cui, J.-P.; Nizamani, M.M.; Zhu, Z.-X.; Wang, H.-F. The Influence of Greening Management and Landscape Patterns on Plant Diversity in Urban Green Spaces in Danzhou, China. Urban For. Urban Green. 2025, 104, 128651. [Google Scholar] [CrossRef] [Scilit]
  83. Shao, Q.; Lian, Y.; Zhu, Y.; Li, Y. Assessment of the Ecological Value of Urban Wetlands and Optimization Strategies Based on Carbon Sink Benefits. Land 2026, 15, 996. [Google Scholar] [CrossRef] [Scilit]
  84. Dharmawan, I.W.S. Evaluation of the Dynamics of Fixed Carbon Stocks in Primary and Burnt Peat Forests in Hampangen and Kalampangan, Central Kalimantan; Bogor Agricultural University: Bogor, Indonesia, 2013. [Google Scholar]
  85. Lutz, J.A.; Furniss, T.J.; Johnson, D.J.; Davies, S.J.; Allen, D.; Alonso, A.; Anderson-Teixeira, K.J.; Andrade, A.; Baltzer, J.; Becker, K.M.L.; et al. Global Importance of Large-Diameter Trees. Glob. Ecol. Biogeogr. 2018, 27, 849–864. [Google Scholar] [CrossRef] [Scilit]
  86. Smith, I.A.; Dearborn, V.K.; Hutyra, L.R. Live Fast, Die Young: Accelerated Growth, Mortality, and Turnover in Street Trees. PLoS ONE 2019, 14, e0215846. [Google Scholar] [CrossRef] [Scilit] [PubMed]
  87. Widhi, S.J.K.; Murti, S.H. Estimasi Stok Karbon Hutan Dengan Memanfaatkan Citra Landsat 8 Di Taman Nasional Tesso Nilo, Riau. J. Bumi Indo. 2014, 3, 1–11. [Google Scholar]
  88. Nievola, C.C.; Carvalho, C.P.; Carvalho, V.; Rodrigues, E. Rapid Responses of Plants to Temperature Changes. Temperature 2017, 4, 371–405. [Google Scholar] [CrossRef] [Scilit] [PubMed]
  89. Chauhan, S.; Kengoo, N.; Kishore, K.; Haksinhbhai, M.R.; Rana, P. Carbon Dynamics in Agroforestry Systems: Implications for Climate Change Mitigation and Adaptation. Int. J. Environ. Clim. Chang. 2025, 15, 109–133. [Google Scholar] [CrossRef] [Scilit]
  90. Karim, M.R.; Ashrafizadeh, E.; Saimun, M.S.R.; Liao, W.; Rana, P.; Arfin-Khan, M.A.S. The Role of Climate in Shaping Vegetation Dynamics and Carbon Dioxide Fluxes in Global Protected Forest Landscapes. J. Environ. Manag. 2025, 395, 127916. [Google Scholar] [CrossRef] [Scilit] [PubMed]
  91. Rawat, A.; Singh, H. Role of Urban Forests in Modulating Urban Climate. In Urban Forests, Climate Change and Environmental Pollution: Physio-Biochemical and Molecular Perspectives to Enhance Urban Resilience; Singh, H., Ed.; Springer Nature Switzerland: Cham, Switzerland, 2024; pp. 351–371. [Google Scholar]
Figure 1. Location of the study site: (A) Leuser Park; (B) Langsat Park; (C) Ayodya Park. (Source: Inset map of Jakarta was derived from https://jakartasatu.jakarta.go.id/geoportal/peta/jakarta, accessed on 25 November 2025; basemap was derived from Google Earth® (https://earth.google.com/) accessed on 25 November 2025).
Land 15 01514 g001
Figure 2. Mean stem diameter of the five dominant tree species in Langsat (A), Leuser (B), and Ayodya Parks (C). Interspecific and site-level contrasts reflect differences in planting design, species growth form, and management intensity rather than natural successional processes. RR: Roystonea regia; WB: Wodyetia bifurcata; PP: Ptychosperma propinquum; CL: Chrysalidocarpus lutescens; MC: Melaleuca citrina; PR: Phoenix roebelenii; MI: Mangifera indica; ME: Mimusops elengi; SM: Syzygium myrtifolium.
Land 15 01514 g002
Figure 3. Mean height of the five dominant tree species in Langsat (A), Leuser (B), and Ayodya Parks (C).
Land 15 01514 g003
Figure 4. Tree height class distribution in: (A) Langsat, (B) Leuser, and (C) Ayodya Parks. The height distributions primarily reflect the planting history and pruning regimes rather than the natural succession. The dominance of short-stature classes indicates that urban stands are structurally young or intensively managed.
Land 15 01514 g004
Figure 5. Distribution of diameter classes for saplings and trees at the research site. Langsat (a), Leuser (b) and Ayodra Parks (c). Diameter Class: A (2–<10); B (10–<20); C (20–<30); D (30–<40); E (40–<50); F (50–<60); and G (≥60 cm).
Land 15 01514 g005
Figure 6. Langsat Park field condition.
Land 15 01514 g006
Table 1. Mean diameter and height of the most numerous tree species.
Location and Tree SpeciesMean Diameter
(cm)
Mean Height
(m)
n
Langsat Park
1. Roystonea regia41.9417.32193
2. Wodyetia bifurcata16.426.5893
3. Ptychosperma propinquum6.343.7386
4. Chrysalidocarpus lutescens 5.982.5771
5. Melaleuca citrina13.135.6936
Leuser Park
1. Chrysalidocarpus lutescens5.502.59173
2. Phoenix roebelenii6.552.6875
3. Mangifera indica21.976.7638
4. Wodyetia bifurcata17.687.9229
5. Ptychosperma propinquum6.246.7024
Ayodya Park
1. Melaleuca citrina 17.716.0472
2. Ptychosperma propinquum7.613.6743
3. Mimusops elengi24.947.1229
4. Syzygium myrtifolium5.113.0023
5. Phoenix roebelenii8.273.6923
Table 2. The five highest IVI of tree species.
Location and Tree SpeciesnRD
(%)
RDom
(%)
IVI *
(%)
Rank
Langsat Park
   Wodyetia bifurcata938.5034.1542.651
   Pterocarpus indicus111.0130.6431.652
   Swietenia macrophylla373.3816.7820.163
   Cocos nucifera141.2817.5218.804
   Roystonea regia19317.641.0718.715
Leuser Park
   Roystonea regia355.9066.0671.961
   Elaeis guineensis71.1813.9615.142
   Wodyetia bifurcata294.898.9213.813
   Delonix regia162.706.078.774
   Cocos nucifera30.514.895.405
Ayodya Park
   Saribus rotundifolius113.5631.2834.841
   Cocos nucifera134.2121.7525.962
   Dypsis lutescens10.3220.7021.023
   Ravenala madagascariensis41.2914.9816.274
   Pterocarpus indicus20.6511.4612.115
* IVI calculated as RD + RDom (modified from [28] due to complete census design; standard IVI includes relative frequency and ranges 0–300). The analysis was based on a complete tree census of 2459 individuals across the three parks.
Table 3. Biodiversity indices comparison of urban forest blocks.
ParametersLangsat ParkLeuser ParkAyodya Park
Number of species (S)797833
Number of individuals (N) 1549600310
Margalef species richness individual (R)10.2312.075.57
Shannon-Wiener diversity index (H′)3.383.442.38
Pielou’s evenness index (E)0.770.790.68
Species Richness20.062.447.1
Table 4. The calculations of the five highest carbon potentials of tree species.
Location and Tree SpeciesnBiomass
(Mg)
Carbon
(Mg)
CO2-Equivalent of Stored Carbon
(Mg)
Langsat Park
   1. Roystonea regia19337131633.725995.75
   2. Wodyetia bifurcata93118.4752.13191.30
   3. Pterocarpus indicus11106.3249.97183.39
   4. Swietenia macrophylla 3758.2027.35100.34
   5. Cocos nucifera1460.7726.7498.13
Leuser Park
   1. Roystonea regia35345.72152.12558.27
   2. Elaeis guineensis773.0132.12117.90
   3. Wodyetia bifurcata2946.6520.5375.33
   4. Delonix regia1631.7614.9354.79
   5. Cocos nucifera325.5811.2541.31
Ayodya Park
   1. Saribus rotundifolius1128.0913.2048.46
   2. Cocos nucifera13119.548.6031.55
   3. Ravenala madagascariensis41313.456.3223.21
   4. Pterocarpus indicus210.294.8417.75
Table 5. Distribution of plant types (stems), biomass, carbon content andCO2-equivalent of stored carbon.
Location and Tree SpeciesArea
(ha)
nBiomass
(Mg)
Carbon Content
(Mg)
CO2-Equivalent of Stored Carbon
(Mg)
Langsat Park3.95
   1. Trees 545520.83244.79898.37
   2. Palm 5313998.121759.176456.16
   3. Bamboo 4734.092.047.50
Subtotal I 15494523.042006.007361.83
Leuser Park1.25
   1. Trees 238145.968.57251.66
   2. Palm 355521.73229.56842.49
   3. Bamboo 740.5220.2674.35
Subtotal II 600708.15318.391168.50
Ayodya Park0.7
   1. Trees 196543.08255.25936.76
   2. Palm 11499.3643.72160.44
Subtotal III 310642.44298.971097.20
Total (I + II + III)5.924595873.632623.369627.53
Disclaimer/Publisher’s Note: The statements, opinions and data contained in all publications are solely those of the individual author(s) and contributor(s) and not of MDPI and/or the editor(s). MDPI and/or the editor(s) disclaim responsibility for any injury to people or property resulting from any ideas, methods, instructions or products referred to in the content.