1. Introduction
Dust storms are among the most important natural hazards in arid and semi-arid regions, influencing the Earth’s radiation balance, atmospheric processes, air quality, and human health. Airborne mineral particles affect climate both directly—by scattering and absorbing solar radiation [
1,
2,
3,
4,
5]—and indirectly by modifying atmospheric optical properties [
6,
7] and cloud albedo through their role as cloud condensation nuclei [
8,
9]. Dust storms also have significant impacts on air quality [
10,
11] and human health [
12,
13].
Dust emissions originate mainly from the Sahara Desert, the Middle East, and Central Asia, injecting between 200 and 5000 million tons of mineral dust into the atmosphere annually [
14]. Dust from North Africa affects air quality across Africa, the Middle East, Europe, Asia, the Caribbean, and the Americas [
15]. Numerous studies have investigated dust source regions, transport pathways, and climatic controls [
16,
17,
18,
19,
20,
21,
22,
23,
24,
25]. Ref. [
26] identified the Middle East as the second most active dust-producing region after Africa, with seasonal variability across the region. The Arabian Peninsula is one of the world’s major dust sources [
16,
27,
28], with extremely high dust concentrations reported in Kuwait and Saudi Arabia [
29,
30]. TOMS data also highlight eastern and central Saudi Arabia as major dust activity centers [
31].
Iran is among the most dust-affected countries in Southwest Asia due to its arid environments, recurrent droughts, and complex atmospheric circulation systems [
32]. Dust activity in Iran shows strong spatial and temporal heterogeneity linked to climate variability, land-surface conditions, and synoptic-scale processes [
32,
33]. Both natural and anthropogenic factors contribute to increasing dust frequency and intensity [
34,
35]. Climate change and land degradation further enhance dust emissions and modify long-term trends [
36]. Advances in remote sensing and statistical approaches have improved dust monitoring [
37,
38,
39], yet a comprehensive national-scale understanding of long-term dust variability remains limited.
Despite progress in environmental modeling, the application of advanced machine-learning and deep-learning approaches for dust forecasting in the Middle East is still limited. Recent developments—such as FU-NetCast for wildfire prediction [
40], LSTM-based oil spill modeling [
41], hybrid Naïve Bayes–CNN dust prediction [
42], CNN–LSTM dust evolution forecasting [
43], and CNN-based short-term dust prediction using MERRA-2 AOD [
44]—demonstrate the potential of deep learning for atmospheric hazard prediction. Moreover, climate-change-driven increases in dust activity highlight the need for reliable forecasting systems, with CNN-LSTM and ConvLSTM models showing improved performance when trained on MERRA-2 meteorological and dust-related data [
45].
Given these gaps, this study provides an integrated spatiotemporal assessment of dust-storm activity across Iran from 2003 to 2022 using multiple complementary methods. Descriptive statistics from 50 synoptic stations characterize dust-day variability; long-term trends are evaluated using the Mann–Kendall test and Sen’s slope; extreme events are modeled using the Generalized Extreme Value (GEV) distribution; spatial clustering via K-means identifies homogeneous dust regimes; and Long Short-Term Memory (LSTM) networks are applied to forecast dust activity at key stations. Together, these methods offer a unified framework for understanding Iran’s dust climatology and supporting environmental risk-management strategies.
The remainder of this paper is organized as follows:
Section 2 describes the datasets and methodology;
Section 3 presents the results;
Section 4 discusses the findings; and
Section 5 concludes the study and outlines future research directions.
2. Materials and Methods
2.1. Study Area
Iran covers approximately 1.65 million km2 in Southwest Asia, extending between 25–40° N and 44–63° E. The country exhibits substantial topographic diversity, ranging from the low-lying basins of southeastern Iran to the high elevations of the Zagros and Alborz mountain ranges. This complex terrain shapes a wide spectrum of climatic conditions, from semi-humid zones in the north to hyper-arid regions across the central and southeastern parts of the country.
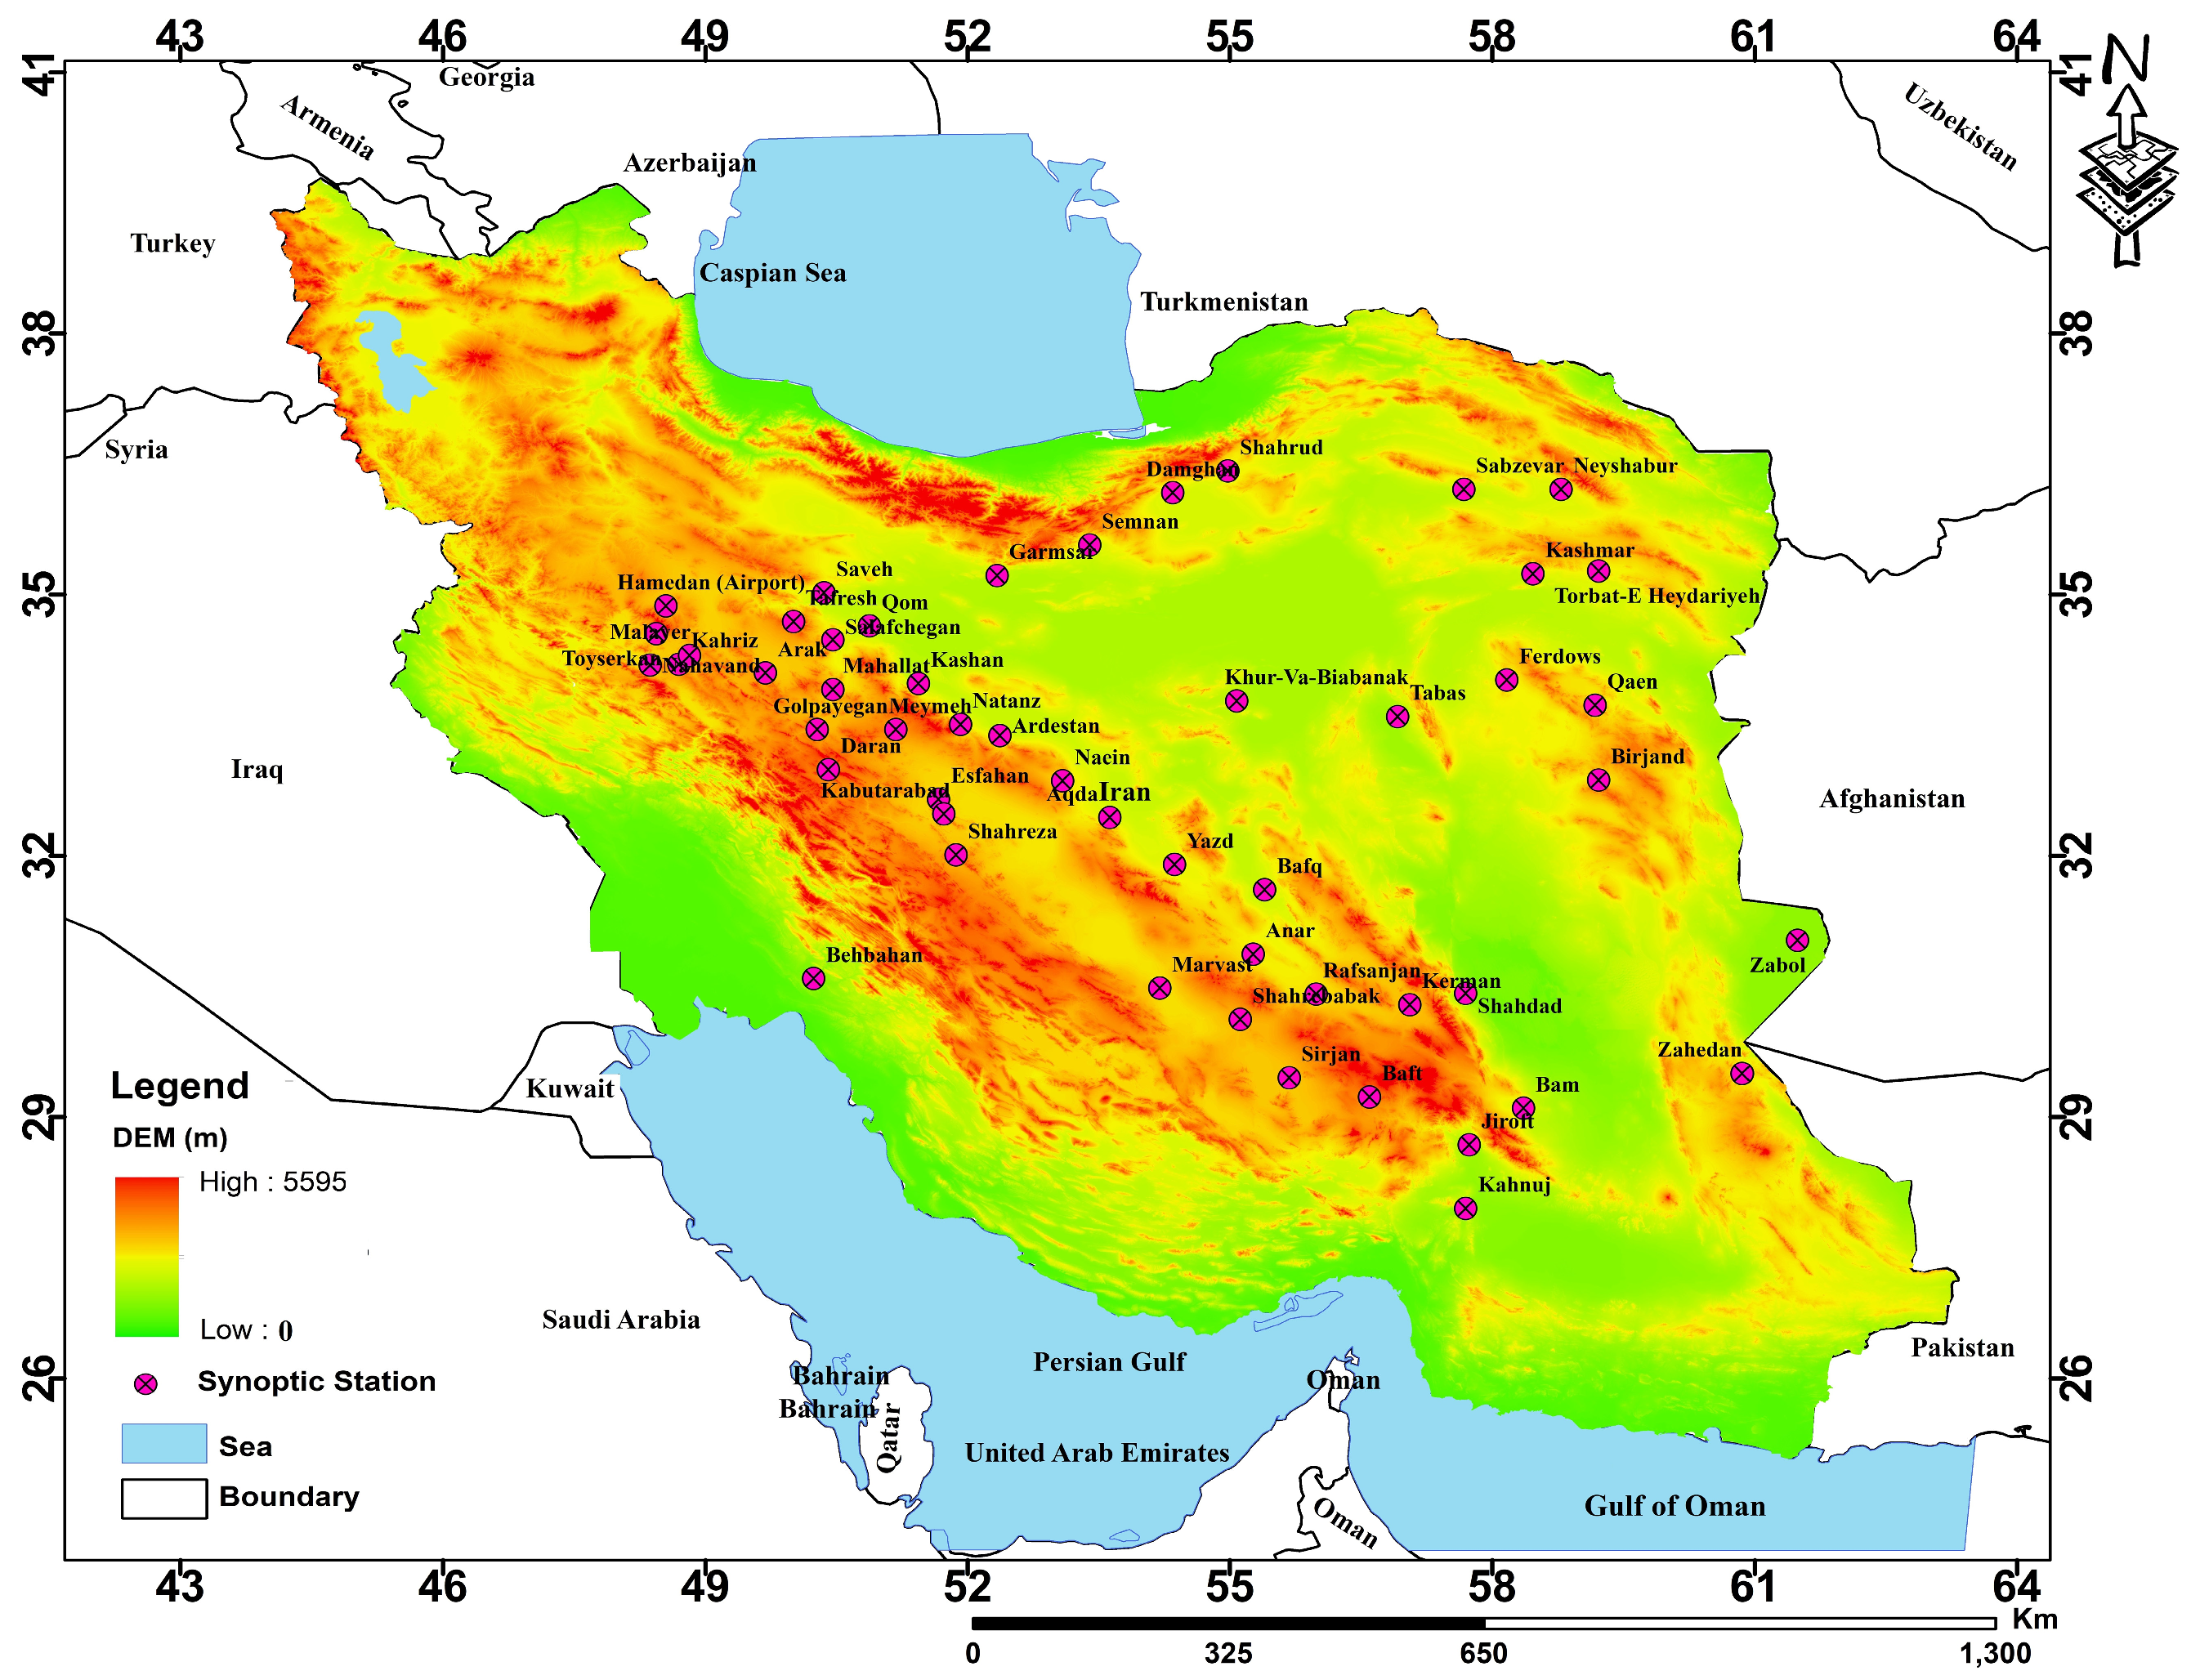
The central, eastern, and southeastern provinces—including Yazd, Kerman, Sistan and Baluchestan, and South Khorasan—experience the highest dust activity. This is largely due to the influence of the 120-day winds of Sistan, extensive desert surfaces, and the interaction of both domestic and trans-boundary dust sources. According [
33], a significant proportion of dust events affecting western and southwestern Iran originate from external sources, particularly the Iraqi and Mesopotamian plains, where prolonged droughts and reduced vegetation cover intensify dust emissions. These external sources, combined with local desert basins, contribute to the widespread and recurrent dust activity observed across the country (
Figure 1).
The Central Plateau is especially prone to dust generation due to its arid to hyper-arid climate, with annual precipitation often below 150 mm, extremely high potential evapotranspiration, low soil moisture, sparse vegetation, and large diurnal temperature variations. These environmental conditions collectively enhance wind erosion and facilitate the activation of major dust-source areas across Iran.
2.2. Method and Data
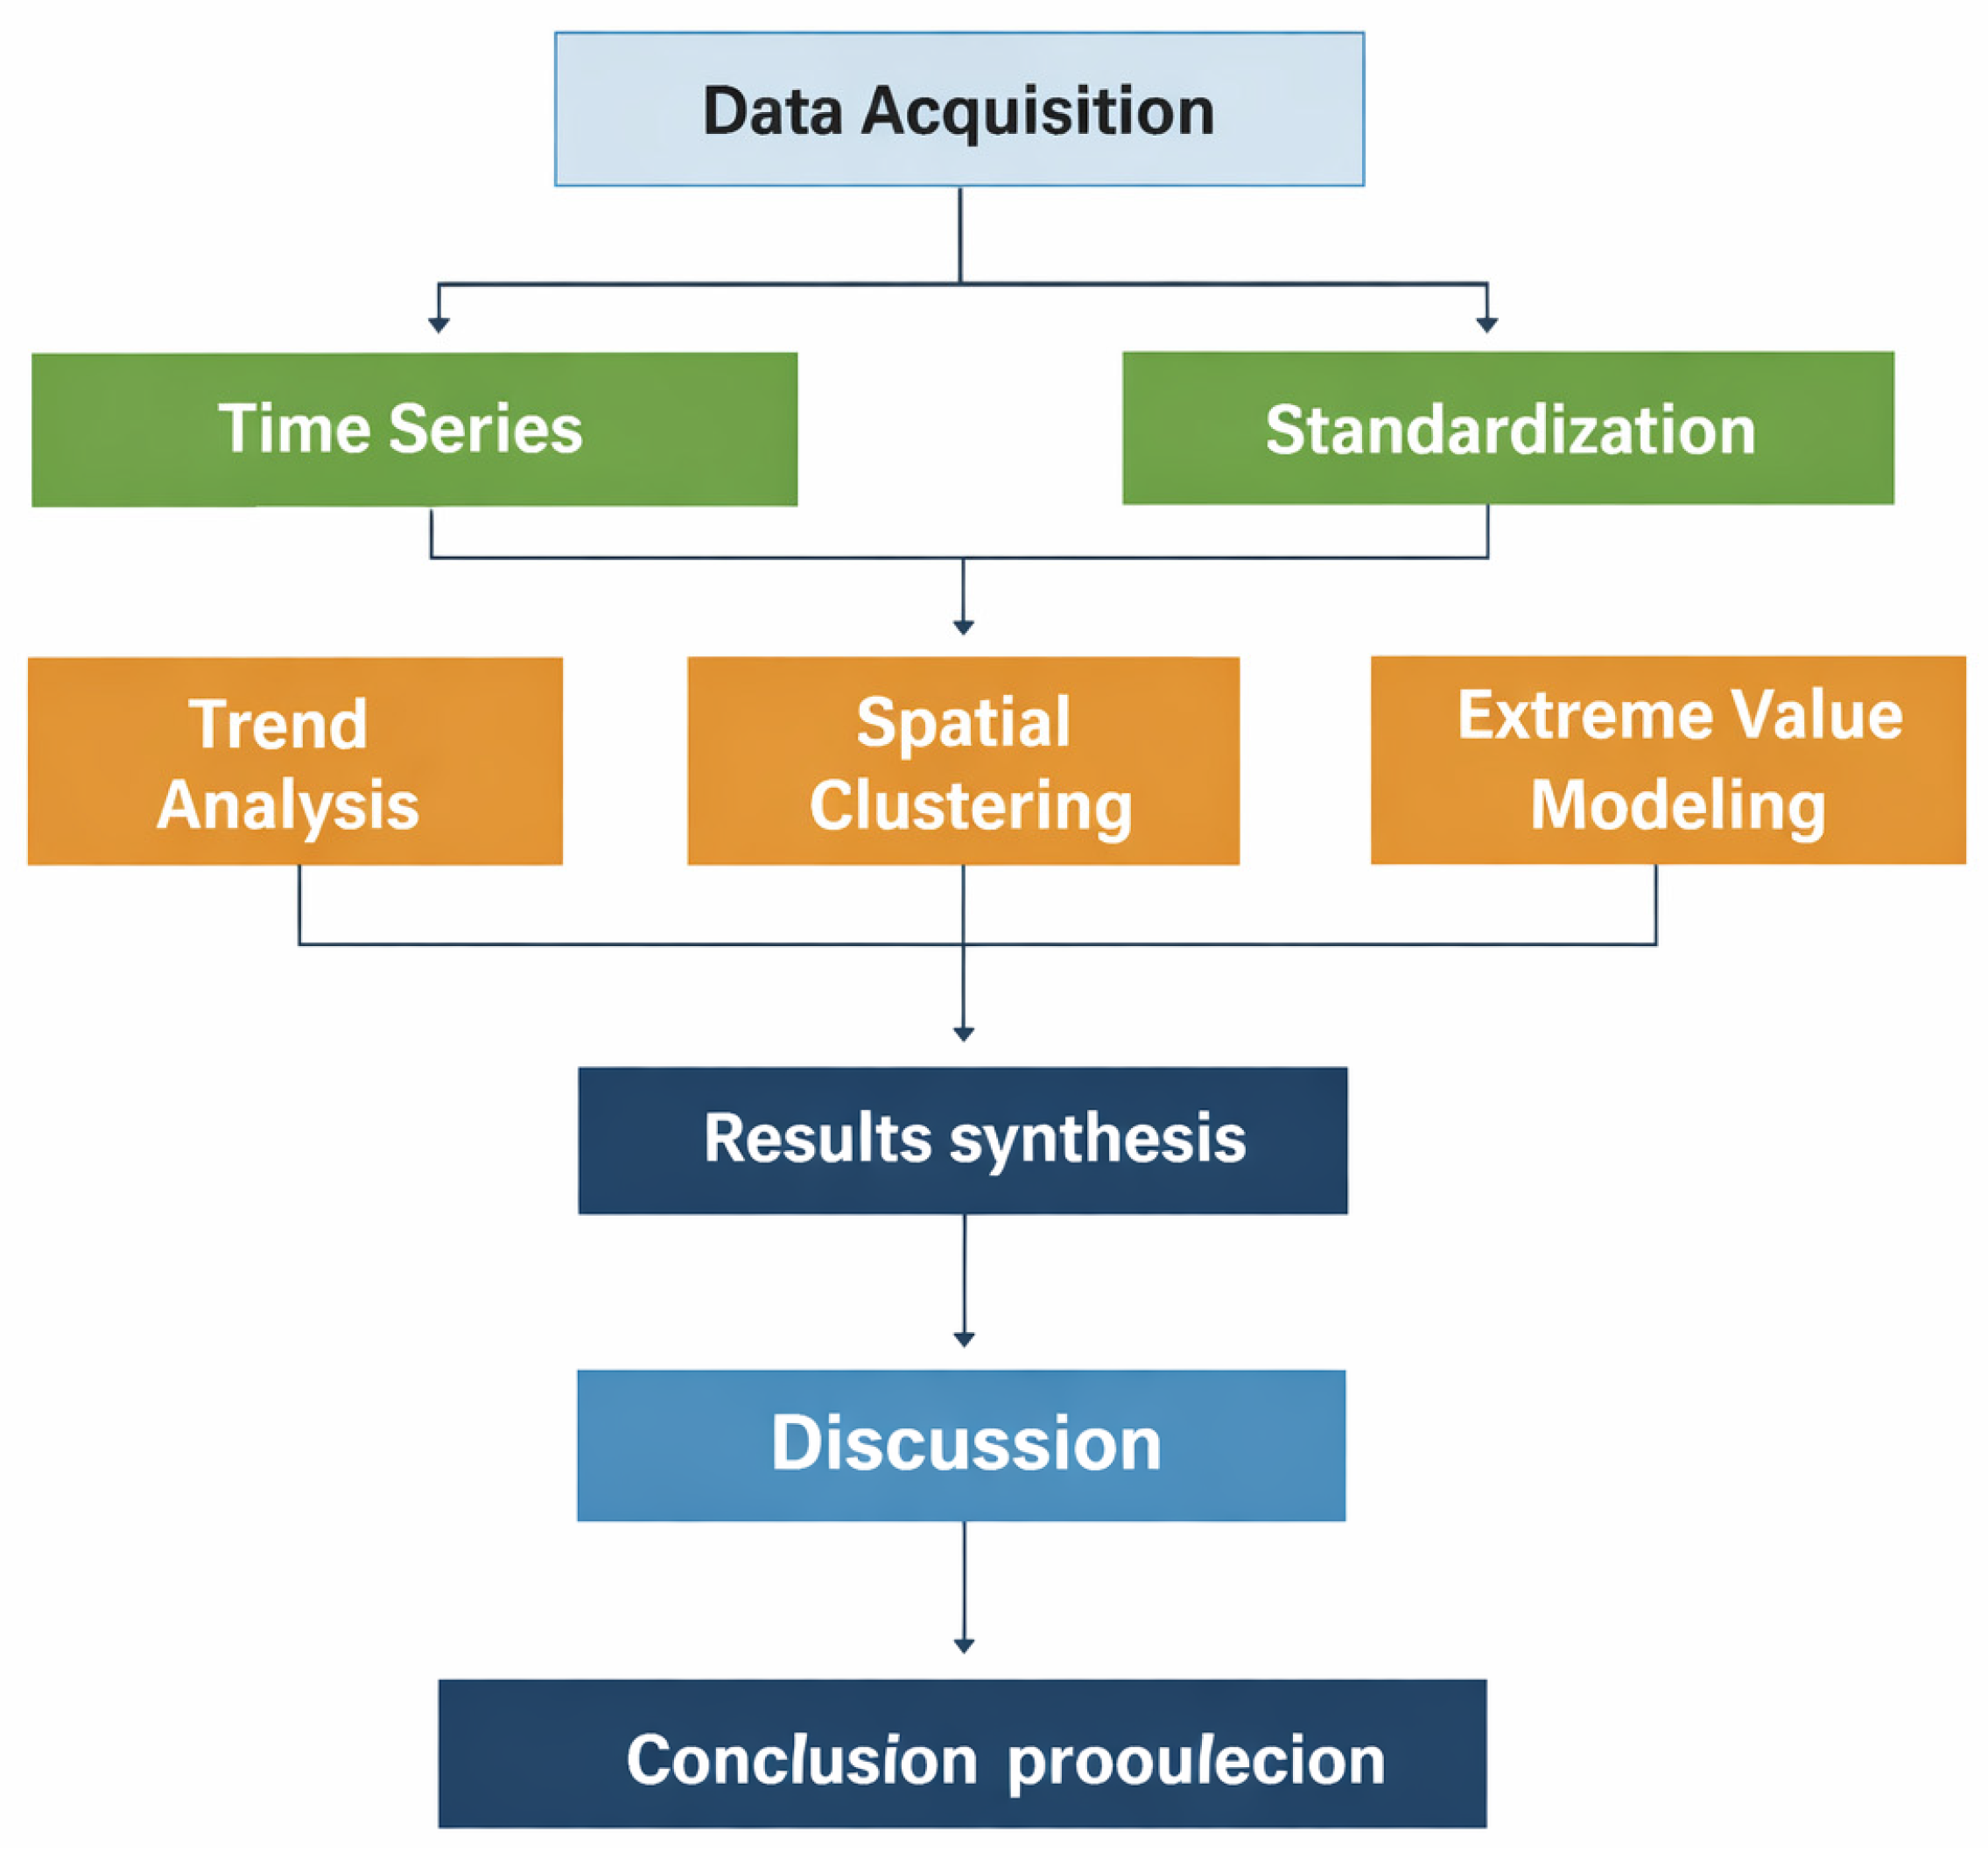
The methodological workflow of this study follows a structured, data-driven pipeline that progresses from raw data acquisition to long-term forecasting. First, 20 years of dust-day observations from 50 synoptic meteorological stations were collected, cleaned, and standardized together with their geographic metadata to establish a reliable dataset for analysis (
Table 1). After preparing the time series and extracting fundamental statistical indicators, temporal variability was assessed using the Mann–Kendall test and Sen’s slope estimator to quantify the direction and magnitude of long-term trends.
Extreme dust behavior was then evaluated through Generalized Extreme Value (GEV) distribution fitting, enabling estimation of return levels and return periods for severe dust events. Spatial patterns were examined using K-means clustering applied to combined statistical and geographic features to identify coherent dust-prone regions. Finally, a Long Short-Term Memory (LSTM) neural network model was implemented to generate 5-year and 10-year forecasts for selected key stations. All analytical components were subsequently integrated into a comprehensive regional assessment that synthesizes historical variability, current conditions, and future projections of dust activity (
Figure 2).
In this study, dusty days were identified based on the weather codes reported in observations from synoptic meteorological stations across Iran. These stations follow the World Meteorological Organization (WMO) coding system, in which specific weather codes are assigned to different types of dust phenomena, including suspended dust, dust raised by local winds, blowing dust, and dust storms of varying intensities. A day was classified as a dusty day when at least one dust-related code was recorded in any of the reports during the 24 h period. The dust-related codes used in this study, along with their descriptions, are summarized in
Table 2.
Dust-related observations were collected from synoptic meteorological stations located between 25–40° N and 44–63° E. The station coordinate file (latitude–longitude) was merged with the cluster assignment dataset, and to avoid spatial inconsistencies, station names were cleaned through text normalization procedures, including character unification, removal of extra spacing, and standardization of naming formats. The datasets were combined using an outer join to ensure that no station was lost during merging, and stations with missing or invalid coordinates were removed. The dust time-series for each station was then aggregated to extract primary metrics such as annual dust-day counts, relative intensity, and temporal behavior. To eliminate scale differences among variables, all features were standardized using Z-score normalization, expressed as
where X is the observed value, μ is the mean, and σ is the standard deviation of the corresponding time series. This preprocessing step ensures that all variables contribute equally to the clustering algorithm and prevents bias caused by variables with larger numerical ranges. For each station, key dust metrics were extracted from the time series of annual dust-day counts to characterize the statistical behavior and intensity of dust activity. The annual number of dust days was computed, followed by the calculation of mean, maximum, and standard deviation as baseline indicators. To quantify relative intensity, a normalized intensity index was derived using
where
represents the annual dust-day count for a given station,
is the minimum observed value across the entire dataset, and
is the maximum. This index enables direct comparison of dust intensity among stations with different ranges. Temporal behavior was assessed by aggregating the time series into seasonal and annual scales, and long-term variability was examined using a three-year moving average. These extracted metrics served as the input features for the clustering algorithm to classify stations based on their dust-related statistical characteristics.
2.2.1. Mann–Kendall (MK) Test and Sen’s Slope
To evaluate long-term changes in dust activity across stations, two non-parametric statistical methods were applied: the Mann–Kendall (MK) trend test and Sen’s Slope estimator. These methods are widely used in environmental and climatic studies due to their robustness against non-normality and outliers. The MK test was used to detect the presence of increasing or decreasing trends in the annual dust-day time series. The MK statistic is computed as
where
represents annual dust-day values, and the sign function is defined as
For large samples, the standardized MK statistic is
A positive
indicates an increasing trend, while a negative
indicates a decreasing trend. Statistical significance was assessed using the
p-value. Trend magnitude was quantified using Sen’s Slope, computed as the median of all pairwise slopes:
where
represents the annual rate of change (days per year).
2.2.2. Generalized Extreme Value (GEV) Model
To characterize extreme dust activity and estimate the likelihood of severe events, the Generalized Extreme Value (GEV) distribution was fitted to the annual maximum dust-day series for each station. The GEV distribution is defined by three parameters: shape (ξ), scale (σ), and location (μ). The cumulative distribution function is
where
is the location parameter,
> 0 is the scale parameter,
is the shape parameter controlling tail behavior.
After fitting the GEV model for each station, return periods for thresholds of 30, 40, and 50 dust days were computed using
where
is the dust-day threshold.
2.2.3. Station Clustering
To classify the stations based on their dust-related statistical characteristics, the K-means clustering algorithm was applied, which is a widely used unsupervised method. The objective of K-means is to minimize the total within-cluster variance, expressed by the cost function:
where
is the number of clusters,
is the set of stations assigned to cluster
,and
is the feature vector of each station (including intensity, frequency, and temporal behavior), and
is the centroid of cluster
, computed as the mean of all points in that cluster. The distance between each station and the cluster centroids was calculated using the Euclidean distance, defined as
where n is the number of features,
is the value of feature j for the station, and
is the corresponding value in the centroid. The number of clusters was set to k = 3 based on preliminary tests and the inherent structure of the dataset, allowing the identification of three distinct dust–climatic regions. The algorithm iterated until convergence, and each station was ultimately assigned to the nearest centroid. This clustering step enabled a meaningful regionalization of dust behavior and served as the foundation for subsequent spatial and climatic interpretation.
2.2.4. Long Short-Term Memory (LSTM)
Machine Learning techniques were employed to forecast future dust-day behavior, specifically using a Long Short-Term Memory (LSTM) neural network. Machine learning served as a data-driven approach to capture nonlinear patterns and temporal dependencies in the dust-day time series. LSTM, a specialized form of recurrent neural network (RNN), incorporates internal memory cells that enable learning of long-term dependencies. Each LSTM unit contains three gates—forget, input, and output—that regulate information flow. The forget gate determines how much past information is retained:
: Forget-gate activation; determines how much of the previous cell state Ct−1 should be retained.
σ: Sigmoid activation function that maps values to the range (0,1).
: Weight matrix associated with the forget gate.
: Hidden state from the previous time step.
: Input vector at time t.
: Bias term for the forget gate.
The input gate controls the incorporation of new information:
: Input-gate activation; controls how much new information enters the cell state.
: Weight matrix for the input gate.
: Bias term for the input gate.
: Candidate cell state generated using the tanh activation function.
: Weight matrix for generating the candidate cell state.
: Bias term for the candidate cell state.
The cell state is updated as
: updated cell state at time t; represents the long-term memory of the network.
: previous cell state.
: element-wise multiplication.
Combination of and : Determines how much old memory is kept and how much new information is added.
The output gate produces the final hidden state:
—output-gate activation; controls how much of the cell state contributes to the hidden state.
: weight matrix for the output gate.
: bias term for the output gate.
: final hidden state at time t; also serves as the output of the LSTM unit.
tanh(): Activated version of the cell state used to generate the output.
Where
is the annual dust-day input, and ht is the hidden output. Prior to modeling, the time series was normalized using Min–Max Scaling:
The model architecture consisted of an LSTM layer, a Dropout layer to prevent overfitting, and a Dense output layer. The loss function was the Mean Squared Error (MSE):
Optimization was performed using the Adam algorithm, which accelerates convergence by combining momentum and adaptive learning rates. The dataset was split into training and testing subsets, and model performance was evaluated by comparing observed and predicted values.
3. Results
3.1. Descriptive Statistics of Dust Days
The descriptive statistics derived from the 20-year dataset reveal substantial differences in the magnitude and range of dust-day occurrences across the stations(
Table 3). Several locations, such as Zabol, Zahedan, Tabas, and Naein, record markedly high mean values, accompanied by large maximum counts that indicate the presence of intense dust years within their observational period. In contrast, stations including Baft, Shahrud, Sirjan, and Damghan exhibit very low mean and maximum values, reflecting limited dust exposure. The minimum values, which reach zero in many stations, show that dust-free years are common in several regions. Overall, the table highlights the broad numerical spread of dust activity across Iran, ranging from persistently high-dust environments to stations with only occasional dust occurrences.
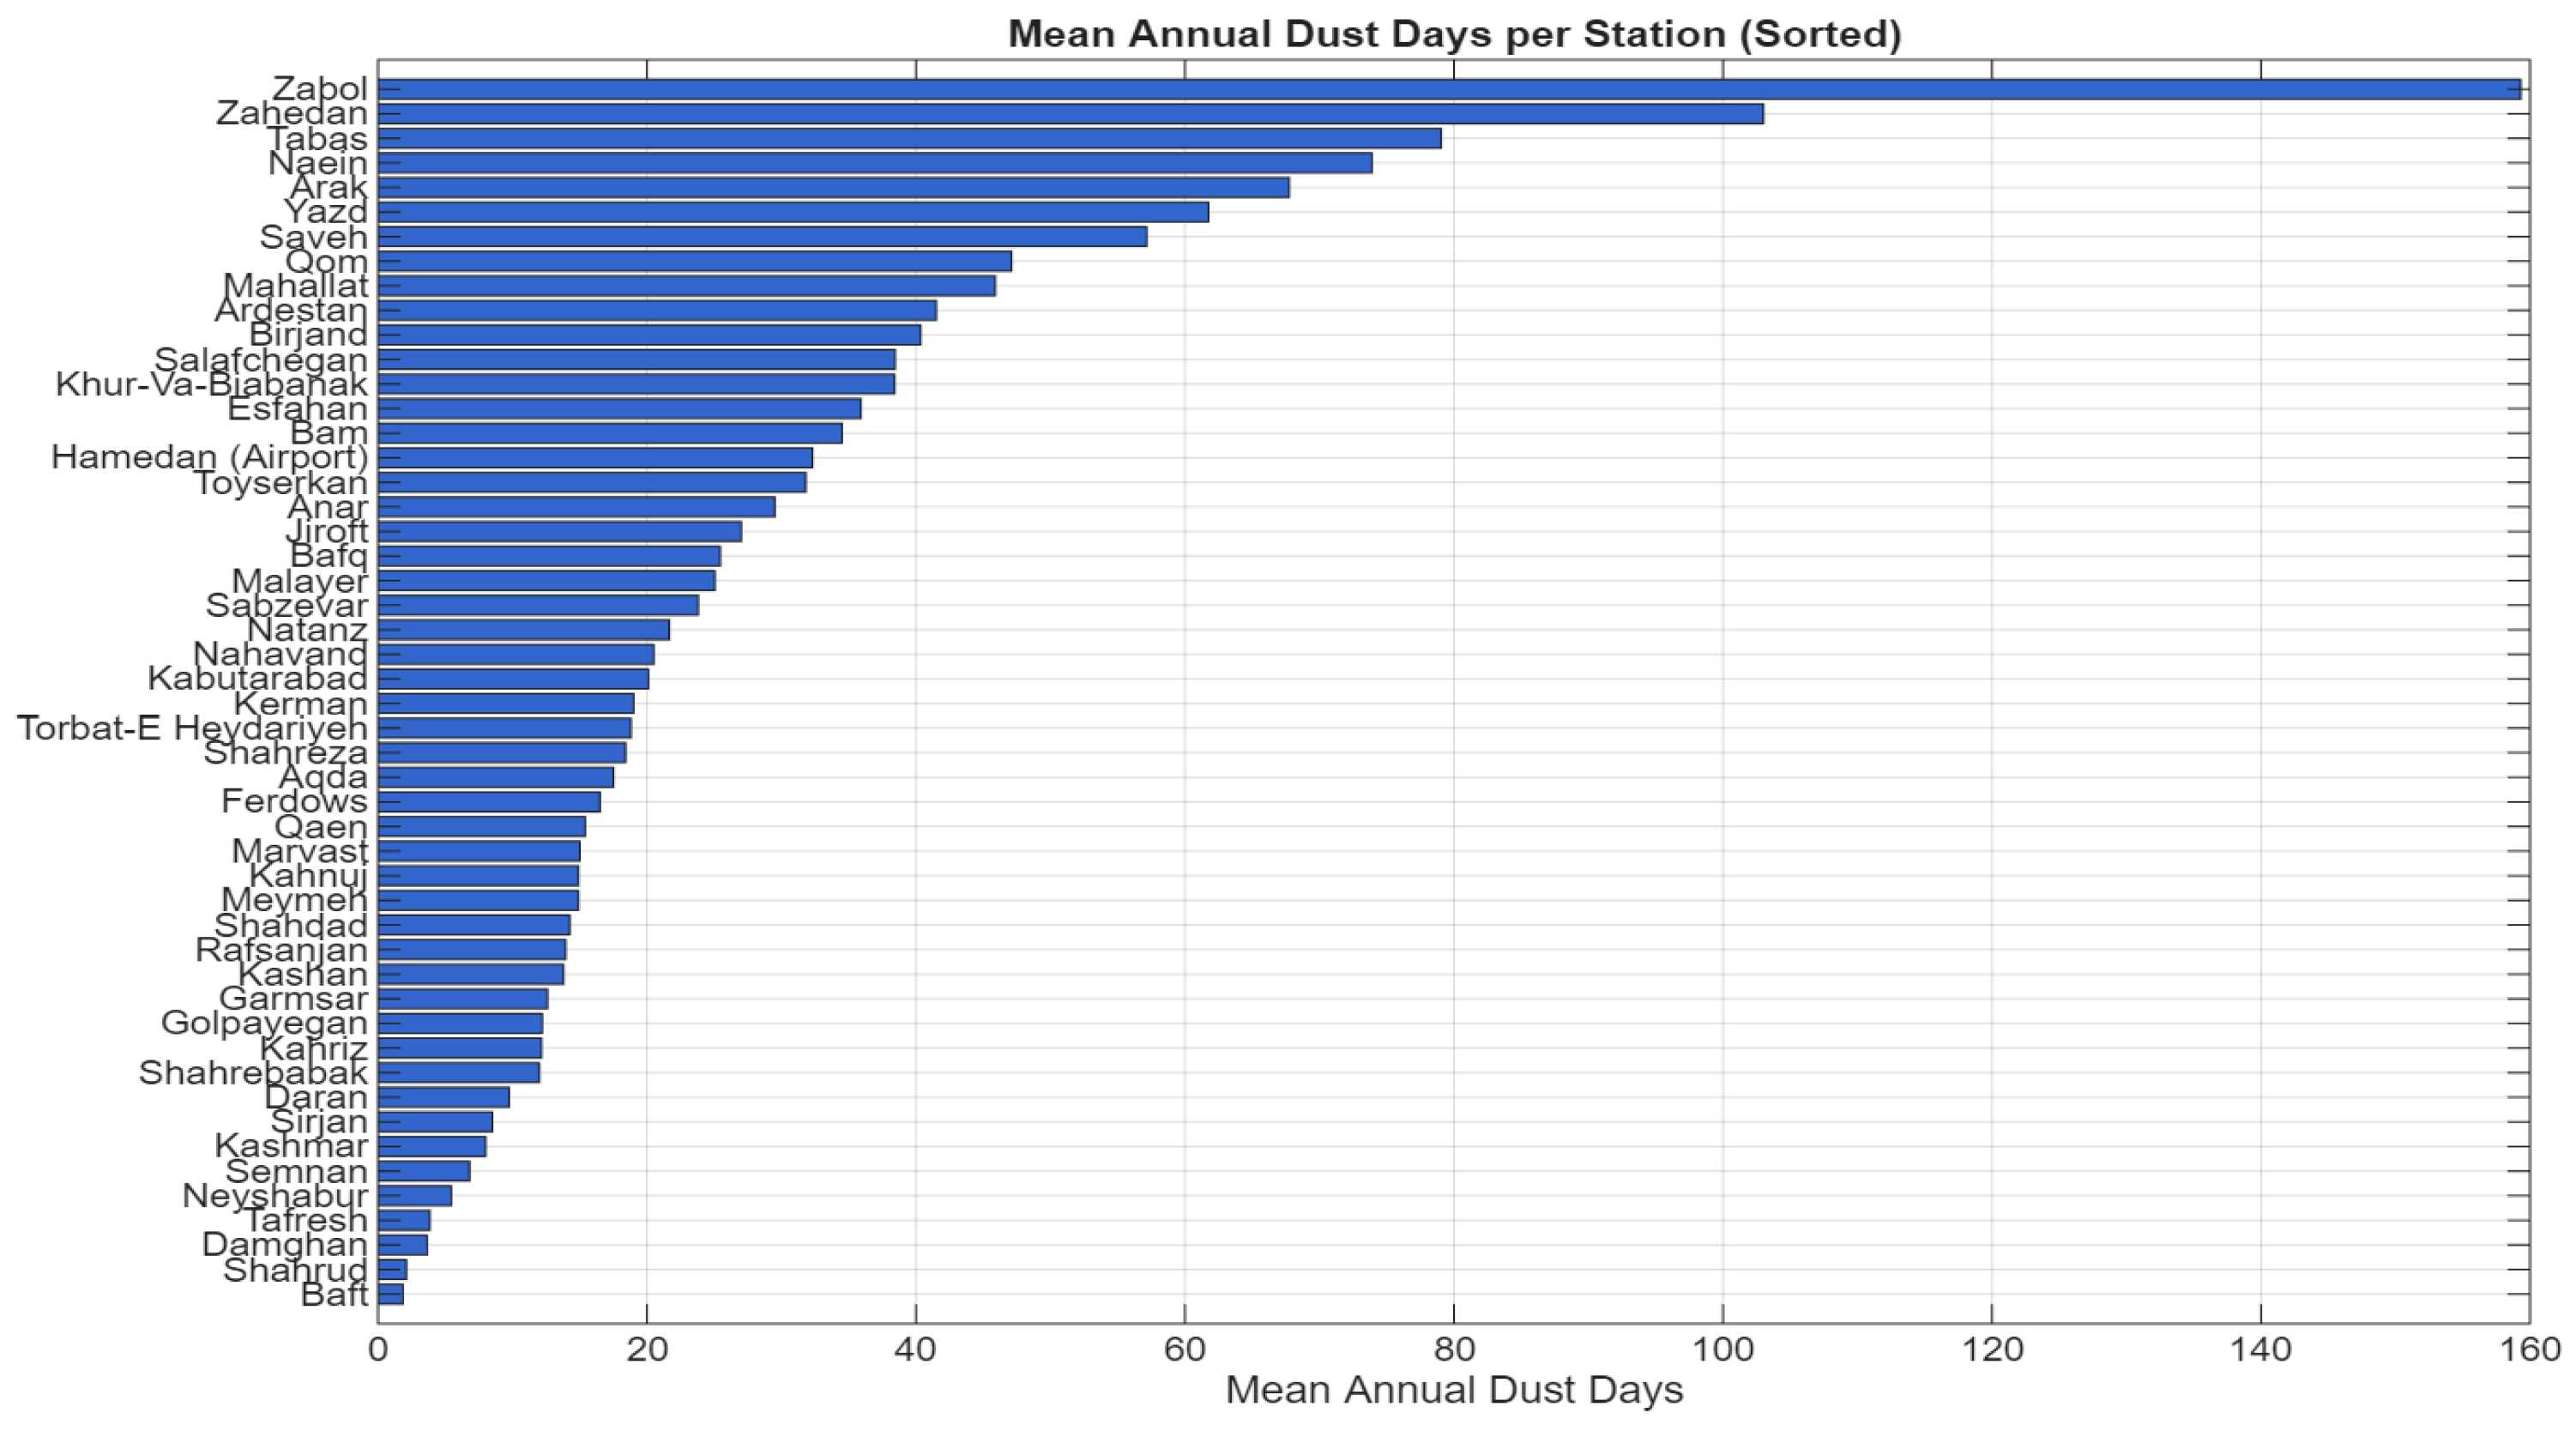
The sorted bar chart provides a clear ranking of stations based on their mean annual dust-day frequency. A small group of stations occupies the upper end of the distribution, forming a distinct cluster of high-dust locations, while the majority of stations fall within moderate to low ranges. The visual ordering emphasizes the relative position of each station rather than absolute statistical variation, allowing rapid comparison of dust exposure levels across the network. The chart also highlights the contrast between the highest-ranked stations and the broad mid-range group, illustrating how dust activity is concentrated in a limited number of locations while remaining substantially lower elsewhere (
Figure 3).
Figure 4 showed that the dominance of Zabol as the most dust-affected station, with a substantial gap separating it from the second-ranked station, Zahedan. The pronounced difference reflects the exceptional dust burden in the Sistan region. Central stations such as Yazd, Esfahan, and Kerman occupy mid-range positions, while western and northern stations show the lowest dust frequencies. The ranking effectively captures the magnitude and spatial variability of dust exposure across Iran.
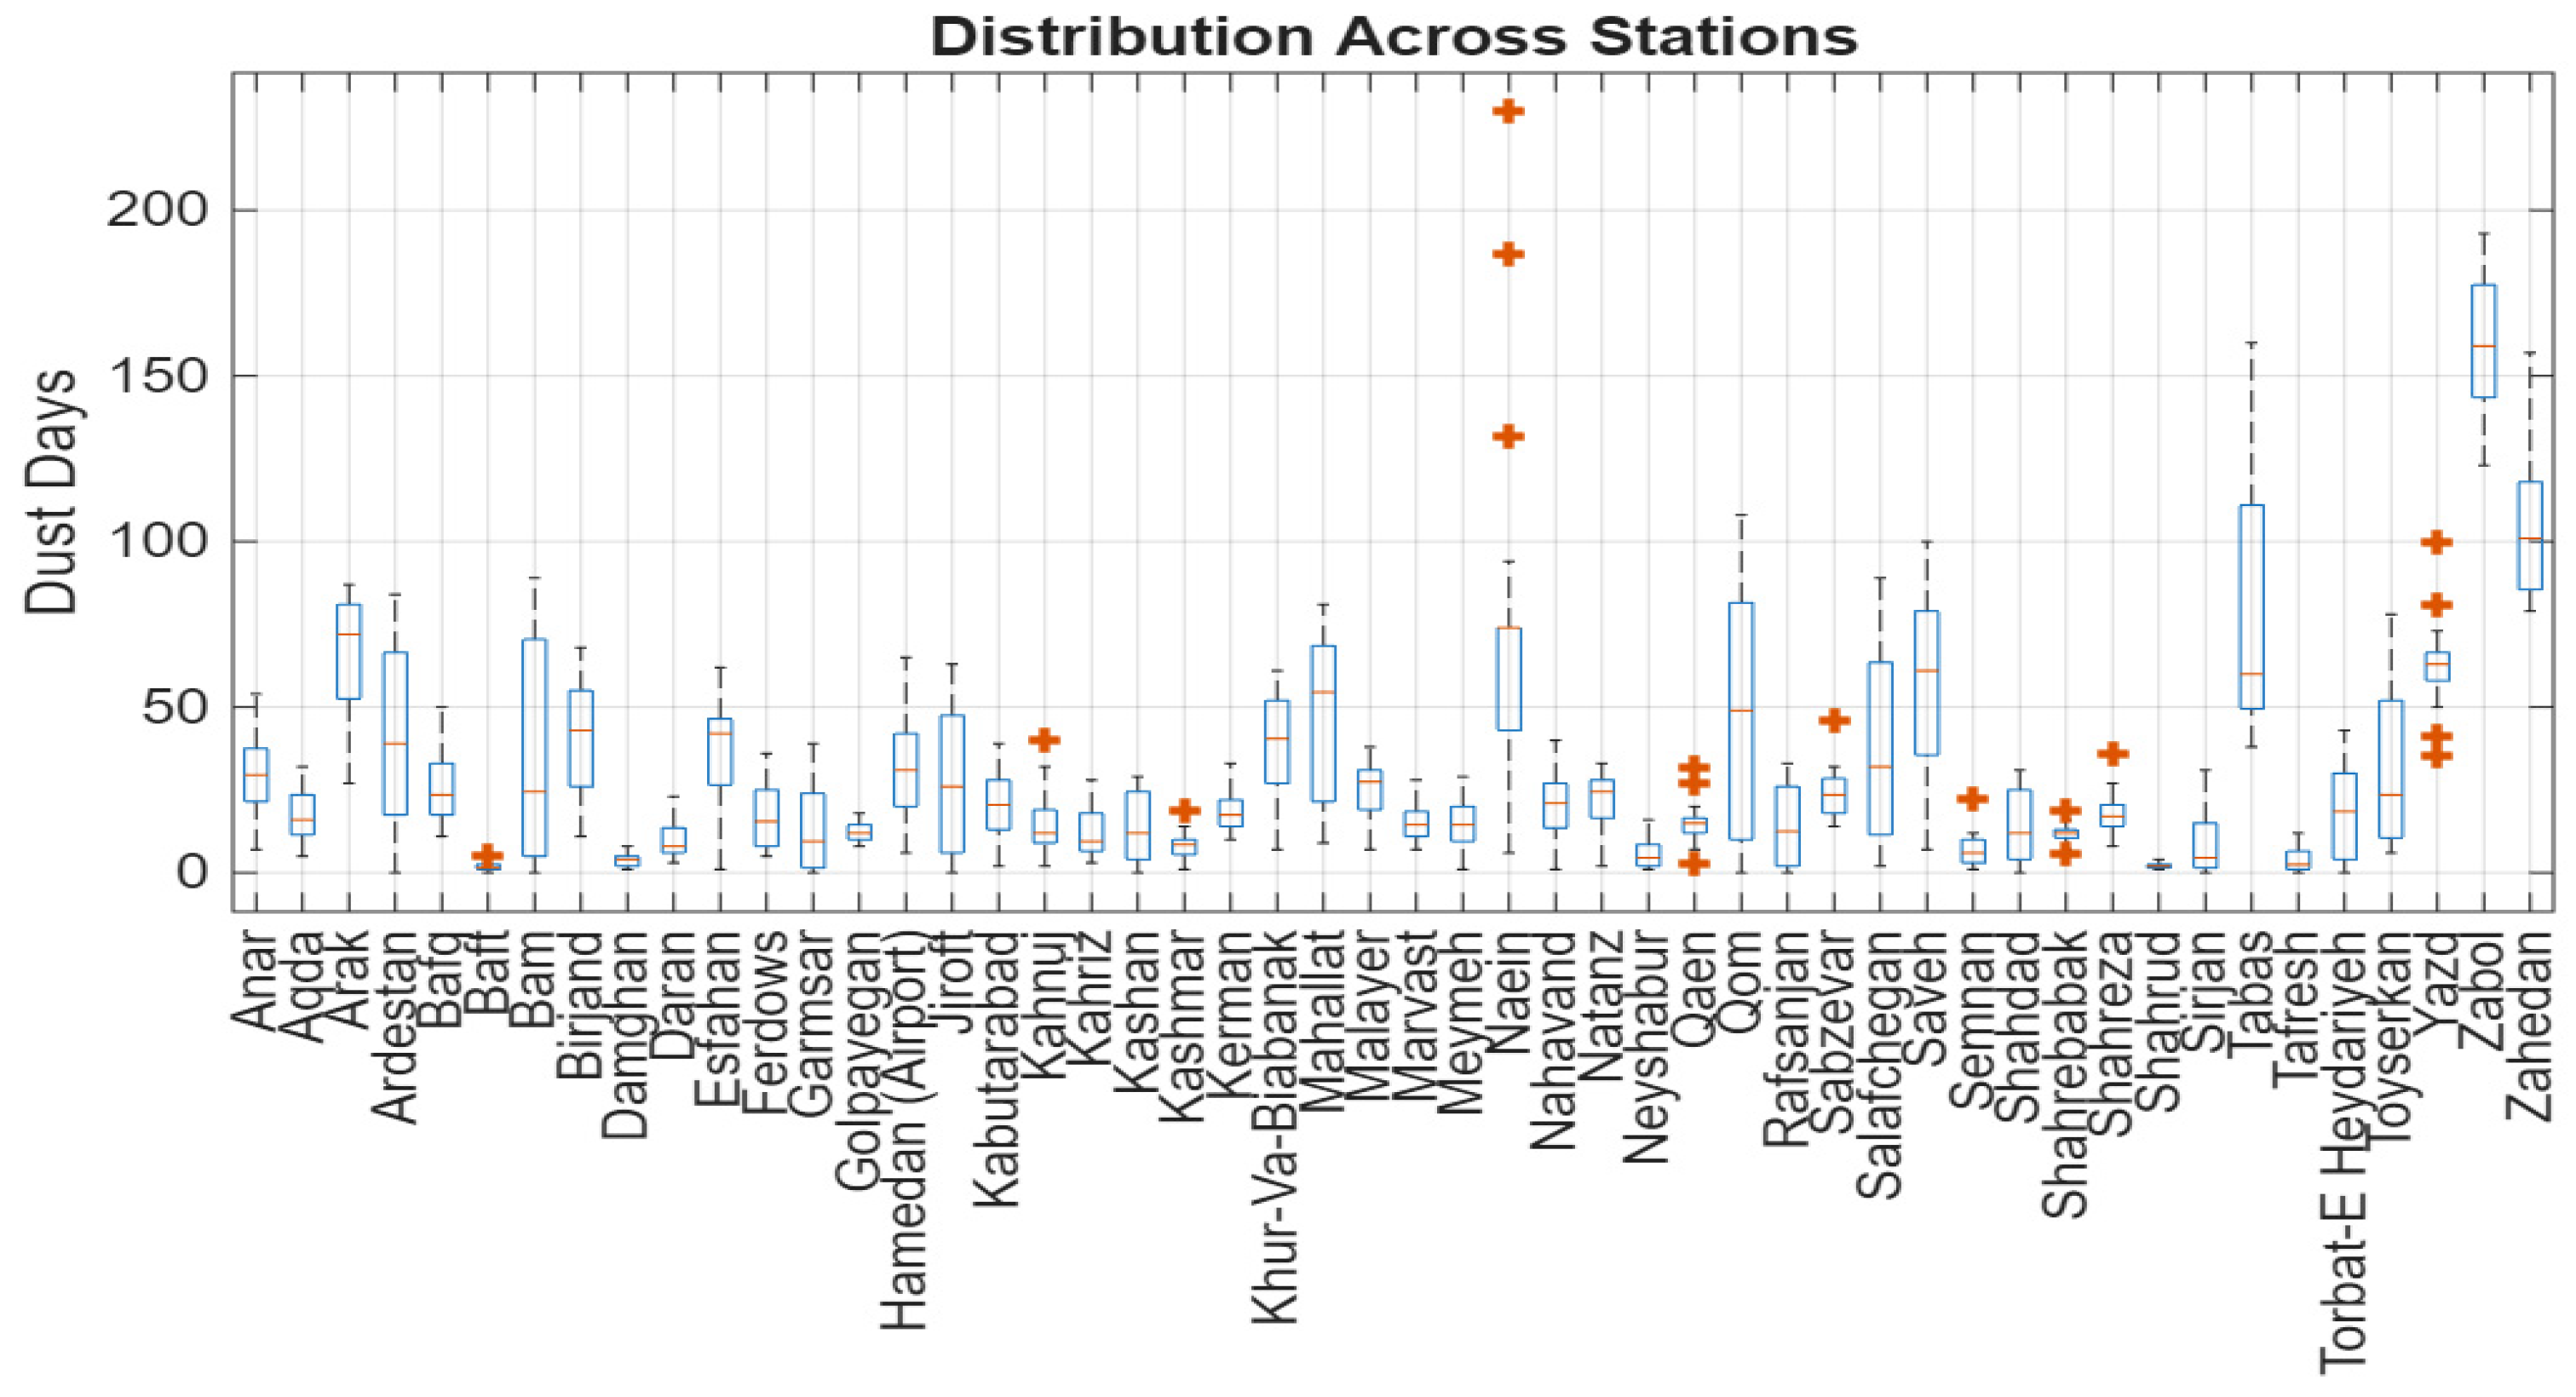
The box-plot illustrates the distributional characteristics of dust-day counts across stations, emphasizing variability rather than magnitude. Several stations display wide interquartile ranges and numerous outliers, indicating substantial fluctuations from year to year and the occurrence of extreme dust seasons. In contrast, many stations exhibit compact box structures with limited spread, reflecting stable dust conditions and low inter-annual variability. The presence and frequency of outliers further distinguish stations with episodic extreme events from those with consistently low dust activity. This visualization highlights the diversity of temporal dust behavior across the monitoring network.
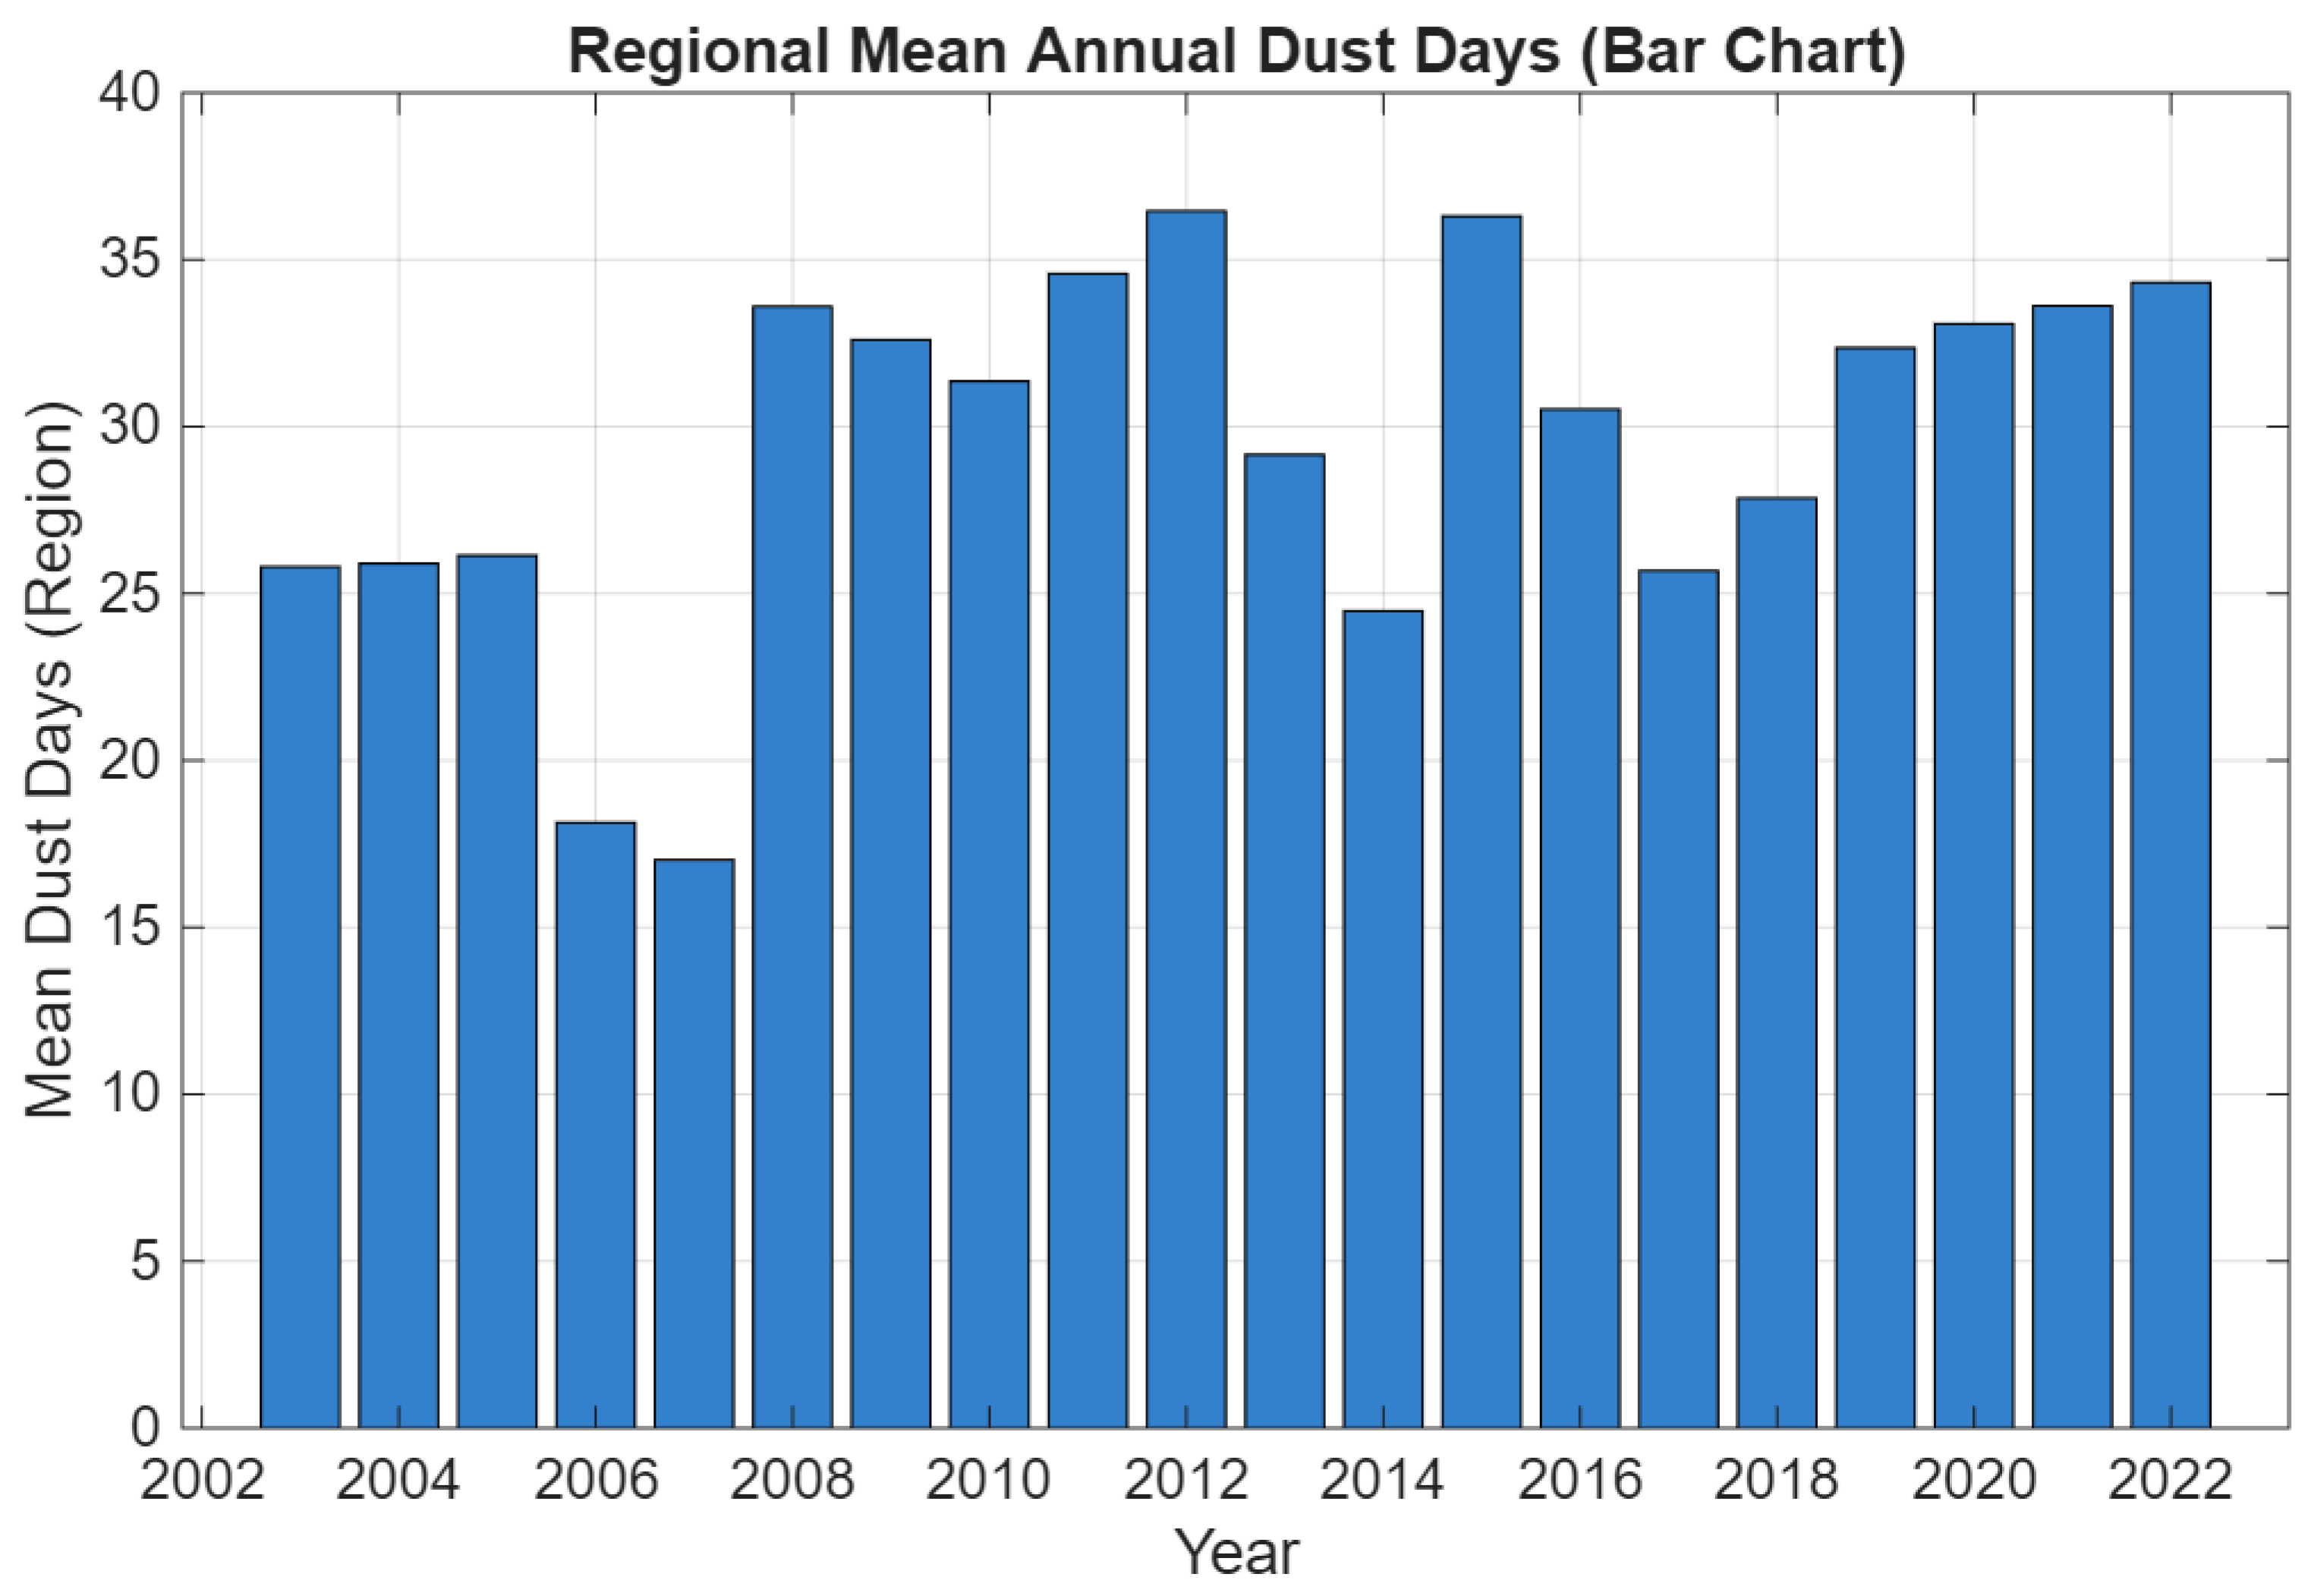
Figure 5 illustrates the long-term trend of mean annual dust day counts across Iran during 2003–2022. The time series shows distinct peaks in 2008, 2012, and 2015, which were likely associated with periods of severe drought, reduced soil moisture, and intensified surface wind activity over eastern and southeastern Iran. Notable minima appear in 2007, 2014, and 2017, reflecting years with relatively wetter conditions and temporarily improved land surface and atmospheric stability. Since 2017, the regional mean has exhibited a gradual upward trend, which is probably linked to persistent drought conditions, vegetation degradation, and broader climatic shifts that have enhanced the activation of dust source areas in the region.
3.2. Trend Analysis
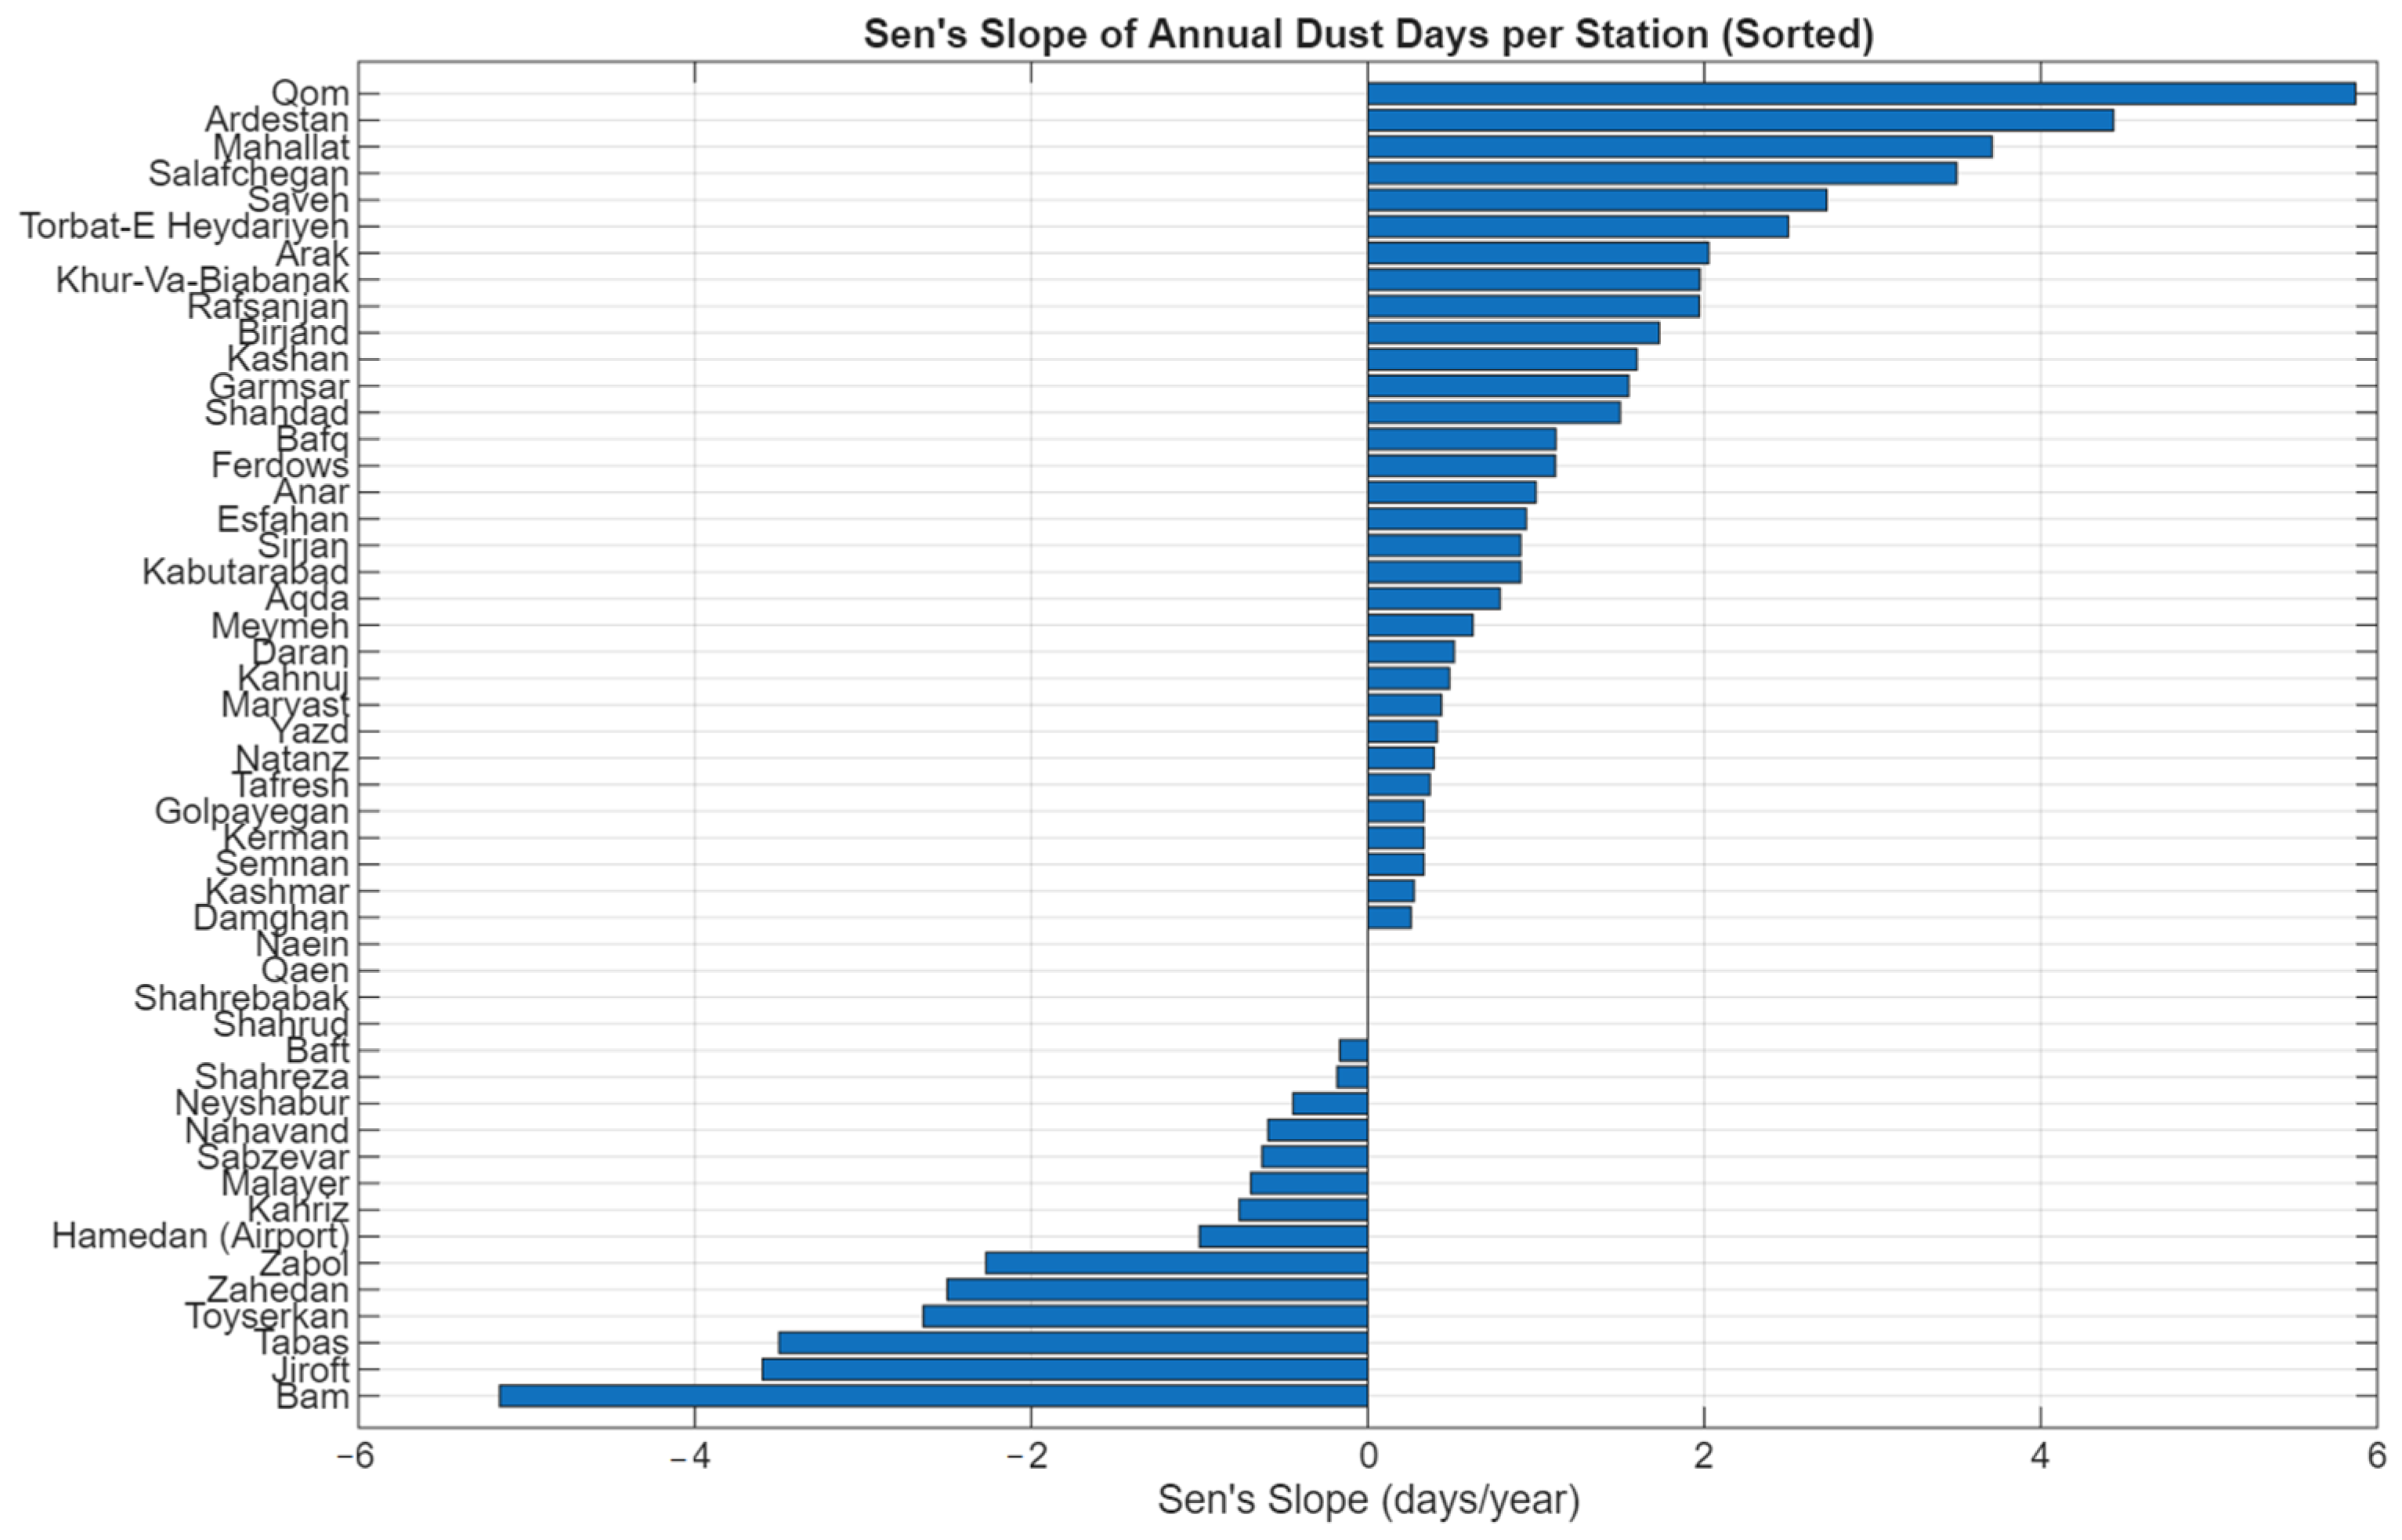
The results indicate clear regional contrasts in dust-day trends across Iran. Stations such as Qom, Ardestan, Mahallat, and Torbat-e Heydariyeh exhibit strong and statistically significant positive Sen’s slope values, corresponding to annual increases of roughly 2 to 6 dust days. These upward trends likely reflect intensified drought conditions, vegetation degradation, and the growing activation of local and regional dust sources. In contrast, stations including Zabol, Zahedan, and Tabas show significant negative slopes, suggesting a decline in dust frequency that may be associated with hydrological changes, improved land-surface conditions, or shifts in dominant wind regimes.
Figure 6 further reinforces these spatial contrasts by showing a clear divide between regions with increasing and decreasing dust activity. While southeastern Iran still records the highest overall dust-day counts, many central and northeastern stations now display positive slopes, indicating that dust activity in these areas is on an upward trajectory. This emerging pattern implies that future dust conditions in Iran—particularly in central and northeastern regions—may involve higher dust frequencies despite the historical dominance of southeastern dust sources. Collectively, these findings demonstrate that dust activity in Iran does not follow a uniform national trend; instead, each region exhibits a distinct trajectory shaped by localized climatic and hydrological processes, underscoring the need for region-specific environmental planning and climate-adaptation strategies.
Also, the regional trend analysis indicates a weak but near-significant upward trend in Iran’s mean annual dust days over the 2003–2022 period. The Sen’s slope value of 0.446 days per year suggests that, on average, dust frequency has increased by roughly half a day annually. Although the p-value is slightly above the 0.05 significance threshold, the overall pattern shows a gradual rise with periodic fluctuations. This trend likely reflects broader climatic shifts, recurrent droughts, and expanding desertification in central and northeastern regions of the country.
3.3. Spatial Clustering of Dust Regimes (K-Means)
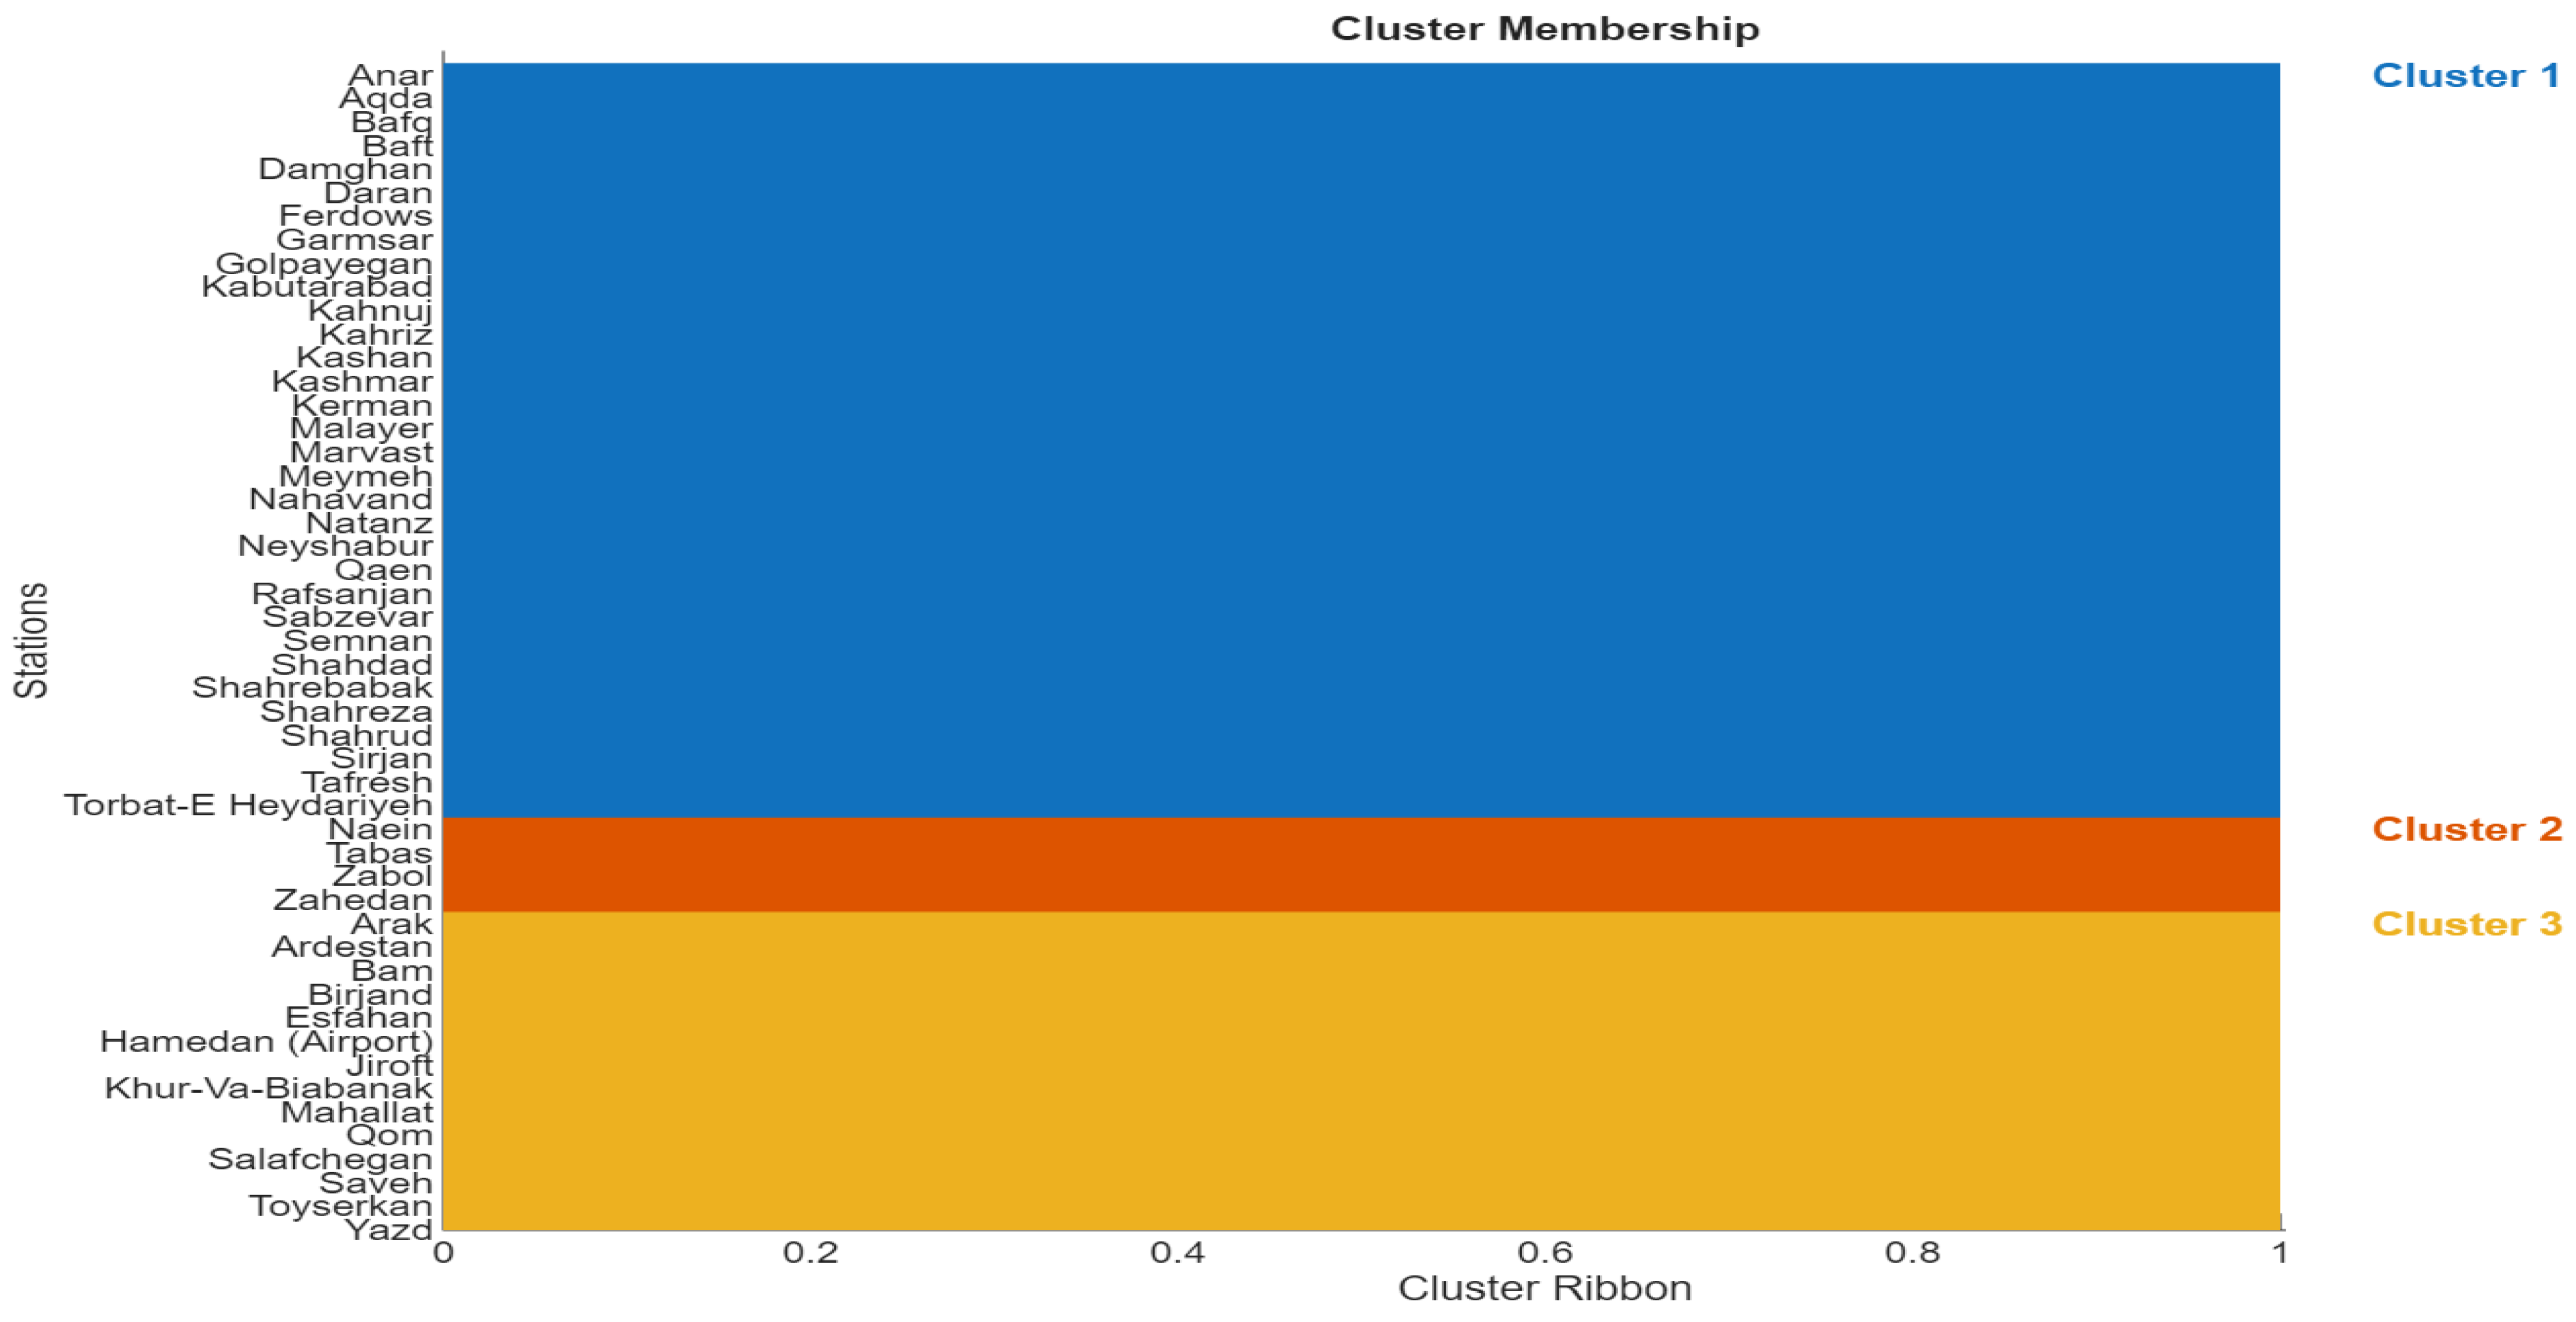
In this section, the dust-monitoring stations across Iran are classified into distinct groups using the K-means clustering algorithm, based on a combination of their statistical characteristics and geographical locations. This approach allows stations with similar dust-day behavior, such as comparable mean values, variability, and extreme occurrences, to be grouped together while also accounting for their spatial proximity. The primary objective of this clustering analysis is to identify homogeneous dust regimes across the country and to distinguish regions that exhibit consistent temporal and spatial patterns of dust activity. Such classification provides a clearer understanding of regional dust dynamics and supports more targeted environmental assessments and management strategies (
Table 4,
Figure 7).
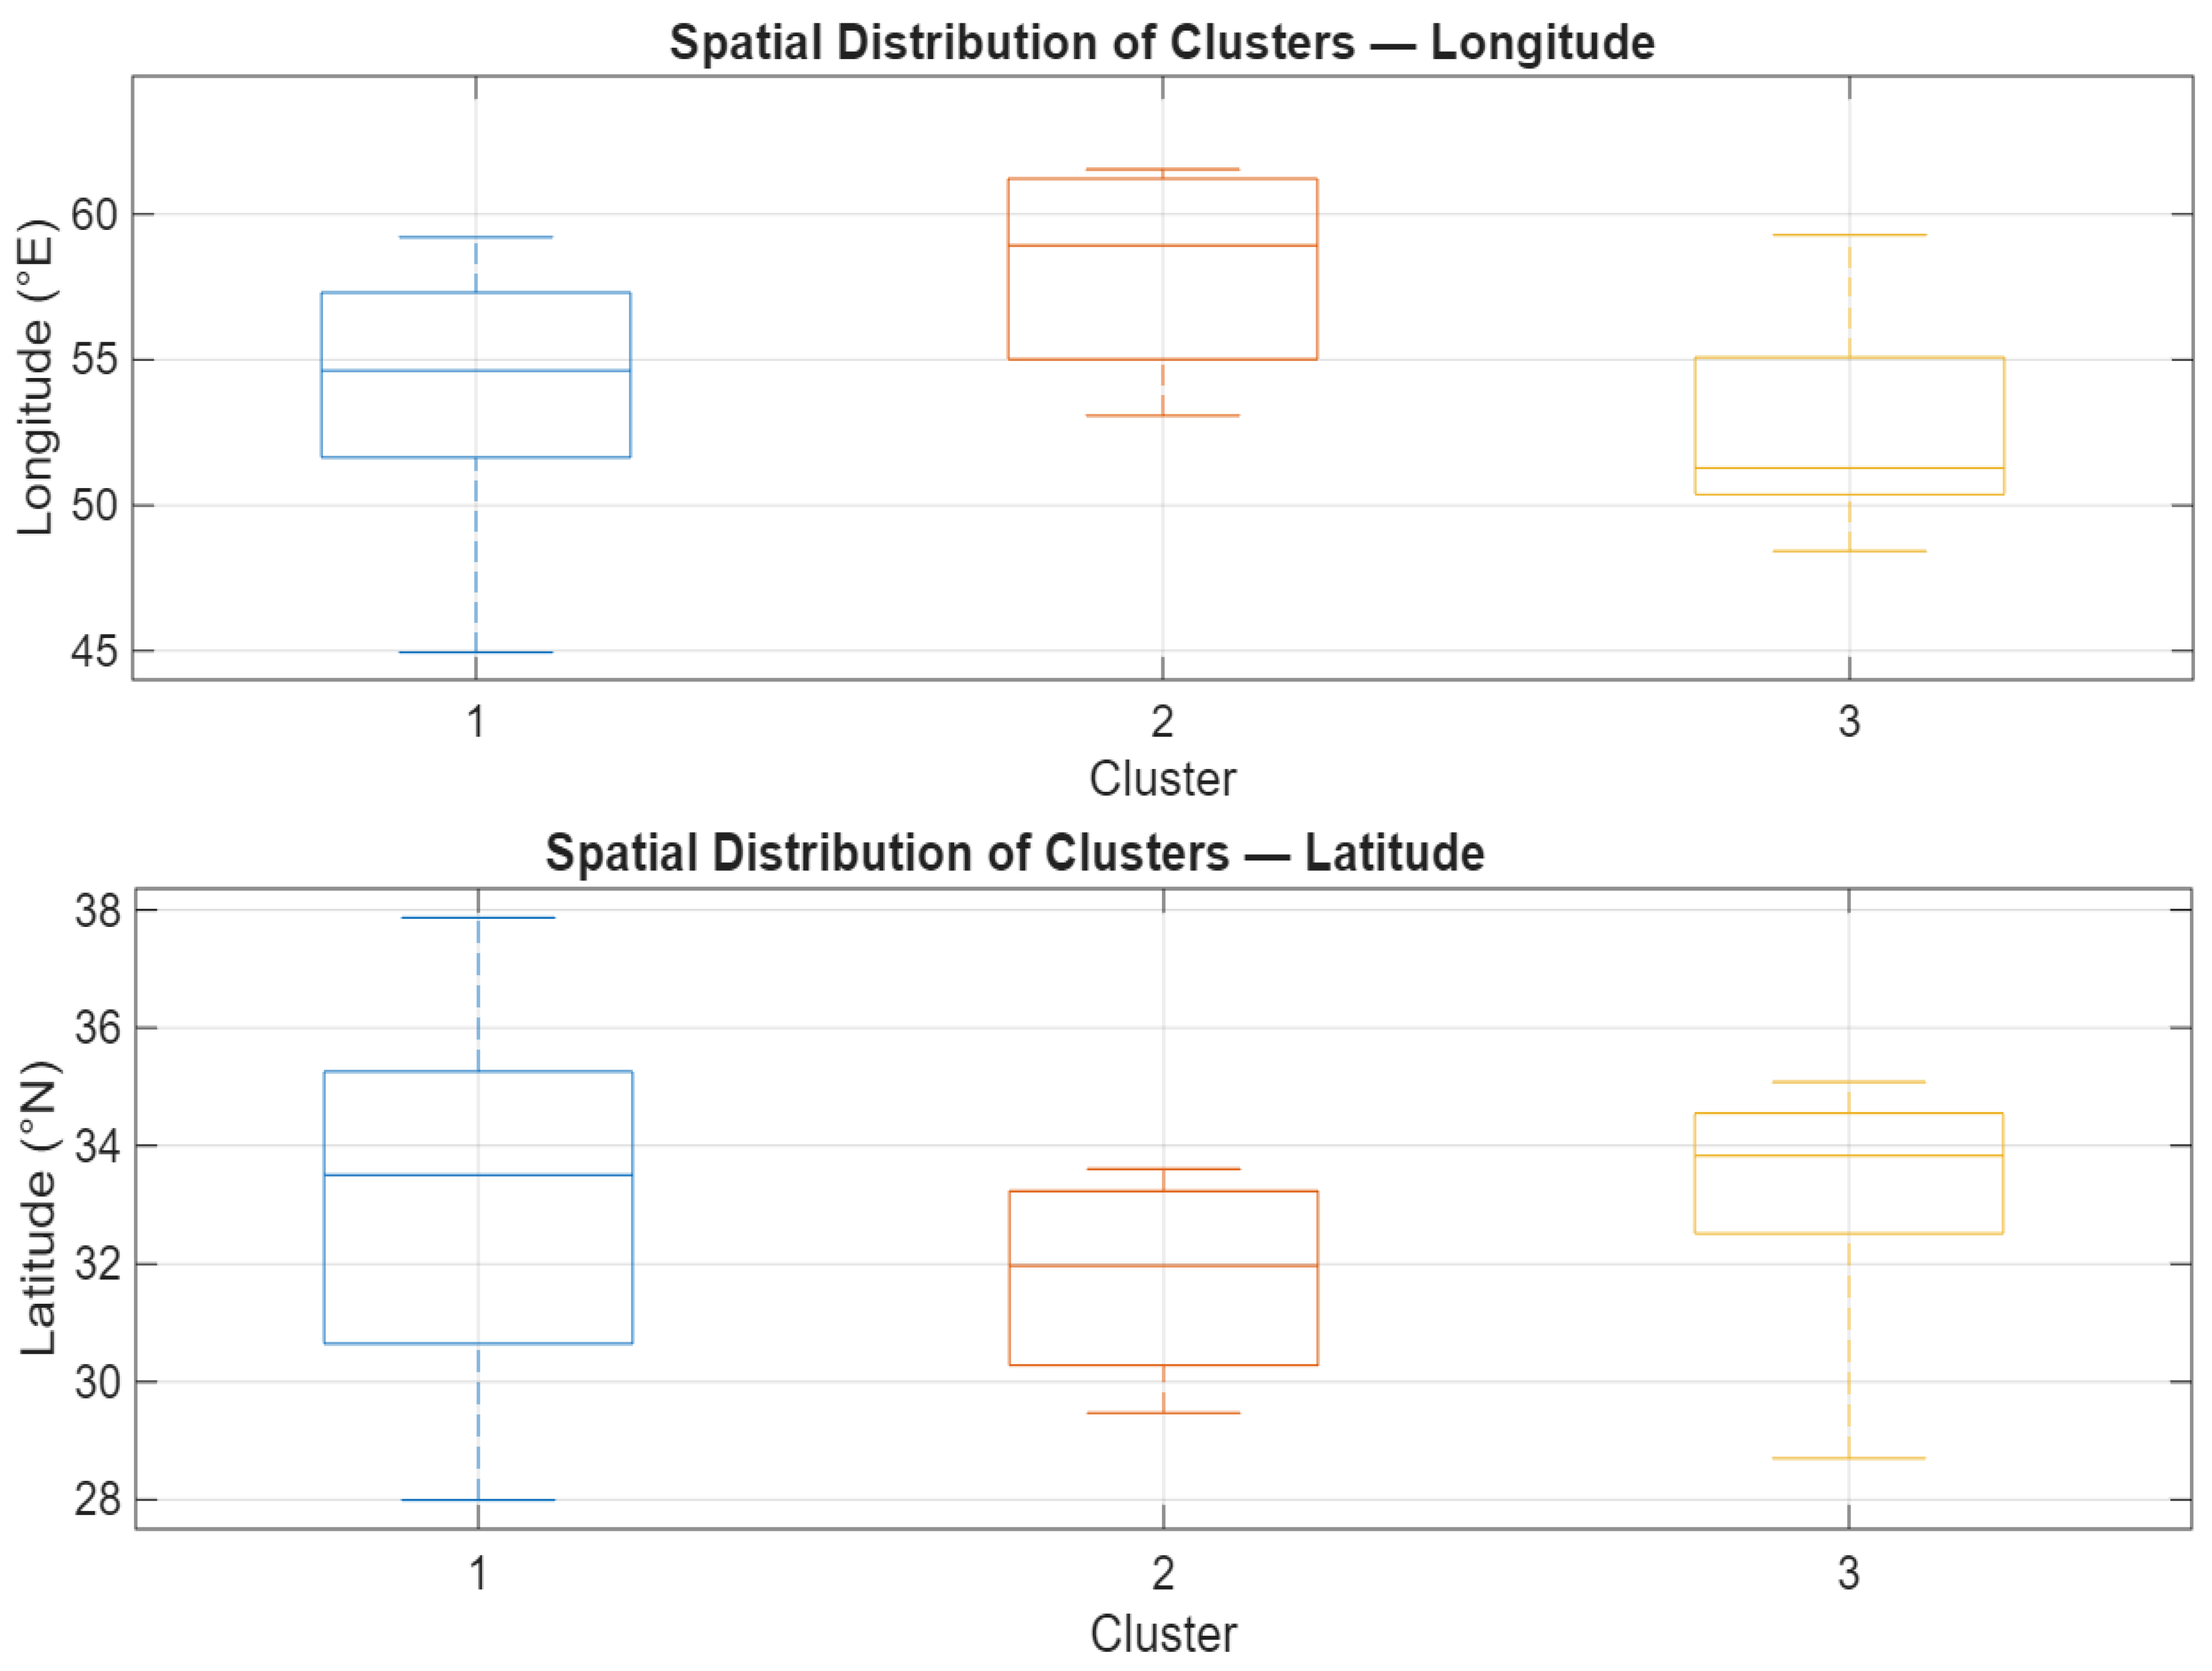
The box-plot analysis of geographic coordinates reveals that the three K-means clusters exhibit distinct spatial patterns across Iran (
Figure 8). Cluster 1 spans a wide longitudinal range and is primarily distributed across central, western, and parts of northeastern Iran, reflecting regions with generally low to moderate dust activity. In contrast, Cluster 2 shows a highly concentrated spatial signature in both longitude and latitude, clearly positioned in the eastern and southeastern parts of the country where major dust sources and dominant regional wind systems are located. Cluster 3 occupies an intermediate position in both geographic dimensions, forming a transitional group whose stations are situated mainly in central-eastern and southeastern regions. These spatial patterns derived from the longitude and latitude box-plots indicate that geographic setting, topography, and proximity to dust-producing areas strongly shape the dust regime across Iran. The distinct separation of Cluster 2 in both spatial dimensions further confirms that eastern Iran experiences the highest dust burden at the national scale.
3.4. Extreme Value Analysis (GEV)
The results in
Table 5 reveal substantial variability in extreme dust behavior across Iranian stations. Locations such as Zabol and Zahedan exhibit extremely short return periods, approximately one year for high-intensity dust day numbers, indicating that extreme episodes occur almost annually. This aligns with their exceptionally high mean dust-day values. In contrast, stations such as Anar, Ferdows, and Garmsar show longer return periods, suggesting that severe dust events are less frequent. Extremely large return periods observed in stations like Aqda and Daran indicate that high-threshold extremes are exceedingly rare in these regions. Negative shape parameters in stations such as Zabol and Yazd imply lighter-tailed distributions, whereas positive shape values in stations like Garmsar and Ferdows indicate heavier tails and a higher likelihood of very intense events. Overall, the findings demonstrate that the extreme-value regime of dust storms in Iran is highly location-dependent and strongly influenced by local climatic and geographical factors.
3.5. LSTM Forecasting Performance and Future Projections
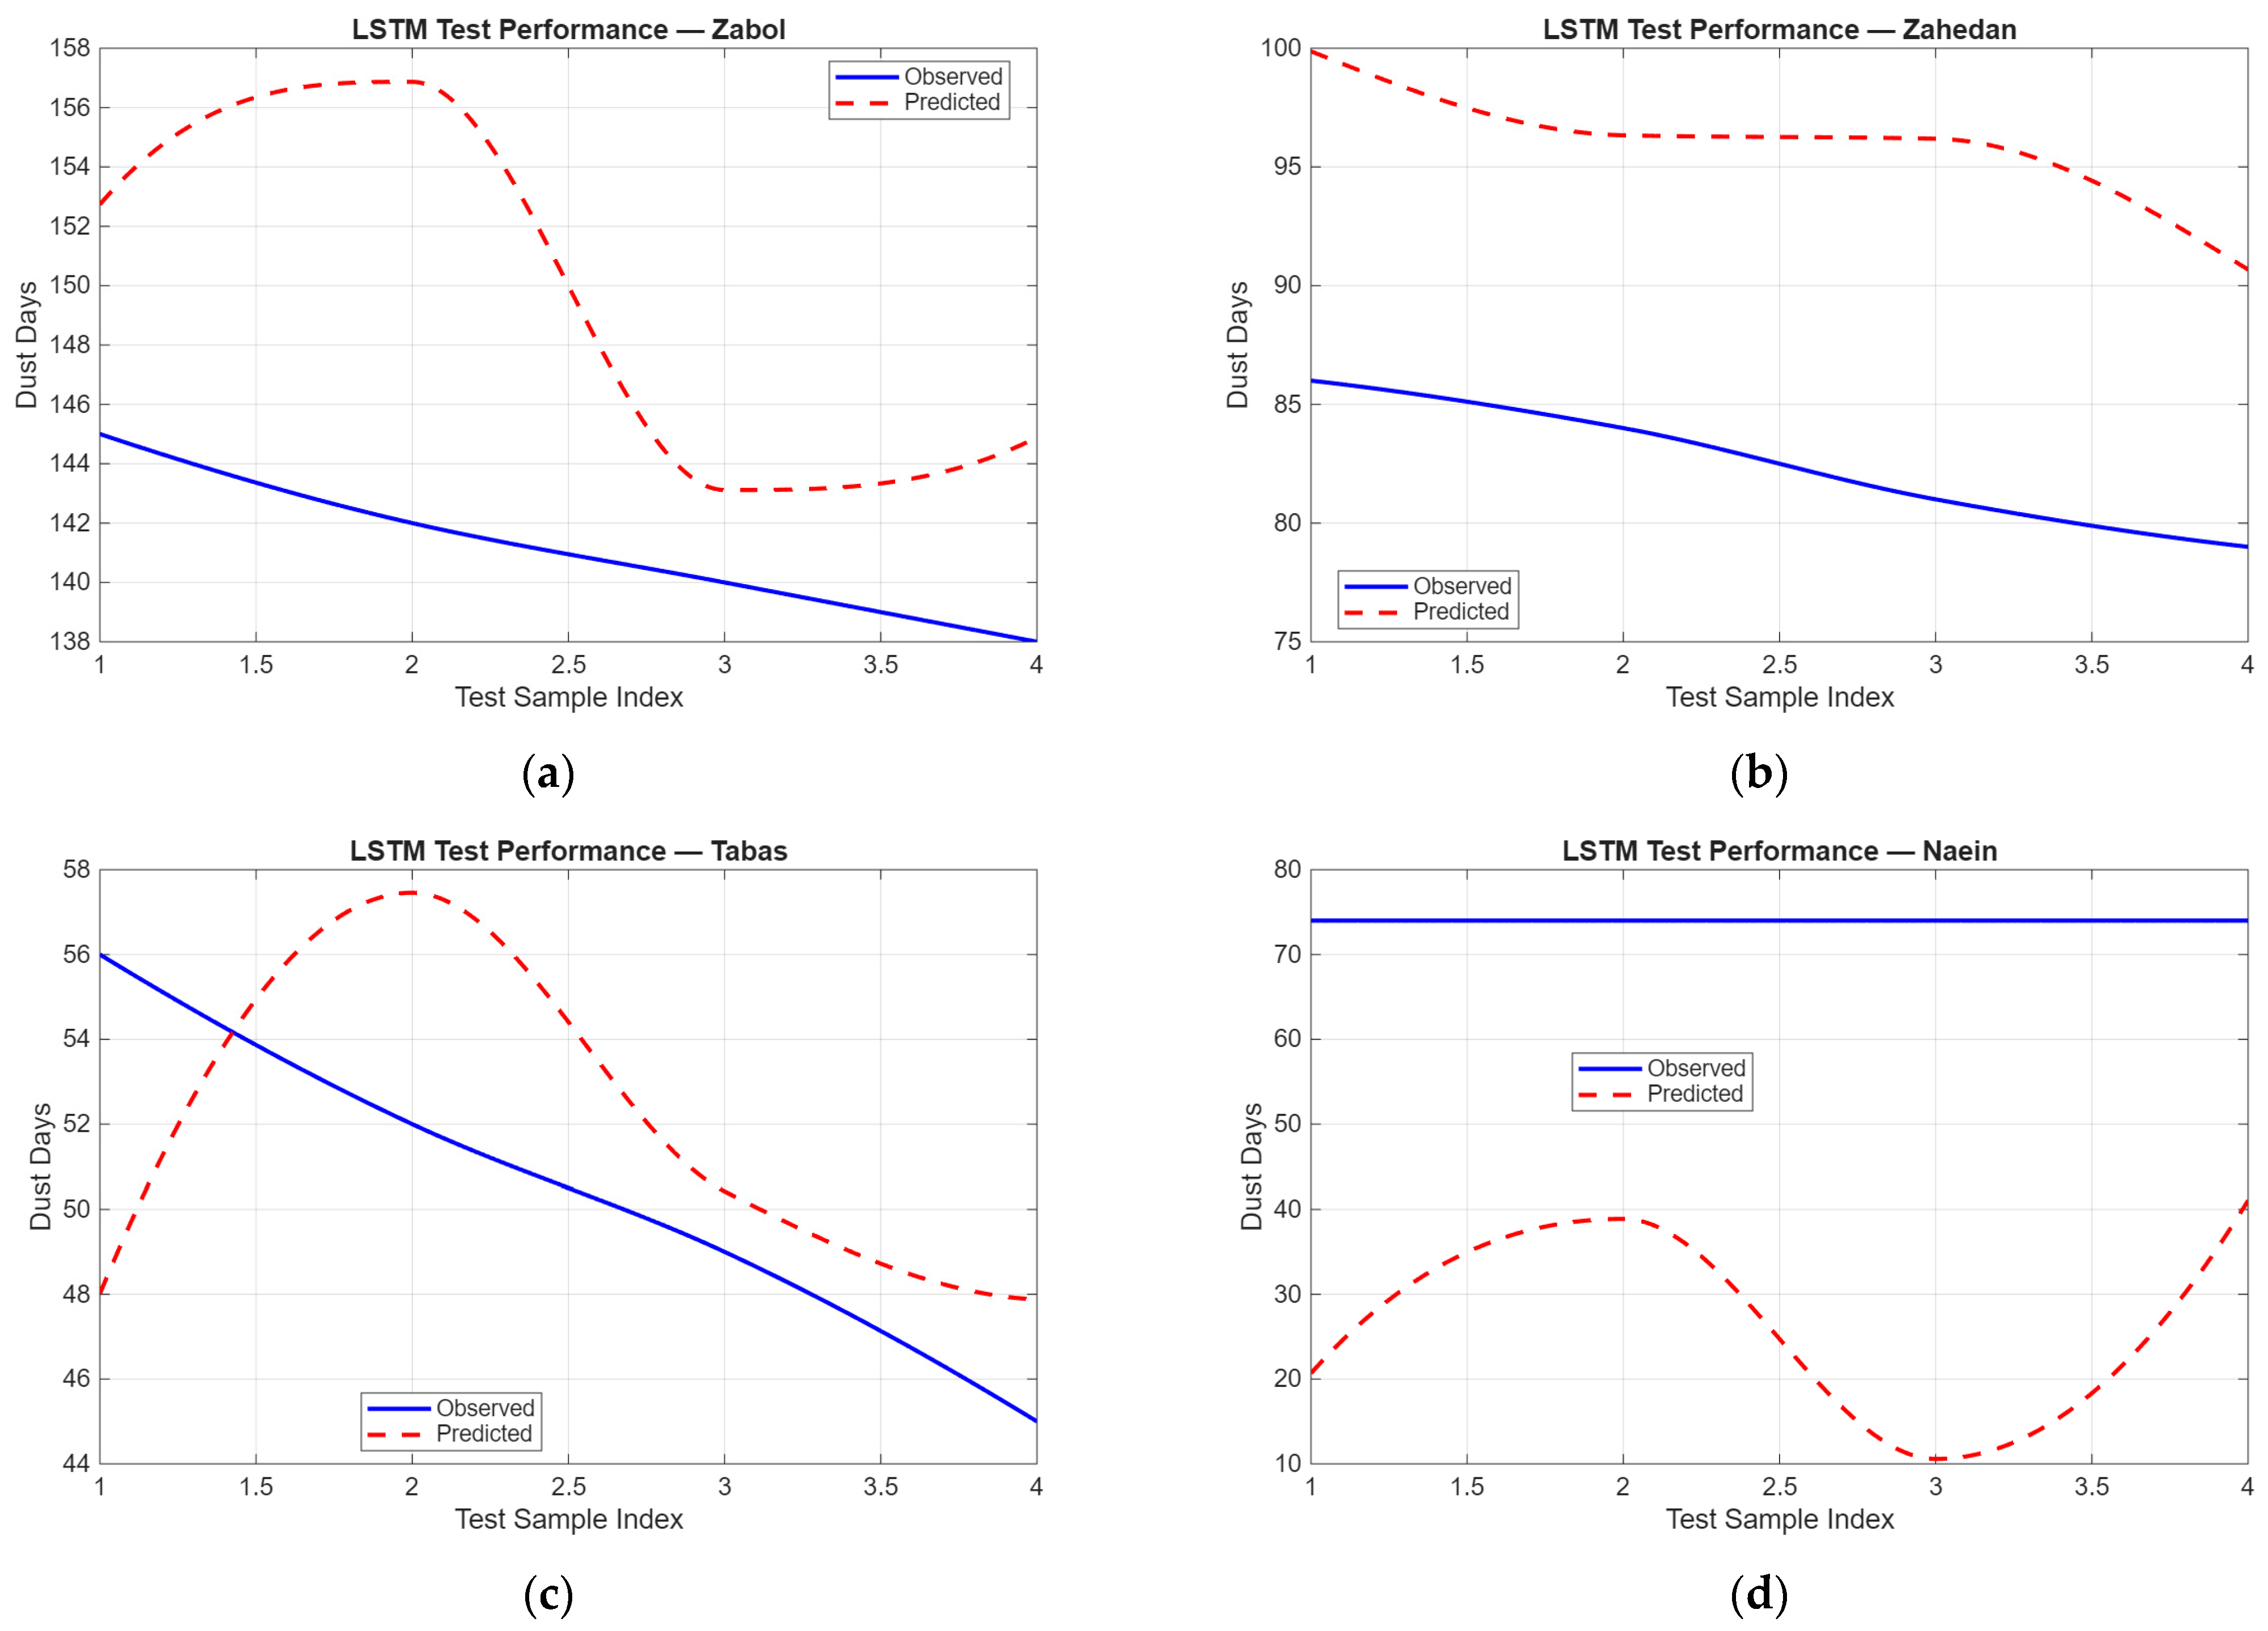
The LSTM test performance results indicate that the model successfully captures the general temporal patterns of dust activity, although its accuracy varies across stations. In stations such as Tabas, the model closely follows the observed values with relatively small deviations, effectively reproducing annual fluctuations. In contrast, stations like Naein exhibit substantial discrepancies between observed and predicted values, reflecting the complex and highly variable dust dynamics in that region. Overall, the model performs better in stations with more stable dust behavior, whereas accuracy decreases in locations characterized by strong variability or frequent extreme events. These findings suggest that while LSTM is a powerful forecasting tool, its performance is strongly influenced by the statistical characteristics and local dynamics of each station (
Figure 9).
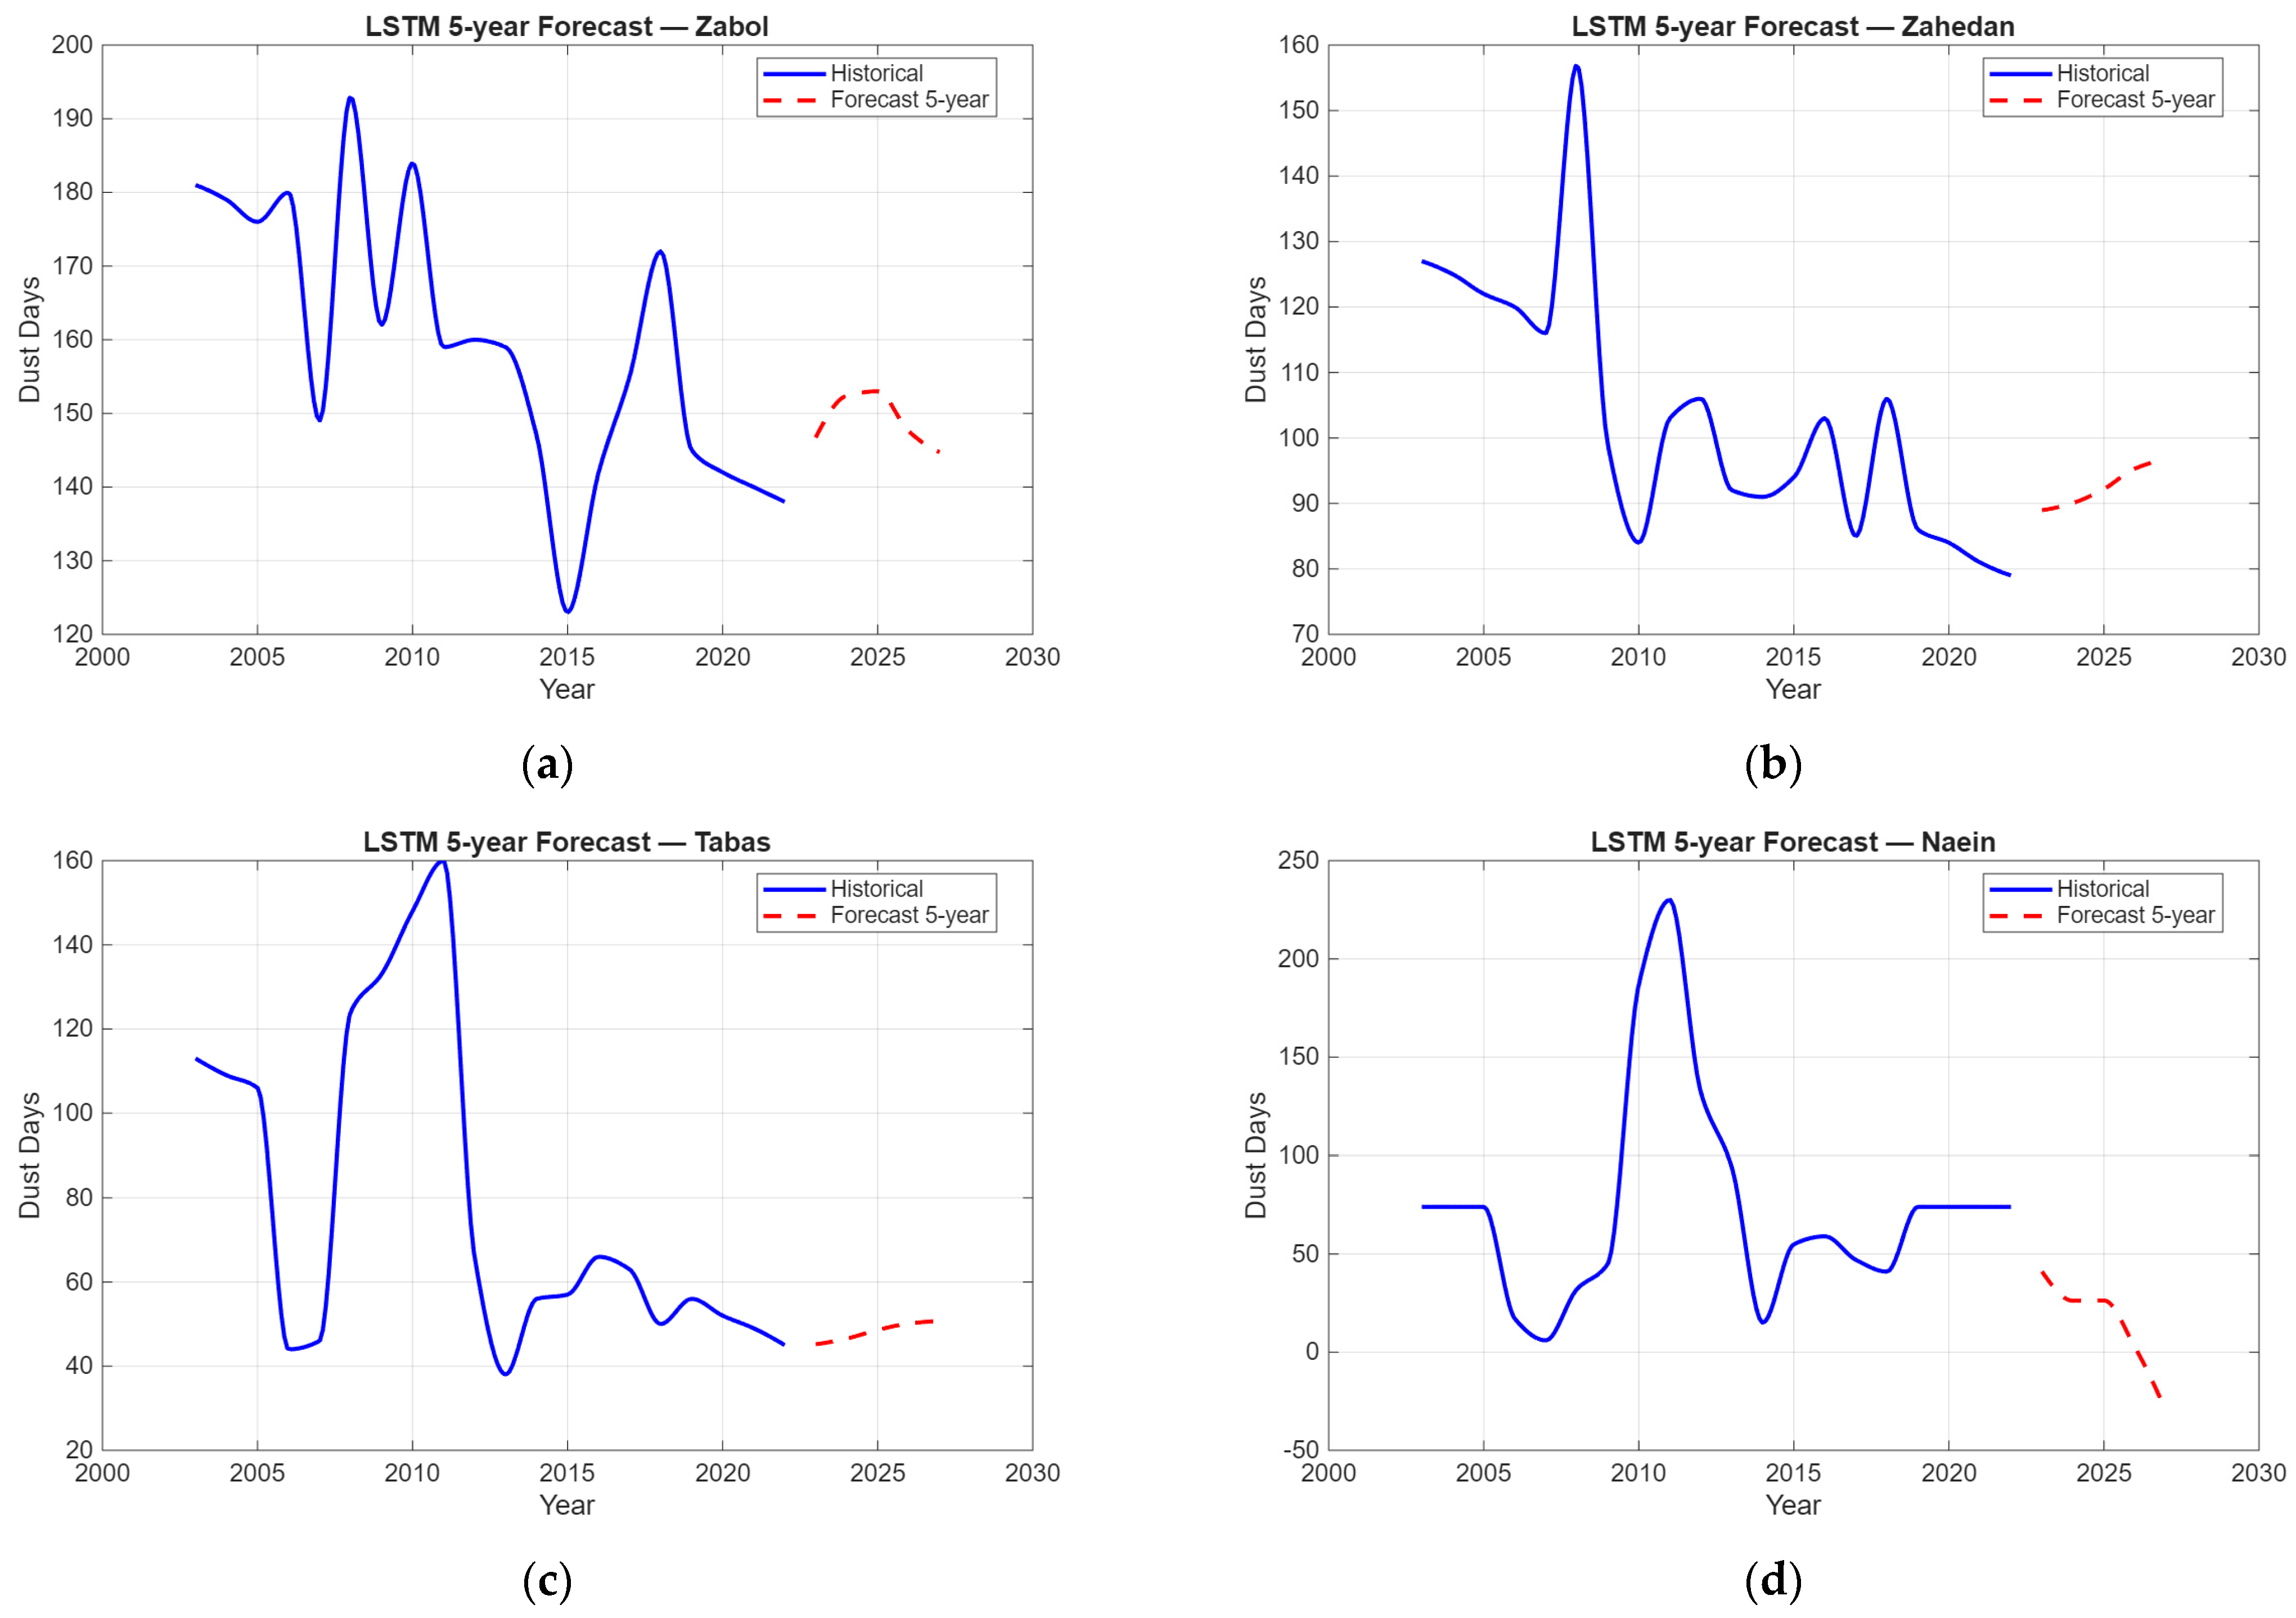
The 5-year LSTM forecasts indicate that dust activity across most stations is expected to remain relatively stable or show a slight decline between 2023 and 2027. In stations such as Tabas, the model predicts a modest decrease in dust days, potentially reflecting reduced activity of local dust sources or short-term climatic adjustments. Conversely, stations like Zahedan show a minor upward trend, suggesting persistent dust conditions in southeastern Iran. Naein displays pronounced nonlinear fluctuations in the forecast, highlighting the region’s sensitivity to climatic and hydrological variability. Overall, the 5-year outlook suggests no substantial shifts in dust behavior, with most stations maintaining relatively stable patterns (
Figure 10).
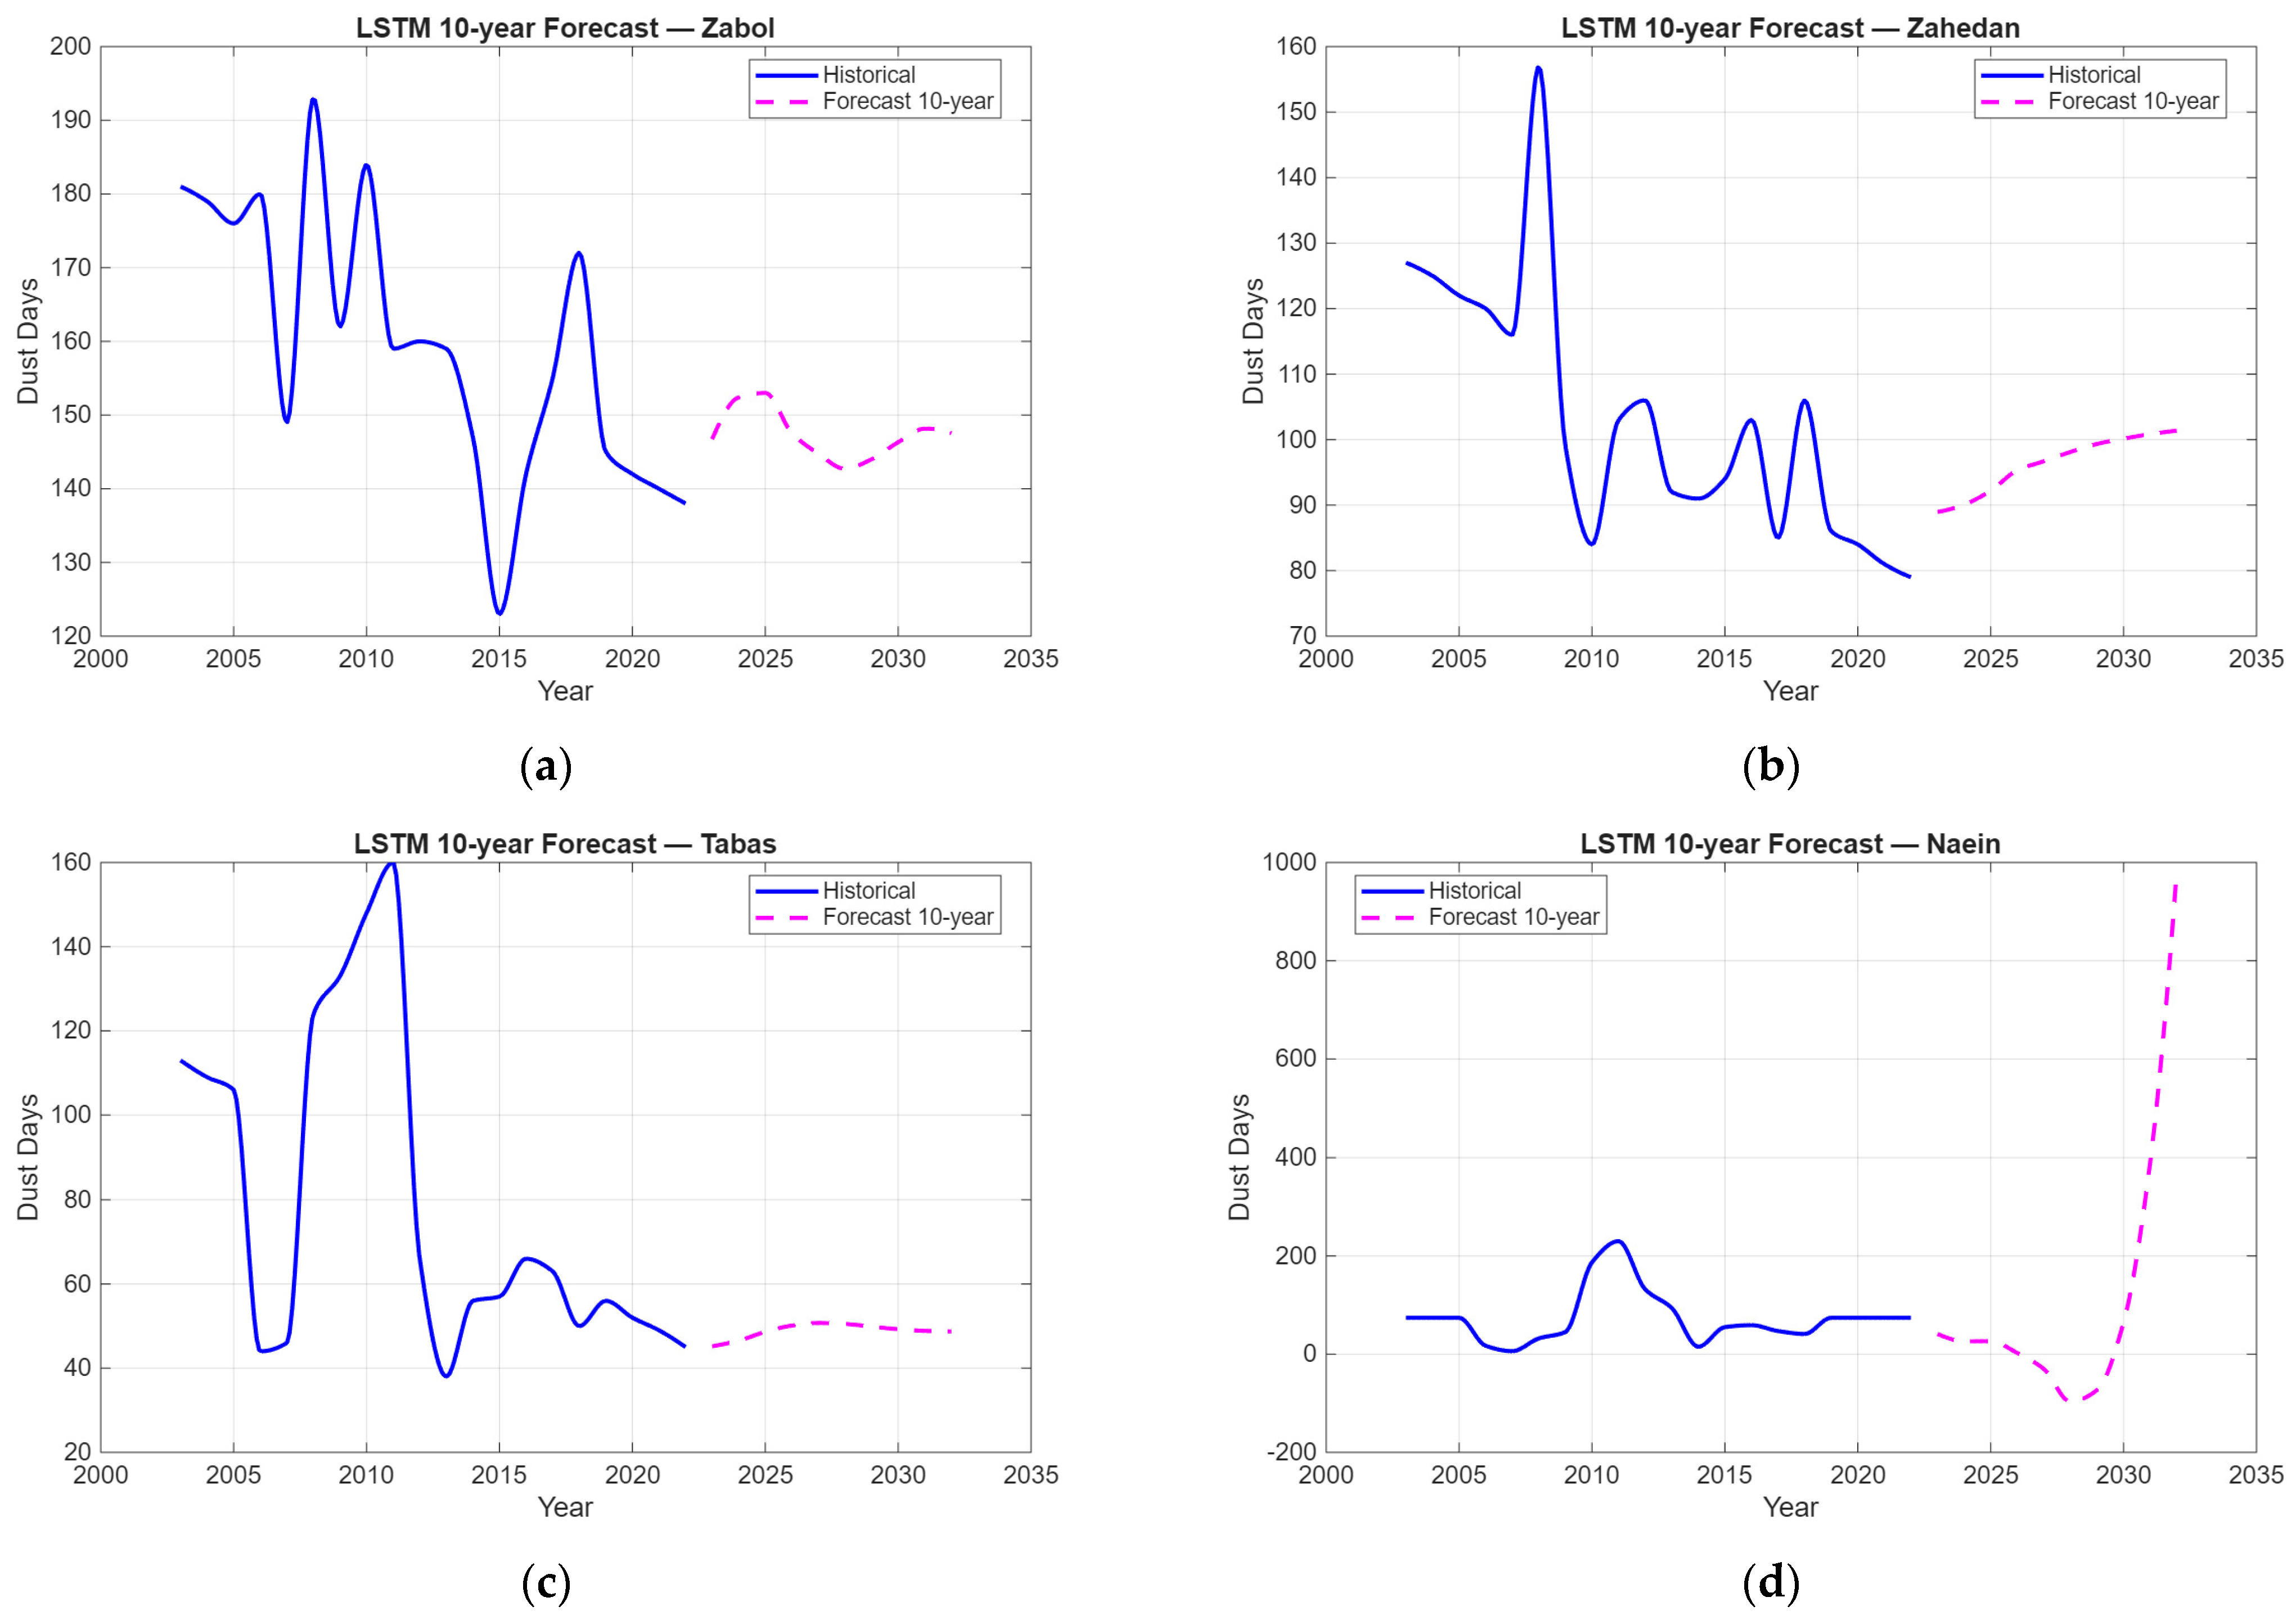
The 10-year LSTM forecasts reveal more diverse patterns compared to the 5-year horizon. Stations such as Tabas maintain relatively stable dust levels, with no major long-term shifts. However, stations like Zahedan show a gradual increase in dust activity, potentially reflecting intensifying drought conditions or long-term climatic changes. In Naein, the model predicts an unrealistically sharp rise in dust days toward the end of the forecast period, likely resulting from over-fitting or sensitivity to outliers. This indicates that long-term LSTM projections should be interpreted with caution and may require additional calibration or integration with complementary modeling approaches (
Figure 11).
4. Discussion
Overall, the LSTM model successfully captures temporal dust patterns across stations, although its accuracy depends heavily on local characteristics. The 5-year forecasts remain relatively stable, while the 10-year projections exhibit unrealistic behavior in some stations (particularly Naein). Thus, long-term LSTM forecasts should be interpreted cautiously and may require additional refinement.
The results of this study indicate that dust-storm activity in Iran exhibits a highly heterogeneous and spatially structured pattern shaped by the country’s diverse climatic regimes, geomorphological characteristics, and large-scale synoptic circulation systems. These variations highlight the importance of local climatic and topographic conditions, as well as exposure to dry and erosive winds, in shaping dust behavior across the Iranian Plateau. While internal deserts such as the Central Desert and the Lut Desert contribute substantially to dust emissions, regional wind systems—including the Sistan 120-day wind—also play an important role.
The spatial distribution of mean annual dust days identifies eastern and southeastern regions—particularly Zabol, Zahedan, and Tabas—along with parts of central Iran such as Naein and Yazd, as the main dust-affected areas. These regions are influenced by persistent aridity, extensive desert surfaces, and dominant wind systems that enhance dust emission and transport. This spatial pattern is consistent with previous assessments that have recognized these areas as major dust source zones [
32,
46]. In contrast, western and mountainous regions show substantially lower dust activity, which aligns with earlier studies linking complex terrain, vegetation cover, and higher precipitation to reduced dust frequency [
36,
46].
Temporal analysis reveals that dust trends vary considerably across the country. Some stations exhibit statistically significant increasing trends (e.g., Qom, Rafsanjan, Salafchegan, Saveh, Mahallat), while others show decreasing trends (e.g., Bam, Baft, Sabzevar, Tabas, Zabol, Zahedan). This spatial inconsistency suggests that dust activity is influenced by localized environmental conditions rather than a uniform national-scale forcing. Although factors such as land degradation, groundwater depletion, agricultural abandonment, or changes in wind regimes may contribute to these differences, such mechanisms were not directly analyzed in this study and should therefore be interpreted cautiously. Similar region-dependent trends have been reported in previous research, where some basins experienced intensifying dust activity while others showed stabilization or decline depending on land-use trajectories and hydrological stress [
32,
36].
The regional Mann–Kendall test indicates a weak and not quite statistically significant increasing trend in the national mean, suggesting that despite reductions in some southeastern stations, the overall dust burden across Iran remains persistent or slightly increasing. This emerging signal is broadly consistent with climatological analyses reporting increasing aridity and recurrent droughts in parts of Iran and the Middle East [
32]. The positive slopes observed in central Iran may therefore serve as an early indication of increasing dust pressure in these regions.
Extreme-value analysis using the GEV distribution provides additional insight into high-impact dust events. Stations such as Zabol and Zahedan show very short return periods for 30-day dust events, often close to one year, indicating that extreme dust years are relatively common in these areas. In contrast, stations with low dust activity exhibit long or unstable return periods, reflecting the rarity of extreme events. This contrast between frequent extremes in eastern hotspots and their rarity elsewhere is consistent with studies emphasizing the persistence and intensity of dust events in southeastern Iran [
35,
46]. These differences highlight the need for region-specific mitigation and adaptation strategies, particularly in areas where extreme events recur regularly.
The spatial clustering results further confirm the presence of three distinct dust regimes across Iran: a high-dust eastern and southeastern cluster, a moderate-dust central cluster, and a low-dust western and northern cluster. This classification aligns with known climatic zones and provides a practical framework for regional dust management, early-warning systems, and resource allocation. Similar multi-cluster structures have been reported in synoptic and statistical classifications of dust regimes in Iran and neighboring regions [
32,
35], supporting the robustness of the three-regime framework identified in this study.
LSTM-based forecasts offer a forward-looking perspective on dust activity. The model performs well for stations with relatively stable temporal patterns (e.g., Tabas, Yazd, Zabol, Zahedan), but its performance decreases for highly variable stations such as Naein. The unrealistic growth observed in Naein’s 10-year forecast illustrates the limitations of deep-learning models when applied to irregular or non-stationary time series. Nevertheless, the forecasts suggest that dust activity in major hotspots is likely to remain high or moderately variable over the coming decade, with no strong indication of a sustained decline. This projection is consistent with regional outlooks anticipating continued dust pressure under scenarios of increasing aridification and land degradation in parts of the Middle East [
32], although local improvements in hydrology or land management may temporarily reduce dust in certain basins.
5. Conclusions
This study provides a comprehensive assessment of the temporal and spatial dynamics of dust storms in Iran over the 20-year period from 2003 to 2022, using a multi-method framework that includes descriptive statistics, trend analysis, GEV-based extreme-value modeling, K-means clustering, and LSTM forecasting. The results show that dust activity is strongly concentrated in the eastern, southeastern, and parts of central Iran, where stations such as Zabol, Zahedan, Tabas, Naein, and Yazd consistently record the highest dust frequencies. This spatial concentration reflects the influence of persistent aridity, extensive desert surfaces, and dominant regional wind systems that collectively enhance dust emission and transport.
Trend analysis reveals a heterogeneous pattern across the country: several central and western stations exhibit statistically significant increasing trends, while others—particularly in the southeast—show decreasing trends. This spatial variability suggests that dust changes in Iran are shaped primarily by localized environmental and hydrological conditions rather than a uniform national-scale forcing. The weak but near-significant positive regional trend further indicates that, despite reductions in some southeastern basins, the overall dust burden across Iran remains stable or slightly increasing, which may have implications for the future of central regions.
The synthesis of findings suggests that multiple factors may contribute to the observed dust variability, including prolonged droughts, groundwater stress, land-surface degradation, agricultural abandonment, and possible shifts in atmospheric circulation. However, since these drivers were not directly analyzed in this study, they should be interpreted cautiously and considered as potential rather than definitive explanations.
Given the increasing trends in central regions and the persistent intensity of dust activity in the east and southeast, the development of region-specific adaptation and mitigation strategies is essential. These may include improved land and water management, restoration of degraded rangelands, sustainable groundwater governance, and continuous monitoring of wind-erosion hotspots. Strengthening early-warning systems and integrating dust-related health-risk assessments into regional planning are also critical. In addition, coordinated transboundary management of wetlands and shared basins—such as the Hirmand Basin—may help reduce dust vulnerability in downstream regions.
Future research should incorporate satellite-based aerosol datasets, land-surface models, synoptic circulation analyses, and hybrid modeling approaches to better identify the drivers of dust activity and improve predictability under changing climatic and land-use conditions. Considering the multidimensional nature of dust storms, such integrated approaches can provide a more robust understanding of dust dynamics in Iran.
This study has several limitations that should be acknowledged. The analysis relies on station-based observations, which may not fully capture spatial variability in areas with sparse synoptic coverage. Dust-day identification based on meteorological codes may also introduce uncertainties, particularly in stations with inconsistent reporting practices. In addition, the relatively short time series available for machine-learning forecasting—and the difficulty of obtaining long, continuous datasets for a large number of stations—limit the robustness of the LSTM model. Under these conditions, the model can only provide a general, indicative outlook on future dust activity, and its projections are naturally accompanied by considerable uncertainty, especially in stations with highly variable dust records. These limitations should be taken into account when interpreting the results and designing future research.
Author Contributions
F.S.S.: Conceptualization, methodology, data curation, analysis software development, writing—original draft, supervision. T.M.: Methodology assistance, investigation, software support, writing—review and editing. E.G.A.: Methodology. software support, writing—review and editing, N.K.: proofreading, writing—review and editing. All authors have read and agreed to the published version of the manuscript.
Funding
The author declares that no specific grant, financial support, or external funding was received for conducting this research, preparing the analyses, or writing the manuscript. All stages of the study were carried out independently by the author without institutional or project-based financial assistance.
Data Availability Statement
The original contributions presented in this study are included in the article. Further inquiries can be directed to the corresponding author.
Acknowledgments
The author sincerely acknowledges the Iran Meteorological Organization (IRIMO) for providing access to the dust-related observational datasets used in this study. Their support and data availability were essential for conducting the analyses and completing this research.
Conflicts of Interest
The author declares that there is no conflict of interest regarding the publication of this manuscript.
References
- Tegen, I.; Hollrig, P.; Chin, M.; Fung, I.; Jacob, D.; Penner, J. Contribution of different aerosol species to the global aerosol extinction optical thickness: Estimatesfrom model results. J. Geophys. Res. 1997, 102, 23895–23915. [Google Scholar] [CrossRef]
- Haywood, J.; Boucher, O. Estimates of the direct and indirect radiative forcing due to tropospheric aerosols: A review. Rev. Geophys. 2000, 38, 513–543. [Google Scholar] [CrossRef]
- Harrison, S.P.; Kohfeld, K.E.; Roelandt, C.; Claquin, T. The role of dust in climate changes today, at the last glacial maximum and in the future. Earth Sci. Rev. 2001, 54, 4380. [Google Scholar] [CrossRef]
- Sokolik, I.N.; Winker, D.M.; Bergametti, G.; Gillette, D.A.; Carmichael, G.; Kaufman, Y.; Gomes, L.; Schuetz, L.; Penner, J.E. Introduction to special section: Outstanding problems in quantifying the radiative impacts of mineral dust. J. Geophys. Res. 2001, 106, 15–18. [Google Scholar] [CrossRef]
- Kim, S.W.; Yoon, S.C.; Kim, J. Columnar Asian dust particle properties observed by sun/sky radiometers from 2000 to 2006 in Korea. Atmos. Environ. 2008, 42, 492–504. [Google Scholar] [CrossRef]
- Levin, Z.; Ganor, E.; Gladstein, V. The effects of desert particles coated with sulfate on rain formation in the eastern Mediterranean. J. Appl. Meteorol. 1996, 35, 1511–1523. [Google Scholar] [CrossRef]
- Wurzler, S.; Reisin, T.G.; Levin, Z. Modification of mineral dust particles by cloud processing and subsequent effects on drop size distributions. J. Geophys. Res. 2000, 105, 4501–4512. [Google Scholar] [CrossRef]
- Charlson, R.J.; Schwartz, S.E.; Hales, J.M.; Cess, R.D.; Coakley, J.A., Jr.; Hansen, J.E.; Hofmann, D.J. Climate forcing by anthropogenic aerosols. Science 1992, 255, 423–430. [Google Scholar] [CrossRef]
- Chang, L.S.; Park, S.U. Direct radiative forcing due to anthropogenic aerosols in East Asia during April 2001. Atmos. Environ. 2004, 38, 4467–4482. [Google Scholar] [CrossRef]
- Claiborn, C.S.; Finn, D.; Larson, T.V.; Koening, J.Q. Windblown dust contribution to high PM2.5 concentrations. J. Air Waste Manag. Assoc. 2000, 50, 1440–1455. [Google Scholar] [CrossRef] [PubMed]
- Liu, C.M.; Young, C.Y.; Lee, Y.C. Influence of Asian dust storms on air quality in Taiwan. Sci. Total Environ. 2006, 368, 884–897. [Google Scholar] [CrossRef] [PubMed]
- Kwon, H.J.; Cho, S.H.; Chu, Y.; Lagarde, F.; Pershagen, G. Effects of the Asian dust events on daily mortality in Seoul, Korea. Environ. Res. Sect. A 2002, 90, 1–5. [Google Scholar] [CrossRef]
- Chen, Y.S.; Sheen, P.C.; Chen, E.R.; Liu, Y.K.; Wu, T.N.; Yang, C.Y. Effects of Asian dust storm events on daily mortality in Taipei, Taiwan. Environ. Res. 2004, 95, 151–155. [Google Scholar] [CrossRef] [PubMed]
- Tegen, I.; Fung, I. Modeling of mineral dust in the atmosphere: Sources, transport and optical thickness. J. Geophys. Res. 1994, 99, 22897–22914. [Google Scholar] [CrossRef]
- Griffin, D.W.; Kubilary, N.; Kocak, M. Airborne desert dust and aeromicrobiology over the Turkish Mediterranean coastline. Atmos. Environ. 2007, 41, 4050–4062. [Google Scholar] [CrossRef]
- Goudie, A.S.; Middleton, N.J. Saharan dust storms: Nature and consequences. Earth Sci. Rev. 2001, 56, 179–204. [Google Scholar] [CrossRef]
- Graham, W.F.; Duce, R.A. Atmospheric pathways of the phosphorus cycle. Geochim. Cosmochim. Acta 1979, 43, 1195–1208. [Google Scholar] [CrossRef]
- Middleton, N.J.; Goudie, A.S. Saharan dust: Sources and trajectories. Trans. Inst. Br. Geogr. 2001, 26, 165–181. [Google Scholar] [CrossRef]
- Moulin, C.; Lambert, C.E.; Dulac, F.; Dayan, U. Control of atmospheric export of dust from North Africa by the North Atlantic Oscillation. Nature 1997, 387, 691–694. [Google Scholar] [CrossRef]
- Prospero, J.M. Long-term measurements of the transport of African mineral dust to the southeastern United States: Implications for regional air quality. J. Geophys. Res. 1999, 104, 15917–15927. [Google Scholar] [CrossRef]
- Prospero, J.M.; Lamb, P.J. African droughts and dust transport to the Caribbean: Climate change implications. Science 2003, 302, 1024–1027. [Google Scholar] [CrossRef]
- Prospero, J.M.; Nees, R.T. Impact of the North African drought and El Nino on mineral dust in the Barbados trade winds. Nature 1986, 320, 735–738. [Google Scholar] [CrossRef]
- Shinn, E.A.; Griffin, D.W.; Seba, D.B. Atmospheric transport of mold spores in clouds of desert dust. Arch. Environ. Health 2003, 58, 498–504. [Google Scholar] [PubMed]
- Swap, R.; Garastang, M.; Greco, S.; Talbot, R.; Kallberg, P. Saharan dust in the Amazon basin. Tellus 1992, 44, 133–149. [Google Scholar] [CrossRef]
- Tucker, C.J.; Nicholson, S.E. Variations in the size of the Sahara Desert from 1980 to1997. Ambio 1999, 28, 587–591. [Google Scholar]
- Kutiel, H.; Furman, H. Dust storms in the Middle East: Sources of origin and their temporal characteristics. Indoor Built Environ. 2003, 12, 419–426. [Google Scholar] [CrossRef]
- Idso, S.B. Dust storms. Sci. Am. 1976, 235, 108–111, 113–114. [Google Scholar] [CrossRef]
- Barkan, J.; Kutiel, H.; Alpert, P. Climatology of dust sources in North Africa and the Arabian Peninsula, based on TOMS data. Indoor Built Environ. 2004, 13, 407–419. [Google Scholar] [CrossRef]
- Léon, J.-F.; Legrand, M. Mineral dust sources in the surroundings of the north Indian Ocean. Geophys. Res. Lett. 2003, 30, 1309. [Google Scholar] [CrossRef]
- Draxler, R.R.; Gillette, D.A.; Kirkpatrick, J.S.; Heller, J. Estimating PM10 air concentrations from dust storms in Iraq, Kuwait and Saudi Arabia. Atmos. Environ. 2001, 35, 4315–4330. [Google Scholar] [CrossRef]
- Washington, R.; Todd, M.; Middleton, N.J.; Goudie, A.S. Dust-storm source areas determined by the total ozone monitoring spectrometer and surface observations. Ann. Assoc. Am. Geogr. 2003, 93, 297–313. [Google Scholar] [CrossRef]
- Abadi, A.R.S.; Hamzeh, N.H.; Kaskaoutis, D.G.; Opp, C.; Kazemi, A.F. Long-Term Spatio-Temporal Analysis, Distribution, and Trends of Dust Events over Iran. Atmosphere 2025, 16, 334. [Google Scholar] [CrossRef]
- Hamzeh, N.H.; Kaskaoutis, D.G.; Rashki, A.; Mohammadpour, K. Long-Term Variability of Dust Events in Southwestern Iran and Its Relationship with the Drought. Atmosphere 2021, 12, 1350. [Google Scholar] [CrossRef]
- Alizadeh-Choobari, O.; Zawar-Reza, P.; Sturman, A. The “wind of 120 days” and dust storm activity over the Sistan Basin. Atmos. Res. 2014, 143, 328–341. [Google Scholar] [CrossRef]
- Rashki, A.; Kaskaoutis, D. Assessment of the dust sources over Central and Southwest Asia with emphasis on the Sistan dust storms. E3S Web Conf. 2019, 99, 01002. [Google Scholar] [CrossRef]
- Mesbahzadeh, T.; Salajeghe, A.; Soleimani Sardoo, F.; Zehtabian, G.h.; Ranjbar, A.; Krakauer, N.; Miglietta, M.M.; Mirakbari, M. Climatology of dust days in the Central Plateau of Iran. Nat. Hazards 2020, 104, 1801–1817. [Google Scholar] [CrossRef]
- Abadi, A.R.S.; Shukurov, K.A.; Hamzeh, N.H.; Kaskaoutis, D.G.; Opp, C.; Shukurova, L.M.; Ghasabi, Z. Dust Events over the Urmia Lake Basin, NW Iran, in 2009–2022 and Their Potential Sources. Remote Sens. 2024, 16, 2384. [Google Scholar] [CrossRef]
- Mesbahzadeh, T.; Miglietta, M.M.; Sardoo, F.S.; Krakauer, N.; Hasheminejad, M. Regional Analysis of Dust Day Duration in Central Iran. Appl. Sci. 2022, 12, 6248. [Google Scholar] [CrossRef]
- Mahowald, N.M.; Baker, A.R.; Bergametti, G.; Brooks, N.; Duce, R.A.; Jickells, T.D.; Kubilay, N.; Prospero, J.M.; Tegen, I. Atmospheric global dust cycle and iron inputs to the ocean. Glob. Biogeochem. Cycles 2005, 19, GB4025. [Google Scholar] [CrossRef]
- Khennou, F.; Ghaoui, J.; Akhloufi, M.A. Forest fire spread prediction using deep learning. In Geospatial Informatics XI; SPIE: Bellingham, WA, USA, 2021. [Google Scholar]
- Wang, R.; Zhu, Z.; Zhu, W.; Fu, X.; Xing, S. A dynamic marine oil spill prediction model based on deep learning. J. Coast. Res. 2021, 37, 716–725. [Google Scholar] [CrossRef]
- Li, T.; Ren, Q.-d.-e.-j.; Qiu, Y. Application of improved naive bayesian-CNN classification algorithm in sandstorm prediction in inner mongolia. Adv. Meteorol. 2019, 2019, 5176576. [Google Scholar] [CrossRef]
- Li, N.; Zhang, W. Research on sand-dust storm forecasting based on deep neural network with stacking ensemble learning. IEEE Access 2022, 10, 111855–111863. [Google Scholar] [CrossRef]
- Yarmohamadi, M.; Alesheikh, A.A.; Sharif, M.; Vahidi, H. Predicting dust-storm transport pathways using a convolutional neural network and geographic context for impact adaptation and mitigation in urban areas. Remote Sens. 2023, 15, 2468. [Google Scholar] [CrossRef]
- Yarmohamadi, M.; Alesheikh, A.A.; Sharif, M. Using Hybrid Deep Learning Models to Predict Dust Storm Pathways with Enhanced Accuracy. Climate 2025, 13, 16. [Google Scholar] [CrossRef]
- Rashki, A.; Middleton, N.J.; Goudie, A.S. Dust storms in Iran—Distribution, causes, frequencies and impacts. Aeolian Res. 2021, 48, 100655. [Google Scholar] [CrossRef]
Figure 1.
Geographical location of the study area within Iran and its neighboring countries.
Figure 1.
Geographical location of the study area within Iran and its neighboring countries.
Figure 2.
Flowchart, spatio-temporal dynamics of dust storm activity across Iran (2003–2022).
Figure 2.
Flowchart, spatio-temporal dynamics of dust storm activity across Iran (2003–2022).
Figure 3.
Mean annual dust-day counts across synoptic stations during 2003–2022.
Figure 3.
Mean annual dust-day counts across synoptic stations during 2003–2022.
Figure 4.
Statistical distribution of dust day counts across synoptic stations during 2003–2022.
Figure 4.
Statistical distribution of dust day counts across synoptic stations during 2003–2022.
Figure 5.
Regional trend in mean annual dust day counts across Iran during 2003–2022.
Figure 5.
Regional trend in mean annual dust day counts across Iran during 2003–2022.
Figure 6.
Spatial distribution of Sen’s slope for annual dust day trends during 2003–2022.
Figure 6.
Spatial distribution of Sen’s slope for annual dust day trends during 2003–2022.
Figure 7.
Cluster membership of synoptic stations based on dust day statistical features using the K-means algorithm.
Figure 7.
Cluster membership of synoptic stations based on dust day statistical features using the K-means algorithm.
Figure 8.
Spatial distribution of synoptic station clusters based on longitude and latitude using box-plot analysis.
Figure 8.
Spatial distribution of synoptic station clusters based on longitude and latitude using box-plot analysis.
Figure 9.
LSTM test performance ((a) Zabol, (b) Zahdan, (c) Tabas, (d) Naein).
Figure 9.
LSTM test performance ((a) Zabol, (b) Zahdan, (c) Tabas, (d) Naein).
Figure 10.
Five-year forecast of dust-day counts using the LSTM model ((a) Zabol, (b) Zahdan, (c) Tabas, (d) Naein).
Figure 10.
Five-year forecast of dust-day counts using the LSTM model ((a) Zabol, (b) Zahdan, (c) Tabas, (d) Naein).
Figure 11.
10-year forecast of dust-day counts using the LSTM model ((a) Zabol, (b) Zahdan, (c) Tabas, (d) Naein).
Figure 11.
10-year forecast of dust-day counts using the LSTM model ((a) Zabol, (b) Zahdan, (c) Tabas, (d) Naein).
Table 1.
Statistical Information of the studied stations.
Table 1.
Statistical Information of the studied stations.
| Station Name | Longitude (°E) | Latitude (°N) | Study Period |
|---|
| Anar | 55.27 | 30.87 | 2003–2022 |
| Aqda | 53.63 | 32.44 | 2003–2022 |
| Arak | 49.69 | 34.10 | 2003–2022 |
| Ardestan | 52.37 | 33.38 | 2003–2022 |
| Bafq | 55.40 | 31.61 | 2003–2022 |
| Baft | 56.60 | 29.23 | 2003–2022 |
| Bam | 58.36 | 29.10 | 2003–2022 |
| Behbahan | 50.24 | 30.59 | 2003–2022 |
| Birjand | 59.22 | 32.87 | 2003–2022 |
| Damghan | 54.35 | 36.17 | 2003–2022 |
| Daran | 50.41 | 32.99 | 2003–2022 |
| Esfahan | 51.67 | 32.65 | 2003–2022 |
| Ferdows | 58.17 | 34.02 | 2003–2022 |
| Garmsar | 52.34 | 35.22 | 2003–2022 |
| Golpayegan | 50.28 | 33.45 | 2003–2022 |
| Hamedan (Airport) | 48.55 | 34.87 | 2003–2022 |
| Jiroft | 57.74 | 28.68 | 2003–2022 |
| Kabutarabad | 51.73 | 32.48 | 2003–2022 |
| Kahnuj | 57.70 | 27.95 | 2003–2022 |
| Kahriz | 48.70 | 34.20 | 2003–2022 |
| Kashan | 51.44 | 33.98 | 2003–2022 |
| Kashmar | 58.47 | 35.24 | 2003–2022 |
| Kerman | 57.06 | 30.29 | 2003–2022 |
| Khur-Va-Biabanak | 55.08 | 33.78 | 2003–2022 |
| Mahallat | 50.46 | 33.91 | 2003–2022 |
| Malayer | 48.82 | 34.30 | 2003–2022 |
| Marvast | 54.20 | 30.48 | 2003–2022 |
| Meymeh | 51.18 | 33.45 | 2003–2022 |
| Naein | 53.09 | 32.86 | 2003–2022 |
| Nahavand | 48.37 | 34.19 | 2003–2022 |
| Natanz | 51.92 | 33.51 | 2003–2022 |
| Neyshabur | 58.79 | 36.21 | 2003–2022 |
| Qaen | 59.18 | 33.73 | 2003–2022 |
| Qom | 50.88 | 34.64 | 2003–2022 |
| Rafsanjan | 55.99 | 30.41 | 2003–2022 |
| Sabzevar | 57.68 | 36.21 | 2003–2022 |
| Salafchegan | 50.46 | 34.48 | 2003–2022 |
| Saveh | 50.36 | 35.02 | 2003–2022 |
| Semnan | 53.40 | 35.57 | 2003–2022 |
| Shahdad | 57.70 | 30.42 | 2003–2022 |
| Shahrebabak | 55.12 | 30.12 | 2003–2022 |
| Shahreza | 51.87 | 32.01 | 2003–2022 |
| Shahrud | 54.98 | 36.42 | 2003–2022 |
| Sirjan | 55.68 | 29.45 | 2003–2022 |
| Tabas | 56.92 | 33.60 | 2003–2022 |
| Tafresh | 50.01 | 34.69 | 2003–2022 |
| Torbat-E Heydariyeh | 59.22 | 35.27 | 2003–2022 |
| Toyserkan | 48.44 | 34.55 | 2003–2022 |
| Yazd | 54.37 | 31.90 | 2003–2022 |
| Zabol | 61.49 | 31.03 | 2003–2022 |
| Zahedan | 60.86 | 29.50 | 2003–2022 |
Table 2.
Dust and dust storm weather codes.
Table 2.
Dust and dust storm weather codes.
| Code | Description | Code | Description |
|---|
| 06 | Widespread dust in suspension, not raised by local winds | 32 | Slight or moderate dust storm decreasing |
| 07 | Dust or sand raised by wind at or near the station | 33 | Slight or moderate dust storm increasing |
| 08 | Well-developed dust or sand whirls | 34 | Severe dust storm |
| 09 | Dust storm within the past hour, not at observation time | 35 | Severe dust storm decreasing |
| 30 | Slight or moderate dust storm | 98 | Thunderstorm with dust or sandstorm |
| 31 | Slight or moderate dust storm with no change | 99 | Severe dust storm with thunderstorm |
Table 3.
Basic statistical indicators of annual dust day (ADD) counts at synoptic stations during 2003–2022.
Table 3.
Basic statistical indicators of annual dust day (ADD) counts at synoptic stations during 2003–2022.
| Name | Mean (ADD) | Max (ADD) | Min (ADD) | Name | Mean (ADD) | Max (ADD) | Min (ADD) |
|---|
| Anar | 29.5 | 54 | 7 | Marvast | 15 | 28 | 7 |
| Aqda | 17.5 | 32 | 5 | Meymeh | 14.9 | 29 | 1 |
| Arak | 67.75 | 87 | 27 | Naein | 73.9 | 230 | 6 |
| Ardestan | 41.5 | 84 | 0 | Nahavand | 20.5 | 40 | 1 |
| Bafq | 25.45 | 50 | 11 | Natanz | 21.65 | 33 | 2 |
| Baft | 1.85 | 5 | 0 | Neyshabur | 5.45 | 16 | 1 |
| Bam | 34.5 | 89 | 0 | Qaen | 15.4 | 32 | 3 |
| Birjand | 40.35 | 68 | 11 | Qom | 47.1 | 108 | 0 |
| Damghan | 3.65 | 8 | 1 | Rafsanjan | 13.95 | 33 | 0 |
| Daran | 9.75 | 23 | 3 | Sabzevar | 23.8 | 46 | 14 |
| Esfahan | 35.9 | 62 | 1 | Salafchegan | 38.45 | 89 | 2 |
| Ferdows | 16.5 | 36 | 5 | Saveh | 57.15 | 100 | 7 |
| Garmsar | 12.6 | 39 | 0 | Semnan | 6.8 | 22 | 1 |
| Golpayegan | 12.2 | 18 | 8 | Shahdad | 14.25 | 31 | 0 |
| Hamedan | 32.3 | 65 | 6 | Shahrebabak | 12 | 19 | 6 |
| Jiroft | 27 | 63 | 0 | Shahreza | 18.4 | 36 | 8 |
| Kabutarabad | 20.1 | 39 | 2 | Shahrud | 2.1 | 4 | 1 |
| Kahnuj | 14.9 | 40 | 2 | Sirjan | 8.5 | 31 | 0 |
| Kahriz | 12.15 | 28 | 3 | Tabas | 79.05 | 160 | 38 |
| Kashan | 13.8 | 29 | 0 | Tafresh | 3.85 | 12 | 0 |
| Kashmar | 8 | 19 | 1 | Torbat-E_Hey | 18.8 | 43 | 0 |
| Kerman | 19 | 33 | 10 | Toyserkan | 31.8 | 78 | 6 |
| Khur-Va-Bia | 38.4 | 61 | 7 | Yazd | 61.75 | 100 | 35 |
| Mahallat | 45.9 | 81 | 9 | Zabol | 159.3 | 193 | 123 |
| Malayer | 25.05 | 38 | 7 | Zahedan | 103 | 157 | 79 |
Table 4.
K-means cluster classification.
Table 4.
K-means cluster classification.
| Station | Cluster | Station | Cluster | Station | Cluster |
|---|
| Anar | 1 | Damghan | 1 | Mahallat | 3 |
| Aqda | 1 | Daran | 1 | Malayer | 1 |
| Arak | 3 | Esfahan | 3 | Marvast | 1 |
| Ardestan | 3 | Ferdows | 1 | Meymeh | 1 |
| Bafq | 1 | Garmsar | 1 | Naein | 2 |
| Baft | 1 | Golpayegan | 1 | Nahavand | 1 |
| Bam | 3 | Hamedan (Airport) | 3 | Natanz | 1 |
| Birjand | 3 | Jiroft | 3 | Neyshabur | 1 |
| Kahnuj | 1 | Kabutarabad | 1 | Qaen | 1 |
| Kahriz | 1 | Kashan | 1 | Qom | 3 |
| Kashmar | 1 | Kerman | 1 | Rafsanjan | 1 |
| Khur-Va-Biabanak | 3 | Mahallat | 3 | Sabzevar | 1 |
| Salafchegan | 3 | Saveh | 3 | Semnan | 1 |
| Shahdad | 1 | Shahrebabak | 1 | Shahreza | 1 |
| Shahrud | 1 | Sirjan | 1 | Tabas | 2 |
| Tafresh | 1 | Torbat-e Heydariyeh | 1 | Toyserkan | 3 |
| Yazd | 3 | Zabol | 2 | Zahedan | 2 |
Table 5.
GEV model results: parameters and return periods for dust day extremes.
Table 5.
GEV model results: parameters and return periods for dust day extremes.
| Station | Shape | Scale | Location | RP30 | RP40 | RP50 |
|---|
| Zabol | −0.345 | 18.47 | 153.39 | 1.00 | 1.00 | 1.00 |
| Zahedan | 0.201 | 13.03 | 92.72 | 1.00 | 1.00 | 1.00 |
| Naein | 0.131 | 34.62 | 48.79 | 1.21 | 1.38 | 1.61 |
| Yazd | −0.201 | 14.05 | 56.20 | 1.01 | 1.06 | 1.27 |
| Anar | −0.233 | 10.22 | 25.56 | 2.13 | 6.05 | 33.41 |
| Ferdows | 0.264 | 6.57 | 10.98 | 9.07 | 19.10 | 35.90 |
| Garmsar | 0.458 | 6.79 | 5.38 | 8.95 | 14.32 | 21.15 |
| Disclaimer/Publisher’s Note: The statements, opinions and data contained in all publications are solely those of the individual author(s) and contributor(s) and not of MDPI and/or the editor(s). MDPI and/or the editor(s) disclaim responsibility for any injury to people or property resulting from any ideas, methods, instructions or products referred to in the content. |