Article

Microclimate Impacts of Urban Green Redevelopment: A Thermal Comfort Simulation in Imola, Italy

1
Department for Life Quality Studies, University of Bologna, 47921 Rimini, Italy
2
Institute of BioEconomic-National Research Council (IBE-CNR), Via Piero Gobetti 101, 40129 Bologna, Italy
3
Department of Medicine and Aging Sciences, ‘G. d’Annunzio’ University of Chieti-Pescara, 66100 Chieti, Italy
4
Istituto di Istruzione Superiore Agrario e Chimico “G. Scarabelli–L. Ghini”, 40026 Imola, Italy
*
Author to whom correspondence should be addressed.
Land 2026, 15(6), 942; https://doi.org/10.3390/land15060942 (registering DOI)
Submission received: 27 April 2026 / Revised: 26 May 2026 / Accepted: 28 May 2026 / Published: 30 May 2026
(This article belongs to the Special Issue Urban Ecological Indicators: Land Use and Coverage)

Abstract

Urban green spaces (UGSs) are increasingly recognised as critical infrastructure for mitigating climate extremes and promoting public health; indeed, the microclimatic mechanisms through which vegetation structure translates into measurable improvements in human comfort at the neighbourhood scale are of significant interest, particularly in the context of new urban developments. This study examines the cooling effects of an urban redevelopment project in the Marconi district of Imola, Italy, using ENVI-met (Version 6.0.0, ENVI-met GmbH, Essen, Germany) simulations to compare ex ante (current) and ex post (planned) scenarios under extreme heat conditions. Physiological Equivalent Temperature (PET) was computed at the pedestrian level for both standard adult and elderly models to assess spatial patterns of thermal comfort. The results demonstrate that tree canopies are the primary determinant of local cooling, with newly planted trees reducing PET by up to 3.5 °C at the core of the regenerated block and by 1–2 °C along adjacent pavements, while grass and low vegetation provided negligible mitigation. However, new buildings generated localised warming bands of 0.5–2 °C along façades, revealing a trade-off between densification and outdoor liveability. Elderly populations experienced slightly stronger thermal stress near buildings, highlighting spatial concentrations of vulnerability. These findings reinforce the need to prioritise tree planting and canopy management as core climate adaptation strategies, while simultaneously addressing near-building heat accumulation through integrated design approaches such as façade greening and ventilation preservation. The study demonstrates the value of spatially explicit microclimate simulation for evidence-based urban planning, contributing to the development of sustainable and liveable urban environments.

1. Introduction

In the context of ongoing global climate change, Europe has experienced increasingly frequent and intense extreme weather events over the past few years [1,2,3,4]. These climate extremes have caused serious consequences, triggering a range of environmental and public health challenges [5,6,7].
Extreme weather conditions such as heat waves, drought, intense precipitation, and strong convection are pressuring the resistance and resilience of ecological and urban systems [7,8,9,10,11,12]. Such stresses also lead to indirect consequences including water, air, and soil pollution [13,14,15,16,17]; disruption of water cycles [9,18,19]; and imbalances in coupled energy systems [20,21,22]. Moreover, in urban areas, the urban heat island (UHI) effect has further amplified thermal discomfort, especially affecting vulnerable populations such as the elderly, children, and those with health conditions [23,24,25,26]. This confluence of climatic and urban stressors has heightened awareness of the urgent need for effective, liveable and climate-responsive urban planning strategies [27,28].
In this context, urban green spaces (UGSs) have attracted increasing attention from urban planners and policymakers, not only for their environmental functions but also for their demonstrated benefits for physical and mental well-being [29,30,31,32]. Among the mechanisms that contribute to these health benefits, the cooling effects of urban greenery play a key role linking UGS to improved health outcomes [33,34]. These effects are primarily driven by microclimatic processes, including the capacity to moderate air temperature, radiation, and wind flow, which form the environment for perceived thermal comfort and related health benefits [32,35,36]. By mitigating heat exposure, these processes not only improve thermal conditions but also reduce associated health risks, thereby enhancing overall urban liveability, particularly during extreme heat events [33,37]. In this sense, assessing the microclimatic performance of green infrastructure becomes essential for understanding how design and vegetation structure translate into measurable improvements in human comfort [38,39].
However, the magnitude and spatial distribution of the cooling effects vary significantly across different urban context, depending on built density, surface materials, and the configuration of open areas [40,41,42]. Consequently, it cannot be assumed that, across neighbourhoods with different urban fabrics and territorial and built contexts, the role of UGS in heat mitigation contributes uniformly and with the same degree of effectiveness [36,41,43]. A more spatially explicit and model-based approach is therefore needed to examine whether the presence and arrangement of green spaces effectively improve thermal conditions at the neighbourhood scale, using models that allow the simulation of the three-dimensional fluid dynamics of a given site of interest [41,43,44].
This study focuses on analysing how thermal comfort varies with land cover and built form under extreme heat conditions. It examines the microclimatic performance of UGS within the neighbourhood of the Marconi district (Quartiere Marconi) in Imola, where an ongoing redevelopment project is reshaping both the spatial configuration and the vegetation structure of the area. Specifically, the construction of new residential buildings, public sports facilities, and expanded UGS provides a comparable context for the thermal conditions before and after intervention. ENVI-met (Version 6.0.0, ENVI-met GmbH, Essen, Germany) was selected as a multidisciplinary model that can simulate the physical and microclimatic behaviour of buildings, gardens, and landscapes within an urban environment over the course of a day. It has a typical spatial resolution of 0.5 to 10 m and a temporal resolution of 10 s, and can be used to simulate applications for urban planning, climate adaptation, comfort, and human health. Simulation results demonstrate the effects of architectural solutions, sustainable technologies, and the use of greenery and water on improving outdoor microclimatic conditions. Outputs include a wide range of meteorological, physical, and optical parameters describing urban components and 2D and 3D elements present in the simulated area, as well as a vast array of biometeorological indices. Through ENVI-met simulation of two scenarios (ex ante and ex post), the study aims to:
(a)
Analyse the spatial patterns of Physiological Equivalent Temperature (PET) across the neighbourhood under extreme heat conditions, providing evidence on how thermal comfort varies with land cover and built form;
(b)
Evaluate the thermal effects of the regenerated block, assessing whether the newly introduced trees and design modifications can alleviate heat stress or generate localised warming near new façades;
(c)
Compare thermal comfort between the standard adult and elderly models, highlighting age-related differences in vulnerability to microclimatic exposure.
To address these objectives, the manuscript first presents the study area and methodological framework, followed by the ENVI-met simulation results and analyses of the PET. The final section discusses the implications and limitations of the study.

2. Methods

2.1. Study Area and Scenario Setup

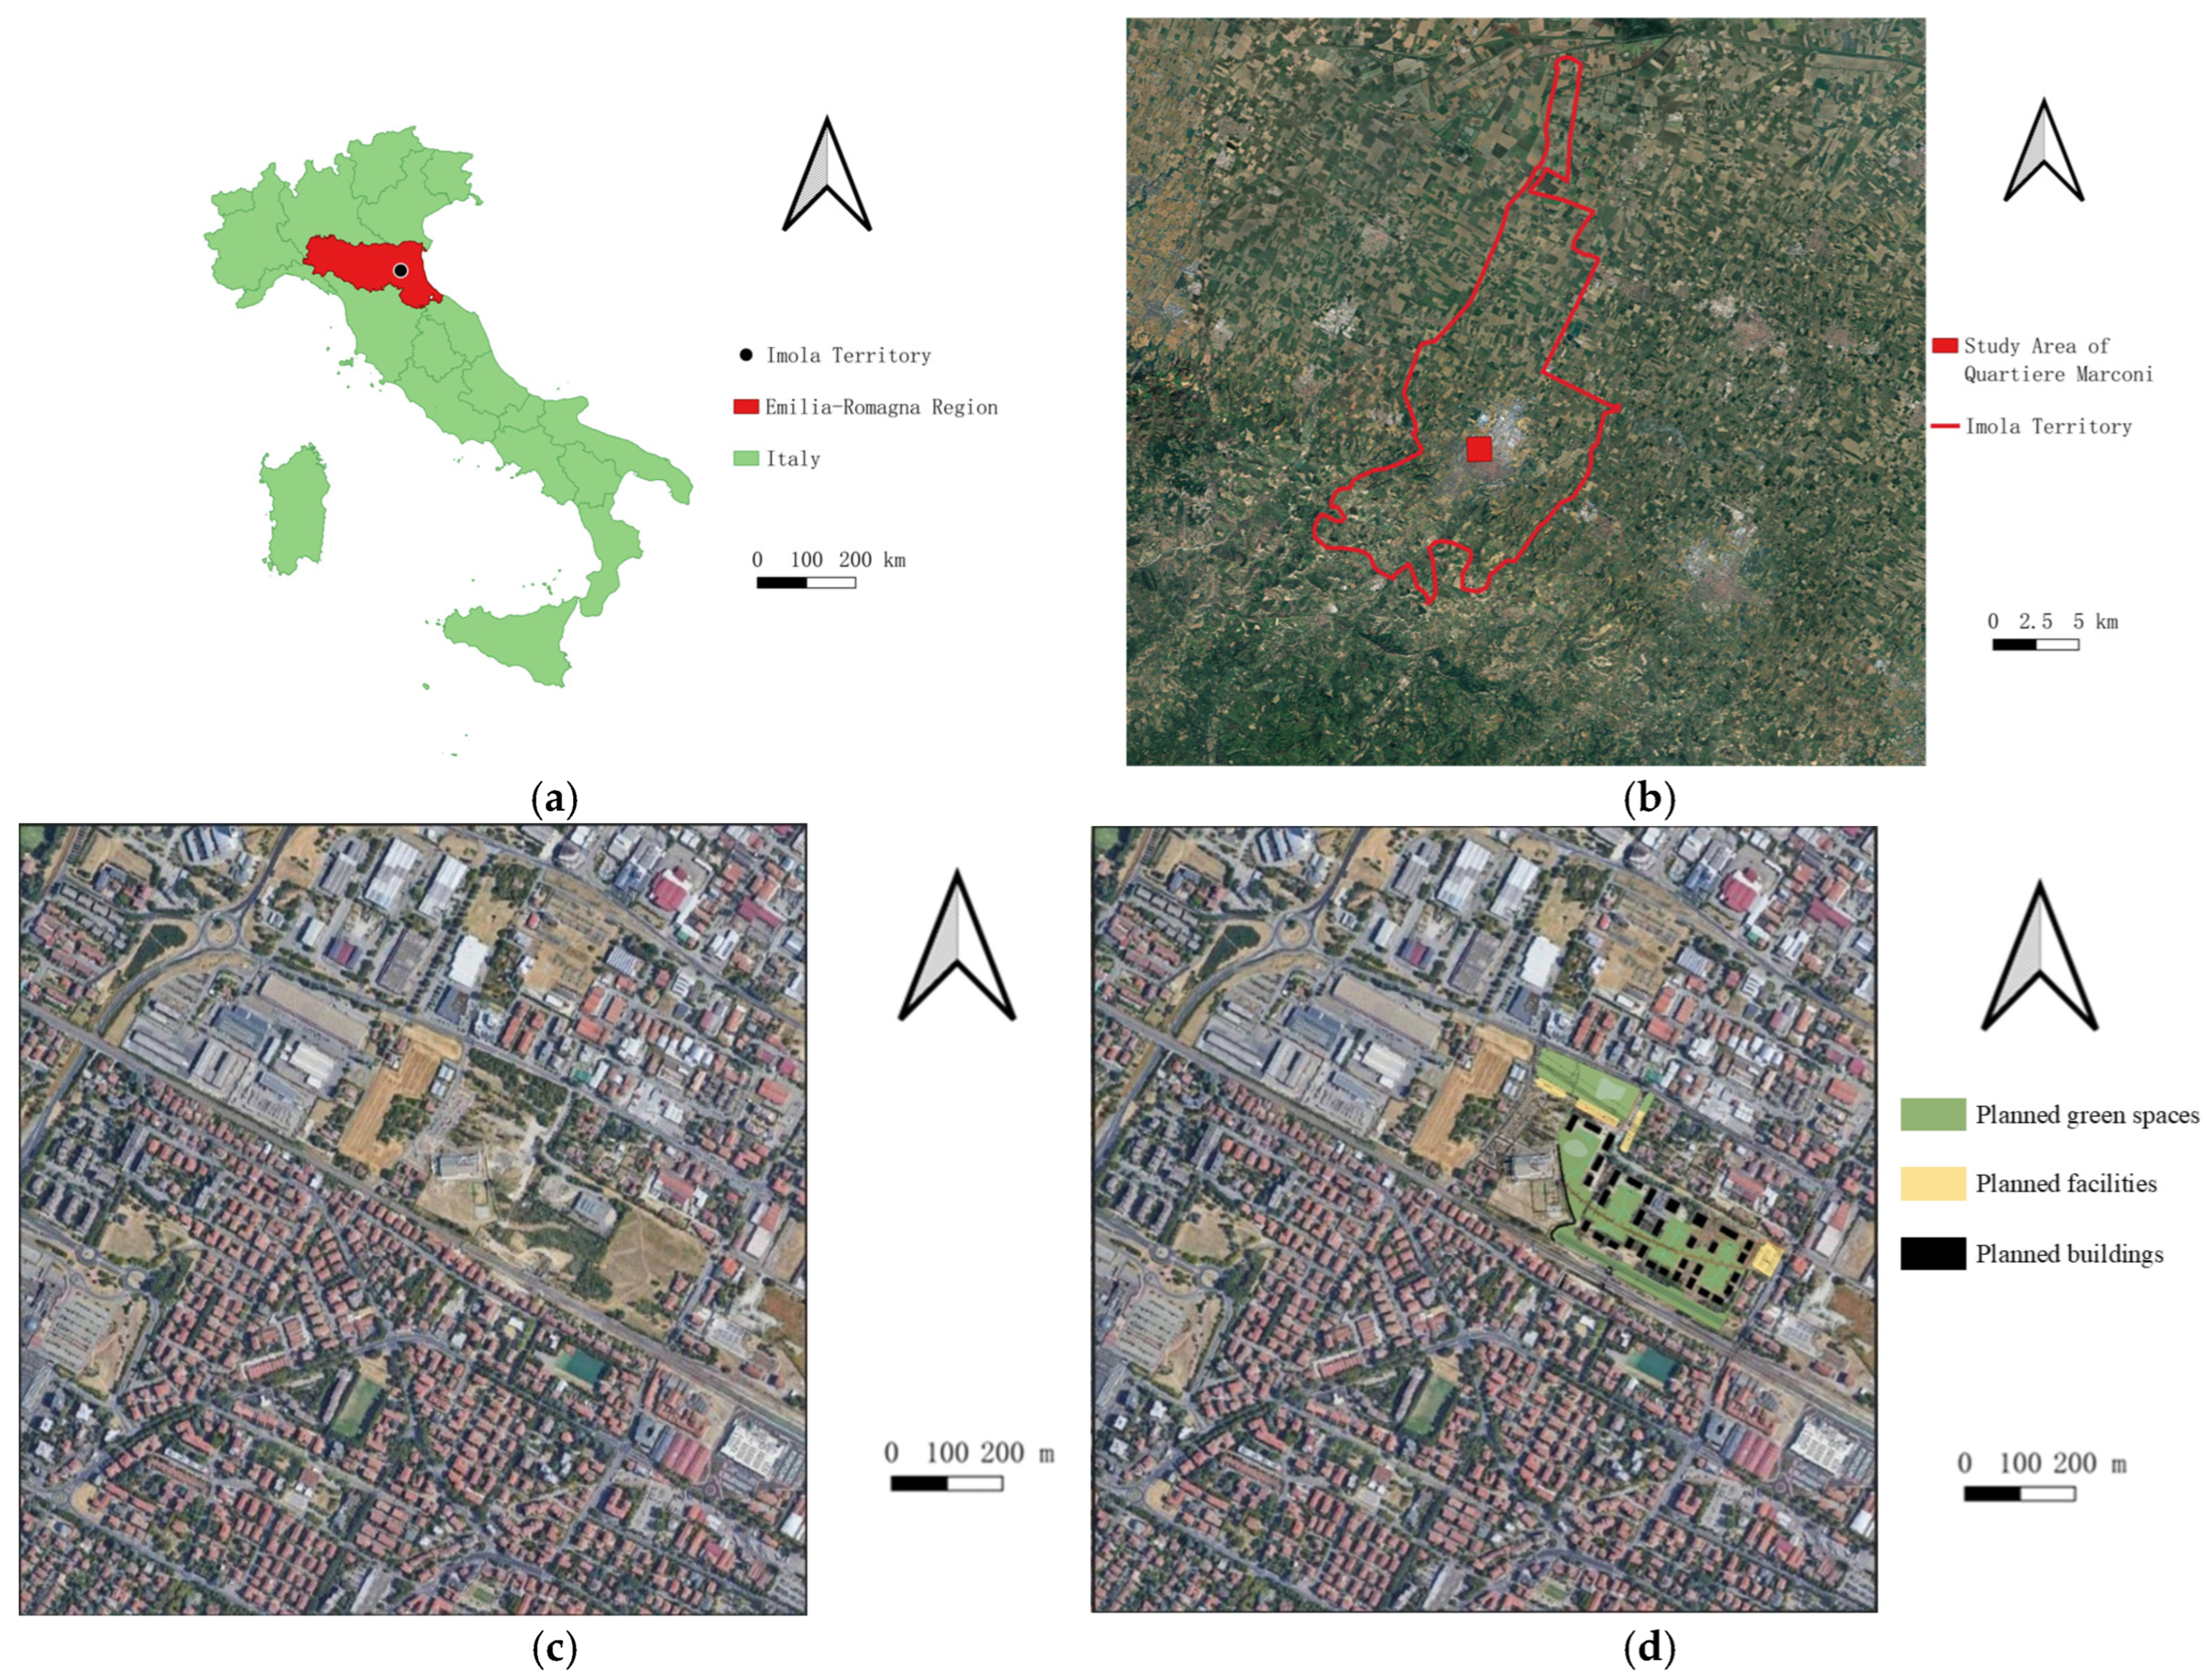
This study presents two ENVI-met simulations conducted in the Marconi district (Quartiere Marconi) of Imola, a city within the Metropolitan City of Bologna in northern Italy (Figure 1). The Marconi district is currently undergoing urban redevelopment led by the Municipality. The regeneration project focuses on a former industrial site of approximately 123,115 square metres, previously occupied by a butchery, municipal warehouse, open spaces, and a recycling centre. The redevelopment includes the construction of four-storey residential buildings, new sports facilities for public use, and expanded green spaces. The sports facilities (namely, the municipal swimming pool and the gyms with public car parks) and the railway underpass for cyclists and pedestrians (built in 2022 and co-financed by the Periferie Call for Proposals) have already been constructed in the vicinity of the residential area covered by the simulation. The demolition of the disused buildings of the former recycling centre is currently ongoing, while the municipal warehouse, open spaces, and associated facilities remain extant [45].
Two ENVI-met scenarios were developed to assess the potential impact of the planned regeneration project on local microclimatic conditions. The project involves transforming a large plot in the north-eastern section of the study area into a planned public green area, as this plot was identified by the Municipality as a priority site for urban renewal. Specifically, the ex ante represents the current configuration of the area, while the ex post reflects the planned condition after the proposed regeneration. Both scenarios were simulated under identical meteorological forcing, allowing for a direct comparison between the microclimatic conditions under the current and planned situation (Figure 1).

2.2. Meteorological Forcing for the Simulation

To reproduce representative extreme thermal conditions characteristic of summer heat waves, the simulations focused on the 22 July 2022, identified as a peak day within one of the regional heat wave episodes recorded in recent years in northern Italy (22–25 July). Hourly meteorological data were obtained from the Scarabelli Institute weather station in Imola (location: 44.36° N, 11.72° E) and used to initialise the ENVI-met model under Full Forcing mode. The forcing dataset included air temperature, relative humidity, wind speed and direction, and global radiation. These parameters provided the boundary conditions required to simulate the diurnal evolution of air temperature and thermal comfort. Outputs were generated for 13:00, 15:00, and 17:00, representing the main hours of afternoon heat stress. Among them, 15:00 was selected for detailed spatial analysis, as it corresponds to the maximum air temperature and the most critical conditions for outdoor thermal comfort.

2.3. Model Configuration and Parameterisation

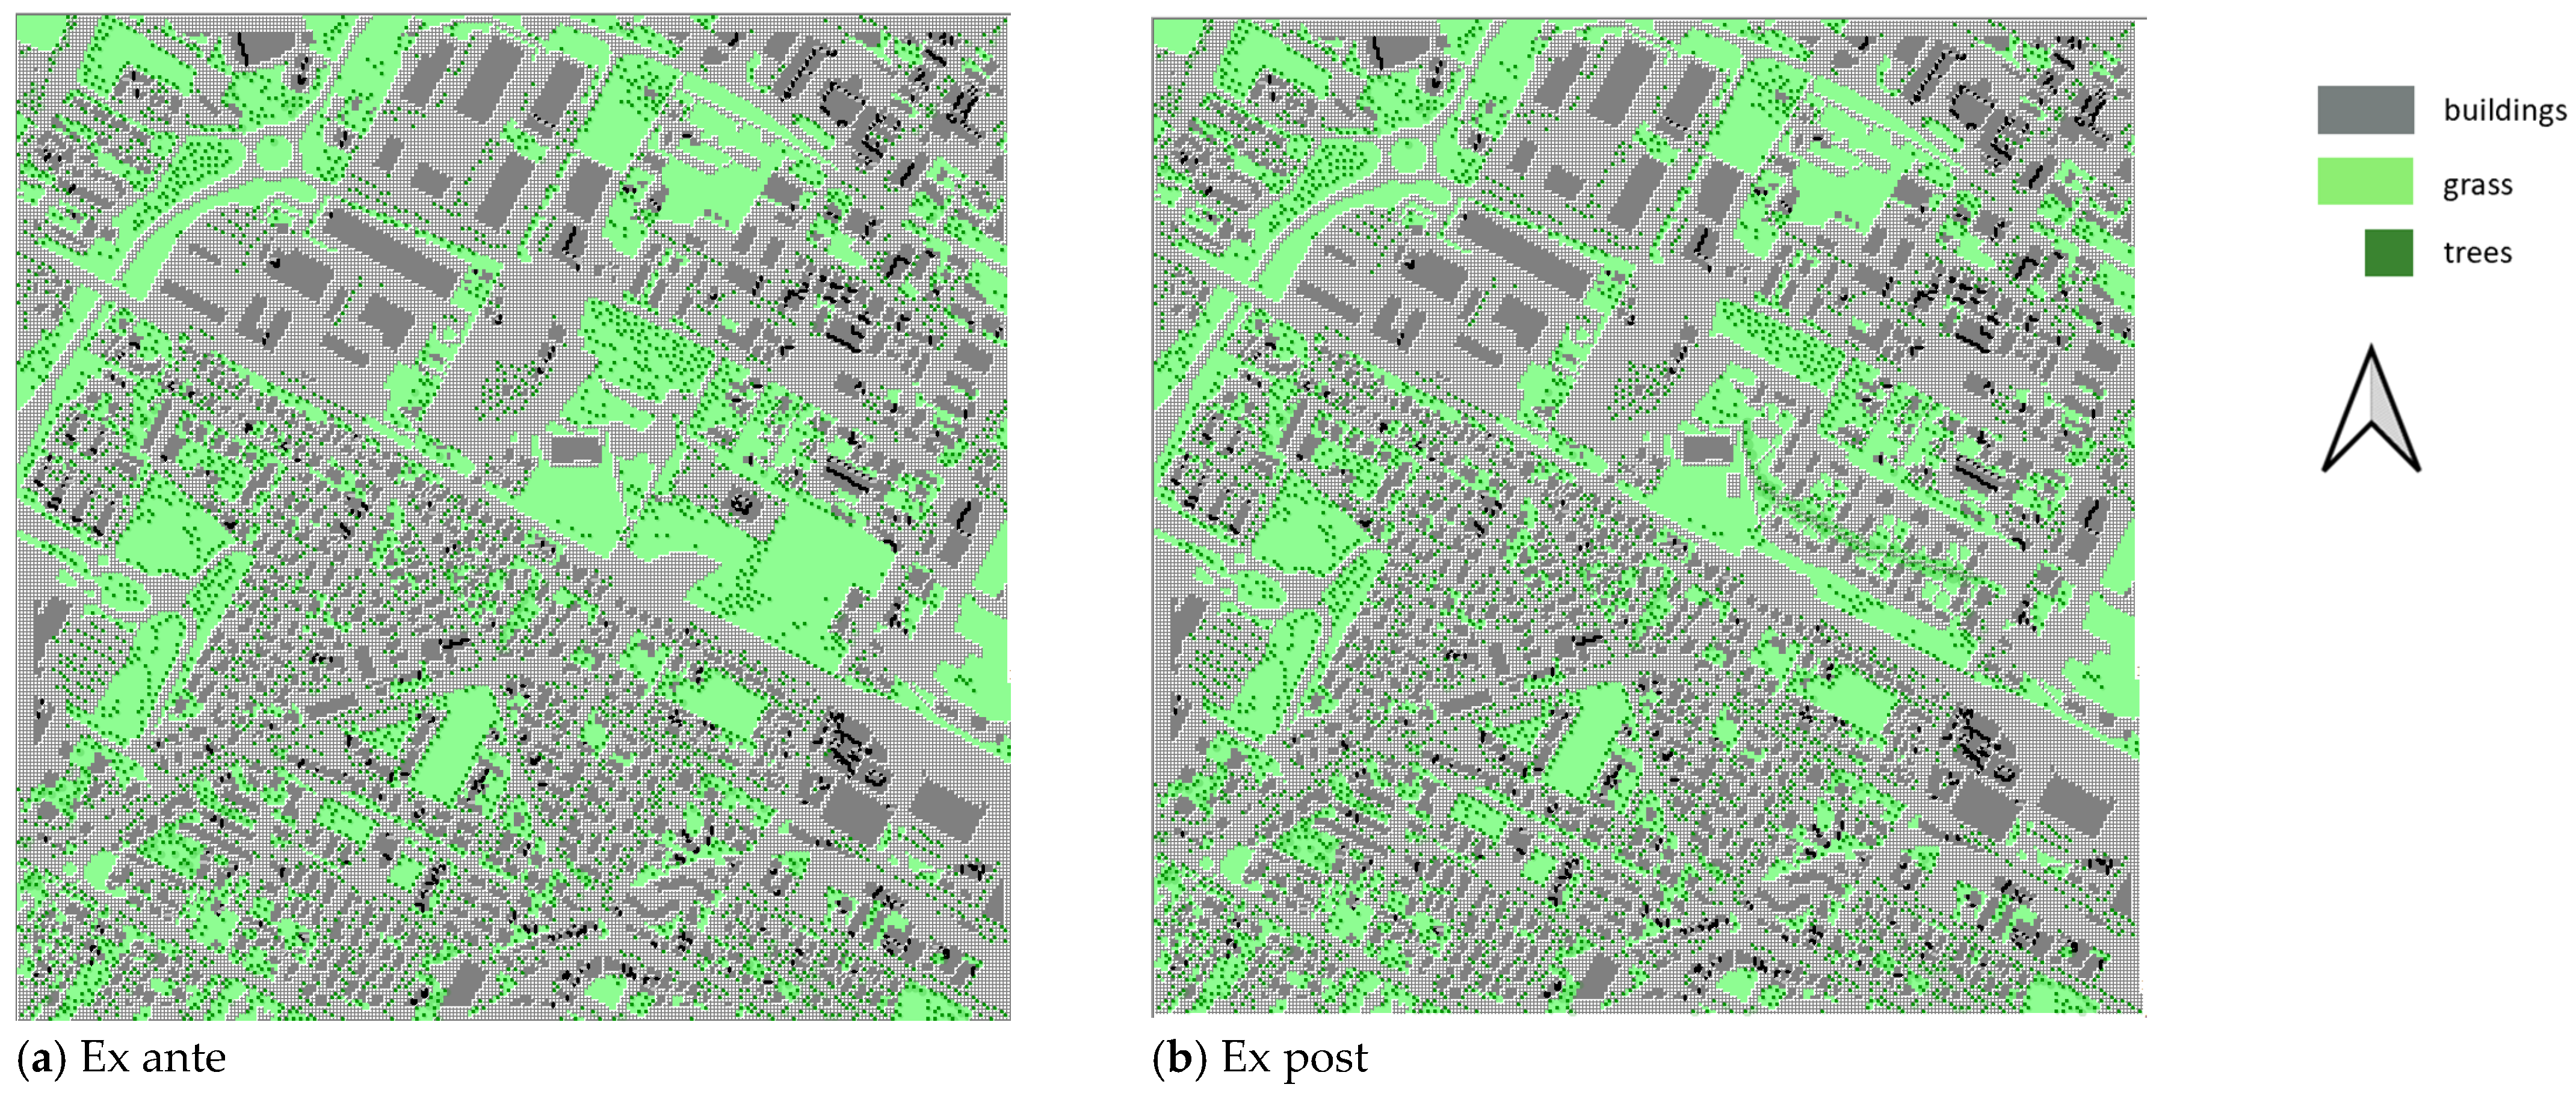
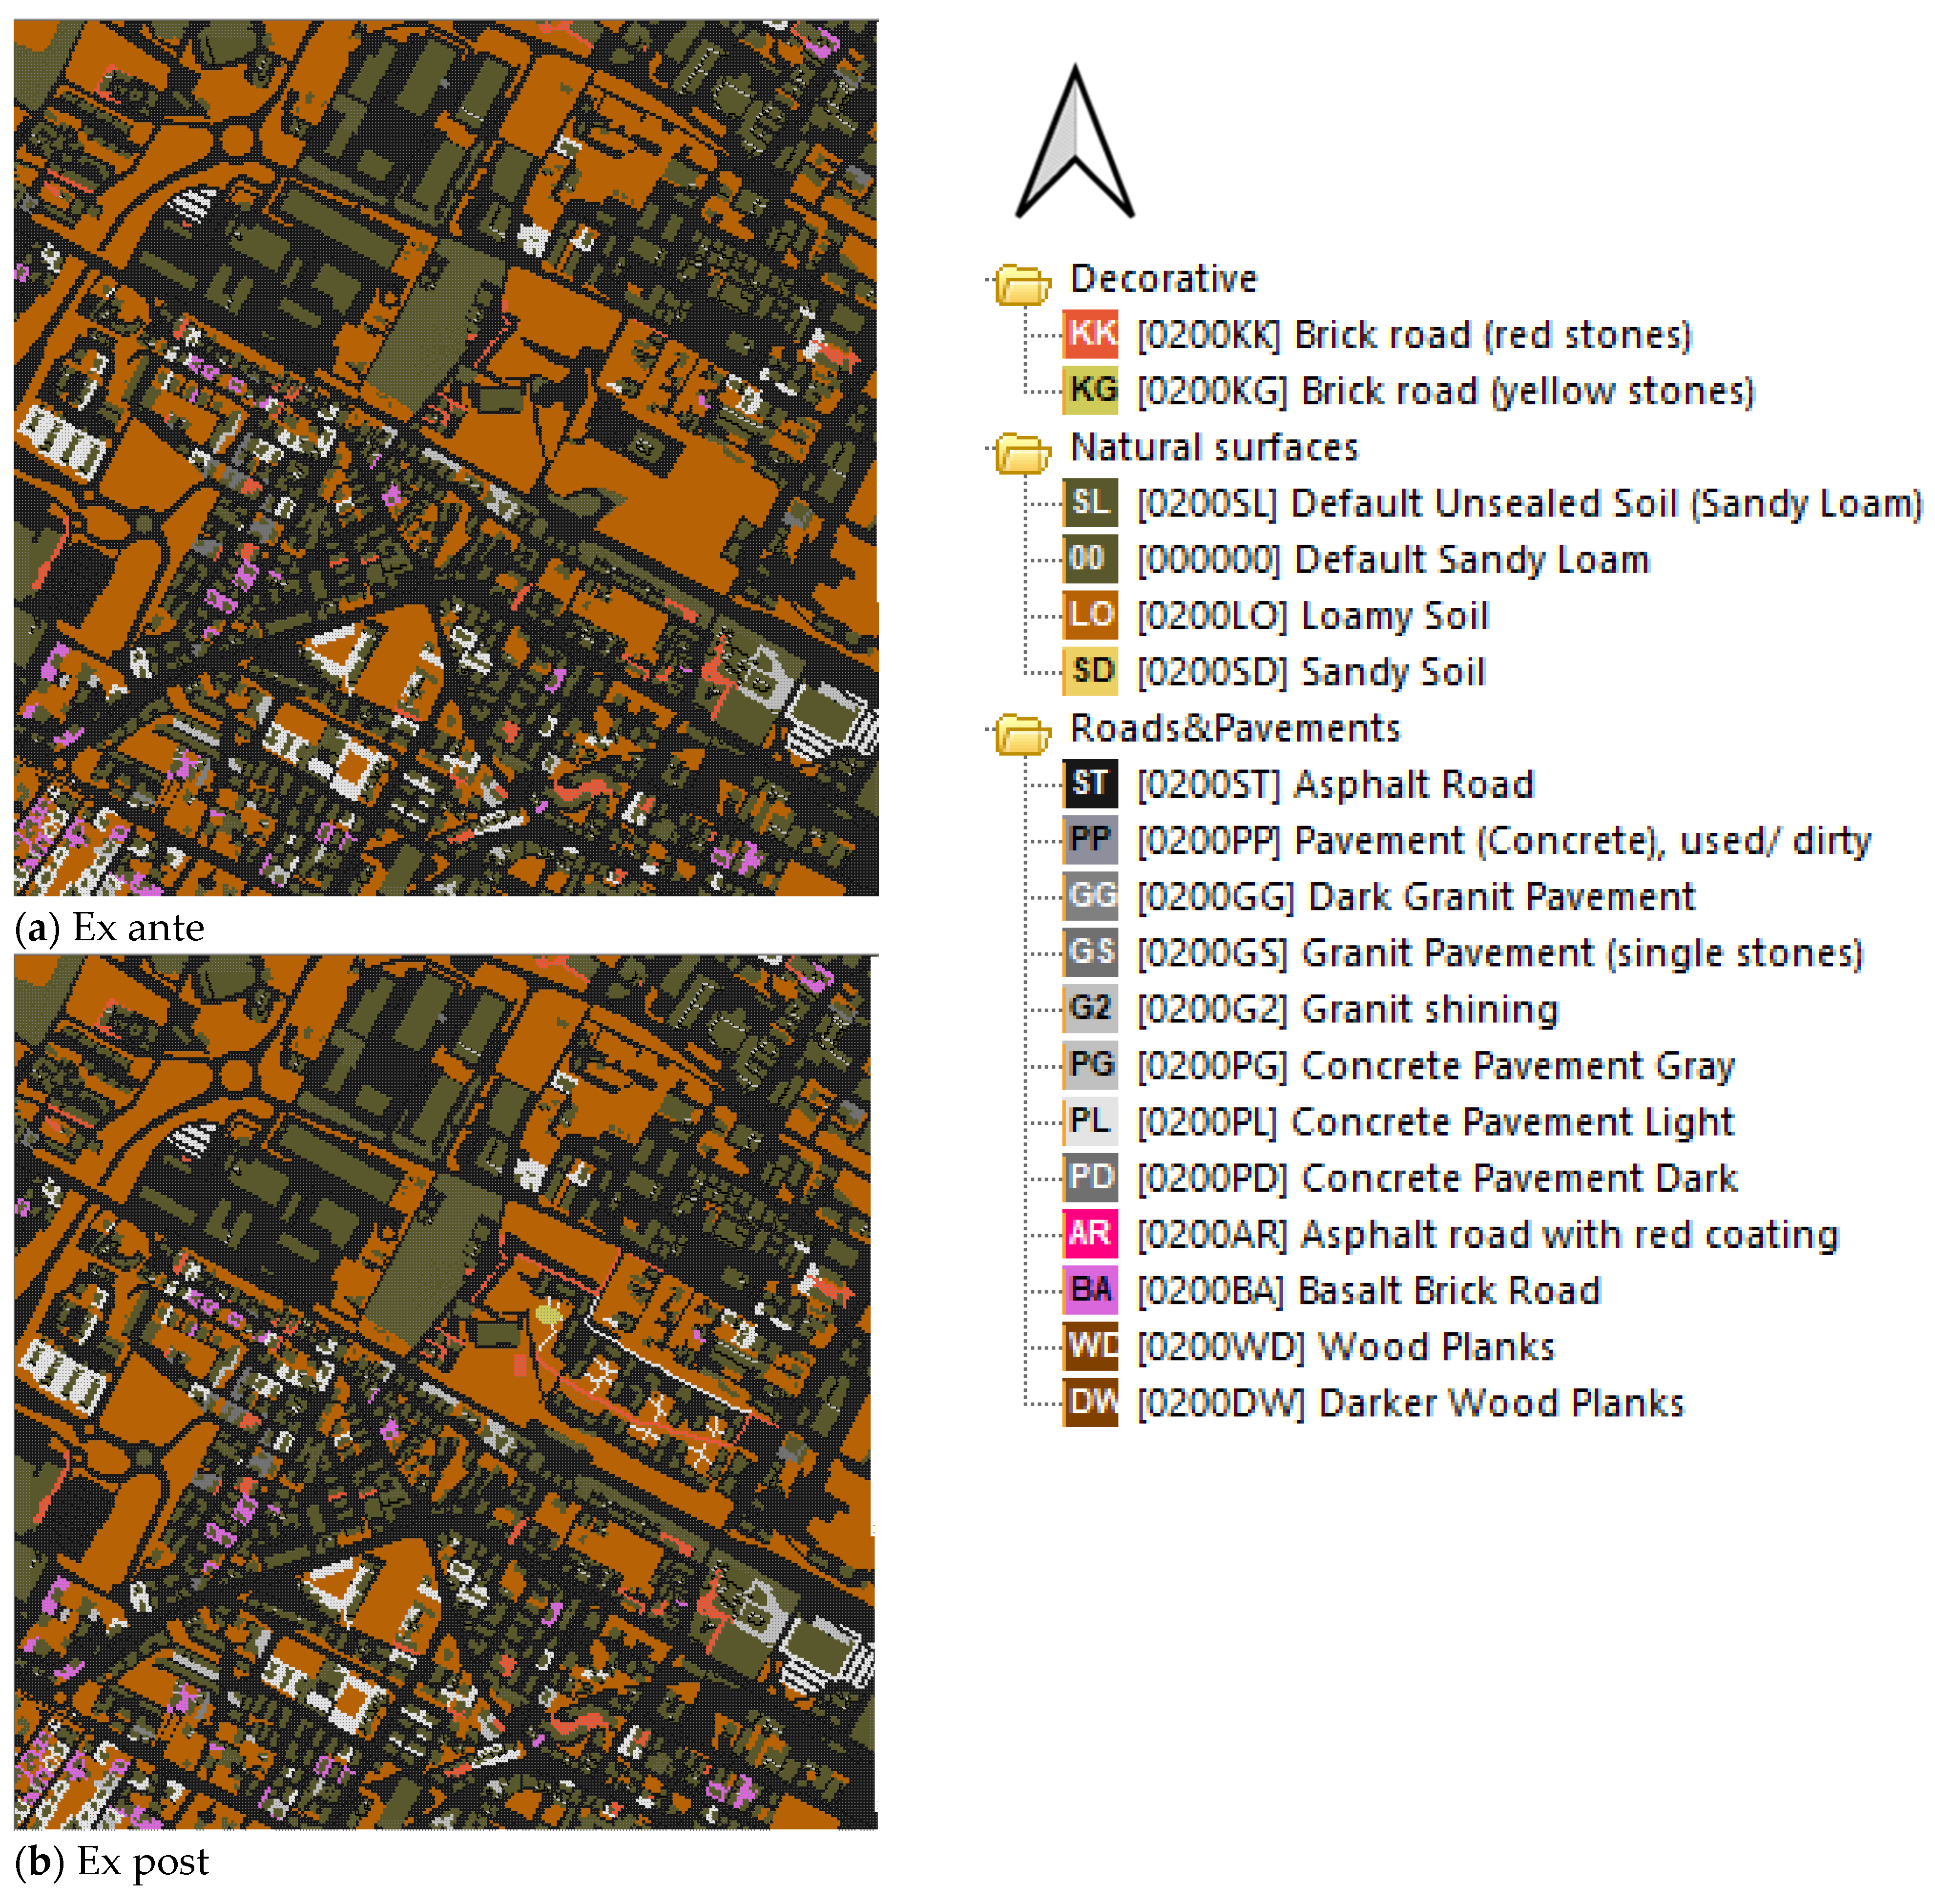
The computational domain covered an area of approximately 1400 × 1400 m, with a horizontal resolution of 5 m, discretised into 300 × 300 grid cells (Figure 1). The model included 30 vertical layers, with the first grid cell height of 0.2 m to resolve near-surface gradients. Building attributes were sourced from the GIS database provided by the Municipality of Imola. The dataset included footprints, heights, and material classes (façade and roof), which were directly imported into the ENVI-met model to reproduce the actual building morphology (Figure 2). Surface data, including artificial surfaces, bare soil, and green areas, were taken from the GIS database provided by the Municipality of Imola and verified through on-site observations. The dataset was further refined using Google Maps (Google LLC., Mountain View, CA, USA), and the final land cover layers were redrawn in ArcMap to ensure accurate representation of surface types (Figure 3). Vegetation data were collected by manually marking individual trees on Google Maps and verifying each position through Google Street View (Google LLC, Mountain View, CA, USA) and on-site observation. For every tree within the study area, species and height were recorded, and the complete dataset was then digitised and mapped in QGIS for model input. Each recorded species was then matched with the corresponding or most similar vegetation type available in the ENVI-met plant database and entered into the model (Figure 2). These data were used to parameterise the spatial distribution and physical attributes of surfaces and vegetation in the ENVI-met model.

2.4. Output Variables and Analysis

The analysis focused on Physiological Equivalent Temperature (PET) as the primary outcome, with air temperature and surface temperature used as contextual variables. PET was computed at the pedestrian level (1.8 m) for two representative subjects, (i) a standard adult (35 years old, 1.8 m, 80 kg), and (ii) an elderly adult (>80 years old, 1.8 m, 80 kg), both in typical summer clothing (short-sleeved attire). Other standard subjects available in ENVI-met include a child (aged 8) and an adult woman (aged 35). As the analysis focuses on age-related variability in thermal exposure, with particular attention paid to older adults, it was decided to generate outputs for two subjects of the same sex. The analysis focused on the time of maximum thermal stress (15:00). For each scenario (ex ante, ex post) and each modelled subjects (35 and 80 years old), PET maps were produced, together with difference maps to visualise the spatial extent of temperature reduction across the study area, capturing both the direct cooling of the regenerated block and the secondary effects on adjacent urban surfaces. Wind vectors at 1.8 m were inspected to characterise the background flow; as no material scenario-driven changes were observed, wind is not discussed further beyond qualitative reference.

3. Results

3.1. Visualisation Analysis

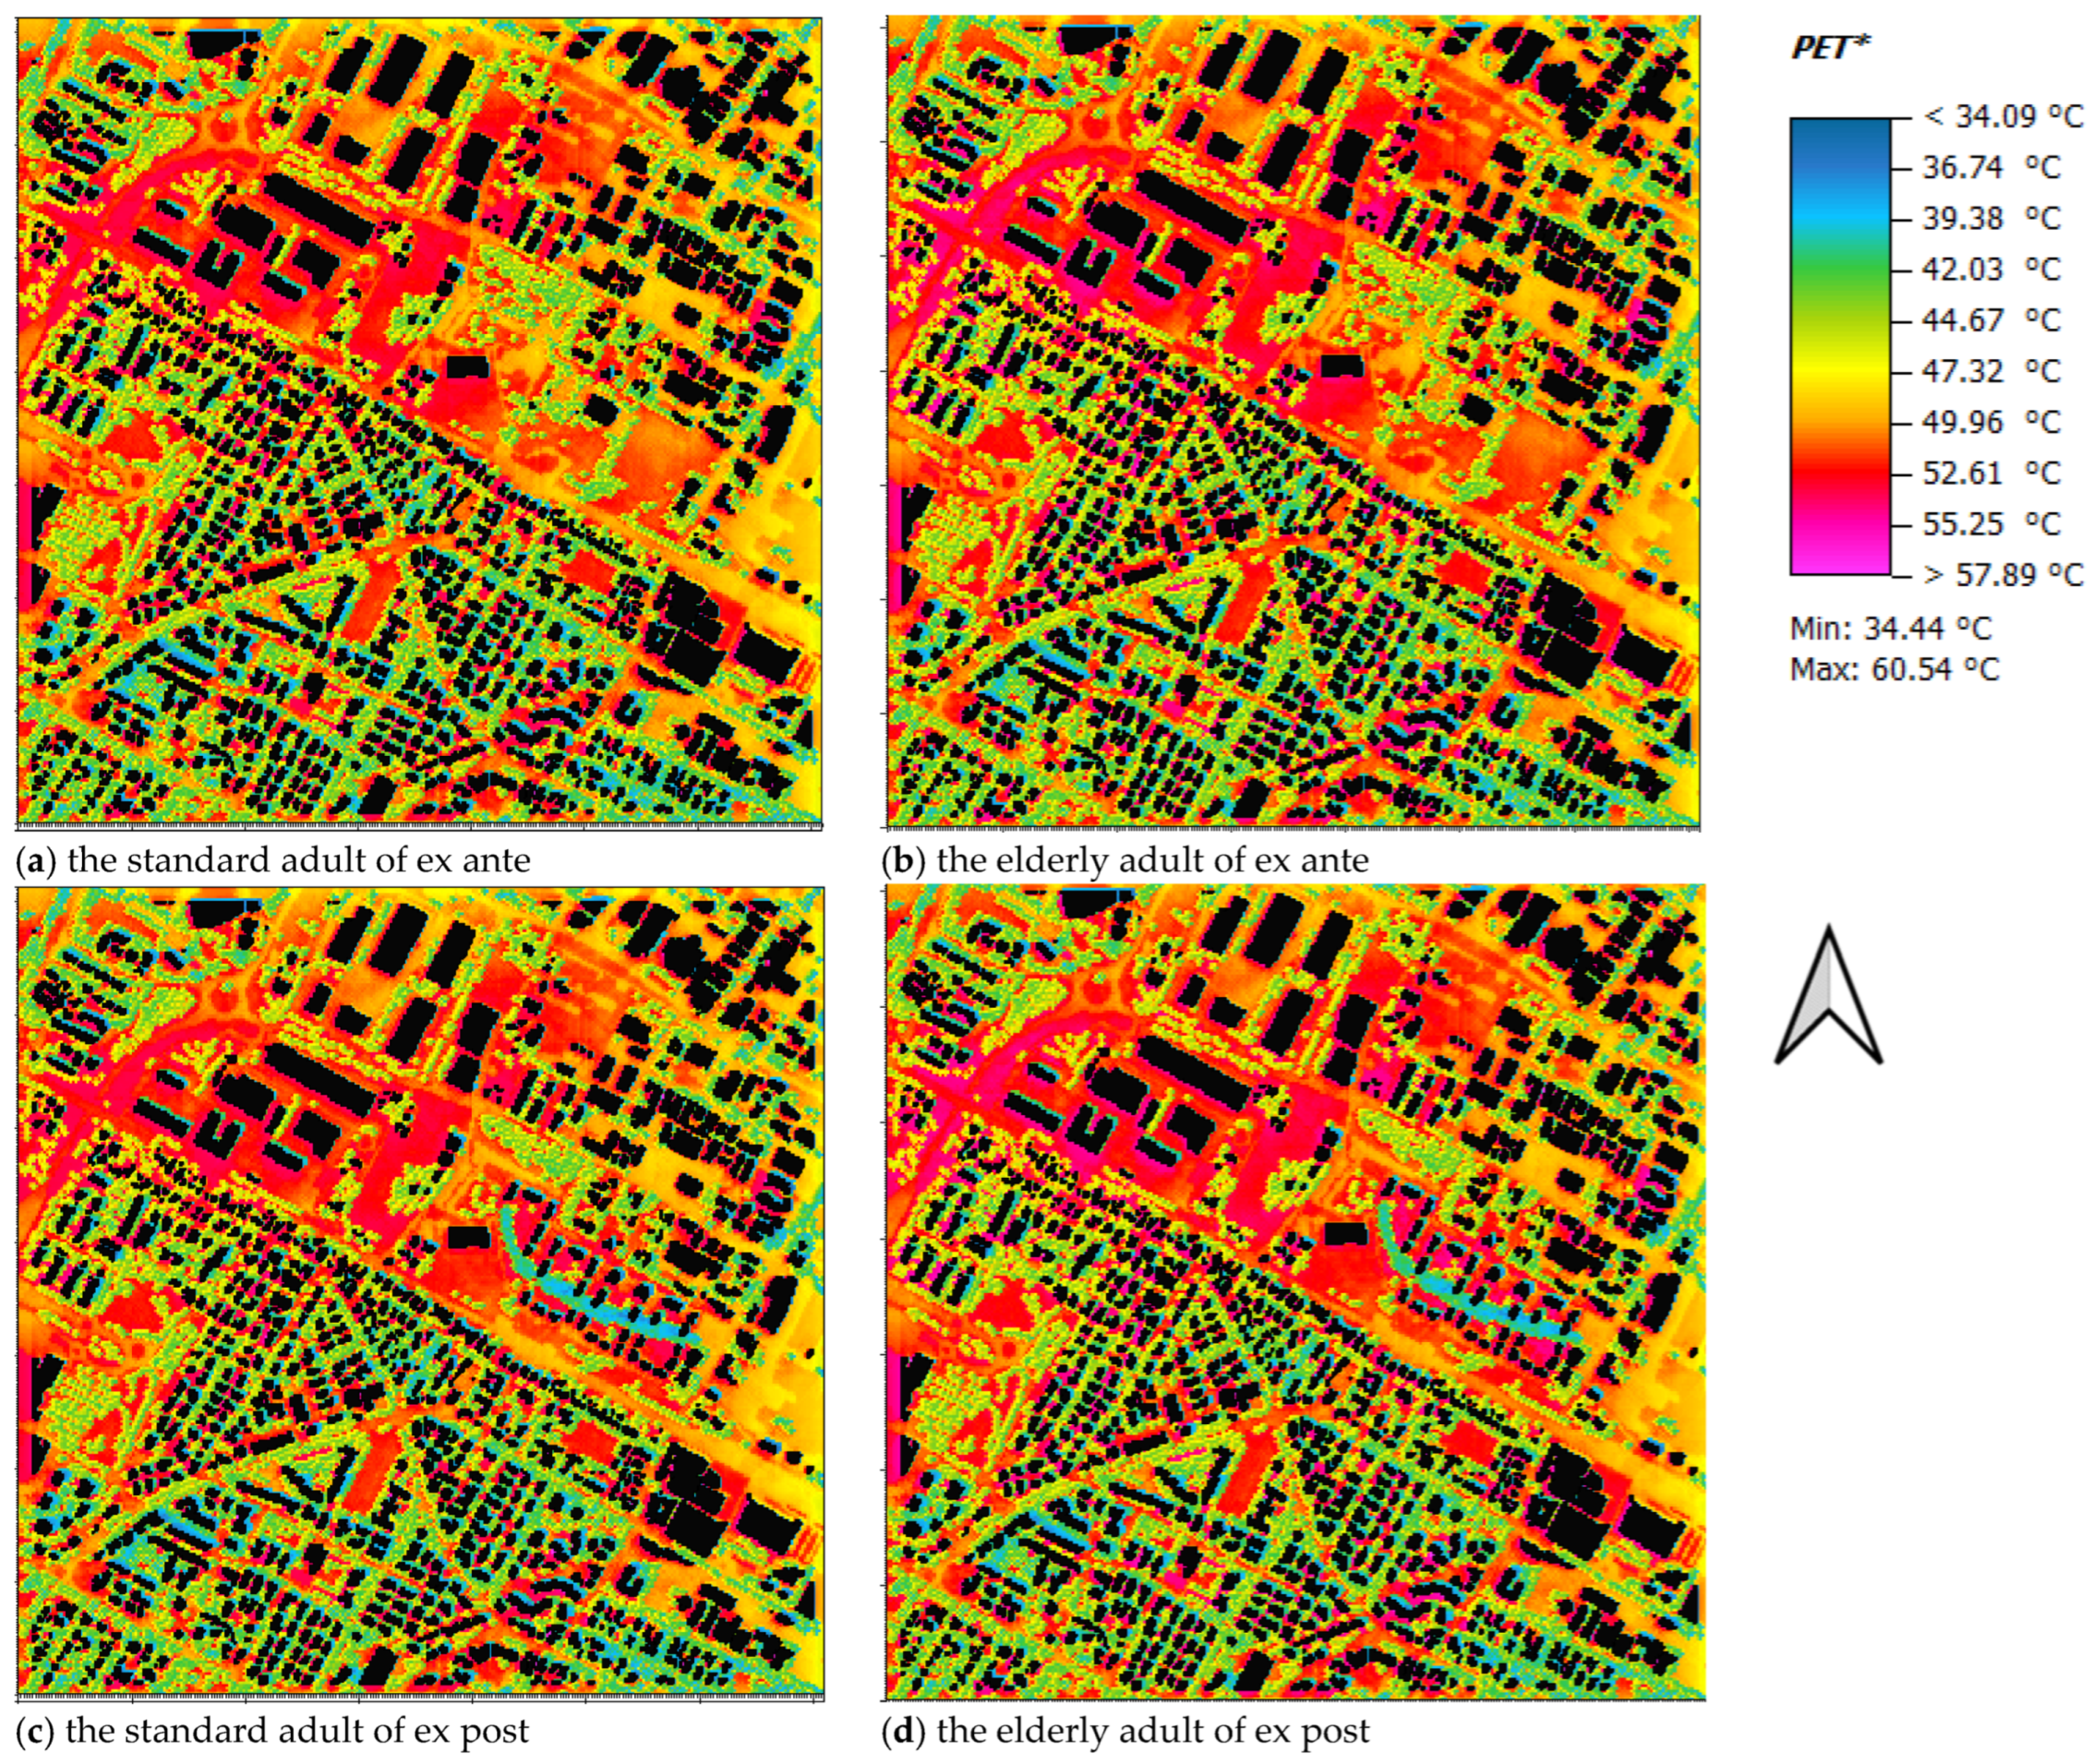
The analysis focused on the PET, used to represent the spatial distribution of outdoor thermal comfort across the study area. The simulation outputs at 15:00 were selected to capture the peak thermal load of the heat wave. Both the ex ante and ex post PET maps (Figure 4) reveal strong spatial contrasts associated with land cover heterogeneity, which are consistent across both the standard and elderly adult models.
Specifically, the hottest zones extend across impervious surfaces, such as roads, paved courtyards, and parking areas, as well as open grasslands or bare soil fully exposed to sunlight. Within these zones, the PET frequently reaches 49–53 °C, with local peaks approaching approximately 60 °C. Among artificial materials, slight differences appear. Darker asphalt and concrete retain the highest PET, while semi-paved or lighter pavements are slightly cooler by about 1–1.5 °C, a difference insufficient to modify the overall thermal stress pattern. The coolest zones coincide precisely with existing tree crowns, where PET drops into the lowest class (<38.3 °C), with edge zones occasionally entering the 39–41 °C bands. Between buildings, narrow shaded corridors produce intermediate values, and local heat accumulation near façades reflects limited ventilation and multiple reflections of short-wave radiation (Figure 4).
At the broader scale, a clear north–south contrast characterises the overall spatial pattern, divided by the railway. The persistence of high PET values is particularly evident in the northern area, where large industrial blocks and extensive artificial surfaces create a continuous belt of thermal stress. In contrast, the southern residential area characterised by abundant street trees and courtyard vegetation shows distinctly lower PET values. The continuous canopies formed by street trees keep PET mostly lower than 41 °C, supporting a cooler and more comfortable thermal environment throughout the southern residential area. Altogether, the landscape results show that neither grass nor high-albedo or permeable pavements could compensate for direct solar exposure. A genuine cooling effect occurs almost exclusively under tree cover (Figure 4). Overall, thermal comfort is primarily controlled by tree canopy presence, while surface materials alone have limited influence.

3.2. Comparison Between Two Scenarios

The comparison between ex ante and ex post shows that the regenerated block substantially alters local thermal conditions, regardless of the modelled subjects. Specifically, PET beneath the newly planted canopy generally remains below 41 °C, whereas on exposed pavements and lawns elsewhere, it frequently exceeds 49 °C. The cooling effect extended several metres beyond the canopy line, lowering PET by around 1–2 °C along adjacent courtyards and pavements (Figure 4).
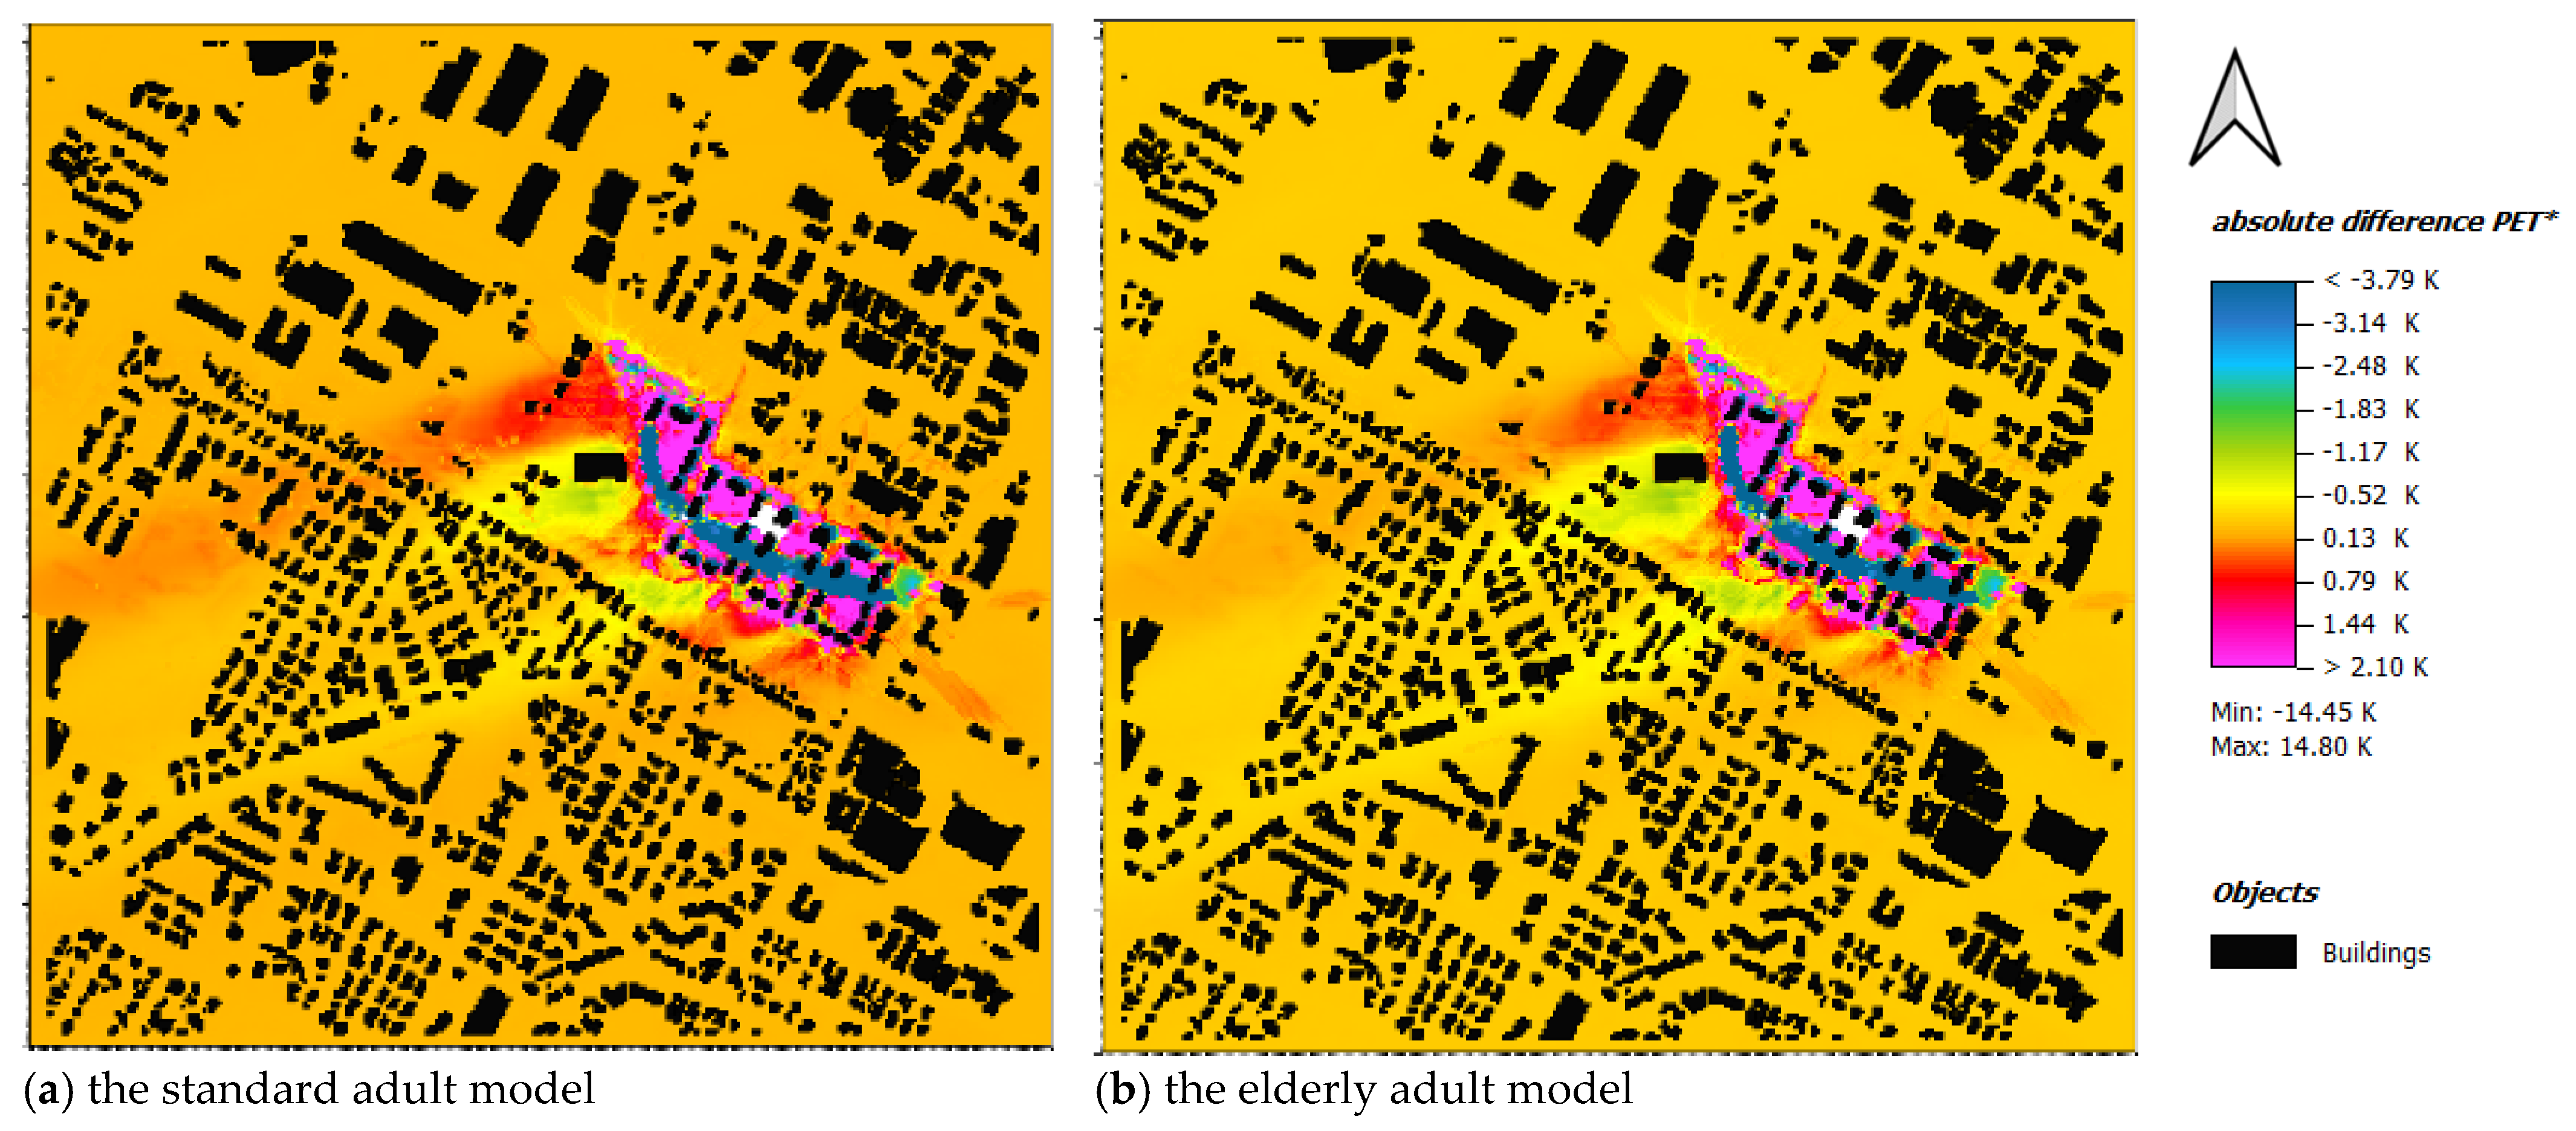
The PET difference map (ex post minus ex ante) (Figure 5) indicates that the PET response is spatially heterogeneous. Within the regenerated block, the PET beneath the newly planted tree canopies decreases by 1 °C to 3 °C, with a maximum local drop of about 3.5 °C at the park core. Paved surfaces surrounding the canopy zone show only minor changes (≤−0.5 °C). In contrast, local increases in PET (0.5 to 2 °C) are observed along the edge of the regenerated block, corresponding to the positions of newly introduced buildings. This warming extends to adjacent pavements, where PET remain about 0.5 to 1 °C higher than the ex ante scenario. South-west of the regenerated block, the PET difference map displays a distinctive radial pattern: a narrow warm streak extends westward, while a thin adjacent belt shows slight cooling (−0.5 to −1 °C), reflecting the interaction between shading and airflow. Overall, the redevelopment improves thermal conditions locally but introduces small-scale warming effects near built structures.

3.3. Comparison Between Two Modelled Subjects

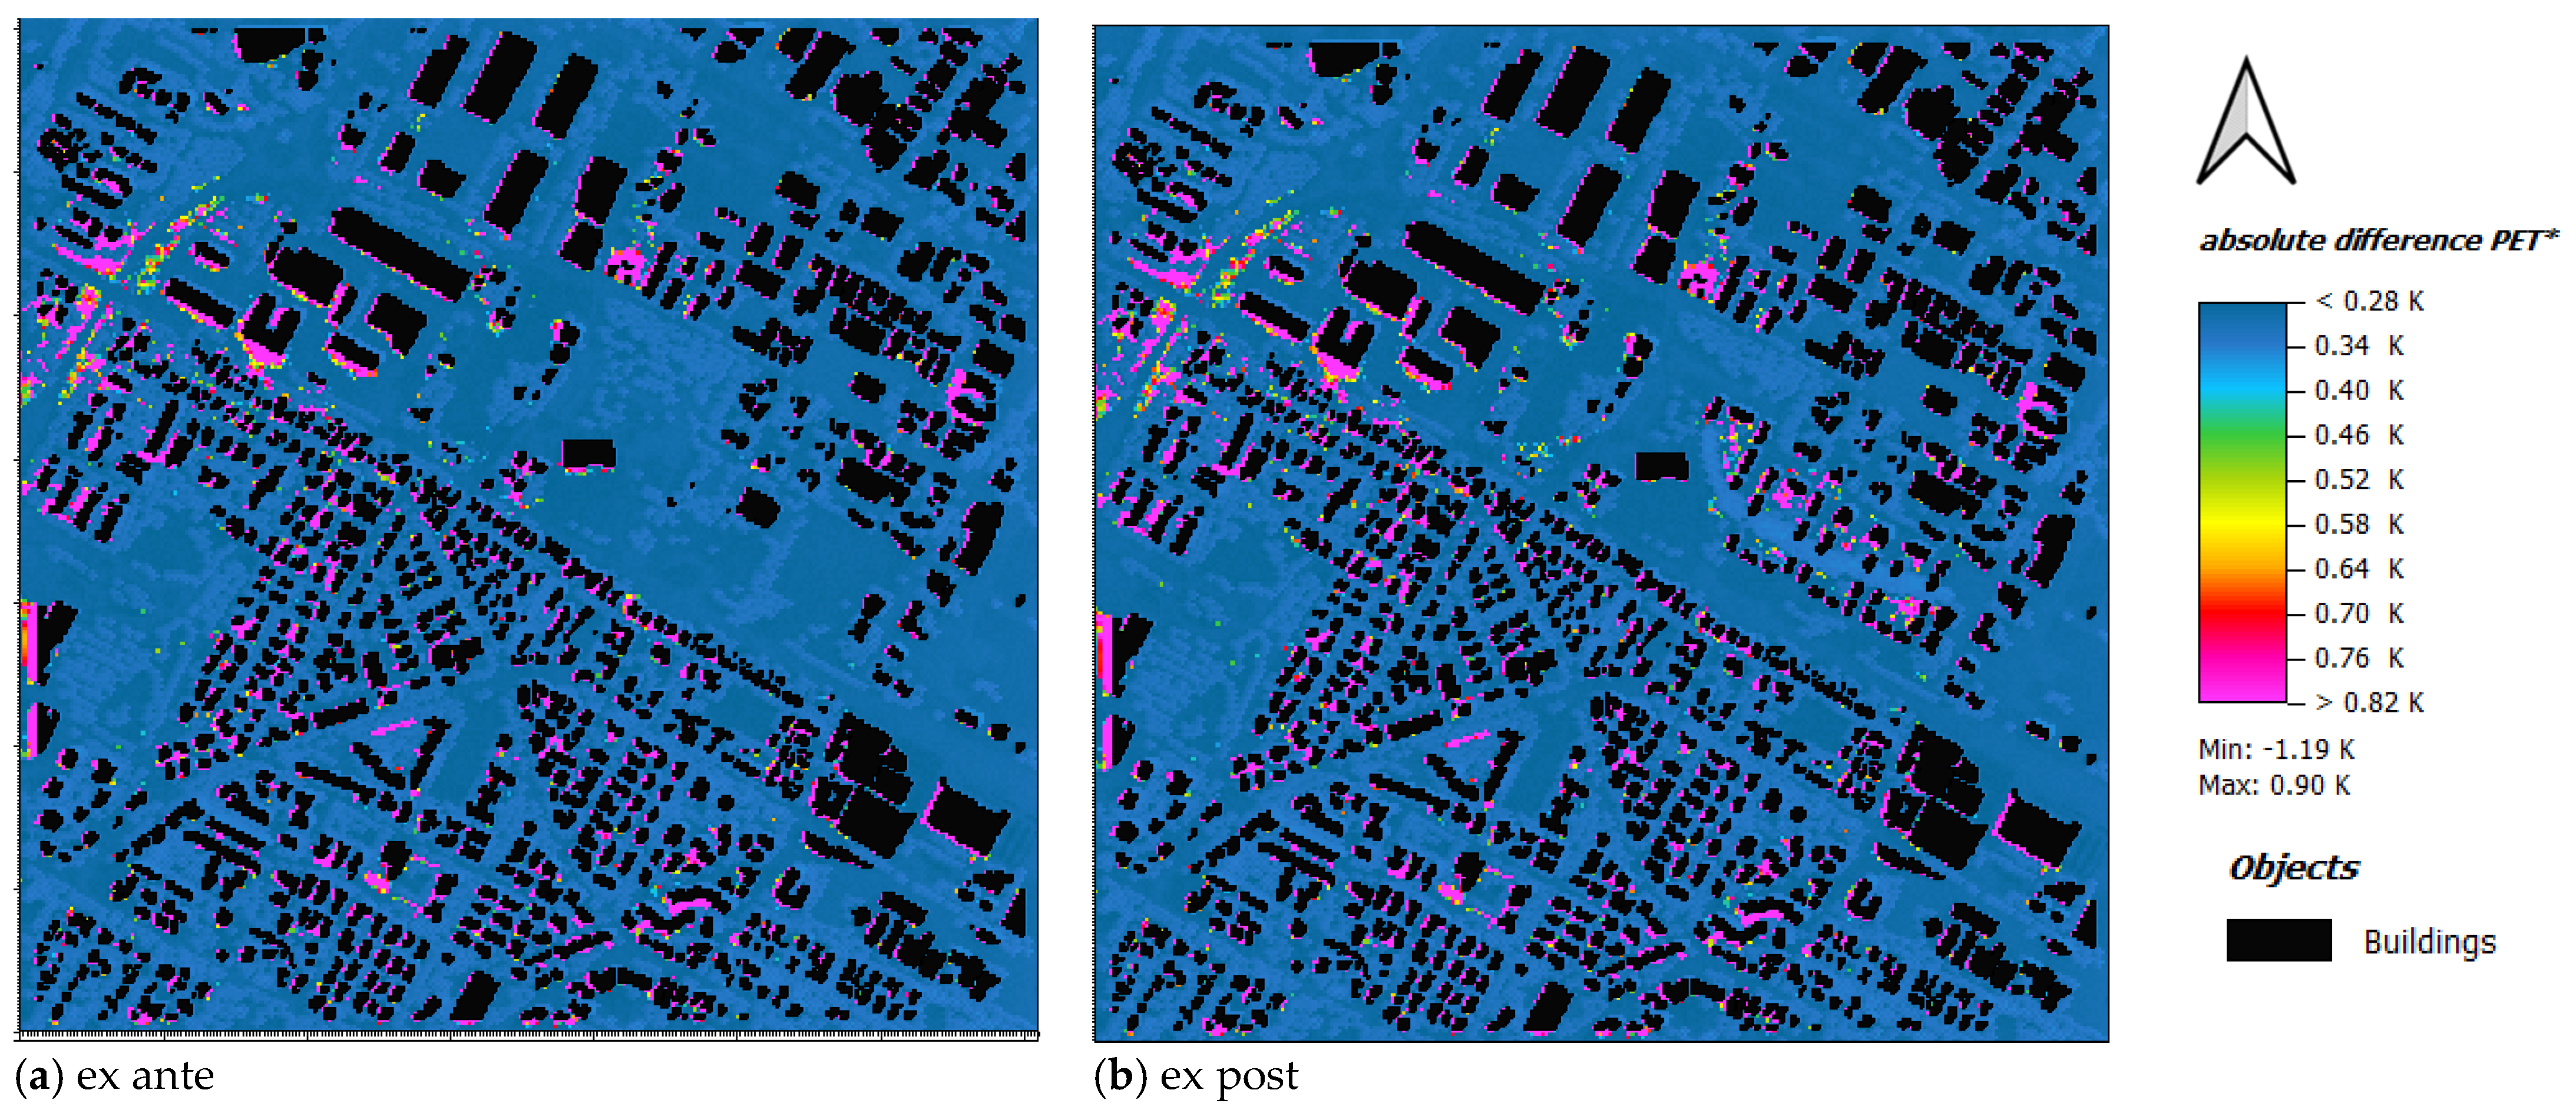
Across the study area, in both the ex ante and ex post maps, the difference in PET between the elderly and standard adult models remains minimal, generally below 0.5 °C, with slightly higher values (around 0.8–0.9 °C) occurring along building edges and courtyards. The lowest differences are observed under continuous tree canopies, while slightly higher values align with façade lines, particularly along south-west-facing surfaces associated with solar exposure. The regeneration does not significantly modify this pattern. Differences remain predominantly below 0.5 °C, with only localised variations near façades and open areas, and no consistent spatial trend emerges (Figure 6).

4. Discussion

The simulations clearly demonstrate that tree canopies provide the most decisive influence on local thermal comfort. In both the current (ex ante) and regenerated (ex post) configurations, meaningful cooling occurred almost exclusively beneath continuous tree canopies, while grass or other low vegetation produced negligible mitigation [47,48]. The newly planted trees in the regenerated block reduced PET by up to 3.5 °C at the core area and by 1–2 °C along the surrounding pavements, confirming the capacity of trees to buffer heat exposure at the pedestrian level [48,49,50]. In contrast, newly introduced buildings generated small but consistent warming bands along façades, consistent with previous findings on heat accumulation near façades [51,52]. Although the overall PET differences between the elderly and standard adult models remained modest, heat amplification near buildings had a relatively stronger impact on the elderly, highlighting the spatial concentration of thermal vulnerability [53,54,55]. These findings reveal a dual condition: effective greening can substantially alleviate local heat stress, yet architectural densification may counteract such benefits, particularly for more sensitive groups.
Tree canopy density was identified as the principal determinant of thermal improvement [47]. The simulated reduction in PET beneath the canopies corresponds with the mechanisms of shading and evapotranspirative cooling. Shaded zones interrupt short-wave radiation exchange and reduce mean radiant temperature, while transpiration enhances latent heat flux and moderates air temperature [47,49]. The combined effect is a marked lowering of physiological heat load even under extreme meteorological forcing [56]. In contrast, lawns and permeable surfaces displayed limited influence. Without overhead shading, the PET remains only marginally altered, and surface albedo differences of 1–2 °C cannot compensate for direct solar exposure. Similar conclusions were reached in empirical and modelling studies [57,58]. This distinction underscores that qualitative greening, in terms of vertical structure and foliage cover, is more relevant to human comfort than mere quantitative expansion of vegetated area. Hence, from the perspective of urban planning and public health, these results reinforce the need to prioritise tree planting and canopy management. Increasing canopy continuity not only mitigates urban heat but also enhances the usability of outdoor spaces during hot periods, supporting physical activities (PA) and social interaction, and thereby contributing to public health in cities [47,59]. By improving thermal comfort, well-designed green infrastructure can thus contribute to creating urban environments that are not only cooler but also more accessible.
Although the canopies can effectively alleviate heat stress, the built-up areas exhibit a modest but coherent rise in PET, particularly along the south-western façades, which coincide with building projection areas. This pattern reflects the well-known processes of radiative trapping and heat storage associated with dense urban forms. Building envelopes with low albedo and high thermal inertia absorb short-wave radiation throughout the day and release it later as long-wave flux, sustaining elevated thermal loads even after peak solar hours [60,61]. Moreover, façade alignments and limited ventilation corridors can locally concentrate heat, producing micro-zones of discomfort [62,63]. Meanwhile, the observed subtle radial pattern with a narrow zone of warming extending westward and a small cooling sector to the south-west indicates that the locally regenerated block can redistribute surface heat and airflow at the broader scale [64,65].
The elderly model responded more strongly, although differences remained small. Although the PET difference rarely exceeded 1 °C, even small increments may translate into disproportionately higher physiological strain for older adults, whose thermoregulatory capacity and sweat response are reduced [66,67,68]. The results therefore highlight a spatial dimension of vulnerability, as thermal disadvantage tends to cluster around architectural masses. These findings are consistent with recent studies on thermal inequity in compact cities, suggesting that socially or physiologically vulnerable groups often occupy or traverse spaces most affected by heat accumulation [69,70,71]. Addressing such localised risks requires an integrated approach. For example, implementing vertical or façade greening near building fronts, applying reflective or permeable surface materials, and preserving open ventilation corridors can effectively reduce near-wall warming and improve outdoor thermal conditions [72,73]. Importantly, these strategies do not merely improve thermal indices but also contribute to health equity, ensuring that the protective effects of urban greening extend to populations with limited adaptive capacity [74,75].
Overall, the simulations highlight how microclimatic design can strengthen the environmental foundations of health promotion in cities. By confirming the cooling efficiency of tree canopies and identifying spatial pockets of thermal vulnerability, this study demonstrates that ecological structure plays a decisive role in shaping comfortable and equitable urban environments. The persistence of local heat around buildings also highlights the need to balance densification and liveability through integrated design approaches that treat greening as part of public health infrastructure. These findings contribute to a growing body of evidence that effective UGS strategies depend not only on measurable cooling but also on their capacity to create environments that are both thermally comfortable and supportive of human well-being. For urban planners and policymakers, this implies that tree planting and canopy management should be prioritised not as isolated amenities but as essential components of sustainable urban development.

Limitations

This study has several limitations. Although the ENVI-met simulations provided valuable insight into the environmental mechanisms of local thermal comfort, the model represents a simplified reconstruction of complex urban dynamics. Its static boundary conditions, uniform clothing and activity parameters, and limited ability to capture adaptive behaviour mean that the simulated comfort indices may not fully reproduce the diversity of real thermal experiences. In addition, the analysis covered a single day representing an extreme heat wave. While this approach isolates the spatial influence of vegetation and built form, it cannot account for temporal variability such as seasonal canopy changes, soil moisture fluctuations, or behavioural adaptation.
Furthermore, this study focused exclusively on objective microclimatic conditions and did not incorporate subjective perceptions of thermal comfort. While PET provides a physiologically based metric of heat stress, individual thermal experiences are also shaped by psychological, behavioural, and sociodemographic factors that were beyond the scope of this modelling approach. Future research could address this gap by combining microclimate simulations with surveys or interviews to examine how objective thermal conditions align with perceived comfort and residents’ well-being, along with psychological, sociodemographic, and behavioural factors.

5. Conclusions

In conclusion, tree canopies reduced PET by up to 3.5 °C, while grass provided negligible cooling. However, new buildings generated localised warming up to 2 °C along façades, revealing a trade-off between densification and liveability. Elderly populations experienced slightly higher thermal stress near buildings, highlighting spatial vulnerability. Therefore, thermal comfort should be treated as a planning priority, rather than a side benefit of urban greening. Future work should examine how these objective thermal conditions translate into perceived comfort and behavioural responses, ideally by integrating microclimate simulations with subjective surveys.

Author Contributions

Conceptualisation, S.T., T.G. and Z.X.; methodology, Z.X., T.G. and L.C.; software, Z.X. and L.C.; validation, Z.X. and L.C.; formal analysis, Z.X.; investigation, S.T., S.M., F.R., L.C. and Z.X.; resources, S.T., F.R. and T.G.; data curation, Z.X.; writing—original draft preparation, Z.X.; writing—review and editing, Z.X., S.T., L.C. and S.M.; visualisation, L.C.; supervision, S.T.; project administration, S.T. All authors have read and agreed to the published version of the manuscript.

Funding

This research received no external funding.

Data Availability Statement

The data presented in this study are available on request from the corresponding author. The data are not publicly available due to privacy or ethical restrictions.

Acknowledgments

The authors gratefully acknowledge the Municipality of Imola, in particular to Elisa Spada for the opportunity to participate in the preliminary scientific assessment of their new green space project. This collaboration allowed us to conduct research that provides scientific foundation for green space design decisions.

Conflicts of Interest

The authors declare no conflicts of interest.

References

  1. Lhotka, O.; Kyselý, J.; Farda, A. Climate change scenarios of heat waves in Central Europe and their uncertainties. Theor. Appl. Climatol. 2018, 131, 1043–1054. [Google Scholar] [CrossRef]
  2. Christidis, N.; Jones, G.S.; Stott, P.A. Dramatically increasing chance of extremely hot summers since the 2003 European heatwave. Nat. Clim. Change 2015, 5, 46–50. [Google Scholar] [CrossRef]
  3. Rousi, E.; Fink, A.H.; Andersen, L.S.; Becker, F.N.; Beobide-Arsuaga, G.; Breil, M.; Cozzi, G.; Heinke, J.; Jach, L.; Niermann, D.; et al. The extremely hot and dry 2018 summer in central and northern Europe from a multi-faceted weather and climate perspective. Nat. Hazards Earth Syst. Sci. 2023, 23, 1699–1718. [Google Scholar] [CrossRef]
  4. Domeisen, D.I.; Eltahir, E.A.; Fischer, E.M.; Knutti, R.; Perkins-Kirkpatrick, S.E.; Schär, C.; Seneviratne, S.I.; Weisheimer, A.; Wernli, H. Prediction and projection of heatwaves. Nat. Rev. Earth Environ. 2023, 4, 36–50. [Google Scholar] [CrossRef]
  5. Laino, E.; Iglesias, G. Extreme weather events and environmental contamination under climate change: A comparative review of ten European coastal cities. Curr. Opin. Environ. Sci. Health 2025, 45, 100606. [Google Scholar] [CrossRef]
  6. Ummenhofer, C.C.; Meehl, G.A. Extreme weather and climate events with ecological relevance: A review. Philos. Trans. R. Soc. B Biol. Sci. 2017, 372, 20160135. [Google Scholar] [CrossRef] [PubMed]
  7. Sillmann, J.; Thorarinsdottir, T.; Keenlyside, N.; Schaller, N.; Alexander, L.V.; Hegerl, G.; Seneviratne, S.I.; Vautard, R.; Zhang, X.; Zwiers, F.W. Understanding, modeling and predicting weather and climate extremes: Challenges and opportunities. Weather. Clim. Extrem. 2017, 18, 65–74. [Google Scholar] [CrossRef]
  8. Sharifi, A. Resilience of urban social-ecological-technological systems (SETS): A review. Sustain. Cities Soc. 2023, 99, 104910. [Google Scholar] [CrossRef]
  9. Alberti, M. Cities of the Anthropocene: Urban sustainability in an eco-evolutionary perspective. Philos. Trans. R. Soc. B 2024, 379, 20220264. [Google Scholar] [CrossRef]
  10. Joshi, K.; Khan, A.; Anand, P.; Sen, J. Understanding the synergy between heat waves and the built environment: A three-decade systematic review informing policies for mitigating urban heat island in cities. Sustain. Earth Rev. 2024, 7, 25. [Google Scholar] [CrossRef]
  11. Mokhtari, Z.; Barghjelveh, S.; Sayahnia, R.; Qureshi, S.; Russo, A. Dynamic and heterogeneity of urban heat island: A theoretical framework in the context of urban ecology. Land 2022, 11, 1155. [Google Scholar] [CrossRef]
  12. Ningrum, W. Urban heat island towards urban climate. In IOP Conference Series: Earth and Environmental Science; IOP Publishing: Bristol, UK, 2018; p. 012048. [Google Scholar]
  13. Zhang, H.; Wang, Y.; Park, T.-W.; Deng, Y. Quantifying the relationship between extreme air pollution events and extreme weather events. Atmos. Res. 2017, 188, 64–79. [Google Scholar] [CrossRef]
  14. Hu, J.; Ouyang, W.; Yang, Z. Impacts of extreme climate on nitrogen loss in different forms and pollution risk with the copula model. J. Hydrol. 2023, 620, 129412. [Google Scholar] [CrossRef]
  15. He, C.; Kumar, R.; Tang, W.; Pfister, G.; Xu, Y.; Qian, Y.; Brasseur, G. Air pollution interactions with weather and climate extremes: Current knowledge, gaps, and future directions. Curr. Pollut. Rep. 2024, 10, 430–442. [Google Scholar] [CrossRef]
  16. Paltseva, A.A.; Neaman, A. An emerging frontier: Metal (loid) soil pollution threat under global climate change. Environ. Toxicol. Chem. 2020, 39, 1653–1654. [Google Scholar] [CrossRef]
  17. Biswas, B.; Qi, F.; Biswas, J.K.; Wijayawardena, A.; Khan, M.A.I.; Naidu, R. The fate of chemical pollutants with soil properties and processes in the climate change paradigm—A review. Soil Syst. 2018, 2, 51. [Google Scholar] [CrossRef]
  18. Dodd, C.; Rishworth, G.M. Coastal urban reliance on groundwater during drought cycles: Opportunities, threats and state of knowledge. Camb. Prism. Coast. Futures 2023, 1, e11. [Google Scholar] [CrossRef]
  19. Olivadese, M.; Dindo, M.L. Water, Ecosystem Services, and Urban Green Spaces in the Anthropocene. Land 2024, 13, 1948. [Google Scholar] [CrossRef]
  20. Perera, A.T.; Nik, V.M.; Chen, D.; Scartezzini, J.-L.; Hong, T. Quantifying the impacts of climate change and extreme climate events on energy systems. Nat. Energy 2020, 5, 150–159. [Google Scholar] [CrossRef]
  21. Perera, A.; Nik, V.M.; Scartezzini, J.-L. Impacts of extreme climate conditions due to climate change on the energy system design and operation. Energy Procedia 2019, 159, 358–363. [Google Scholar] [CrossRef]
  22. Cronin, J.; Anandarajah, G.; Dessens, O. Climate change impacts on the energy system: A review of trends and gaps. Clim. Change 2018, 151, 79–93. [Google Scholar] [CrossRef]
  23. Yang, X.; Xu, X.; Wang, Y.; Yang, J.; Wu, X. Heat exposure impacts on urban health: A meta-analysis. Sci. Total Environ. 2024, 947, 174650. [Google Scholar] [CrossRef]
  24. Heaviside, C.; Macintyre, H.; Vardoulakis, S. The urban heat island: Implications for health in a changing environment. Curr. Environ. Health Rep. 2017, 4, 296–305. [Google Scholar] [CrossRef]
  25. Bunker, A.; Wildenhain, J.; Vandenbergh, A.; Henschke, N.; Rocklöv, J.; Hajat, S.; Sauerborn, R. Effects of air temperature on climate-sensitive mortality and morbidity outcomes in the elderly; a systematic review and meta-analysis of epidemiological evidence. eBioMedicine 2016, 6, 258–268. [Google Scholar] [CrossRef] [PubMed]
  26. Cremonini, L.; Georgiadis, T. Urban Effects of Climate Change on Elderly Population and the Need for Implementing Urban Policies. Encyclopedia 2025, 5, 140. [Google Scholar] [CrossRef]
  27. Watts, N.; Amann, M.; Arnell, N.; Ayeb-Karlsson, S.; Belesova, K.; Berry, H.; Bouley, T.; Boykoff, M.; Byass, P.; Cai, W.; et al. The 2018 report of the Lancet Countdown on health and climate change: Shaping the health of nations for centuries to come. Lancet 2018, 392, 2479–2514. [Google Scholar] [CrossRef] [PubMed]
  28. Cohen-Shacham, E.; Walters, G.; Janzen, C.; Maginnis, S. Nature-Based Solutions to Address Global Societal Challenges; IUCN: Gland, Switzerland, 2016; Volume 97, p. 2036. [Google Scholar]
  29. Nguyen, P.-Y.; Astell-Burt, T.; Rahimi-Ardabili, H.; Feng, X. Green space quality and health: A systematic review. Int. J. Environ. Res. Public Health 2021, 18, 11028. [Google Scholar] [CrossRef]
  30. Reyes-Riveros, R.; Altamirano, A.; De La Barrera, F.; Rozas-Vásquez, D.; Vieli, L.; Meli, P. Linking public urban green spaces and human well-being: A systematic review. Urban For. Urban Green. 2021, 61, 127105. [Google Scholar] [CrossRef]
  31. Chen, K.; Zhang, T.; Liu, F.; Zhang, Y.; Song, Y. How does urban green space impact residents’ mental health: A literature review of mediators. Int. J. Environ. Res. Public Health 2021, 18, 11746. [Google Scholar] [CrossRef]
  32. Bowler, D.E.; Buyung-Ali, L.; Knight, T.M.; Pullin, A.S. Urban greening to cool towns and cities: A systematic review of the empirical evidence. Landsc. Urban Plan. 2010, 97, 147–155. [Google Scholar] [CrossRef]
  33. Iungman, T.; Cirach, M.; Marando, F.; Barboza, E.P.; Khomenko, S.; Masselot, P.; Quijal-Zamorano, M.; Mueller, N.; Gasparrini, A.; Urquiza, J.; et al. Cooling cities through urban green infrastructure: A health impact assessment of European cities. Lancet 2023, 401, 577–589. [Google Scholar] [CrossRef]
  34. Ziter, C.D.; Pedersen, E.J.; Kucharik, C.J.; Turner, M.G. Scale-dependent interactions between tree canopy cover and impervious surfaces reduce daytime urban heat during summer. Proc. Natl. Acad. Sci. USA 2019, 116, 7575–7580. [Google Scholar] [CrossRef] [PubMed]
  35. Fryd, O.; Pauleit, S.; Bühler, O. The role of urban green space and trees in relation to climate change. CABI Rev. 2012, 1–18. [Google Scholar] [CrossRef]
  36. Norton, B.A.; Coutts, A.M.; Livesley, S.J.; Harris, R.J.; Hunter, A.M.; Williams, N.S. Planning for cooler cities: A framework to prioritise green infrastructure to mitigate high temperatures in urban landscapes. Landsc. Urban Plan. 2015, 134, 127–138. [Google Scholar] [CrossRef]
  37. Lasky, E.; Costello, S.; Ndovu, A.; Aguilera, R.; Weiser, S.D.; Benmarhnia, T. The health benefits of reducing micro-heat islands: A 22-year analysis of the impact of urban temperature reduction on heat-related illnesses in California’s major cities. Sci. Total Environ. 2024, 949, 175284. [Google Scholar] [CrossRef]
  38. Lee, H.; Lim, H.; Park, S. Quantitative assessment of green coverage changes under the human-biometeorological perspective: A simulation case study in Jeju, Republic of Korea. Sustain. Cities Soc. 2023, 97, 104734. [Google Scholar] [CrossRef]
  39. Battisti, A. Bioclimatic architecture and urban morphology. Studies on intermediate urban open spaces. Energies 2020, 13, 5819. [Google Scholar] [CrossRef]
  40. Salata, F.; Golasi, I.; Petitti, D.; de Lieto Vollaro, E.; Coppi, M.; de Lieto Vollaro, A. Relating microclimate, human thermal comfort and health during heat waves: An analysis of heat island mitigation strategies through a case study in an urban outdoor environment. Sustain. Cities Soc. 2017, 30, 79–96. [Google Scholar] [CrossRef]
  41. Liu, Z.; Cheng, W.; Jim, C.Y.; Morakinyo, T.E.; Shi, Y.; Ng, E. Heat mitigation benefits of urban green and blue infrastructures: A systematic review of modeling techniques, validation and scenario simulation in ENVI-met V4. Build. Environ. 2021, 200, 107939. [Google Scholar] [CrossRef]
  42. Gunawardena, K.R.; Wells, M.J.; Kershaw, T. Utilising green and bluespace to mitigate urban heat island intensity. Sci. Total Environ. 2017, 584–585, 1040–1055. [Google Scholar] [CrossRef]
  43. Zardo, L.; Geneletti, D.; Pérez-Soba, M.; Van Eupen, M. Estimating the cooling capacity of green infrastructures to support urban planning. Ecosyst. Serv. 2017, 26, 225–235. [Google Scholar] [CrossRef]
  44. Ng, E. Designing High-Density Cities: For Social and Environmental Sustainability; Earthscan: Calgary, AB, Canada, 2010. [Google Scholar]
  45. Comune di Imola. Quadro Conoscitivo Diagnostico: Diagnosi per Luoghi—Imola; Nuovo Circondario Imolese: Imola, Italy, 2022. [Google Scholar]
  46. Xu, Z.; Georgiadis, T.; Cremonini, L.; Marini, S.; Toselli, S. The perceptions and attitudes of residents towards urban green spaces in Emilia-Romagna (Italy)—A case study. Land 2024, 14, 13. [Google Scholar] [CrossRef]
  47. Yin, Y.; Li, S.; Xing, X.; Zhou, X.; Kang, Y.; Hu, Q.; Li, Y. Cooling benefits of urban tree canopy: A systematic review. Sustainability 2024, 16, 4955. [Google Scholar] [CrossRef]
  48. Ren, Z.; Zhao, H.; Fu, Y.; Xiao, L.; Dong, Y. Effects of urban street trees on human thermal comfort and physiological indices: A case study in Changchun city, China. J. For. Res. 2022, 33, 911–922. [Google Scholar] [CrossRef]
  49. Meili, N.; Manoli, G.; Burlando, P.; Carmeliet, J.; Chow, W.T.; Coutts, A.M.; Roth, M.; Velasco, E.; Vivoni, E.R.; Fatichi, S. Tree effects on urban microclimate: Diurnal, seasonal, and climatic temperature differences explained by separating radiation, evapotranspiration, and roughness effects. Urban For. Urban Green. 2021, 58, 126970. [Google Scholar] [CrossRef]
  50. Chen, X.; Han, M.; He, J.; Ma, H.; Han, M.; Liu, Y.; Wu, X. Integrated effect of aspect ratio and tree spacing on pedestrian thermal comfort of street canyon. Int. J. Biometeorol. 2024, 68, 2115–2131. [Google Scholar] [CrossRef]
  51. Feteha, S.; ElDeeb, S. Investigating urban canyons, façade albedo, and pedestrian thermal comfort using microclimate model calculations. Build. Serv. Eng. Res. Technol. 2024, 45, 457–473. [Google Scholar] [CrossRef]
  52. Cebrat, K.; Narożny, J.; Baborska-Narożny, M.; Smektała, M. Modelling site-specific outdoor temperature for buildings in urban environments. Build. Cities 2025, 6, 490–510. [Google Scholar] [CrossRef]
  53. Fastl, C.; Arnberger, A.; Gallistl, V.; Stein, V.K.; Dorner, T.E. Heat vulnerability: Health impacts of heat on older people in urban and rural areas in Europe. Wien. Klin. Wochenschr. 2024, 136, 507–514. [Google Scholar] [CrossRef]
  54. Wrotek, M.; Marginean, I.; Boni, Z.; Chwałczyk, F.; Vicedo-Cabrera, A.M.; Salvador, C.; Jancewicz, B. From inequalities to vulnerability paradoxes: Juxtaposing older adults’ heat mortality risk and heat experiences. Environ. Health 2025, 24, 24. [Google Scholar] [CrossRef]
  55. Jancewicz, B.; Wrotek, M. A thermosurvey dataset: Older adults’ experiences and adaptation to urban heat and climate change. Sci. Data 2024, 11, 677. [Google Scholar] [CrossRef]
  56. Ibsen, P.C.; Crawford, B.R.; Corro, L.M.; Bagstad, K.J.; McNellis, B.E.; Jenerette, G.D.; Diffendorfer, J.E. Urban tree cover provides consistent mitigation of extreme heat in arid but not humid cities. Sustain. Cities Soc. 2024, 113, 105677. [Google Scholar] [CrossRef]
  57. Wu, Y.; Mashhoodi, B.; Patuano, A. Effective street tree and grass designs to cool European neighbourhoods. Urban Clim. 2025, 61, 102376. [Google Scholar] [CrossRef]
  58. Jayasooriya, V.M.; Sirimanne, A.; Silva, R.M.; Muthukumaran, S. Role of Urban Trees in Enhancing the Thermal Comfort of Rapidly Urbanizing Cities: An Analysis of Tropical Asian Tree Species Based on Physiological Equivalent Temperature (PET). Arboric. Urban For. AUF 2024, 50, 326–345. [Google Scholar] [CrossRef]
  59. Lanza, K.; Alcazar, M.; Durand, C.P.; Salvo, D.; Villa, U.; Kohl, H.W. Heat-resilient schoolyards: Relations between temperature, shade, and physical activity of children during recess. J. Phys. Act. Health 2022, 20, 134–141. [Google Scholar] [CrossRef]
  60. Wang, D.; Shi, Y.; Chen, G.; Zeng, L.; Hang, J.; Wang, Q. Urban thermal environment and surface energy balance in 3D high-rise compact urban models: Scaled outdoor experiments. Build. Environ. 2021, 205, 108251. [Google Scholar] [CrossRef]
  61. Li, Y.; Schubert, S.; Kropp, J.P.; Rybski, D. On the influence of density and morphology on the Urban Heat Island intensity. Nat. Commun. 2020, 11, 2647. [Google Scholar] [CrossRef] [PubMed]
  62. Zhu, D. Study on Facade Openings Design Method Responding to Urban Ventilation Issue in High Density Cities. Procedia Eng. 2016, 169, 133–141. [Google Scholar] [CrossRef]
  63. Judanto, M.A.; Sari, D.P. Identifying the Potential of Urban Ventilation Corridors in Tropical Climates. Modelling 2025, 6, 129. [Google Scholar] [CrossRef]
  64. Emmanuel, R. Urban microclimate in temperate climates: A summary for practitioners. Build. Cities 2021, 2, 402–410. [Google Scholar] [CrossRef]
  65. Soltanifard, H.; Amani-Beni, M. The cooling effect of urban green spaces as nature-based solutions for mitigating urban heat: Insights from a decade-long systematic review. Clim. Risk Manag. 2025, 49, 100731. [Google Scholar] [CrossRef]
  66. McKenna, Z.J.; Foster, J.; Atkins, W.C.; Belval, L.N.; Watso, J.C.; Jarrard, C.P.; Orth, B.D.; Crandall, C.G. Age alters the thermoregulatory responses to extreme heat exposure with accompanying activities of daily living. J. Appl. Physiol. 2023, 135, 445–455. [Google Scholar] [CrossRef]
  67. Tony Wolf, S.; Cottle, R.M.; Fisher, K.G.; Vecellio, D.J.; Larry Kenney, W. Heat stress vulnerability and critical environmental limits for older adults. Commun. Earth Environ. 2023, 4, 486. [Google Scholar] [CrossRef] [PubMed]
  68. Balmain, B.N.; Sabapathy, S.; Louis, M.; Morris, N.R. Aging and thermoregulatory control: The clinical implications of exercising under heat stress in older individuals. BioMed Res. Int. 2018, 2018, 8306154. [Google Scholar] [CrossRef]
  69. Dialesandro, J.; Brazil, N.; Wheeler, S.; Abunnasr, Y. Dimensions of thermal inequity: Neighborhood social demographics and urban heat in the Southwestern US. Int. J. Environ. Res. Public Health 2021, 18, 941. [Google Scholar] [CrossRef]
  70. Li, F.; Yigitcanlar, T.; Nepal, M.; Nguyen, K.; Dur, F.; Li, W. Assessing heat vulnerability and multidimensional inequity: Lessons from indexing the performance of Australian capital cities. Sustain. Cities Soc. 2024, 115, 105875. [Google Scholar] [CrossRef]
  71. Lee, Y.; Han, S. The geography of structural vulnerability: Intersections of climate exposure, ecological insulation, and economic capacity. npj Urban Sustain. 2025, 5, 71. [Google Scholar] [CrossRef]
  72. Perini, K.; Magliocco, A. Effects of vegetation, urban density, building height, and atmospheric conditions on local temperatures and thermal comfort. Urban For. Urban Green. 2014, 13, 495–506. [Google Scholar] [CrossRef]
  73. Santamouris, M. Cooling the cities–a review of reflective and green roof mitigation technologies to fight heat island and improve comfort in urban environments. Sol. Energy 2014, 103, 682–703. [Google Scholar] [CrossRef]
  74. Wolch, J.R.; Byrne, J.; Newell, J.P. Urban green space, public health, and environmental justice: The challenge of making cities ‘just green enough’. Landsc. Urban Plan. 2014, 125, 234–244. [Google Scholar] [CrossRef]
  75. Jennings, V.; Larson, L.; Yun, J. Advancing sustainability through urban green space: Cultural ecosystem services, equity, and social determinants of health. Int. J. Environ. Res. Public Health 2016, 13, 196. [Google Scholar] [CrossRef]
Figure 1. (a) National setting of the study area in Italy; (b) regional setting of the study area in Imola [46] under the terms of the Creative Commons Attribution (CC BY) License; (c,d) study area in the Marconi neighbourhood, Imola (1400 × 1400 m); (c) Ex ante; (d) ex post.
Land 15 00942 g001
Figure 2. Vegetation distribution in the study area.
Land 15 00942 g002
Figure 3. Classification of surfaces in the study area.
Land 15 00942 g003
Figure 4. Physiological Equivalent Temperature (PET) maps for standard adult (35 y) and elderly (80 y) models under ex ante and ex post scenarios.
Land 15 00942 g004
Figure 5. Difference in Physiological Equivalent Temperature (PET) between two scenarios (ex post minus ex ante).
Land 15 00942 g005
Figure 6. Difference in Physiological Equivalent Temperature (PET) between the modelled subjects (the elderly adult minus the standard adult).
Land 15 00942 g006
Disclaimer/Publisher’s Note: The statements, opinions and data contained in all publications are solely those of the individual author(s) and contributor(s) and not of MDPI and/or the editor(s). MDPI and/or the editor(s) disclaim responsibility for any injury to people or property resulting from any ideas, methods, instructions or products referred to in the content.