Article

Spatiotemporal Evolution and Pathway Identification of Cultural Tourism in the Yellow River Basin, China

by
Yingzhuo Zhang
1,†,
Yan Zhang
2,†,
Jing Chen
3 and
Changhong Miao
2,*
1
School of Management and Economics, North China University of Water Resources and Electric Power, Zhengzhou 450046, China
2
Key Research Institute of Yellow River Civilisation and Sustainable Development & Collaborative Innovation Center of Yellow River Civilisation Provincial Co-Construction, Henan University, Kaifeng 475001, China
3
School of Architecture, Zhengzhou University, Zhengzhou 450001, China
*
Author to whom correspondence should be addressed.
These authors contributed equally to this work.
Land 2026, 15(6), 938; https://doi.org/10.3390/land15060938
Submission received: 25 April 2026 / Revised: 25 May 2026 / Accepted: 26 May 2026 / Published: 29 May 2026
(This article belongs to the Special Issue Tourism Development and Landscape Conservation: Finding the Balance)

Abstract

Evaluating and identifying paths for cultural tourism development (CTD) in the Yellow River Basin (YRB) is crucial for establishing the Yellow River Cultural Tourism Belt in China. This study utilised Fuzzy-set Qualitative Comparative Analysis (fsQCA) to address the complex factors affecting CTD, unlike econometric approaches. An evaluation framework based on sustainable development and inclusive growth, consisting of 24 factors across three rule layers, was created to assess 78 cities in the YRB, China, using the entropy weight–TOPSIS method. Analysis with ArcGIS 10.5 revealed that from 2004 to 2019, CTD increased overall, with notable regional disparities: downstream and central regions thrived, while northern and southern regions lagged. High development followed three paths: policy-assisted consumer market-driven, economic investment-driven, and government-guided economic investment and innovation-driven development. Conversely, low development followed three paths: insufficient economic policies and innovation, deficient economy and consumer market, and insufficient economic and social investment. These findings could help develop sustainable cultural tourism in the birthplaces of global civilisations, specifically within the Chinese context.

1. Introduction

The Yellow River Basin (YRB) in China is of paramount importance to global history, ecological stability, and economic development [1,2,3]. As the cradle of Chinese civilisation, it possesses profound cultural heritage, including oracle bone inscriptions and the legend of Yanhuang, which serve as foundational pillars for national identity [4]. Cultural tourism functions as a vital conduit for accessing the depth of this history, disseminating traditional architectural techniques, and promoting multicultural exchanges worldwide. Cultural tourism plays a multifaceted role, encompassing economic, cultural, social, and ecological functions [5]. The fusion of cultural and tourism development promotes social and economic growth and enhances spiritual experiences through cultural creation [6]. As China’s economy rapidly expands and primary societal demands evolve, people’s spiritual needs for cultural life and identity have become increasingly prominent [7]. Despite its strategic status, the YRB faces a critical challenge: while possessing vast cultural resource endowments, the translation of these resources into sustainable, high-quality development pathways remains uneven and under-optimized.
The CTD is fundamentally a complex and multi-factor process that can be theoretically grounded in Symbiosis Theory, a perspective viewing tourism as a symbiotic interaction among cultural resources, market demands, and policy environments [8]. Historically, tourism research has predominantly relied on linear econometric models, which treat influencing factors as independent variables [9]. However, a persistent limitation in the current literature is that these models often fail to capture configuration effects, a concept derived from Complexity Theory, whereby multiple factors such as economic base, policy support, and innovation interact in non-linear and interdependent ways to produce varying outcomes [10]. Consequently, existing studies often focus on isolated factors rather than the holistic paths to success [11].
CTD stems from the evolving relationship between culture and tourism, rooted in the 16th century’s Grand Tour [12], where cultural experiences were the primary tourism purpose. Since the 20th century, culture and tourism have become increasingly interdependent [13]. Cultural tourism was first defined by Robert Macintosh as activities in which tourists learn about others’ historical heritage, lives, and ideas. With the increasing proximity of culture to daily life, culture’s connotations continue to expand. In 2003, UNESCO extended heritage concept from tangible to intangible [14]. In 2017, the World Tourism Organisation defined cultural tourism as tourism activities for which tourists are motivated by a certain essence [15]. Most 21st-century research on cultural tourism has concentrated on tourism’s impact on social culture [16,17].
The association between Chinese culture and tourism has undergone various stages. Guiding Opinions on Promoting the Combined Development of Culture and Tourism, jointly issued by the former Ministry of Culture and the National Tourism Administration (NTA) in 2009, emphasized the combination of culture and tourism. The Ministry of Culture and Tourism in China, founded in 2018, significantly advanced the combined growth of cultural projects, the cultural sector, and the tourism sector. In 2021, the Ministry of Culture and Tourism released the 14th Five-Year Plan for Culture and Tourism Development, along with other documents, to enhance culture and tourism through resources, products, industries, markets, and government services. In 2022, the 20th National Congress of the Communist Party of China emphasised the deep integration and development of culture and tourism. The 2019 national strategy proposal for the YRB’s ecological protection and high-quality development produced major strategic opportunities and a conducive policy environment for CTD in the YRB.
Despite these policy frameworks, a gap persists: how do we quantitatively assess and identify the specific developmental recipes for different cities in this complex basin? Addressing this gap is a prerequisite for the effective establishment of the Yellow River National Cultural Park and the creation of an internationally influential cultural tourism belt.
A scientific and systematic evaluation of the YRB’s cultural tourism level should precede any promotion or establishment of a Yellow River National Cultural Park or Yellow River cultural tourism belt with international influence. The extant literature assessing CTD has concentrated on the integration and alignment of the cultural and tourism industries [18], evaluating cultural tourism value [19], and the integration of cultural elements and tourism [20]. Nevertheless, few studies have assessed CTD from the perspective of co-ordinated symbiosis. Several existing studies employ econometric models based on economic principles to explore factors driving CTD [21]. However, cultural tourism’s growth results from various factors’ combined impact, and the research approach requires refinement. To bridge these theoretical and practical gaps, this study employs a fuzzy-set Qualitative Comparative Analysis (fsQCA) to move beyond linear causality.
To provide a structured overview of the current academic landscape and identify critical limitations, Table 1 summarizes the core focal points and inherent gaps in the existing literature.
As illustrated in Table 1, while previous studies have contributed valuable insights, they remain fragmented. Existing research predominantly relies on econometric methods that treat influencing factors as independent variables, thereby failing to account for the complex, non-linear interactions and causal asymmetries inherent in tourism development. Furthermore, most studies overlook the necessity of examining CTD through a holistic lens that combines sustainable development with inclusive growth. Consequently, there is a critical need for research that moves beyond traditional regression-based approaches to identify the diverse, multi-faceted pathways through which CTD evolves. This study addresses this gap by utilizing fsQCA to unravel the complex configurations of conditions that drive CTD in the YRB.
Motivated by these identified gaps, this study proposes the following research questions: (1) How can the level of CTD be rigorously assessed at the prefecture-level city scale in the YRB in China? (2) What are the spatiotemporal characteristics of CTD in the YRB from 2004 to 2019? (3) What are the configuration paths that lead to high or low levels of CTD across different regions in the YRB?
To address the above questions, this study proposes the following research design. This study examines CTD in 78 prefecture-level cities located in the YRB, China. Additionally, an indicator system was constructed from a symbiotic perspective based on holistic and process principles consisting of resource endowment, support conditions, and development benefits. The entropy weight method, an objective weighting technique, was employed to measure the dispersion of indicators, thereby mitigating subjective bias. Subsequently, the Technique for Order of Preference by Similarity to Ideal Solution (TOPSIS) was utilized to rank these cities based on their relative proximity to an ideal development level, effectively integrating the strengths of both methods to quantify the CTD index. Finally, the fuzzy-set qualitative comparative analysis (fsQCA) approach to investigate grouping paths and their spatial variations. The results could enhance cultural tourism growth and support sustainable development goals. The various development paths’ characteristics, advantages, and limitations were analysed to provide targeted improvement suggestions for underdeveloped regions. Moreover, this study aimed to optimise directions in well-developed regions to promote scientific cultural tourism in the YRB.

2. Literature Review

2.1. Cultural Tourism Development Evaluation

Scholars have studied cultural tourism since the 1980s, proposing that culture and tourism are mutually reinforcing. Current research has mainly focused on tourism resource evaluation [22], planning [23], and development [24]. In 2009, former Chinese Ministries of Culture and Tourism proposed combining culture and tourism. The cultural tourism field emphasises industrial integration, with much research examining the intertwined and synchronised advancement of the cultural and tourism industries [25]. This encompasses investigations into the nexus between cultural creativity and tourism development [26,27], urban tourism competitiveness [28] and attractiveness [29], tourism growth efficiency [30], and factors affecting cultural tourism such as accessibility [31] and economic advancement [32].
Since the Ministry of Culture and Tourism was founded in 2018, scholars have discussed the interrelationship between culture and tourism within policies [33,34] and integrated perspectives [35]. However, studies have not examined the nature of culture and tourism. In the social development context, holistically integrating culture and tourism necessitates a comprehensive assessment of multifaceted economic, cultural, social, and ecological factors. This approach aims to foster a symbiotic relationship between culture and tourism, thereby promoting co-ordinated regional development. Existing studies on the deep integration of culture and tourism have concentrated on evolutionary logic, evolutionary perspective [36,37], multiple synergies [38], high-quality development [39], cultural experience, and cultural identity [40,41]. Typically, these studies have been based on the new era, servicing the national YRB strategy and focusing on mechanisms underlying culture and tourism integration to promote its high-quality development [26], rural revitalisation [42,43], and common prosperity [44].
This study delineates the theoretical rationale for selecting the evaluation indicators for CTD. Resources are pivotal to CTD, underpinning various tourism phenomena and relationships. Previous studies have used resource abundance [45] and quality differences [46] to characterise competitiveness, attractiveness, and advantages. The resources in the YRB are diverse, widely distributed, and comprehensive, varying in quantity and level. The dimension of Resource Endowment is fundamentally grounded in Symbiosis Theory and Complexity Theory. Cultural tourism in the YRB operates as a highly complex adaptive system where diverse assets do not function in isolation but interact non-linearly to generate comprehensive destination attractiveness [47]. By incorporating integrated resources, human resources, natural resources, and cultural facilities, the indicator system reflects a deep symbiotic relationship. Symbiosis Theory posits that the mutualistic coexistence and integration of natural ecological bases and humanistic cultural artifacts create a synergistic value far greater than the sum of their individual parts [28]. Consequently, selecting these multifarious indicators captures the structural complexity and symbiotic richness necessary for evaluating the foundational potential of a cultural tourism destination.
The Support Condition dimension is theoretically underpinned by Complexity Theory and the accessibility tenets of Inclusive Growth Theory. Within a complex tourism system, transport infrastructure and reception capacities serve as critical interconnected nodes that facilitate systemic flow, mobility, and resilience [48]. Furthermore, from the perspective of Inclusive Growth Theory, robust infrastructural support is a fundamental prerequisite for equitable tourism participation. Efficient transport networks and adequate reception facilities ensure that spatial, economic, and logistical barriers are minimized, allowing broader demographic segments to access and benefit from tourism resources [49]. Thus, the selected indicators accurately measure the system’s structural capacity to physically and logistically sustain tourism flows, acting as the vital bridge between latent resource endowment and actualized tourism activity.
The Development Benefits dimension is firmly anchored in Sustainable Development Theory and Inclusive Growth Theory. Moving beyond traditional paradigms that prioritize singular economic expansion, the selected indicators evaluate a tripartite balance of economic, social, and environmental outcomes, which is the cornerstone of sustainability [50]. The inclusion of economic metrics alongside social indicators directly embodies the core of Inclusive Growth Theory. This theory emphasizes pro-poor growth, equitable wealth distribution, and extensive job creation for local communities. Simultaneously, the integration of environmental benefits, specifically green coverage, operationalizes Sustainable Development Theory by ensuring that economic exploitation does not compromise the ecological integrity of the basin. This multidimensional evaluation ensures that cultural tourism progression fosters long-term socio-economic equity while safeguarding its delicate environmental fabric.
Regarding methodology, scholars have increasingly adopted multi-criteria decision-making (MCDM) approaches to evaluate CTD, they possess distinct trade-offs. The Analytic Hierarchy Process (AHP) [51] remains popular but is inherently subjective, often reflecting expert bias; similarly, the Best–Worst Method (BWM) [52] provides a more structured consistency check for subjective preferences but still depends on the qualitative input of decision-makers. Conversely, Data Envelopment Analysis (DEA) [53] focuses on relative efficiency boundaries, which may overlook the holistic status of multidimensional indicators. In contrast, the entropy weight method offers a purely objective, data-driven approach by calculating the dispersion of indicator values, thereby eliminating human subjectivity. By integrating this with the Technique for Order of Preference by Similarity to Ideal Solution (TOPSIS), we can effectively determine the proximity of each city to the ideal development state. The entropy weighted-TOPSIS approach is uniquely suited to the YRB’s study area, it provides a systematic, standardized framework for comparing 78 cities that exhibit significant variations in economic and cultural resource endowments. This methodology mitigates the limitations of purely subjective or efficiency-focused models, ensuring a robust, reproducible evaluation of CTD that accounts for the complex, process-oriented nature of cultural tourism systems.

2.2. Effects of Cultural Tourism Development

Culture and tourism integration research exhibits distinctive contemporary characteristics, emphasising the effects of the digital economy [54], new quality productivity [55], government support [19,20,56], and market demand [57,58].
The existing literature on cultural tourism highlights resource evaluation, development, coupling co-ordination, competitiveness, attractiveness, efficiency, and potential. However, few studies have examined the symbiotic CTD in the YRB from comprehensive and process-oriented perspectives. Most studies assume the factors are independent. However, the rapid CTD requires more in-depth research and analysis to cover its complex structure and dynamic changes.
Beyond the evaluation of CTD, identifying the causal configurations that drive CTD remains a critical challenge. Although traditional statistical methods, such as multiple regression analysis [59], effectively identify net effects and linear relationships, they often fail to capture causal complexity, particularly the phenomena of equifinality, where different paths lead to the same outcome, and asymmetry, where varied causal combinations produce identical results. Moreover, these approaches frequently struggle to address small-to-medium sample sizes or instances where high-order interactions are prevalent. To overcome these limitations, we employ Qualitative Comparative Analysis (QCA), an approach based on set-theoretic logic [60,61]. This approach is particularly suitable for our study of CTD in the YRB, as it enables the systematic examination of how varying resource endowments, economic conditions, and regional policies interact to foster tourism growth. By shifting the analytical focus from individual factor contributions to configural paths, this method provides a more holistic and nuanced understanding of the heterogeneous pathways to high-level CTD across 78 diverse municipal units. In recent years, scholars have increasingly utilized QCA to examine a broad spectrum of topics, including viewers’ continuous viewing intentions in tourism live-streaming, the scene manifestation of the Yellow River National Cultural Park [62], nighttime cultural tourism consumption agglomeration [63], tourism experiences and behavioural intentions [64], as well as rural CTD [65].

2.3. Development of Cultural Tourism in the Yellow River Basin

In the late 20th century, Europe and the U.S. started to prioritise the protection and management of river resources and cultural perspectives. Additionally, tourism emerged as an important approach to promote cultural exchange and collaboration in river basins. The 2019 national strategy for the protection and high-quality development of the YRB paved the way for the establishment of the Yellow River National Cultural Park and the Yellow River Cultural Tourism Belt. Additionally, academic interest in Yellow River cultural tourism is increasing.
Domestic research themes regarding cultural tourism in the YRB mainly cover the classification and evaluation of cultural tourism resources development [66], tourism flow [67], cultural tourism and regional co-ordination [68], Yellow River ecotourism [69], and the creation of scenarios and cultural space [62]. Nevertheless, cities in the YRB exhibit remarkable disparities in CTD, with numerous interconnected influencing factors. Therefore, scientifically measuring the prefecture’s CTD and formulating targeted strategies to address urgent issues are important.

2.4. Analytical Framework

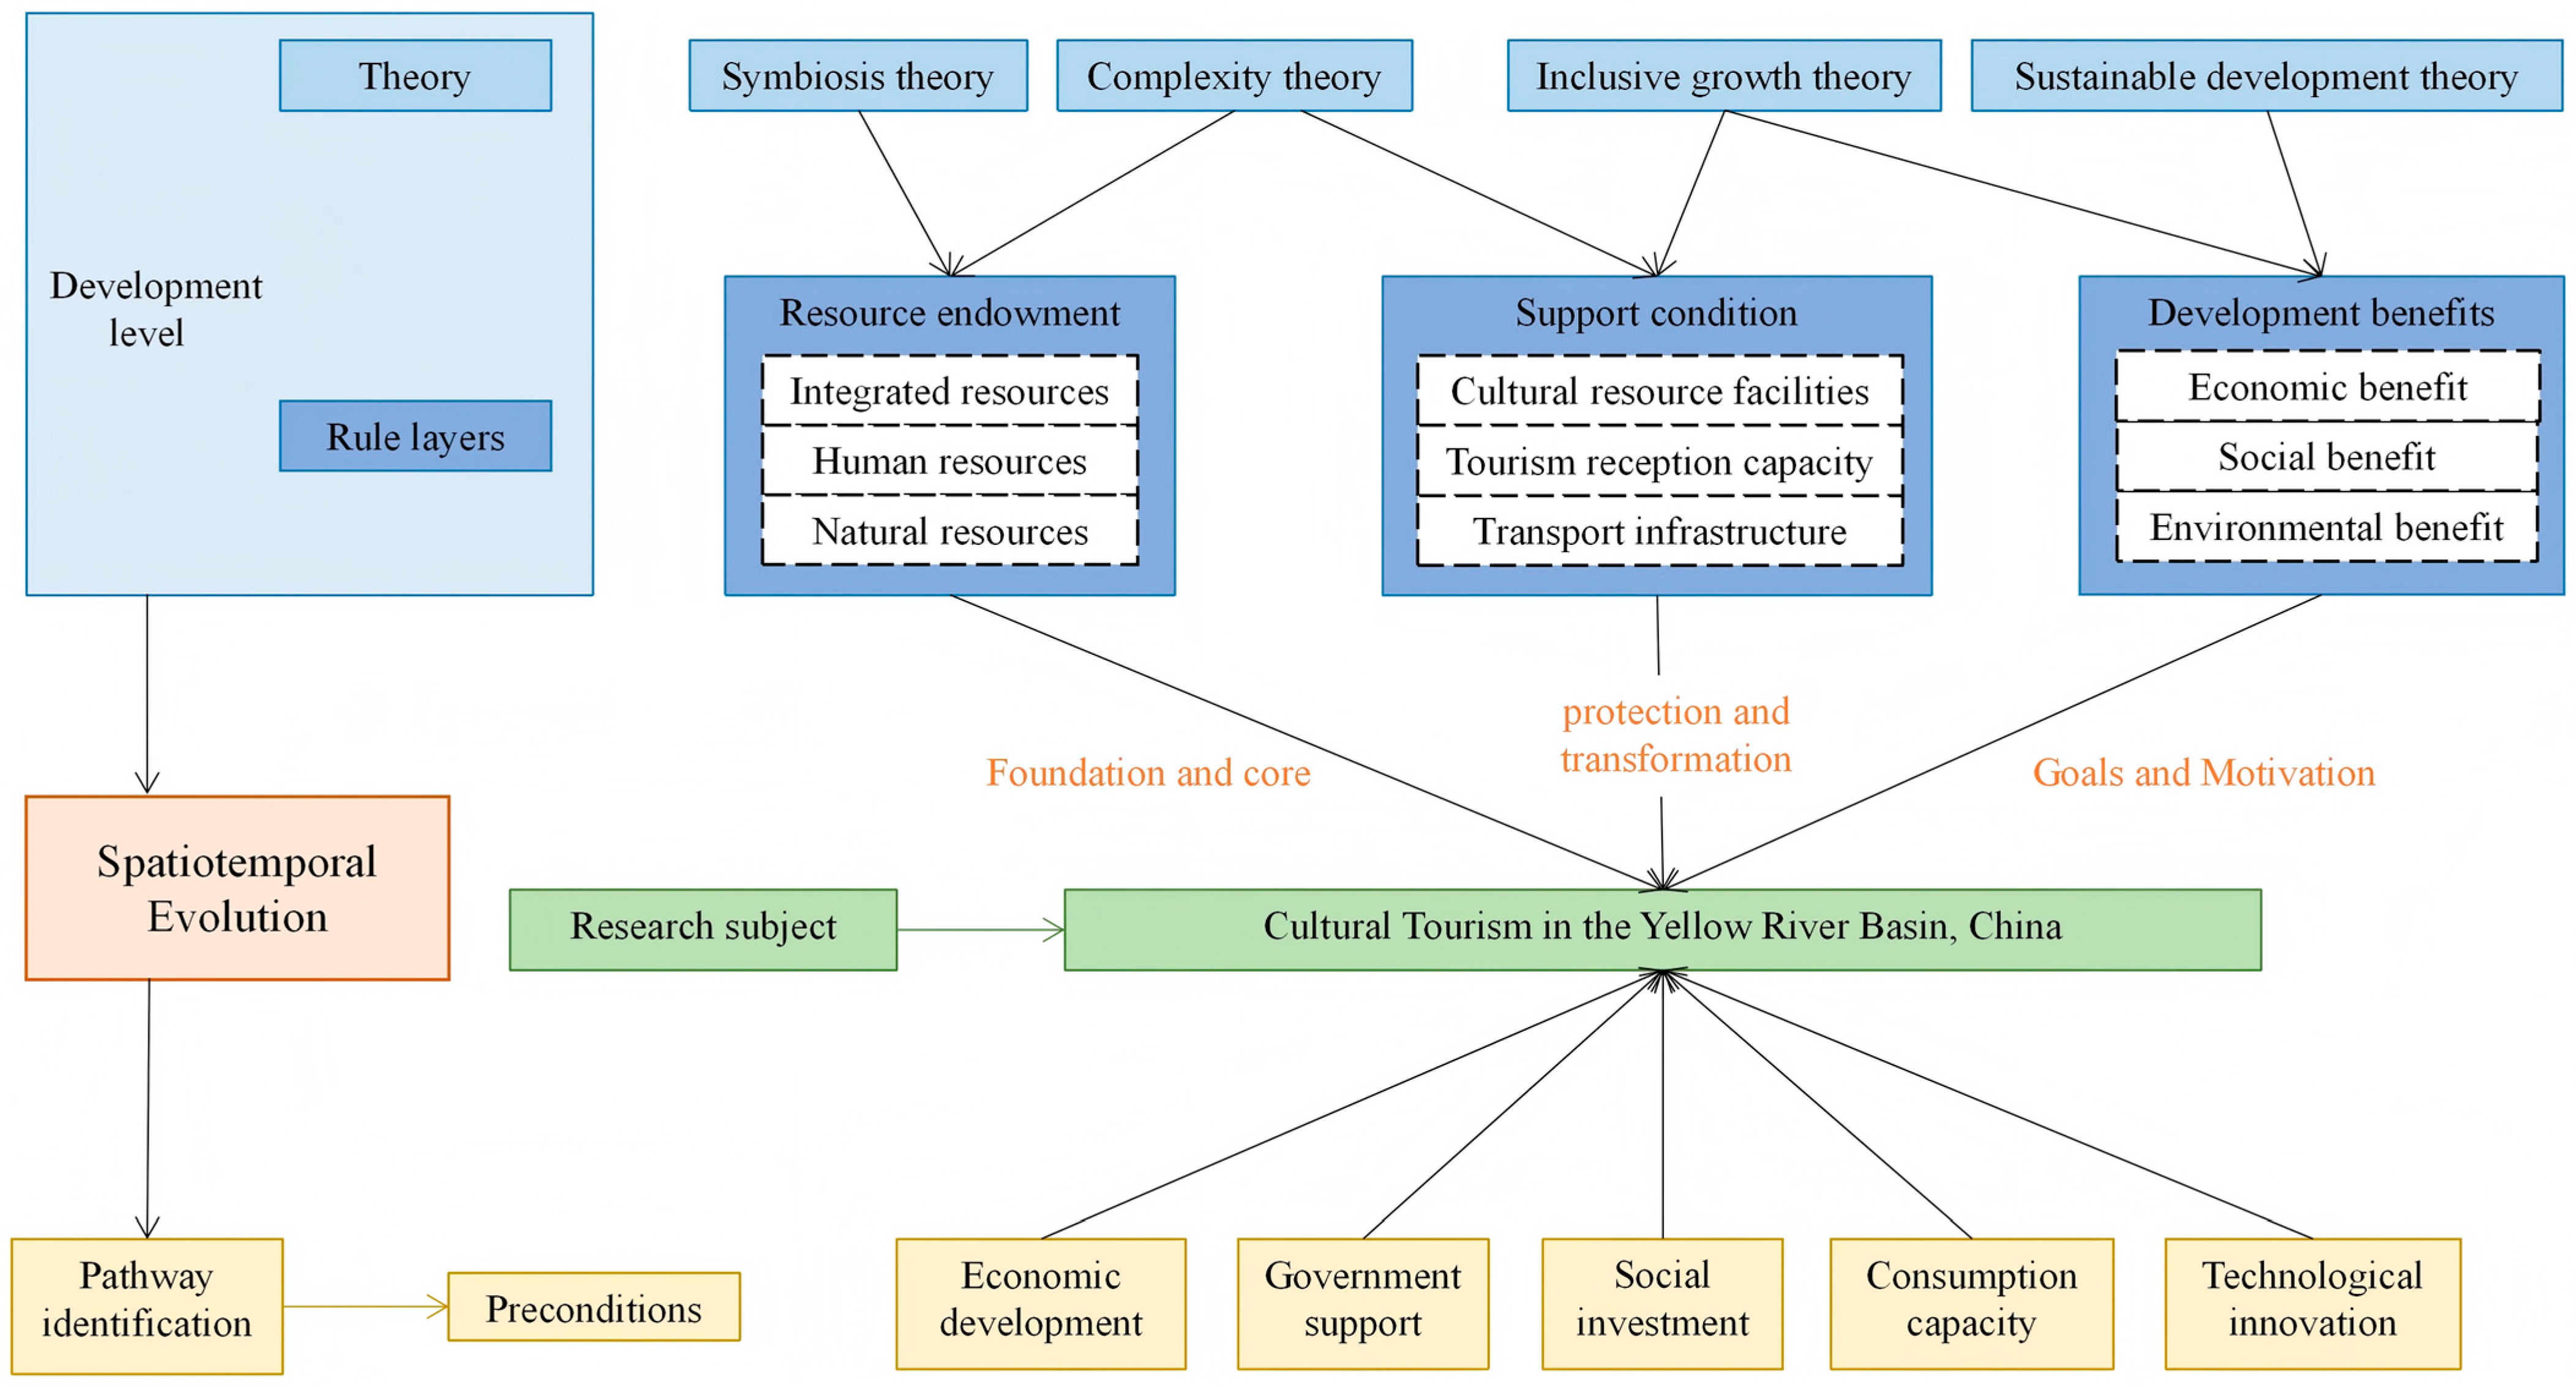
Figure 1 presents the conceptual framework of this study, with cultural tourism in the YRB, China, serving as the foundation and core of the research subject. The level of CTD is systematically deconstructed into three interconnected rule layers: resource endowment, support conditions, and development benefits. Specifically, resource endowment encompasses integrated, human, and natural resources, providing the foundational basis. Support conditions encompasses cultural resource facilities, tourism reception capacity, and transport infrastructure. Ultimately, development benefits represent the “goals and motivation” of the system, which are measured comprehensively through economic, social, and environmental benefits. This entire evaluation architecture is robustly underpinned by a multi-disciplinary theoretical matrix, including symbiosis theory, complexity theory, inclusive growth theory, and sustainable development theory.
Furthermore, the conceptual model establishes a vital linkage between the measured development level and underlying driving mechanisms through the lens of Spatio-temporal Evolution. To systematically unravel the complex forces driving this evolution, the framework incorporates a pathway identification module driven by five critical preconditions: economic development, government support, social investment, consumption capacity, and technological innovation. By integrating these preconditions, the research model forms a complete logical closed loop, successfully transitioning from the multi-dimensional evaluation of the current development states to the identification of specific pathways, thereby comprehensively revealing the mechanisms that stimulate cultural tourism growth in the region.

3. Data and Methods

3.1. Study Area

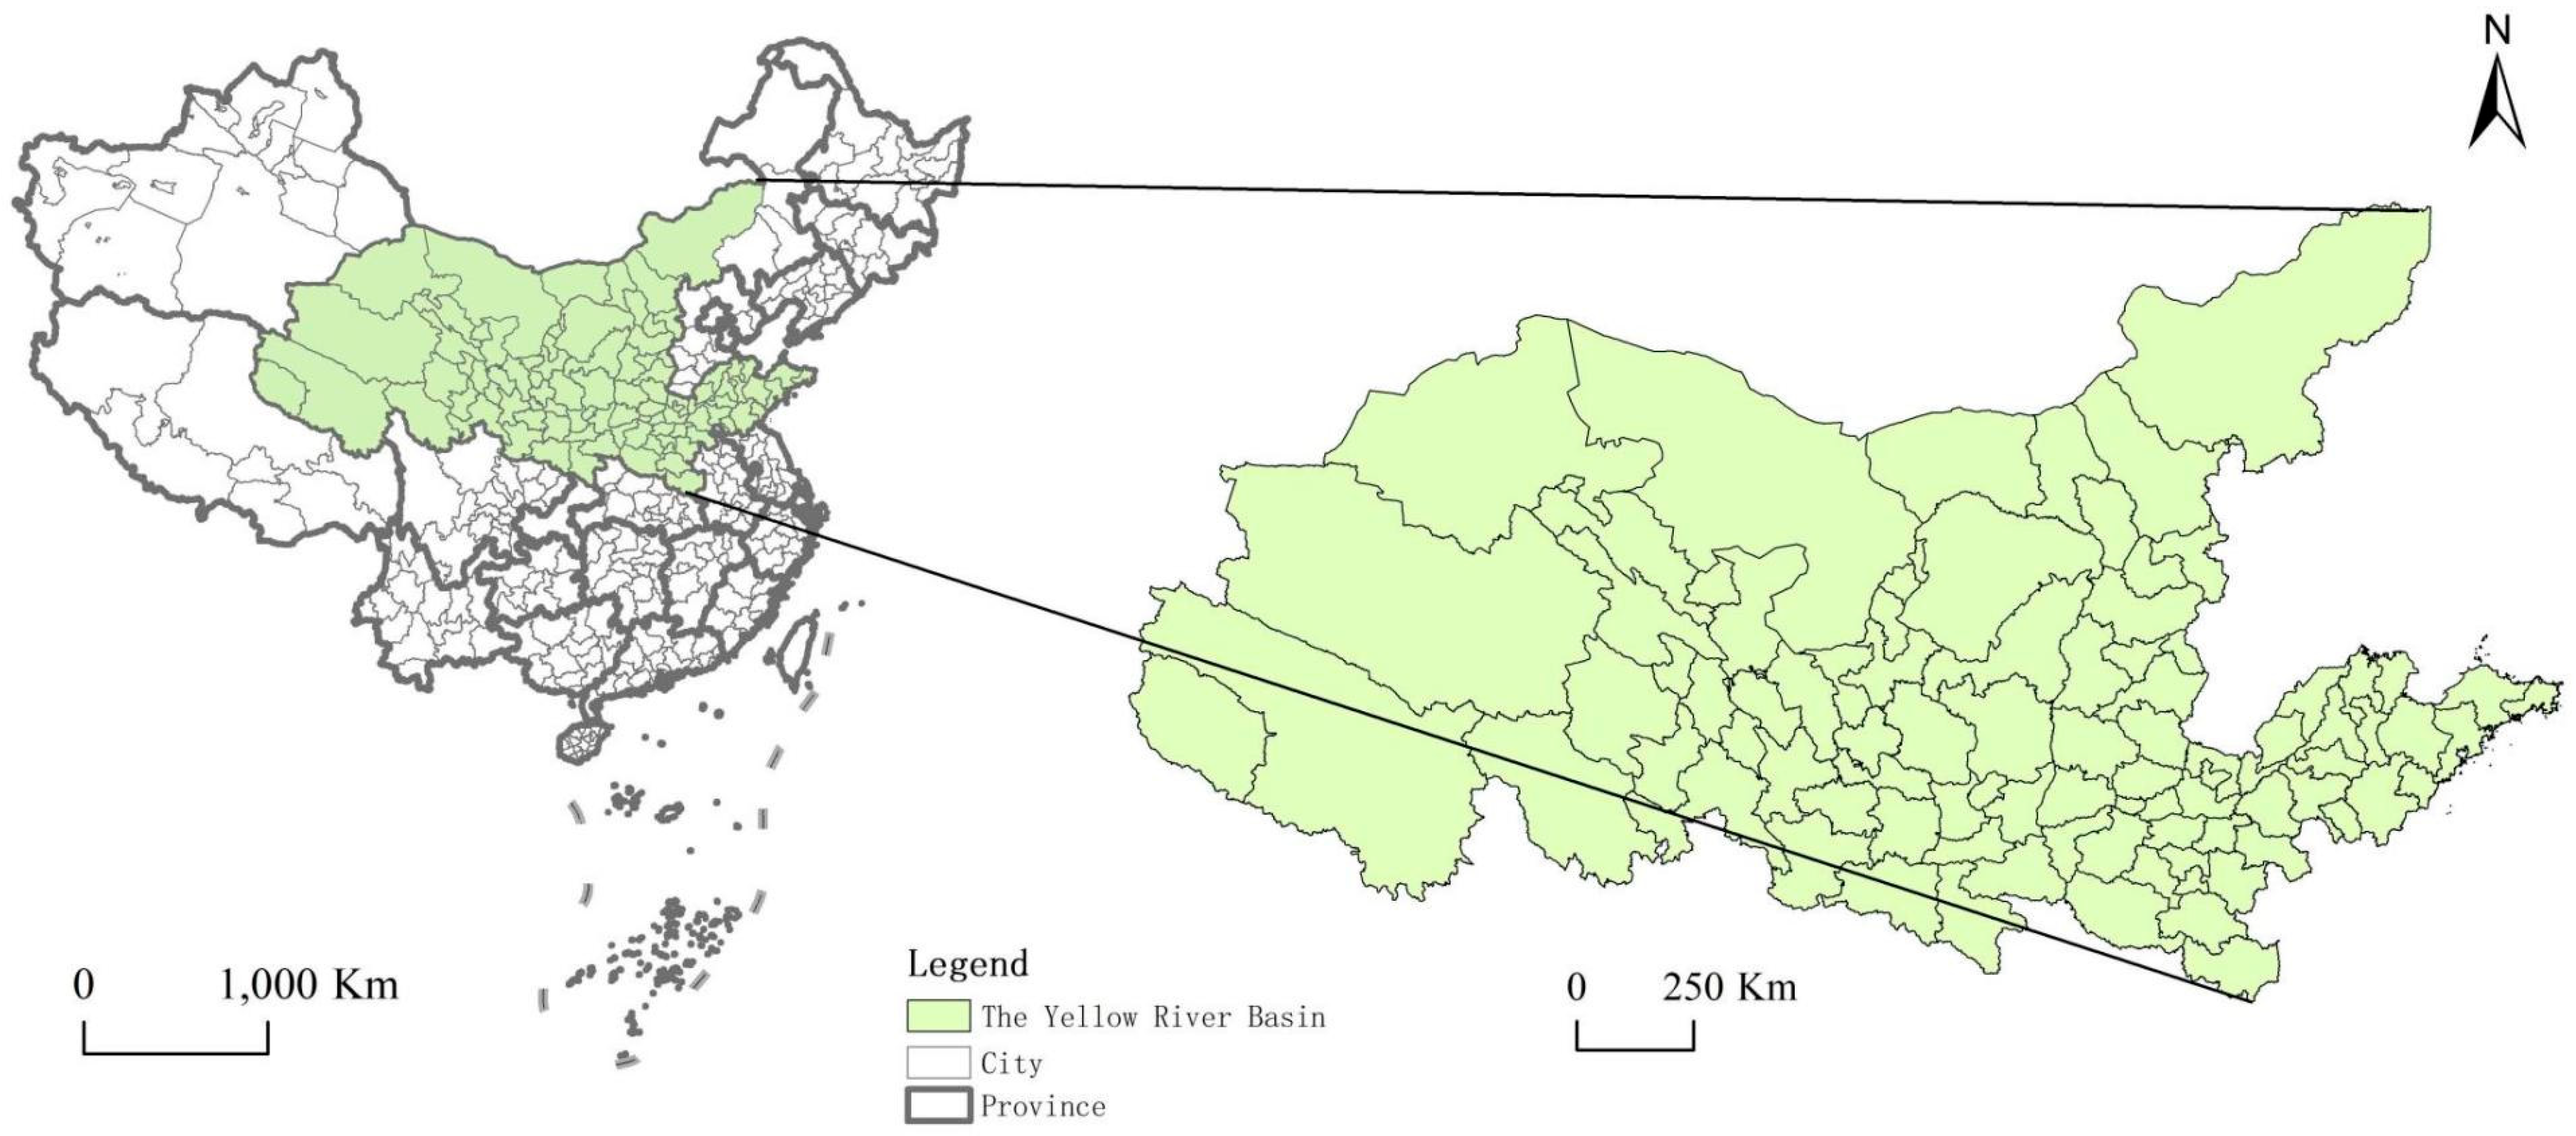
The study area was defined as the eight provinces and districts through which the Yellow River flows, except for the four eastern leagues of Inner Mongolia (Figure 2). The YRB, which has nurtured the magnificent ancient civilisation of China and holds profound cultural heritage, is the central zone of cultural patrimony in the Yellow River. The Huangshui, Hetao, Guanzhong, Sanjin, Heluo, and Qilu cultures are scattered along the Yellow River, intermingling with each other; each has its own characteristics. Among the eight ancient capitals in China, four major ones, namely Xi’an, Luoyang, Kaifeng, Zhengzhou, and Anyang, were located in the YRB, generating exclusive conditions to facilitate the CTD. In 2024, the eight provinces and regions along the Yellow River contain 16 World Heritage Sites, which constitute a significant proportion (27.1%) of the national total in China. The number of tourists visiting this area reached an astounding 3.475 billion people, representing a considerable share (60.4%) of the overall tourist reception across the country. Moreover, the cumulative tourism revenue amounted to 360.42 billion yuan, accounting for a dominant portion (69%) of the total tourism earnings in China. However, the YRB in China exhibits differences in topography, ecology, culture, ethnicity, economy, and social development. Consequently, the CTD is characterised by diversity, complexity, and dynamism in the YRB, China. This study aims to develop an indicator system for cultural tourism that includes these features and outlines the path of its formation.

3.2. Data Sources

Data were collected from Chinese Urban Statistical Yearbook from 2005 to 2020, each city’s statistical yearbook, and statistical bulletins. Data on cultural tourism resources were obtained from the list of national A-class scenic spots, the list of national historical and cultural cities, towns, and villages, the State Administration of Cultural Heritage, the bureaus of cultural relics in provinces and regions of the YRB, China’s official intangible cultural heritage website, and the State Intellectual Property Office of China. When data were absent, we employed the smoothing method of interpolation to supplement the dataset and utilised the extreme difference approach to standardise the original data and eliminate magnitude discrepancies. This process yielded data for prefecture-level cities in the YRB from 2004 to 2019.

3.3. Research Methods

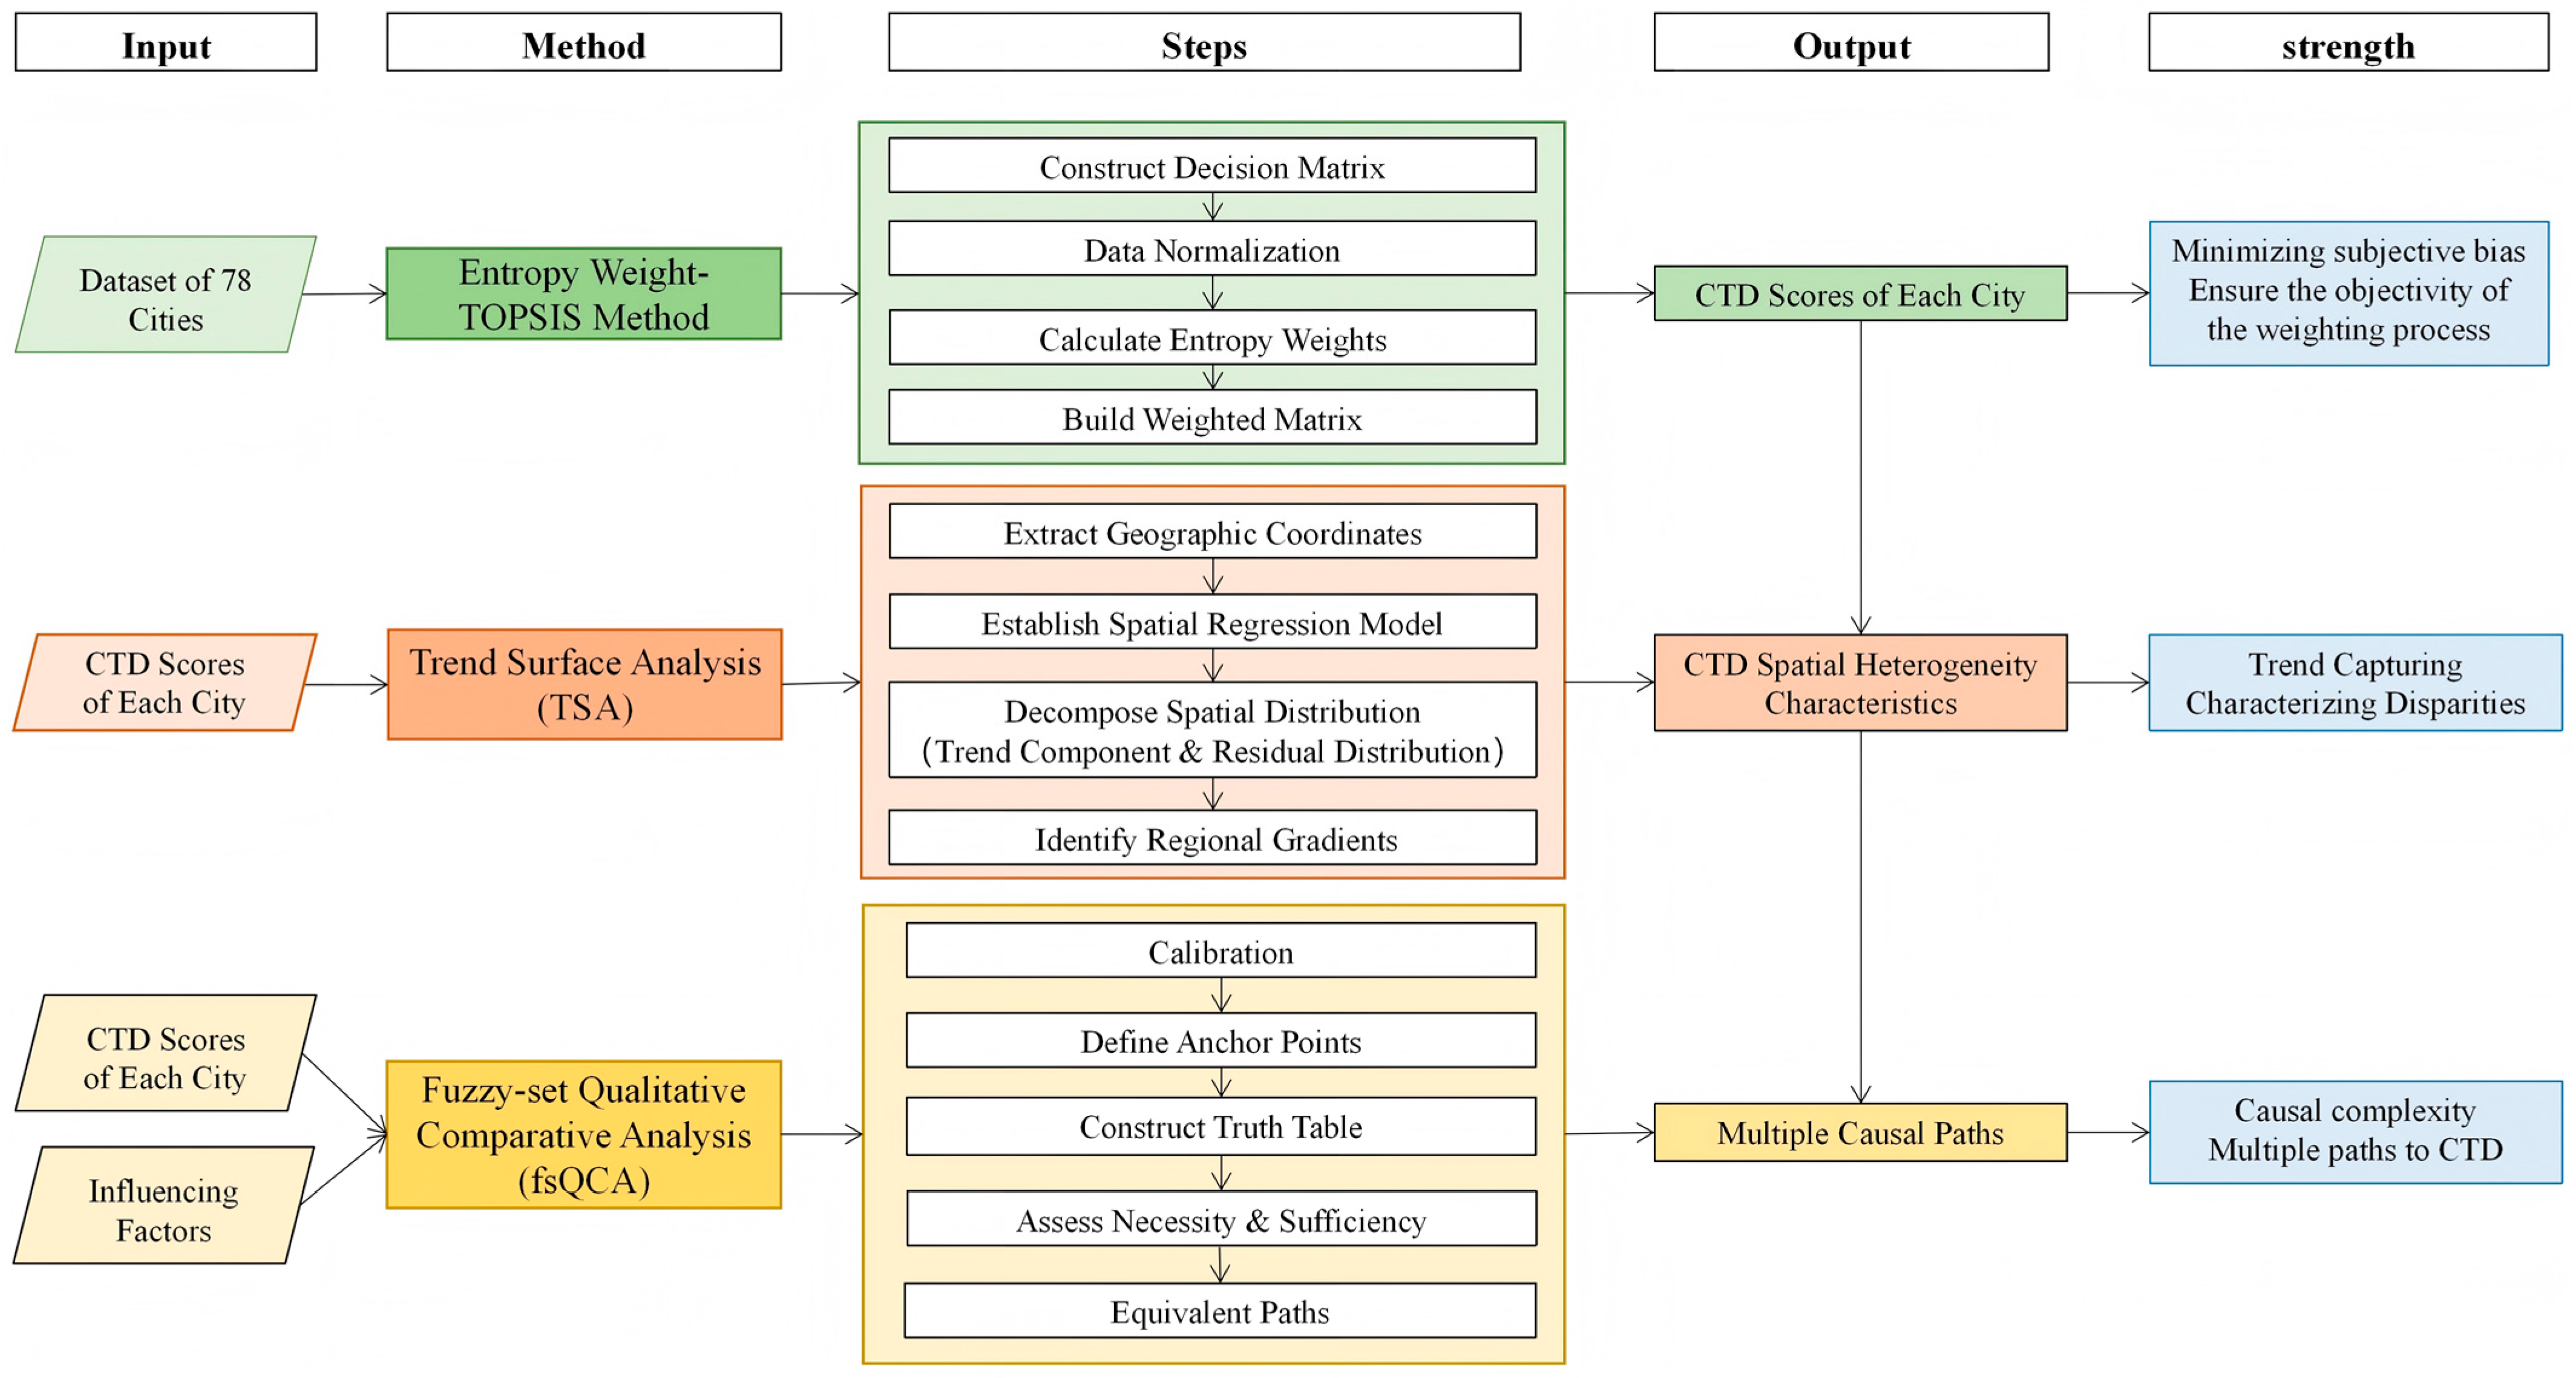
To comprehensively evaluate the CTD in the YRB, this study employs a multi-dimensional analytical framework (Figure 3) that progresses from quantification to spatial characterization and finally to causal path identification. First, we utilize the entropy weight–TOPSIS method to derive precise CTD scores for the 78 target cities. This approach is critical for minimizing subjective bias and ensuring the objectivity of the weighting process, thereby establishing a robust foundation for comparative study. Building upon these scores, we apply Trend Surface Analysis (TSA) to decipher the basin’s spatial patterns. TSA proves uniquely effective in capturing dominant macro-level spatial trends while simultaneously delineating the intensity of regional development disparities, allowing us to map the underlying spatial gradients of tourism growth across the study area.
Furthermore, to explore the determinants of CTD, we employ fuzzy-set Qualitative Comparative Analysis (fsQCA). By integrating the calculated CTD scores with key influencing factors, this method facilitates a deeper investigation into causal complexity. Unlike traditional variable-oriented approaches, fsQCA enables the identification of multiple causal pathways leading to high-level tourism development, thereby addressing the principle of equifinality.

3.3.1. Entropy Weight–TOPSIS Method

To evaluate the level of CTD, we utilize the entropy weight–TOPSIS method. Based on the comparative analysis of multi-criteria decision-making (MCDM) methods in Section 2.2, it is evident that subjective and objective analysis methods have unique scopes of application, advantages, and disadvantages. The entropy value method rests on the extent of dispersion of indicators, which are used to objectively determine their importance. Higher dispersion is indicative of greater importance. To combine the strengths of entropy value and TOPSIS, we employed the entropy weight–TOPSIS method, eliminating subjective bias and accurately reflecting CTD levels and regional differences.
First, we normalised the data and calculated the proportion of indicators in each city to their composite S i as follows:
S i = u i / i = 1 n u i
Second, we determined the entropy of the evaluation indicators H i and calculated the entropy weights of each indicator W i as follows:
W i = ( 1 H i ) / i = 1 n ( 1 H i ) ,
where
H i = k i = 1 n S i l n ( S i ) , k = 1 / l n ( n )
Third, we calculated the level of CTD in each city as follows:
C T D = i = 1 n W ¯ i × u i
where u i is the standardised value of the positive and negative indicators, n is the number of cities included in the study, and W ¯ is calculated as the average of the sum of the indicator weights in different years. The level of CTD is a measure for determining the intensity with which a city participates in cultural tourism activities.

3.3.2. Trend Surface Analysis (TSA)

Trend surface analysis employs mathematical fitting to simulate a spatial surface, facilitating the exploration of change trend and the distribution of the research object over a vast spatial span [70]. This study used CTD levels to simulate the spatiotemporal characteristics of the YRB in 2004, 2011, and 2019 through utilising trend surface analysis as follows:
R i X i , Y i = T i X i , Y i + ε i
where R i represents the city’s CTD level, the X-axis represents the east–west direction, and the Y-axis represents the north–south direction. Furthermore, represents the city’s geographical co-ordinates, is the trend function, is the trend surface’s fitted value, and is the random error term.

3.3.3. Fuzzy-Set Qualitative Comparative Analysis

This study utilised qualitative comparative analysis (QCA), put forth by Ragin, to identify the diverse pathways of CTD in the YRB. This method integrates the strengths of qualitative and quantitative approaches, utilising set and Boolean algebra, and can examine the causal logic relationship under a combination of multiple antecedent conditions [61]. The CTD level has complex causes. The fsQCA method provides a quantitative method to identify multiple causal paths with strong feasibility and rationality. Therefore, this study used fsQCA to explore the CTD path in the YRB. Additionally, we incorporated a complex dynamic perspective [71] and Bayesian estimation. Analyses were conducted using RStudio 4.1.1.

4. Results

4.1. Index System and Index Model

This study was based on symbiosis, complexity, sustainable development and inclusive growth theories, adhering to the principles of systematicity, scientificity, validity, and operability. We established an indicator system for CTD comprising resource base, supporting conditions, and development benefits.
Consequently, we constructed an indicator system for assessing CTD, containing one target layer, three criterion layers, nine sub-rule layers, and twenty-four factor layers (Table 2).
By utilising the entropy weight–TOPSIS method, this study determined indicator weights to assess CTD in the YRB. First, we retrieved and processed the index data for each factor layer of the case area’s 78 cities covering years 2004 to 2019. Subsequently, the entropy weight–TOPSIS approach computed the weights and scores.
Table 2 presents the objective weights of the 24 evaluation indicators calculated using the entropy-weighting method. The results reveal that transport infrastructure and integrated resources are the most dominant determinants of driving spatial disparities in CTD. Specifically, within the support conditions layer, railway passenger traffic (0.1108) and road passenger traffic (0.1002) occupy the top two positions across the entire indicator system. This underscores that regional accessibility and tourist mobility serve as the most fundamental prerequisites for cultural tourism prosperity. Furthermore, in the resource endowment layer, the number of 4A (0.0949), 3A (0.0864), and 5A tourist attractions (0.0741) exhibit remarkably high weights. This indicates that the spatial distribution of high-quality, standardized scenic spots possesses a high degree of data dispersion, making core integrated resources the primary differentiators that widen the development gap among different regions in the YRB.
Conversely, indicators within the social and environmental benefit dimensions demonstrate relatively marginal impacts on the comprehensive evaluation. For instance, green coverage (0.0021) and the number of persons employed in culture, sports and recreation (0.0026) are assigned the lowest weights in the system. From the perspective of the entropy method, this statistically implies that the variations in ecological greening and direct cultural employment across the studied regions are minimal. While these factors remain essential for sustainable development, they do not constitute the primary sources of regional inequality in current cultural tourism performance. However, within the development benefits layer, gross tourism receipts as a share of GDP (0.0748) still maintains a substantial weight, reflecting that the economic dependency and output efficiency of the tourism sector remain crucial yardsticks for evaluating regional cultural tourism competitiveness.
The scores for the target layer were calculated using the weights and scores from the main criterion layer, which represented each city’s overall level of CTD as follows:
P = 0.4613 P 1 + 0.3209 P 2 + 0.2178 P 3
P represents the CTD, with a higher value indicating greater development potential. ωi denotes the weight assigned to the i-th rule layers. As illustrated in Table 2, the respective values of ω1, ω2, and ω3 are 0.4613, 0.3209, and 0.2178. Pi signifies the overall score for the i-th rule layer in CTD evaluation. P 1 represents the cultural tourism’s resource endowment, P 2 its supporting conditions, and P 3 its development benefits.

4.2. Spatiotemporal Characteristics of Cultural Tourism Development

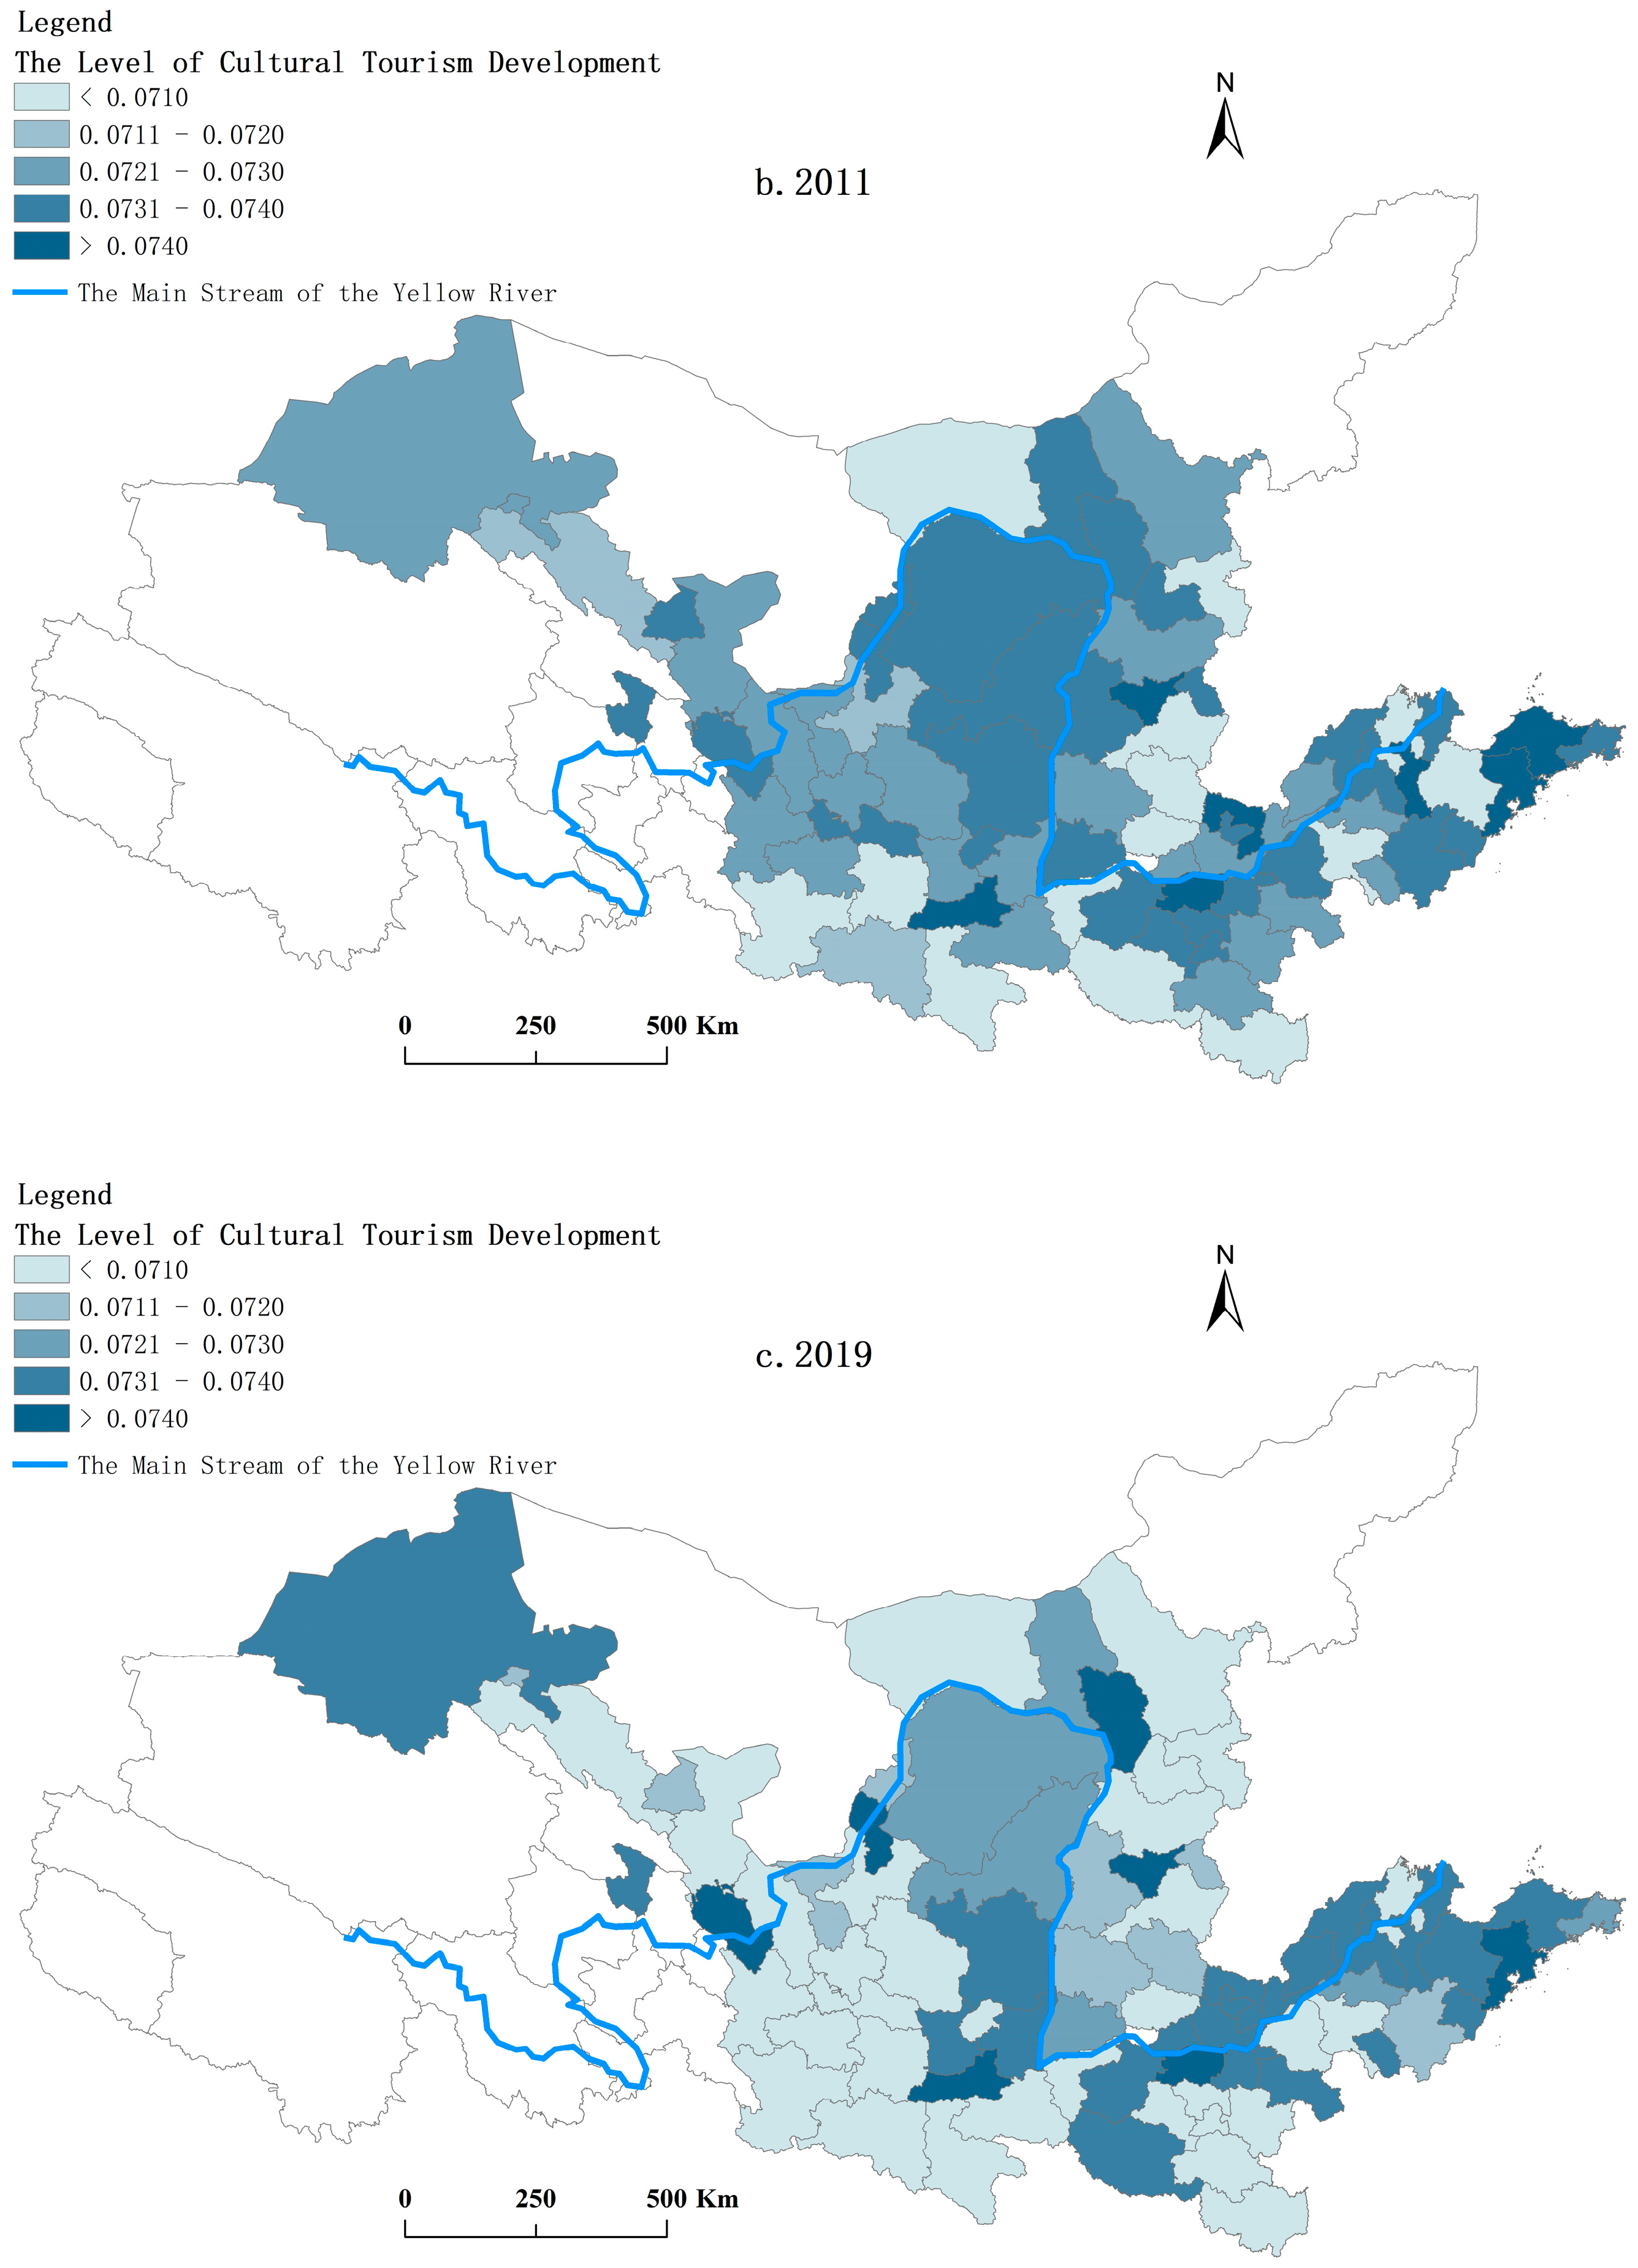
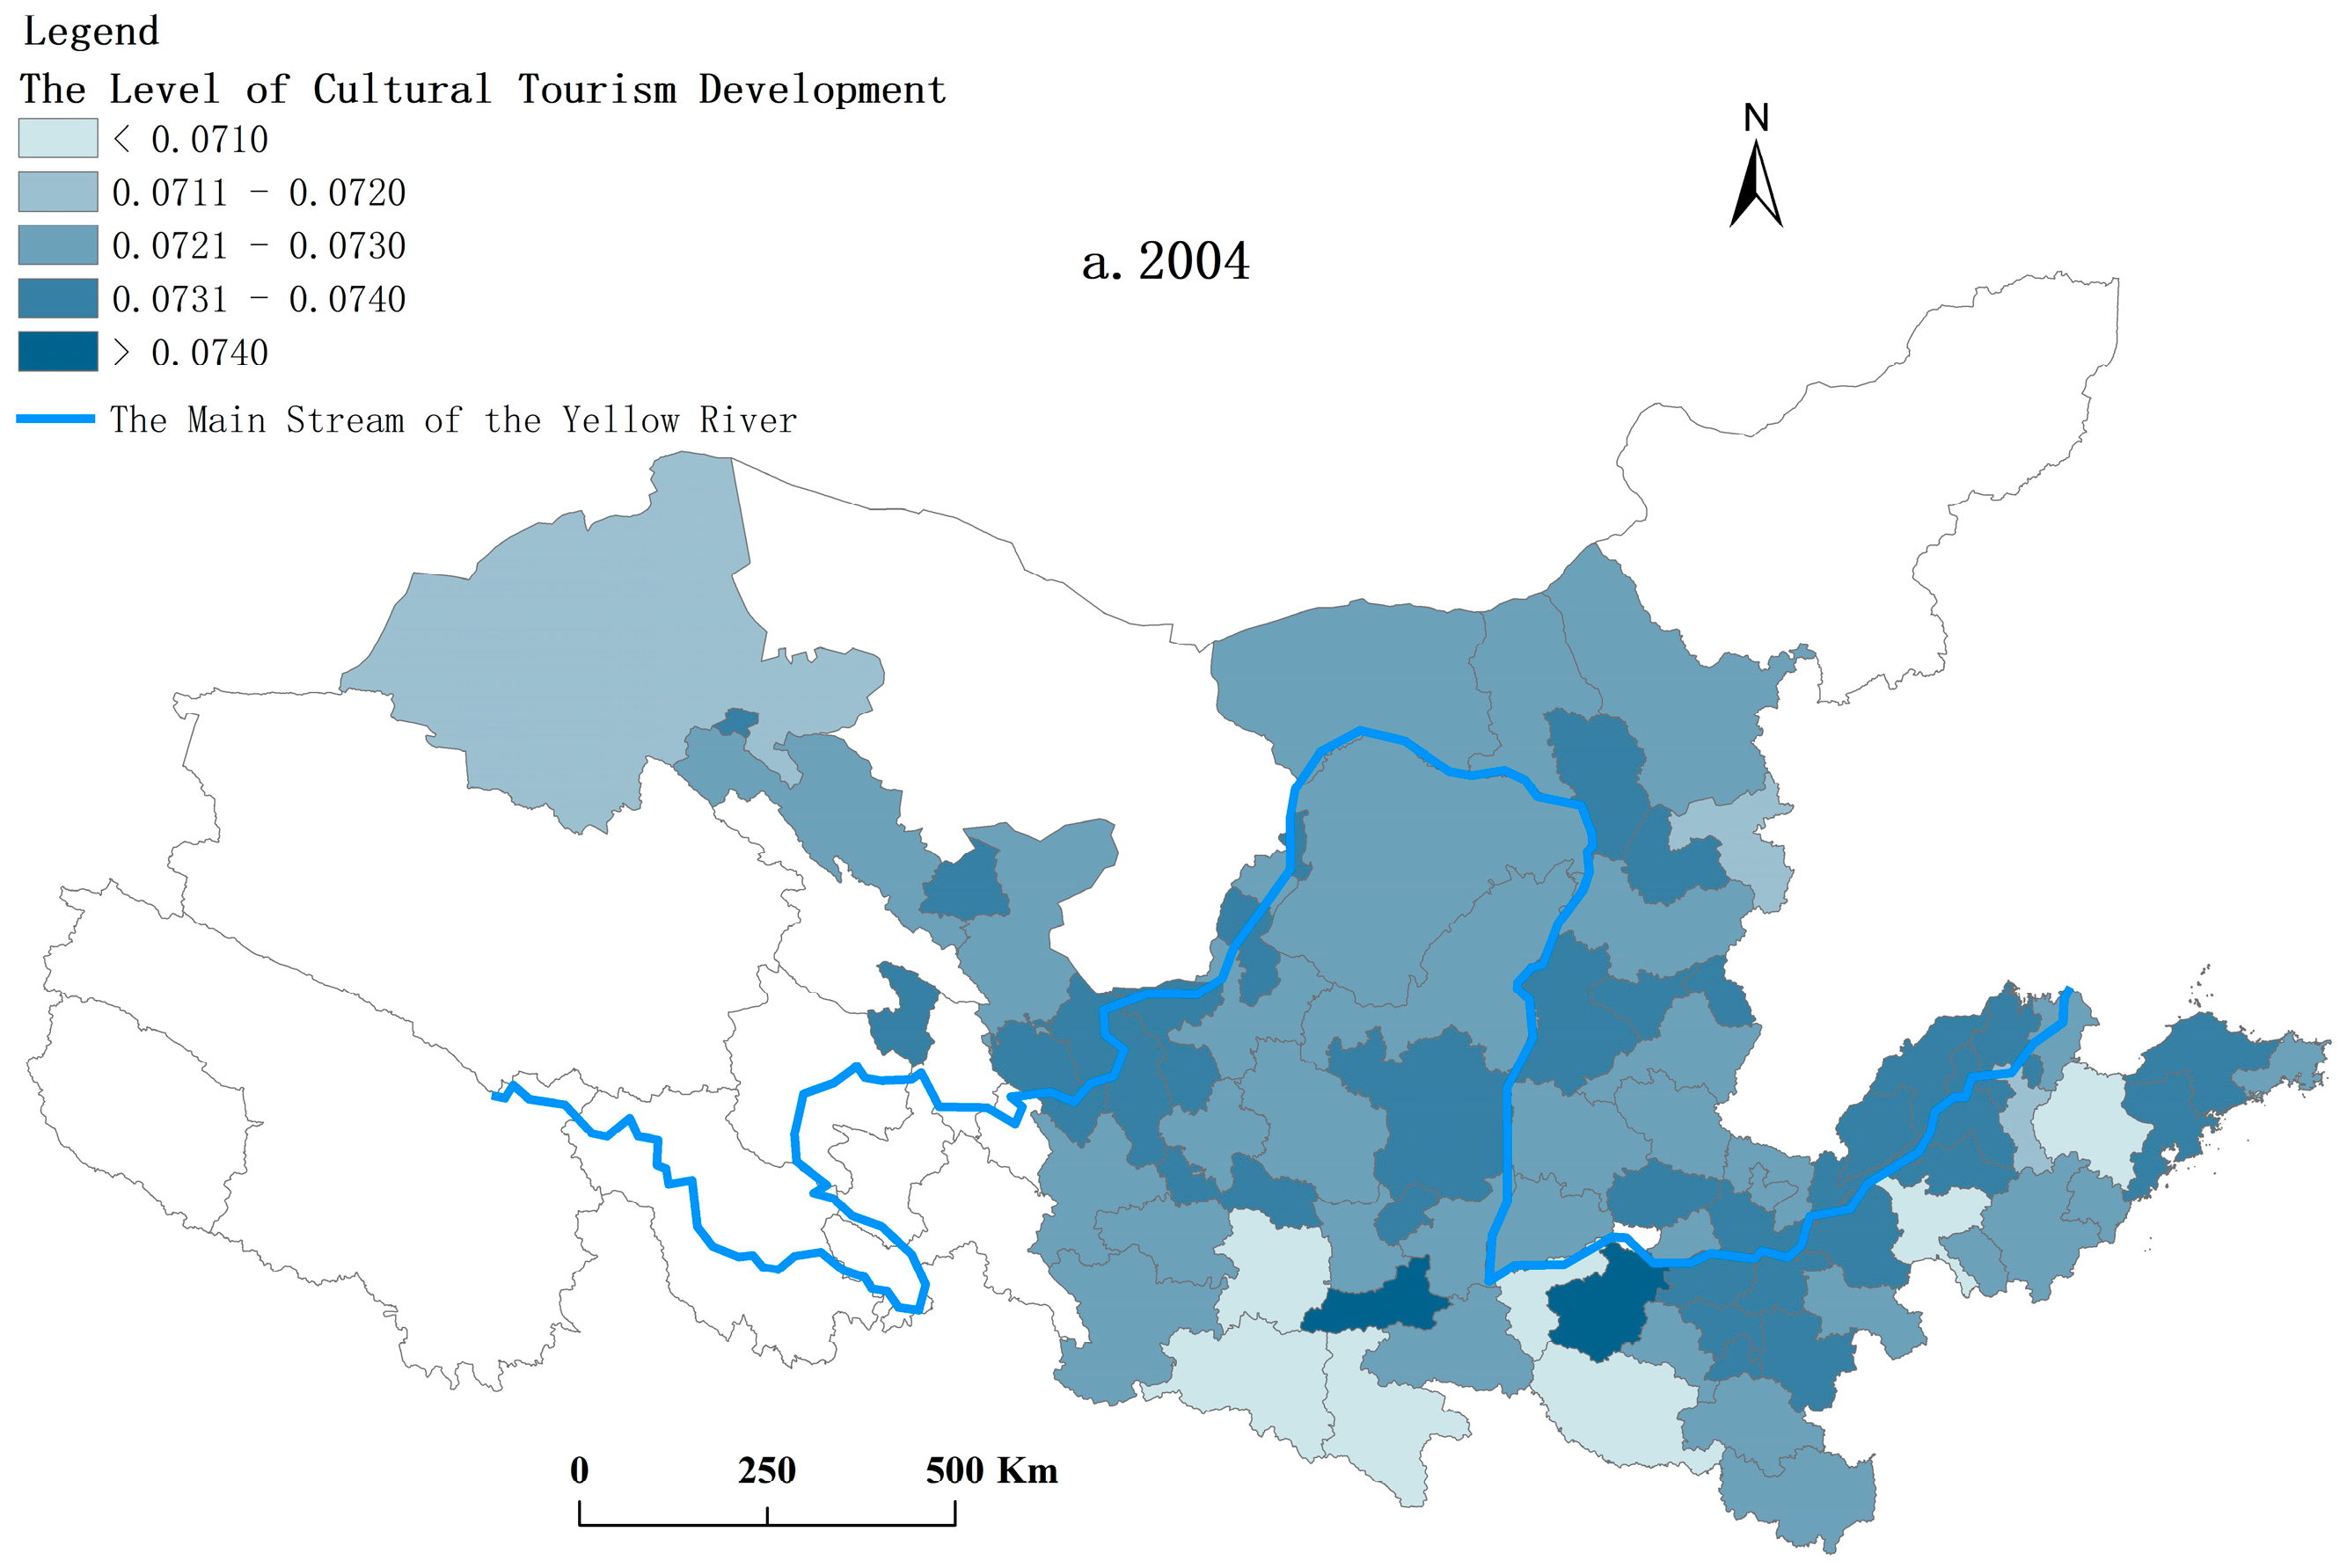
As illustrated in Figure 4, CTD in the YRB exhibited a gradual upward trend from 2004 to 2019, accompanied by widening regional disparities. High CTD levels were consistently concentrated in economically advanced cities with abundant cultural resources. In 2004, provincial capitals and national historical cities, such as Xi’an and Luoyang, established a first-mover advantage owing to their robust infrastructure and market accessibility. This initial status aligns with the ‘path dependence’ hypothesis, where historical endowments dictate early development trajectories [83]. By 2011, while the overall CTD improved, regional divergence intensified; provincial capitals like Xi’an and Taiyuan led, while Zhengzhou emerged as a significant regional radiator. By 2019, this trajectory persisted, and the spatial clustering of high-level development around provincial capitals became increasingly pronounced, further exacerbating the regional development gap. Our results demonstrate a persistent polarization effect. This divergence suggests that the trickle-down mechanism of tourism growth is largely ineffective in the YRB context, as growth poles tend to siphon rather than diffuse resources, thereby reinforcing existing spatial inequalities [84].
As shown in Figure 5, CTD in the YRB displays a spatial pattern characterized by higher development in downstream and central regions compared to northern areas. A north–south analysis reveals an inverted ‘U’ distribution trend, which intensified significantly after 2011 alongside a widening regional gap. Over the 2004–2019 period, downstream cities consistently maintained a competitive advantage. Furthermore, the East–West divergence became increasingly pronounced in 2019, reflecting growing regional inequality in CTD.

4.3. Identifying Cultural Tourism Development Paths

4.3.1. Antecedent Conditions

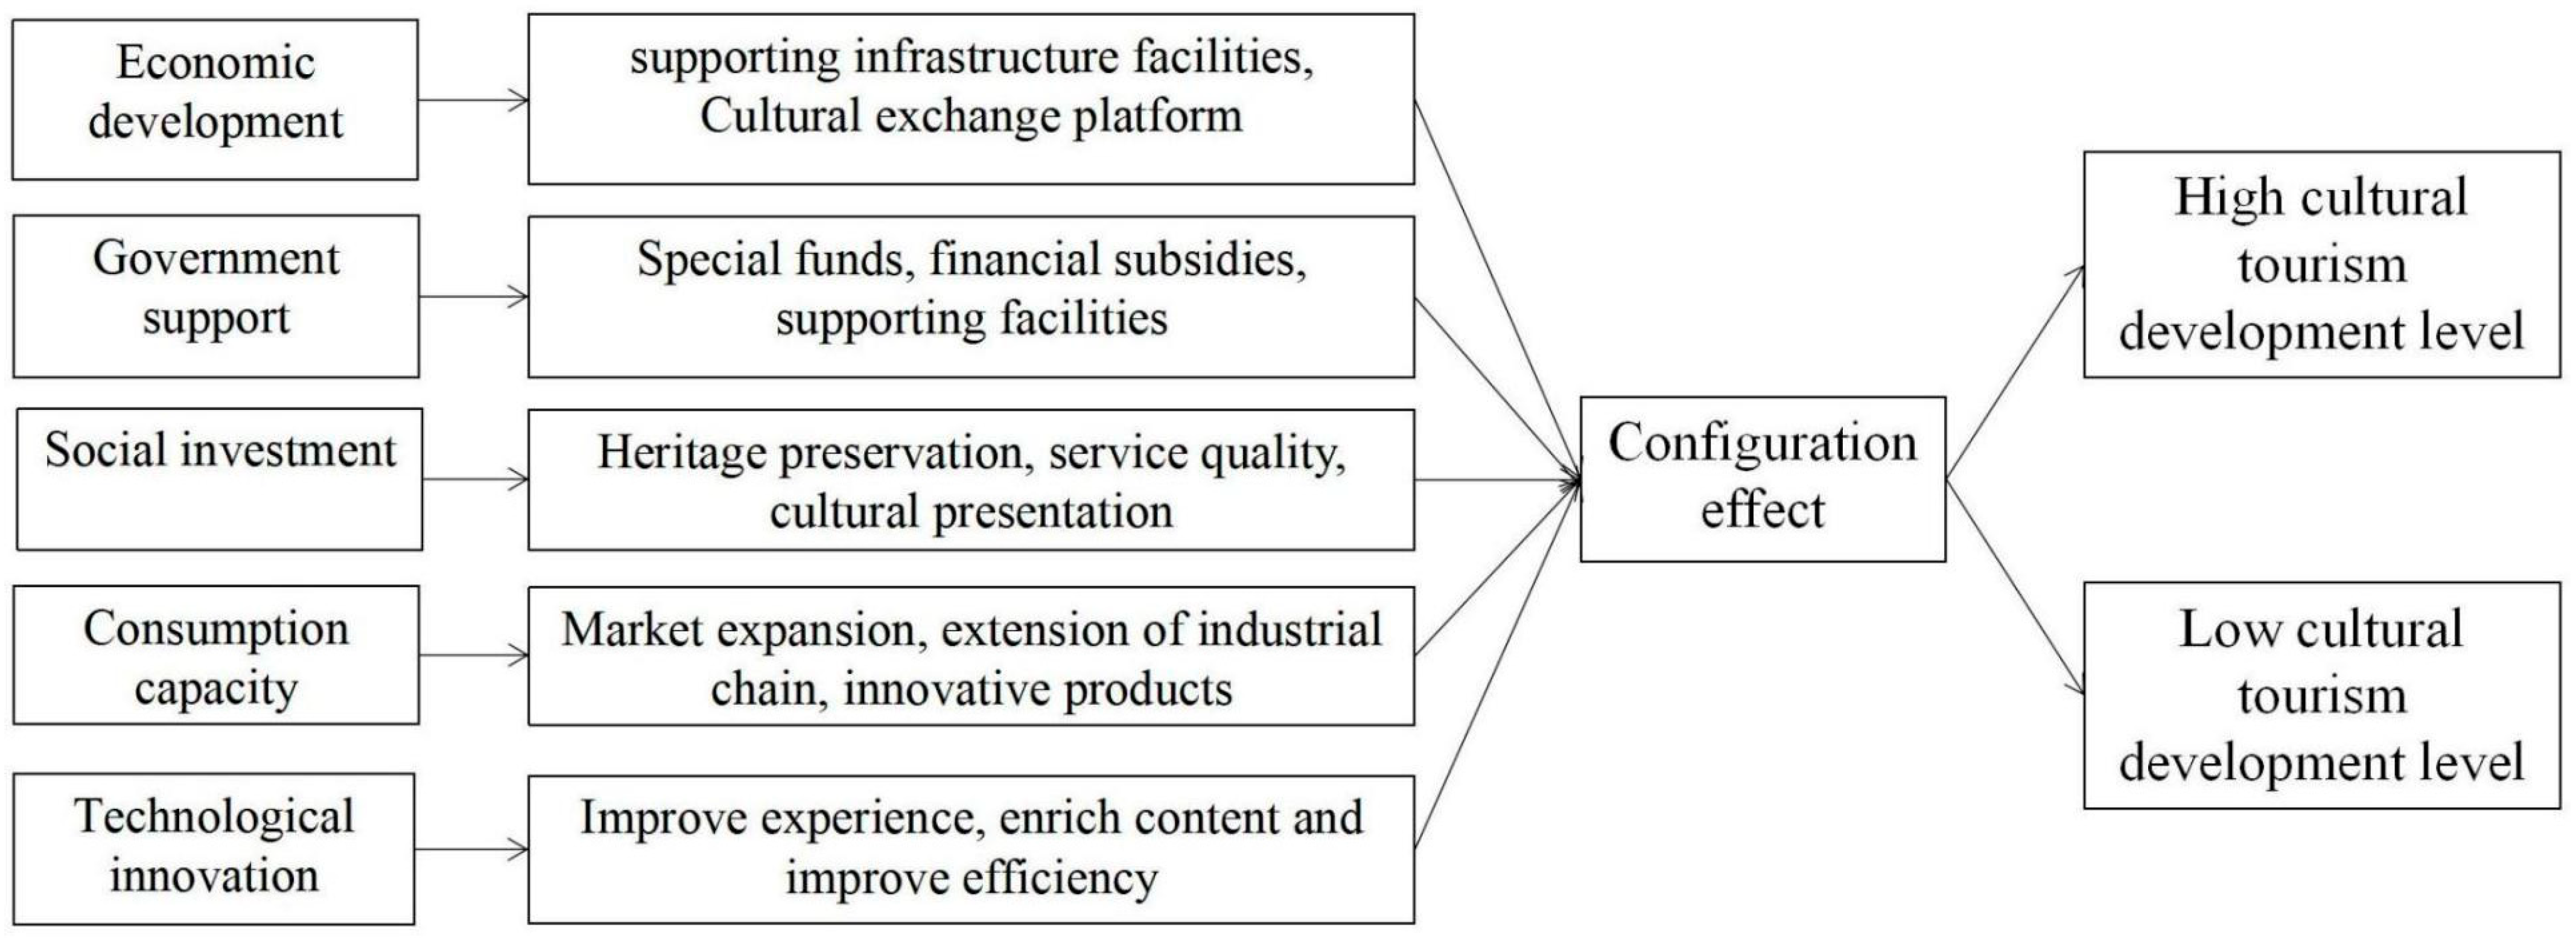
Considering the regional heterogeneity of CTD in the YRB, exploring development pathways requires a multidimensional analysis. This study investigates five antecedent conditions: economic development, government support, social investment, consumption capacity, and technological innovation quality (Figure 6).
Economic development serves as the foundational driver, enhancing infrastructure and destination accessibility. Government support acts as a strategic catalyst; through fiscal subsidies, tax incentives, and heritage protection policies, the state fosters regional competitiveness [46]. Social investment provides essential financial backing and enhances serviceability of tourist destinations via media integration [85,86]. Consumption capacity reflects market maturity, where higher disposable income and evolving preferences drive product innovation and industry expansion [73,87]. Furthermore, technological innovations, such as virtual reality and big data analytics, optimize resource allocation and elevate visitor engagement [88].
To operationalize these constructs, economic development is measured by GDP per capita. Government support is operationalized as the product of the tourism revenue share in GDP and general public budget expenditure. Social investment is determined by multiplying the share of total tourism revenue in GDP by fixed asset investment [89]. Finally, consumption capacity is gauged by per capita expenditure on culture and entertainment, and technological innovation is measured by the number of tourism-related patents per 10,000 individuals.

4.3.2. Necessity Analysis for Individual Conditions

Before conducting the antecedent conditional combined path analysis, this study selected the 95%, 50%, and 5% quantile points of the conditional and outcome variables and calibrated them as fully affiliated, cross-affiliated, and fully unaffiliated points, respectively, to calibrate all variables into fuzzy sets with values ranging from 0 to 1 (Table 3). Next, we performed individual necessity tests on the univariate facts and counterfactuals using fsQCA software (version 4.1), requiring a consistency greater than 0.9. We calculated a single condition’s consistency and coverage; it was insufficient to constitute a necessary condition for high and low CTD levels (Table 4). Therefore, this study further examined the combination of conditional variables and identified the effective paths to explain high and low CTD.

4.3.3. Multiple Configuration Path Analysis

The number of samples covered by the grouping was set to 1, the heterogeneity threshold to 0.8, and the Principles for Responsible Investment (PRI) consistency threshold to 0.7. The conditional grouping analysis was conducted on the advancement of cultural tourism in cities at the prefecture level, providing the outputs of parsimonious, intermediate, and complex solutions. The conditions that were shared by both parsimonious and intermediate solutions were identified as core conditions; conditions that were exclusive to the intermediate solution were named edge conditions. The final results of the configuration analysis for high and low CTD levels were obtained using Boolean simplification (Table 5).
The group analysis demonstrated that the combination of government support, social investment, consumption capacity, scientific and technological innovation, and human capital resulted in three high- and three low-level development paths. With consistency scores of 0.865 for high-CTD and 0.805 for low-CTD, our findings demonstrate that these paths are sufficient conditions for CTD, which underscores the overall reliability of our analysis [90]. All five antecedent conditions had high explanatory strength for CTD. The overall solution explained 79.7% and 54.6% of the sample, respectively.
In accordance with the fundamental tenets of the aforementioned core conditions, this study identified three principal categories of paths towards high CTD: consumer market-driven under policy assistance, economic investment-driven, and government-led economic investment and innovation driven CTD. The low-CTD paths comprised insufficient economic policy and innovation and deficiencies in economic and consumer markets and economic and social investment. These findings corroborate the contingency theory of tourism development [91], which suggests that the effectiveness of developmental factors is not universal but conditional upon the regional context.
For high CTD, H1 (Consistency 0.786; Coverage 64%), the policy-supported consumer market-driven path, features high consumption capacity and the absence of high economic development and high-tech innovation as core conditions, with government support as a peripheral condition. This reveals that strong market demand, when bolstered by policy intervention, can compensate for structural resource limitations, as observed in cities such as Ankang and Hanzhong.
H2 (Consistency 0.849; Coverage 66.7%), the economic investment-driven path, identifies high economic development and high social investment as core conditions, with high consumption and innovation as peripheral conditions. This finding diverges from many studies that overemphasize government-led models in China, suggesting that a mature, market-oriented social investment environment (as seen in Weifang and Linyi) acts as an alternative, self-sustaining driver for CTD.
H3 (Consistency 0.844; Coverage 67.9%), the government-led economic investment and innovation-driven path, comprises high economic development, policy support, and technological innovation as core conditions. This path leverages national strategy and fiscal capacity to integrate advanced technologies and creative talent, as seen in regional hubs like Zhengzhou and Xi’an.
Conversely, two configurations result in low CTD. NH1 (Consistency 0.796; Coverage 51.8%) identifies the absence of economic development, policy support, and technological innovation as primary constraints, particularly in cities outside the YRB core. NH2 (Consistency 0.843; Coverage 36.4%) demonstrates that despite social investment, the simultaneous absence of high economic development and consumption capacity hinders growth. As evidenced by cities such as Datong and Linfen, relying solely on social capital without addressing underlying economic and market-preference challenges proves insufficient to achieve high-level CTD. Consequently, our results caution against simple infrastructure-centric development policies, which, when applied in isolation without nurturing the underlying market ecosystem, prove ineffective in driving sustainable tourism growth [92].
Group NH3’s consistency was 0.808, covering 47.7% of the sample. This pathway had low economic development, low social investment, and high consumption capacity as core conditions and high government support as a marginal condition. This group contained Pingdingshan, Zhumadian, and Wuwei. The inadequate economic development and social investment caused cities to lack motivation for CTD and product innovation. Even with policy aid, a low-CTD path with economic and social investment deficiencies formed.
The YRB spans eastern, central, and western China, each representing a major economic zone. Significant economic, cultural, ecological, and social differences exist between the upper, middle, and lower reaches. This study analysed the CTD disparities across these regions (Table 6). In the high-CTD group path, economic investment and science innovation were dominant influencing factors in upstream areas. Those in the middle reaches were science and technology innovation and the consumer market. Those in downstream areas were government support, science innovation, consumption, and economic investments. In the low-CTD group path, the dominant influencing factors in upstream areas were insufficient economic investment and science and innovation, those in the midstream were economic and consumer market deficiencies, and those in downstream areas were economic policy and science and technology innovation deficiencies.
Given the distinctive status of National Historic and Cultural Cities (NHCCs) within the YRB, this study conducted a subgroup analysis (Table 7). For high-level CTD (Consistency 0.844; Coverage 62.8%), two pathways were identified. Path H1, characterized by low consumption and high-tech innovation as core conditions, suggests that technological immersion serves as a critical substitute for economic capital in cities like Kaifeng and Nanyang. This challenges the traditional belief that cultural tourism requires heavy capital investment; instead, it demonstrates that ‘technological capability’ can act as a catalyst to unlock latent heritage value [93]. Path H2, driven by high policy support and high-tech innovation, underscores the synergy between fiscal intervention and digital cultural asset restoration in hubs such as Xi’an and Luoyang.
Conversely, low-CTD pathways (Consistency 0.931; Coverage 54.3%) reveal two primary barriers. Paths NH1a/b indicate that high government support often fails to stimulate growth when structural economic development remains low, as observed in Datong and Tianshui. Path NH2 highlights a resource-innovation mismatch, where high social investment is undermined by low market consumption and technological innovation, a pattern exemplified by Jiuquan.

4.3.4. Robustness Test

The results’ reliability was validated by modifying the consistency and calibration norms [94]. We reduced the consistency from 0.80 to 0.79, followed by group analysis. To eliminate the effect of each condition’s calibration standards’ differences, we used 2% and 92% instead of the original 5% and 95% calibration intervals, reperforming the histogram analysis. Finally, we increased the PRI consistency threshold from 0.7 to 0.72 to conduct a histogram analysis. Slight modifications were observed in the consistency and coverage of the high-CTD and low-CTD solutions. The solutions’ consistency exceeded 0.8, and the newly formed grouping outcomes were encompassed within the original groupings. Thus, this study’s paths were robust.

5. Conclusions

This study developed an index system based on resource endowment, supporting conditions, and development benefits, using the entropy weight–TOPSIS method, to assess CTD in 78 cities in the YRB from 2004 to 2019. The fsQCA method found multiple development pathways, compensating for traditional quantitative analyses’ limitations [95]. The results reveal significant CTD growth, with regional disparities in resource endowment, supporting conditions, and development benefits.
There was a notable CTD increase from 2004 to 2019. The CTD in the YRB gradually increased, with relatively high levels in the downstream and central areas and relatively low levels in the northern and southern regions. However, significant spatial differences were identified in resource endowment, supporting conditions, and development benefits. CTD was centred in cities boasting high economic advancement and rich cultural and tourism resources. The distribution along the Yellow River is characterised by obvious features.
The group analysis results demonstrate different high- and low-CTD paths. High CTD followed three paths: consumer market-driven under policy assistance, economic investment-driven, and government-led economic investment and innovation-driven CTD. Low CTD also had three paths: insufficient economic policy and innovation, deficient economic and consumer markets, and deficient economic and social investment.
Notable spatial disparities in CTD were found in the YRB. To achieve high CTD, the dominant factors were economic, scientific, and innovative, both at upstream and downstream stages. However, in the middle reaches, the dominant factors were science and technology innovation, as well as consumption capacity. For low CTD, economic investment and the generation of scientific and technological resources were the principal impelling forces. Economic development and the consumer market were dominant in the middle reaches, and the lack of effective economic policies and innovation in science and technology were dominant factors. Examining the YRB’s national historical and cultural cities revealed that high-CTD emergence is marked by the lack of scientific and technological consumer markets and a government-directed model of scientific and technological development. The low-CTD formation paths were government-supported economic development deficiency and consumption and innovation deficiency.

6. Discussion

6.1. Contribution

This study makes several novel contributions. First, it establishes a characteristic indicator system for assessing the CTD in the YRB, encompassing resource base, supporting conditions, and development benefits from a symbiotic perspective considering its holistic and processing nature. Compared with previous research, this study comprehensively examined sustainable CTD advantages. It emphasises CTD’s economic benefits and incorporates social and environmental benefits. Second, it resolves the difficulty of CTD’s multiple-factor interaction and single-path formation. Most studies on cultural tourism’s factors have been based on constructing econometric models, with factors considered to be independent; in practice, cultural tourism’s elements are inextricably linked and collectively shape its evolution. Due to differences in resource bases, supporting conditions, and development benefits, various cities’ CTD paths differ. For this reason, the fsQCA was employed to solve the problem of CTD’s multi-factor interactions and the difficulty of forming paths with multiple causes and one effect. Furthermore, Bayesian estimation was applied to study tourism and cultural tourism path formation from a complex dynamic perspective in the YRB. Finally, different development paths and balances with different development modes were analysed. This study further explains different development paths and analyses the development paths of different types of cultural tourism to balance different development modes.

6.2. Policy Implication

The findings indicate several suggestions for promoting cities’ cultural tourism to achieve high-quality development. First, the government must clarify its development positioning, expedite the strengthening of regional hub cities’ cultural tourism capacity, and leverage the radiation-driven role of high-CTD cities, such as Zhengzhou, Luoyang, Qingdao, Yantai, Jinan, Xi’an, and Taiyuan. Moreover, the government should adopt provincial capital and regional centre cities as nodes, open the Yellow River Culture Belt channel, take advantage of these cities’ abundant human and financial resources and robust scientific and technological innovation capacity, and construct a new pattern of staggered CTD in the basin. Additionally, the government should maintain a people-oriented perspective and focus on creating professionals in specific regions, perhaps by attracting cultural and tourism-related professionals through preferential policies and by enhancing the local population’s cultural and tourism expertise by providing specialised training. This approach aims to facilitate high-quality CTD. Furthermore, cities lagging in development should focus on cultural tourism investment and consumption capacity to achieve synergetic development, promote cultural tourism projects, and encourage high-quality cultural tourism and cultural and creative products. Meanwhile, artificial intelligence technology, digital technology, network platforms, and new media should integrate impressive, personalised, and high-value consumption and experience factors into local cultural tourism to create intelligent cultural tourism. Moreover, for cities with abundant cultural tourism resources but weak support conditions, local scientific and technological innovation levels must be enhanced through professional and technological education. Cities should enhance the construction of cultural tourism infrastructure, comprehensively examine cultural tourism resources characteristics, and create differentiated, specialised, and targeted cultural brands. Additionally, designing tourism products and services with high conversion and return rates and benefits of forming tourist centres with identifiability, cultural characteristics, and regional features is important. Finally, cities should construct recognisable, culturally, and geographically distinctive development models, broaden publicity methods, and enhance visibility to expand the international market.

6.3. Limitation and Future Research

This study had several limitations. First, the study period was limited, extending only to 2019, mainly due to COVID-19’s influence on cultural tourism. The primary objective of this study is to uncover the spatiotemporal evolution and pathway identification of cultural tourism in the YRB under normalized, regular conditions. Ensuring Research Focus and Baseline Establishment: The period of 2004–2019 captures a complete, stable, and rapid growth cycle of cultural tourism in China. For future research, we will analyze how COVID-19 impacted the cultural dimension of tourism and how the system recovers or transforms—a fascinating and critical research agenda. However, such an analysis requires a distinct theoretical framework (e.g., focusing on system resilience, and post-pandemic behavioral shifts) and comparative methodologies (pre- vs. post-COVID), which fall outside the scope of the current manuscript. Second, additional perspectives and subject evaluations should be included. Future research must consider incorporating big data and dynamic viewpoints into cultural tourism’s assessment framework. Specifically, as we transition to utilizing big data and dynamic datasets in future studies, we will move beyond the traditional entropy-weight TOPSIS method. Instead, we will focus on further refining the spatial research units and optimizing our analytical methodologies to better handle complex data structures. Moreover, subjective evaluations from tourists, enterprises, local inhabitants, the government, and other entities should be included. Finally, in-depth small-scale case studies that are comprehensively interpreted to further analyse cultural tourism’s formation mechanism are required.


Author Contributions

Conceptualization, Y.Z. (Yan Zhang) and C.M.; methodology, Y.Z. (Yingzhuo Zhang), Y.Z. (Yan Zhang) and C.M.; software, Y.Z. (Yan Zhang); validation, Y.Z. (Yingzhuo Zhang); formal analysis, Y.Z. (Yingzhuo Zhang); investigation, Y.Z. (Yan Zhang) and C.M.; resources, Y.Z. (Yan Zhang) and C.M.; data curation, Y.Z. (Yingzhuo Zhang); writing—original draft preparation, Y.Z. (Yingzhuo Zhang), Y.Z. (Yan Zhang) and C.M.; writing—review and editing, Y.Z. (Yan Zhang), C.M. and J.C.; visualization, Y.Z. (Yan Zhang); supervision, J.C.; project administration, C.M.; funding acquisition, C.M. All authors have read and agreed to the published version of the manuscript.

Funding

This research was funded by the National Natural Science Foundation of China, grant number 42171186.

Data Availability Statement

The datasets used and analyzed in this study are available from the authors upon reasonable request.

Conflicts of Interest

The authors declare no conflicts of interest.

References

  1. Liu, L.; Chen, X. The Archaeology of China: From the Late Paleolithic to the Early Bronze Age; Cambridge University Press: Cambridge, UK, 2012. [Google Scholar]
  2. Feng, X.; Fu, B.; Piao, S.; Wang, S.; Ciais, P.; Zeng, Z.; Lü, Y.; Zeng, Y.; Jiang, X.; Wu, B. Revegetation in China’s Loess Plateau is approaching sustainable water resource limits. Nat. Clim. Change 2016, 6, 1019–1022. [Google Scholar] [CrossRef]
  3. Liu, W.; Dunford, M. Inclusive globalization: Unpacking China’s belt and road initiative. Area Dev. Policy 2016, 1, 323–340. [Google Scholar] [CrossRef]
  4. Richards, G. Cultural Tourism: Global and Local Perspectives; Routledge: London, UK, 2007. [Google Scholar]
  5. Smith, M.K. Issues in Cultural Tourism Studies; Routledge: London, UK, 2015. [Google Scholar]
  6. Xu, C.; Zhao, Y. Cultural tourism integration: A new way to construct national identity of tourists. Tour. Trib. 2020, 35, 11–12. [Google Scholar]
  7. Bec, A.; Moyle, B.; Timms, K.; Schaffer, V.; Skavronskaya, L.; Little, C. Management of immersive heritage tourism experiences: A conceptual model. Tour. Manag. 2019, 72, 117–120. [Google Scholar] [CrossRef]
  8. Yang, L.; Ning, W. Mechanisms and effects of the sustainable integration of digital-driven rural cultural tourism from the perspective of symbiosis. Sustain. Futures 2025, 10, 100867. [Google Scholar] [CrossRef]
  9. Reid, L.J.; Andereck, K.L. Statistical analyses use in tourism research. J. Travel Res. 1989, 28, 21–24. [Google Scholar] [CrossRef]
  10. Woodside, A.G. Embrace• perform• model: Complexity theory, contrarian case analysis, and multiple realities. J. Bus. Res. 2014, 67, 2495–2503. [Google Scholar] [CrossRef]
  11. Zhang, Z.; So, K.K.F.; Li, J.; Olya, H.; Huang, Z. Unpacking the complexity of cultural distance in inbound and outbound tourism: A case-oriented approach. Int. J. Tour. Res. 2024, 26, e2670. [Google Scholar] [CrossRef]
  12. Towner, J. The grand tour: A key phase in the history of tourism. Ann. Tour. Res. 1985, 12, 297–333. [Google Scholar] [CrossRef]
  13. Richards, G. The development of cultural tourism in Europe. In Cultural Attractions and European Tourism; Richards, G., Ed.; CABI Publishing: Wallingford, UK, 2001; pp. 3–29. [Google Scholar]
  14. Bao, J.; Chen, Y.; Ma, L. The process and mechanism of tourism resources evaluation: From technical evaluation to the social construction perspective. J. Nat. Resour. 2020, 35, 1556–1569. [Google Scholar] [CrossRef]
  15. World Tourism Organization. UNWTO Tourism Definitions; UNWTO: Madrid, Spain, 2019. [Google Scholar]
  16. Rodriguez, V. Tourism as a recruiting post for retirement migration. Tour. Geogr. 2001, 3, 52–63. [Google Scholar] [CrossRef]
  17. Fotsch, P.M. Tourism’s uneven impact: History on Cannery Row. Ann. Tour. Res. 2004, 31, 779–800. [Google Scholar] [CrossRef]
  18. Fan, T.; Xue, D. Spatial correlation of cultural industry and tourism industry in Shaanxi Province, China: LISA analysis based on coordination model. Asia Pac. J. Tour. Res. 2020, 25, 967–980. [Google Scholar] [CrossRef]
  19. Zhang, S.; Liu, J.; Pei, T.; Chan, C.; Wang, M.; Meng, B. Tourism value assessment of linear cultural heritage: The case of the Beijing–Hangzhou Grand Canal in China. Curr. Issues Tour. 2023, 26, 47–69. [Google Scholar] [CrossRef]
  20. Jin, Y.; Xi, H.; Wang, X.; Ren, X.; Yuan, L. Evaluation of the integration policy in China: Does the integration of culture and tourism promote tourism development? Ann. Tour. Res. 2022, 97, 103491. [Google Scholar] [CrossRef]
  21. Shang, K.; Zhang, Y.; Li, X.; Li, W.; Zhou, G. Spatial characteristics and influencing factors of night cultural and tourism consumption agglomeration areas in China. IEEE J. Sel. Top. Appl. Earth Obs. Remote Sens. 2023, 17, 261–273. [Google Scholar] [CrossRef]
  22. Guo, L.; Wu, B.; Liu, F.; Fan, Y. Study on the tourist resources classification system and types evaluation in China. Acta Geogr. Sin. 2000, 55, 294–301. [Google Scholar]
  23. Gunn, C.A.; Var, T. Tourism Planning: Basics, Concepts, Cases; Routledge: New York, NY, USA, 2002. [Google Scholar]
  24. Liu, X.; Bao, J. Development of the researches on the environmental impact on tourism development. Geogr. Res. 1996, 15, 92–100. [Google Scholar]
  25. Weng, G.; Li, L. The coupling coordination degree and spatial correlation analysis on the integrational development of tourism industry and cultural industry in China. Econ. Geogr. 2016, 1, 178–185. [Google Scholar]
  26. Sun, J. The transformation of tourism resource research in the context of high-quality development: New attributes, new framework and new directions. J. Nat. Resour. 2024, 39, 245–258. [Google Scholar] [CrossRef]
  27. Richards, G. Creativity and tourism: The state of the art. Ann. Tour. Res. 2011, 38, 1225–1253. [Google Scholar] [CrossRef]
  28. Zhang, H.; Gu, C.; Gu, L.; Zhang, Y. The evaluation of tourism destination competitiveness by TOPSIS & information entropy—A case in the Yangtze River Delta of China. Tour. Manag. 2011, 32, 443–451. [Google Scholar]
  29. Huang, S.; Hsu, C.H.C. Effects of travel motivation, past experience, perceived constraint, and attitude on revisit intention. J. Travel Res. 2009, 48, 29–44. [Google Scholar] [CrossRef]
  30. Peng, H.; Zhang, J.; Lu, L.; Tang, G.; Yan, B.; Xiao, X.; Han, Y. Eco-efficiency and its determinants at a tourism destination: A case study of Huangshan National Park, China. Tour. Manag. 2017, 60, 201–211. [Google Scholar] [CrossRef]
  31. Wang, D.; Niu, Y.; Qian, J. Evolution and optimization of China’s urban tourism spatial structure: A high speed rail perspective. Tour. Manag. 2018, 64, 218–232. [Google Scholar] [CrossRef]
  32. Zhang, L.; Gao, J. Exploring the effects of international tourism on China’s economic growth, energy consumption and environmental pollution: Evidence from a regional panel analysis. Renew. Sustain. Energy Rev. 2016, 53, 225–234. [Google Scholar] [CrossRef]
  33. Song, Z. The relationship between culture and tourism from the perspective of national policy. Tour. Trib. 2019, 34, 5–7. [Google Scholar]
  34. Huang, R.; Xie, C.; Li, Y. The evolution and effectiveness of China’s cultural tourism industry policies from 2009 to 2018: An empirical study. Tour. Trib. 2021, 36, 27–40. [Google Scholar]
  35. Song, R. Culture and tourism: Research from multiple perspectives. Tour. Trib. 2019, 34, 1–3. [Google Scholar]
  36. Wang, Z.; Xie, J. Spatiotemporal dynamic evolution of the cultural tourism integration development efficiency and its driving mechanism in China. Tour. Trib. 2024, 39, 34–51. [Google Scholar]
  37. Jin, Y.; Zhang, Y.; Hou, B. The path and mechanism of the tourism utilization of the Grand Canal heritage from an evolutionary perspective: A case study of cities along the Jiangsu-Zhejiang section of the Grand Canal. Tour. Trib. 2024, 39, 53–70. [Google Scholar]
  38. Li, R. Deep integration and collaborative development: The theoretical logic and practical path of cultural and tourism integration. Theory Mon. 2022, 1, 88–96. [Google Scholar]
  39. MacLeod, N.; Shelley, J.; Morrison, A.M. The touring reader: Understanding the bibliophile’s experience of literary tourism. Tour. Manag. 2018, 67, 388–398. [Google Scholar] [CrossRef]
  40. Lei, H.; Zhou, Y. Conducting heritage tourism-led urban renewal in Chinese historical and cultural urban spaces: A case study of Datong. Land 2022, 11, 2122. [Google Scholar] [CrossRef]
  41. Fan, Z.; Qi, Y. Research on the development of Cultural Tourism in the Yellow River under the guidance of National Cultural Park Construction. Theory Mon. 2022, 8, 71–77. [Google Scholar]
  42. Xue, L.; Kerstetter, D.; Hunt, C. Tourism development and changing rural identity in China. Ann. Tour. Res. 2017, 66, 170–182. [Google Scholar] [CrossRef]
  43. Tang, C.; Liu, Y.; Wan, Z.; Liang, W. Evaluation system and influencing paths of the integration of culture and tourism of traditional villages. Acta Geogr. Sin. 2023, 78, 980–996. [Google Scholar] [CrossRef]
  44. Sun, J.; Zhang, L.; Luo, Y. Development of rural tourism resources in China under the goal of common prosperity: Current situation, problems and the development path. J. Nat. Resour. 2023, 38, 318–334. [Google Scholar] [CrossRef]
  45. Li, L. The diagnosis of “synchronousness-asynchronousness” and the Chinese destinations: Based on the national tourism data of 31 provincial cellos. Hum. Geogr. 2008, 23, 87–90. [Google Scholar]
  46. Sun, J.; Li, S.; Ji, X.; Qin, W.; Wang, F. Coupling analysis and optimization measures of cultural resources endowment and tour ism industry in Shandong. Econ. Geogr. 2019, 39, 207–215. [Google Scholar]
  47. Baggio, R.; Sainaghi, R. Complex and chaotic tourism systems: Towards a quantitative approach. Int. J. Contemp. Hosp. Manag. 2011, 23, 840–861. [Google Scholar] [CrossRef]
  48. McKercher, B. A chaos approach to tourism. Tour. Manag. 1999, 20, 425–434. [Google Scholar] [CrossRef]
  49. Scheyvens, R.; Biddulph, R. Inclusive tourism development. Tour. Geogr. 2018, 20, 589–609. [Google Scholar] [CrossRef]
  50. Weaver, D. Sustainable Tourism; Routledge: London, UK, 2007. [Google Scholar]
  51. Saaty, T.L. Decision making with the analytic hierarchy process. Int. J. Serv. Sci. 2008, 1, 83–98. [Google Scholar] [CrossRef]
  52. Rezaei, J. Best-worst multi-criteria decision-making method. Omega-Int. J. Manag. Sci. 2015, 53, 49–57. [Google Scholar] [CrossRef]
  53. Charnes, A.; Cooper, W.W.; Rhodes, E. Measuring the efficiency of decision making units. Eur. J. Oper. Res. 1978, 2, 429–444. [Google Scholar] [CrossRef]
  54. Buhalis, D.; Leung, D.; Lin, M. Metaverse as a disruptive technology revolutionising tourism management and marketing. Tour. Manag. 2023, 97, 104724. [Google Scholar] [CrossRef]
  55. Wang, J.; Lu, L.; Wang, Z.; Wei, M.; Song, R.; Yang, Y.; Bai, K.; Lin, M.; Yu, H.; Zhu, H. New quality productive forces enable high-quality development of tourism: Theoretical connotation and scientific problems. J. Nat. Resour. 2024, 39, 1643–1663. [Google Scholar]
  56. Tang, Y.; Yi, K.; He, Z. How policy promotes the integration of culture and tourism? A fuzzy-set qualitative comparative analysis based on the Policy Instrument Theory. PLoS ONE 2024, 19, e0301119. [Google Scholar] [CrossRef]
  57. Zou, T. Towards the market-driven integration of culture and tourism. Frontier 2021, 107, 115. [Google Scholar]
  58. Chen, Y.; Li, Y.; Gu, X.; Chen, N.; Yuan, Q.; Yan, M. Evaluation of tourism development potential on provinces along the Belt and Road in China: Generation of a comprehensive index system. Land 2021, 10, 905. [Google Scholar] [CrossRef]
  59. Ragin, C.C. The Comparative Method: Moving Beyond Qualitative and Quantitative Strategies; University of California Press: Berkeley, CA, USA, 1987. [Google Scholar]
  60. Ragin, C.C. Redesigning Social Inquiry: Fuzzy Sets and Beyond; University of Chicago Press: Chicago, IL, USA, 2008. [Google Scholar]
  61. Pappas, I.O.; Woodside, A.G. Fuzzy-set Qualitative Comparative Analysis (fsQCA): Guidelines for research practice in information systems and marketing. Int. J. Inf. Manag. 2021, 58, 102310. [Google Scholar] [CrossRef]
  62. Chen, B.; Pang, Y. Space production and scene manifestation of the Yellow River National Cultural Park. Wuhan Univ. J. Philos. Soc. Sci. 2022, 75, 66–80. [Google Scholar]
  63. Li, Y.; Zou, Y.; Yang, Y.; Wu, P. Vitality evaluation of nighttime cultural tourism consumer areas and their influencing factors: Yangtze River Delta urban agglomeration. Hum. Geogr. 2023, 38, 182–191. [Google Scholar]
  64. Rasoolimanesh, S.M.; Seyfi, S.; Rather, R.A.; Hall, C.M. Investigating the mediating role of visitor satisfaction in the relationship between memorable tourism experiences and behavioral intentions in heritage tourism context. Tour. Rev. 2022, 77, 687–709. [Google Scholar] [CrossRef]
  65. Rao, X.; Qiu, H.; Morrison, A.M.; Wei, W.; Zhang, X. Predicting private and public pro-environmental behaviors in rural tourism contexts using SEM and fsQCA: The role of destination image and relationship quality. Land 2022, 11, 448. [Google Scholar] [CrossRef]
  66. Yu, H.; Liu, P. Shanxi folk culture tourism value in Jin-Shan Area along Yellow River Canyon. Econ. Geogr. 2016, 36, 179–184. [Google Scholar]
  67. Wu, S.; Wang, L.; Liu, H. Study on the structural characteristics of tourism flow network in the Yellow River Basin. Econ. Geogr. 2020, 40, 202–212. [Google Scholar]
  68. Yin, Y. Optimization of the dynamic mechanism and path of regional cooperation in cultural tourism in the Yellow River Basin. Adm. Reform 2022, 12, 39–46. [Google Scholar]
  69. Ruan, W.; Li, Y.; Zhang, S.; Liu, C. Evaluation and drive mechanism of tourism ecological security based on the DPSIR-DEA model. Tour. Manag. 2019, 75, 609–625. [Google Scholar] [CrossRef]
  70. Wang, J.; Yan, Y.; Hu, S. Spatial pattern and determinants of Chinese urban innovative capabilities base on spatial panel data model. Sci. Geogr. Sin. 2017, 37, 11–18. [Google Scholar]
  71. Du, Y.; Liu, Q.; Kim, P.H.; Li, J. Riding the waves of change: Using qualitative comparative analysis to analyze complex growth patterns in entrepreneurship. Entrep. Theory Pract. 2024, 49, 312–353. [Google Scholar] [CrossRef]
  72. Yang, Y.; Wong, K.K. A spatial econometric approach to model spillover effects in tourism flows. J. Travel Res. 2012, 51, 768–778. [Google Scholar] [CrossRef]
  73. Richards, G. Cultural tourism: A review of recent research and trends. J. Hosp. Tour. Manag. 2018, 36, 12–21. [Google Scholar] [CrossRef]
  74. Timothy, D.J. Cultural Heritage and Tourism: An Introduction; Channel View Publications: Bristol, UK, 2011. [Google Scholar]
  75. Su, X.; Li, X.; Kang, Y. A bibliometric analysis of research on intangible cultural heritage using CiteSpace. SAGE Open 2019, 9, 2158244019840119. [Google Scholar] [CrossRef]
  76. Balmford, A.; Green, J.M.; Anderson, M.; Beresford, J.; Huang, C.; Naidoo, R.; Walpole, M.; Manica, A. Walk on the wild side: Estimating the global magnitude of visits to protected areas. PLoS Biol. 2015, 13, e1002074. [Google Scholar] [CrossRef]
  77. Cellini, R.; Cuccia, T. Museum and monument attendance and tourism flow: A time series analysis approach. Appl. Econ. 2013, 45, 3473–3482. [Google Scholar] [CrossRef]
  78. Botti, L.; Peypoch, N.; Solonandrasana, B. Time and tourism attraction. Tour. Manag. 2008, 29, 594–596. [Google Scholar] [CrossRef]
  79. Khadaroo, J.; Seetanah, B. The role of transport infrastructure in international tourism development: A gravity model approach. Tour. Manag. 2008, 29, 831–840. [Google Scholar] [CrossRef]
  80. Song, H.; Dwyer, L.; Li, G.; Cao, Z. Tourism economics research: A review and assessment. Ann. Tour. Res. 2012, 39, 1653–1682. [Google Scholar] [CrossRef]
  81. Croes, R. The role of tourism in poverty reduction: An empirical assessment. Tour. Econ. 2014, 20, 207–226. [Google Scholar] [CrossRef]
  82. Gössling, S.; Peeters, P.; Hall, C.M.; Ceron, J.P.; Dubois, G.; Lehmann, L.V.; Scott, D. Tourism and water use: Supply, demand, and security. An international review. Tour. Manag. 2012, 33, 1–15. [Google Scholar] [CrossRef]
  83. Arthur, W.B. Competing technologies, increasing returns, and lock-in by historical events. Econ. J. 1989, 99, 116–131. [Google Scholar] [CrossRef]
  84. Myrdal, G.; Sitohang, P. Economic Theory and Under-Developed Regions; Gerald Duckworth & Co.: London, UK, 1957. [Google Scholar]
  85. Yue, J.; Dai, X. Coupling mechanism and coordination effect between regional cultural heritage and tourism development: An empirical study of Beijing-Tianjin-Hebei. Econ. Geogr. 2024, 44, 230–240. [Google Scholar]
  86. Zhang, G.; Dong, Y.; Liu, E. Configuration path analysis of tourism resources collaborative development on common prosperity in the New Era. J. Nat. Resour. 2024, 39, 259–273. [Google Scholar] [CrossRef]
  87. Getz, D.; Page, S.J. Progress and prospects for event tourism research. Tour. Manag. 2016, 52, 593–631. [Google Scholar] [CrossRef]
  88. McIntosh, A.J.; Prentice, R.C. Affirming authenticity: Consuming cultural heritage. Ann. Tour. Res. 1999, 26, 589–612. [Google Scholar] [CrossRef]
  89. Bowen, H.E. Cultural tourism: The partnership between tourism and cultural heritage management. J. Park Recreat. Adm. 2003, 21, 193–205. [Google Scholar] [CrossRef]
  90. Fiss, P.C. Building better causal theories: A fuzzy set approach to typologies in organization research. Acad. Manag. J. 2011, 54, 393–420. [Google Scholar] [CrossRef]
  91. Gössling, S.; Schweiggart, N. Two years of COVID-19 and tourism: What we learned, and what we should have learned. J. Sustain. Tour. 2022, 30, 915–931. [Google Scholar] [CrossRef]
  92. Sharpley, R. Tourism, sustainable development and the theoretical divide: 20 years on. J. Sustain. Tour. 2020, 28, 1932–1946. [Google Scholar] [CrossRef]
  93. Sarangan, B.; Rathnasiri Hewege, C.; Perera, C.R. Is digital empowerment of tourists a “threat” or “treat” for the tourism industry? The changing role of tourists and its effect on tourism regulators and businesses in developing countries. Asia Pac. J. Tour. Res. 2025, 30, 1577–1609. [Google Scholar] [CrossRef]
  94. Schneider, C.Q.; Wagemann, C. Set-Theoretic Methods for the Social Sciences: A Guide to Qualitative Comparative Analysis; Cambridge University Press: Cambridge, UK, 2012. [Google Scholar]
  95. Du, Y.; Jia, L. The configuration perspective and qualitative comparative analysis (QCA): A new approach to management research. J. Manag. World 2017, 33, 155–167. [Google Scholar]
Figure 1. Analytical framework.
Land 15 00938 g001
Figure 2. Spatial scope of the study area.
Land 15 00938 g002
Figure 3. Methodological Framework.
Land 15 00938 g003
Figure 4. Spatiotemporal differences in CTD.
Land 15 00938 g004aLand 15 00938 g004b
Figure 5. Results of the trend surface analysis of CTD in the Yellow River Basin, China.
Land 15 00938 g005
Figure 6. Model for analysing the group effect of cultural tourism development.
Land 15 00938 g006
Table 1. Summary of existing research limitations and identified research gaps.
DimensionPredominant Approaches in the Existing LiteratureLimitations (Research Gaps)
Analytical FocusFocus on isolated factors; emphasis on linear economic impact.Failure to capture complex, non-linear interactions; lack of symbiotic perspectives.
Methodological ChoicePrimarily econometric models (regression, correlation).Inability to account for causal asymmetry and equifinality (multiple paths to the same outcome).
Theoretical DepthNarrow focus on economic output or single-industry integration.Insufficient integration of sustainable development and inclusive growth theories.
SynthesisFragmented findings; lack of holistic path identification.Need for a configurational approach to explain the complexity of CTD.
Table 2. Cultural tourism development indicators and weights.
Rule LayersSub-Rule LayersFactor LayersUnitsWeightReference
Resource endowmentIntegrated resourcesNumber of 5A tourist attractionsUnit0.0741[72]
Number of 4A tourist attractionsUnit0.0494
Number of 3A tourist attractionsUnit0.0346
Human resourcesNumber of World Heritage SitesUnit0.0931[73]
Number of national historical and cultural cities, towns and villagesUnit0.0434
Number of national key cultural relics protection unitsUnit0.0212[74]
Number of national intangible cultural heritageUnit0.0188[75]
Natural resourcesNumber of State-level nature reservesUnit0.0244[76]
Number of national forest parksUnit0.0276
Number of National Geological ParksUnit0.047
Number of national urban wetland parksUnit0.0277
Support conditionCultural resource facilitiesNumber of museumsUnit0.047[77]
Number of librariesUnit0.0277
Public library collections per 100 inhabitantsvolumes, items0.0238
Number of theatres and cinemasUnit0.0056
Tourism reception capacityNumber of star-rated hotelsUnit0.0514[78]
Transport infrastructureCivil air passenger trafficPerson0.0384[79]
Road passenger traffic10,000 person0.0162
Railway passenger traffic10,000 person0.1108
Development benefitsEconomic benefitTotal tourist arrivalsTimes/10,000 person0.049[80]
Gross tourism receipts as a share of GDP%0.0748
Social benefitNumber of persons employed in culture, sports and recreation10,000 person0.0526[81]
Number of persons employed in the accommodation and catering sector10,000 person0.0193
Environmental benefitGreen coverage%0.0221[82]
Table 3. Fuzzy-set calibration points.
Conditions and OutcomeFully OutCross-OverFully In
Cultural tourism development0.0680.0730.074
Economic development1577.3922903.0376540.287
Government support0.7804.84413.650
Social investment4.80526.668105.783
Consumption capacity381.7570.5963.9
Technological innovation42.490416.0363505.736
Table 4. Consistency and coverage of individual factors.
PreconditionsHigh LevelLow Level
ConsistencyCoverageConsistencyCoverage
Economic development0.7060.6020.6080.670
~Economic development0.5360.6960.6600.542
Government support0.7080.6110.6220.668
~Government support0.5380.6910.6500.549
Social investment0.7250.5890.6040.685
~Social investment0.5130.7020.6600.529
Consumption capacity0.7130.6380.5530.593
~Consumption capacity0.5460.6930.7330.635
Technological innovation0.7940.6130.6390.738
~Technological innovation0.4810.7090.6640.536
Notes: ‘~’ denotes ‘not’; consistency denotes sharing a given set of antecedent conditions [64].
Table 5. The results of multiple path configuration.
High LevelLow Level
H1H2H3NH1NH2NH3
Economic development
Government support
Social investment
Consumption capacity
Technological innovation
Consistency0.7860.8490.8440.7960.8430.808
Raw coverage0.6400.6670.6790.5180.3640.477
Unique coverage0.0780.0540.0410.2630.0260.041
Solution consistency0.8650.806
Solution coverage0.7970.546
Notes: Black circles (●) signify the existence of a condition, whereas crossed-out circles ( ) denote its non-existence. The large circles are representative of core conditions, and the small circles pertain to peripheral conditions. Vacant areas imply that the presence or absence of conditions holds no substantial significance.
Table 6. The results of multiple path configuration grouping analysis in the upper, middle, and lower reaches.
High LevelLow Level
UpstreamMiddleDownstreamUpstreamMiddleDownstream
U1M1M2L1L2L3L4NU1aNU1bUM1aUM1bUL1UL2
Economic development
Government support
Social investment
Consumption capacity
Technological innovation
Consistency0.9130.9690.8650.9450.8580.8590.6880.9460.9500.9530.8450.8880.705
Raw coverage0.5310.3320.3330.2780.3120.3320.4140.4820.3180.1720.4210.2370.404
Unique coverage0.5310.2050.1360.0430.0070.1060.1950.2010.0370.0450.2250.0580.185
Solution consistency0.5310.9640.8020.9500.8490.873
Solution coverage0.9130.5770.5360.5190.5580.599
Notes: Black circles (●) signify the existence of a condition, whereas crossed-out circles ( ) denote its non-existence. The large circles are representative of core conditions, and the small circles pertain to peripheral conditions. Vacant areas imply that the presence or absence of conditions holds no substantial significance.
Table 7. The results of multiple path configuration for historic and cultural cities.
High LevelLow Level
H1H2NH1aNH1bNH2
Economic development
Government support
Social investment
Consumption capacity
Technological innovation
Consistency0.8910.8200.9380.9570.980
Raw coverage0.2680.2250.3760.2500.166
Unique coverage0.1030.0600.1770.0380.017
Solution consistency0.8440.931
Solution coverage0.6280.543
Notes: Black circles (●) signify the existence of a condition, whereas crossed-out circles ( ) denote its non-existence. The large circles are representative of core conditions, and the small circles pertain to peripheral conditions. Vacant areas imply that the presence or absence of conditions holds no substantial significance.
Disclaimer/Publisher’s Note: The statements, opinions and data contained in all publications are solely those of the individual author(s) and contributor(s) and not of MDPI and/or the editor(s). MDPI and/or the editor(s) disclaim responsibility for any injury to people or property resulting from any ideas, methods, instructions or products referred to in the content.