Article

Coupling Coordination Mechanisms and Spatial Differentiation Between Urban Expansion and Ecosystem Services in Valley-Type Cities of Semi-Arid Regions

1
School of Architecture and Urban Planning, Lanzhou Jiaotong University, Lanzhou 730070, China
2
School of Civil Engineering, Lanzhou Jiaotong University, Lanzhou 730070, China
*
Authors to whom correspondence should be addressed.
Land 2026, 15(5), 853; https://doi.org/10.3390/land15050853 (registering DOI)
Submission received: 25 March 2026 / Revised: 9 May 2026 / Accepted: 13 May 2026 / Published: 15 May 2026

Abstract

As a strategic node of the Silk Road Economic Belt and a prototypical valley-type city, Lanzhou is subject to the dual constraints of rapid urbanization and an inherently fragile ecological foundation, making the coordination between urban expansion and ecosystem services a critical issue for regional sustainability. Drawing upon multi-temporal land use remote sensing datasets provided by the Chinese Academy of Sciences Resource and Environment Science Data Center, in conjunction with soil, meteorological, and socio-economic data, this study integrates a land use transition matrix, the InVEST model, a modified coupling coordination degree model, and the geographic detector to comprehensively examine land use dynamics, the spatiotemporal evolution of urban expansion, and the spatial heterogeneity of ecosystem services (i.e., carbon storage, water yield, habitat quality, and soil conservation) in Lanzhou. In addition, the coupling coordination relationship and its underlying driving mechanisms are systematically explored. The results demonstrate the following: (1) Between 1980 and 2020, urban land area in Lanzhou increased from 103.87 km2 to 286.83 km2, accounting for 2.17% of the total area, with cropland constituting the dominant source of expansion and exhibiting a fluctuating “high–low–high” conversion trajectory. (2) Ecosystem services exhibit pronounced spatial heterogeneity, with carbon storage and habitat quality displaying a pattern of “low in the southeast and high in the northwest”, water yield showing an increasing gradient from southeast to northwest, and soil conservation characterized by “lower values in central areas and higher values in peripheral regions”; (3) Urban expansion has accelerated significantly, with Yongdeng County and Gaolan County emerging as principal expansion hotspots during 2010–2020. (4) The dominant driving mechanism gradually shifted from natural factors to the synergistic interaction between natural and socioeconomic factors, and the interaction among driving factors markedly enhanced the explanatory power for ecosystem service evolution. (5) The coupling coordination degree has transitioned from widespread imbalance to a spatially differentiated pattern, characterized by relatively coordinated conditions in peripheral areas and persistent imbalance within the central urban core. These findings provide a robust scientific basis for territorial spatial optimization and the synergistic development of ecological and economic systems in valley-type cities, and offer important implications for sustainable development in arid and semi-arid regions.

1. Introduction

Urbanization represents a fundamental process shaping global socio-economic transformation. According to United Nations projections, the global urbanization rate is expected to reach 68% by 2050 [1]. As a dominant driver of land system change, urban land is projected to expand by approximately 1.2 times between 2000 and 2030, reaching nearly 1.2 million km2 [2]. While rapid urbanization promotes economic growth and population concentration, it simultaneously reshapes regional ecological processes and functions through Land Use/Cover Change (LUCC), thereby intensifying conflicts between urban development and ecological conservation. Existing evidence suggests that urbanization-induced vegetation carbon loss accounts for around 5% of global net primary productivity (NPP) annually [3]. This challenge is particularly acute in arid and semi-arid regions, which comprise approximately 41% of the global land surface [4], where ecosystems exhibit heightened sensitivity to climate variability and anthropogenic disturbances [5]. In such contexts, accelerated urban expansion further exacerbates water scarcity, land degradation, and ecological vulnerability [6]. Consequently, clarifying the relationship between urban expansion and ecosystem services is of considerable importance for advancing regional sustainability.
The interplay between urban expansion and ecosystem services (ES) has long been a central concern in human–environment research [7,8]. Advances in multi-source remote sensing, spatial analysis, and ecological modeling have facilitated extensive investigations into LUCC and its ecological implications, with a gradual shift from single-process assessments towards integrated coupling frameworks [9,10,11]. Urban expansion, as a key manifestation of LUCC, substantially reconfigures land-use patterns, landscape structure, and spatial organization [12,13,14]. Concurrently, ecosystem service assessments—based on approaches such as the equivalent factor method [15] and models including InVEST [16,17]—have enabled systematic quantification of the spatial distribution and temporal dynamics of services such as carbon storage, water yield, habitat quality, and soil retention [18,19,20]. More recently, research has increasingly adopted integrative perspectives to examine the co-evolution of ecosystem services and their underlying drivers within LUCC contexts. For example, Zhang et al. revealed the coupling and coordination relationships among urbanization, LUCC, and ecosystem services [21]; Liu et al. analyzed the synergetic characteristics between ecosystem service multifunctionality and land-use change [22]; and Pan et al. explored the coupling coordination dynamics between land-use intensity and ecosystem services as well as their driving factors [23]. Collectively, these studies provide a solid empirical and theoretical basis for understanding ecosystem service responses and human—environment coupling under urbanization.
Further studies have shown that the impacts of urban land expansion on ecosystem services are characterized by significant spatiotemporal heterogeneity and are jointly influenced by geomorphological conditions, policy orientation, and socioeconomic processes [24,25,26,27]. Existing research has widely confirmed that topographic conditions play a crucial role in shaping the spatial patterns of ecosystem services by influencing construction land distribution, land-use conversion, and the intensity of human activities [21,22,23]. However, most previous studies have primarily focused on plain cities, urban agglomerations, or watershed-scale regions, whereas relatively limited attention has been paid to the relationship between urban expansion and ecosystem services under complex geomorphological conditions. In valley-type cities, constrained by the distinctive terrain pattern of “mountains flanking a central valley”, urban construction land tends to expand along river valleys and transportation corridors in a linear manner. Such spatial expansion patterns are likely to intensify competition between built-up land and ecological spaces, including cropland and grassland, within localized areas. This unique spatial structure may further enhance the spatial differentiation of ecosystem services and lead to significant regional disparities in ecological responses to urban expansion. Nevertheless, studies focusing on the coupling coordination relationship between urban expansion and ecosystem services in valley-type cities remain relatively limited, and the understanding of their spatiotemporal evolution characteristics and driving mechanisms still requires further investigation.
Valley cities offer a distinctive analytical context for examining these issues under pronounced topographic constraints. Typically constrained by surrounding mountains and river corridors, such cities exhibit spatial configurations characterized by “mountain–river–city” adjacency, with urban development distributed in linear or clustered forms along valley axes [28]. Compared with cities in flat terrains, the uniqueness of valley cities lies not only in their morphology but also in the way geographical constraints reshape the pathways linking urban expansion and ecosystem services. Limited availability of flat, low-elevation land tends to concentrate new development along river corridors, transport axes, and waterfront areas, thereby intensifying competition among construction land, agricultural land, and ecological space. Meanwhile, steep slopes, fragmented landscapes, susceptibility to soil erosion, and water resource constraints amplify the ecological impacts of land-use transitions, particularly on services such as carbon storage, water yield, habitat quality, and soil conservation. These processes result in stronger spatial heterogeneity and pronounced boundary effects. Thus, valley cities provide a critical lens for understanding the mechanism of “topographic constraint–expansion pathway–ecological response [29,30,31].” From this perspective, examining the coupling and coordination between urban expansion and ecosystem services in valley cities is essential for advancing knowledge of human–environment interactions in complex terrains and for informing spatial planning and land management.
Based on the above context, this study proposes the following hypotheses. First, as a typical valley-type city, Lanzhou is jointly constrained by topographic conditions and policy orientation during the process of urban expansion, resulting in distinct stage-dependent characteristics in the coupling coordination relationship between urban expansion and ecosystem services. Second, the spatiotemporal evolution of ecosystem services is jointly shaped by natural background conditions and anthropogenic activities, while the contributions of interactions among different driving factors to the spatial differentiation of ecosystem services dynamically vary with the progression of urbanization. To verify these hypotheses, five representative years—1980, 1990, 2000, 2010, and 2020—were selected as observation periods, and a long-term time-series dataset covering 1980–2020 was constructed at 10-year intervals. By integrating multi-source datasets and improved analytical approaches, this study aims to: (1) reveal the spatiotemporal evolution characteristics and driving mechanisms of urban expansion in Lanzhou over the past four decades; (2) analyze the spatiotemporal differentiation patterns of four major ecosystem services, namely carbon storage, water yield, habitat quality, and soil conservation; (3) evaluate the coupling coordination evolution and regional differences between urban expansion and ecosystem services; and (4) identify the dominant driving factors and their interaction effects underlying the spatial differentiation of ecosystem services. The findings of this study can provide scientific support for territorial spatial optimization and ecological protection and high-quality development in the Yellow River Basin and offer valuable references for the sustainable development of similar valley-type cities.

2. Study Area and Data Sources

2.1. Overview of the Study Area

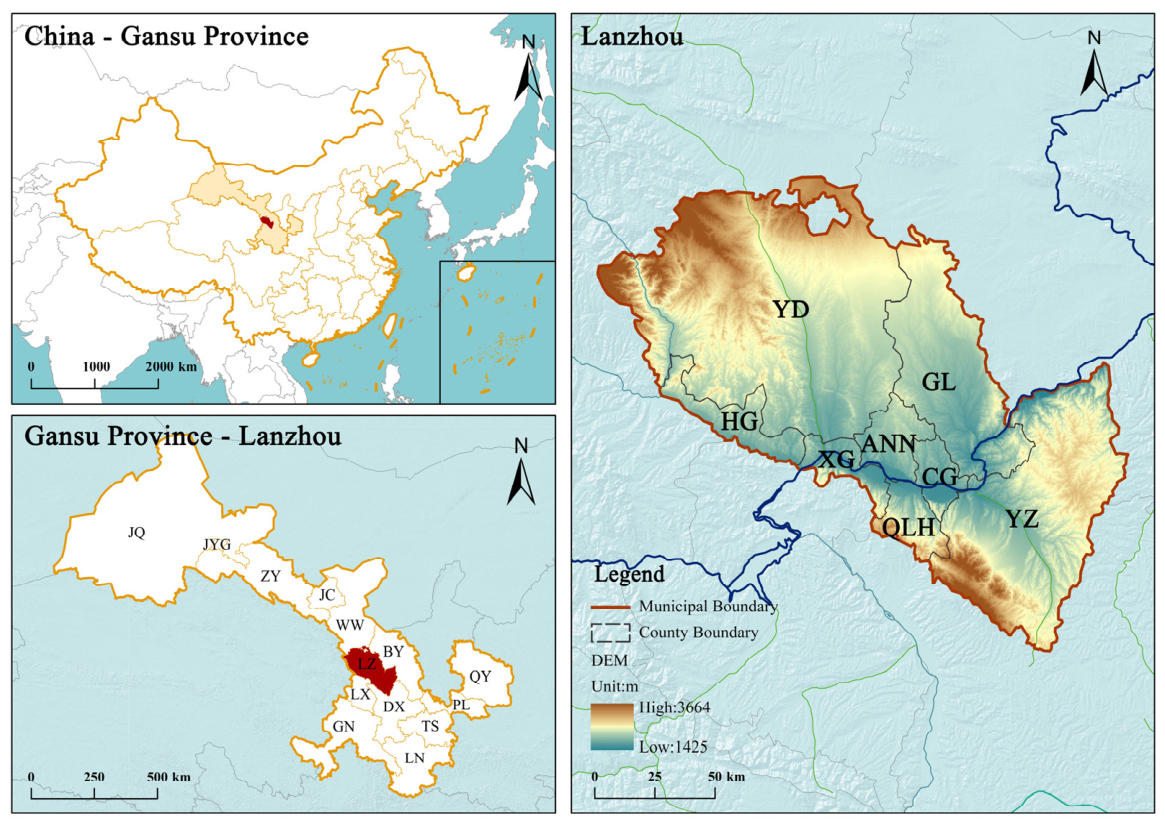
Lanzhou (35°34′–37°07′ N, 102°35′–104°34′ E) is located in central Gansu Province and is recognized as an important central city in the upper reaches of the Yellow River, as well as a major transportation hub in northwestern China [32,33,34] (Figure 1). The administrative area comprises Chengguan District, Qilihe District, Xigu District, Anning District, Honggu District, and the counties of Yongdeng, Yuzhong, and Gaolan, covering a total area of approximately 13,100 km2 [35]. Geomorphologically, Lanzhou is dominated by loess hills, mountainous terrain, and valley basins. The Yellow River traverses the city from west to east, forming a typical valley-type urban spatial structure. Restricted by topographic conditions, urban construction land has mainly expanded along the Yellow River valley and its tributary valleys, exhibiting a pronounced linear expansion pattern.
The study area is characterized by a temperate semi-arid climate, with relatively low annual precipitation, uneven intra-annual precipitation distribution, and strong evaporation intensity. Under these environmental conditions, the regional ecosystem is highly sensitive to land-use change and anthropogenic disturbances. In recent decades, driven by regional transportation improvement, industrial development, and rapid urbanization, urban construction land in Lanzhou has expanded continuously. By the end of 2024, the permanent resident population reached 4.4365 million, while the regional gross domestic product (GDP) amounted to 374.23 billion yuan [36]. Within the limited valley space, substantial spatial competition exists among urban construction land, agricultural production land, and ecological conservation land [37]. As a result, land-use change may significantly affect ecosystem services, including carbon storage, water yield, habitat quality, and soil conservation. Therefore, Lanzhou provides a representative case for exploring the relationship between urban expansion and ecosystem services in semi-arid valley-type cities.

2.2. Data Sources

The data used in this study can be categorized into three types based on their specific applications (Table 1). The first category consists of land use remote sensing monitoring data, which were generated through the manual interpretation of Landsat imagery. These data were obtained from the Resource and Environmental Science and Data Center (RESDC) of the Chinese Academy of Sciences (http://www.resdc.cn; accessed on 20 June 2025). With a spatial resolution of 30 m, this dataset is suitable for analyzing regional land use changes. The second category comprises data required for the quantification of ecosystem services, primarily including soil and meteorological data. The soil data were sourced from the World Soil Database (https://www.fao.org/soils-portal/data-hub/soil-maps-and-databases/harmonized-world-soil-database-v12/en/; accessed on 20 June 2025) with a spatial resolution of 1 km. This dataset covers soil physicochemical properties—such as sand, silt, and clay fractions, as well as organic carbon content—which are critical for quantifying carbon storage, habitat quality, and soil conservation services. The meteorological data, mainly comprising annual precipitation and potential evapotranspiration, were acquired from the RESDC (http://www.resdc.cn/; accessed on 20 June 2025). The third category includes data on the driving factors underlying the spatial evolution of ecosystem services. These encompass natural factors (e.g., elevation, slope, precipitation, temperature, and NDVI) and socioeconomic factors (e.g., population density, night-time light, and GDP). These data were utilized to reveal the mechanisms by which natural conditions and human activities influence changes in ecosystem service patterns.

3. Research Methods

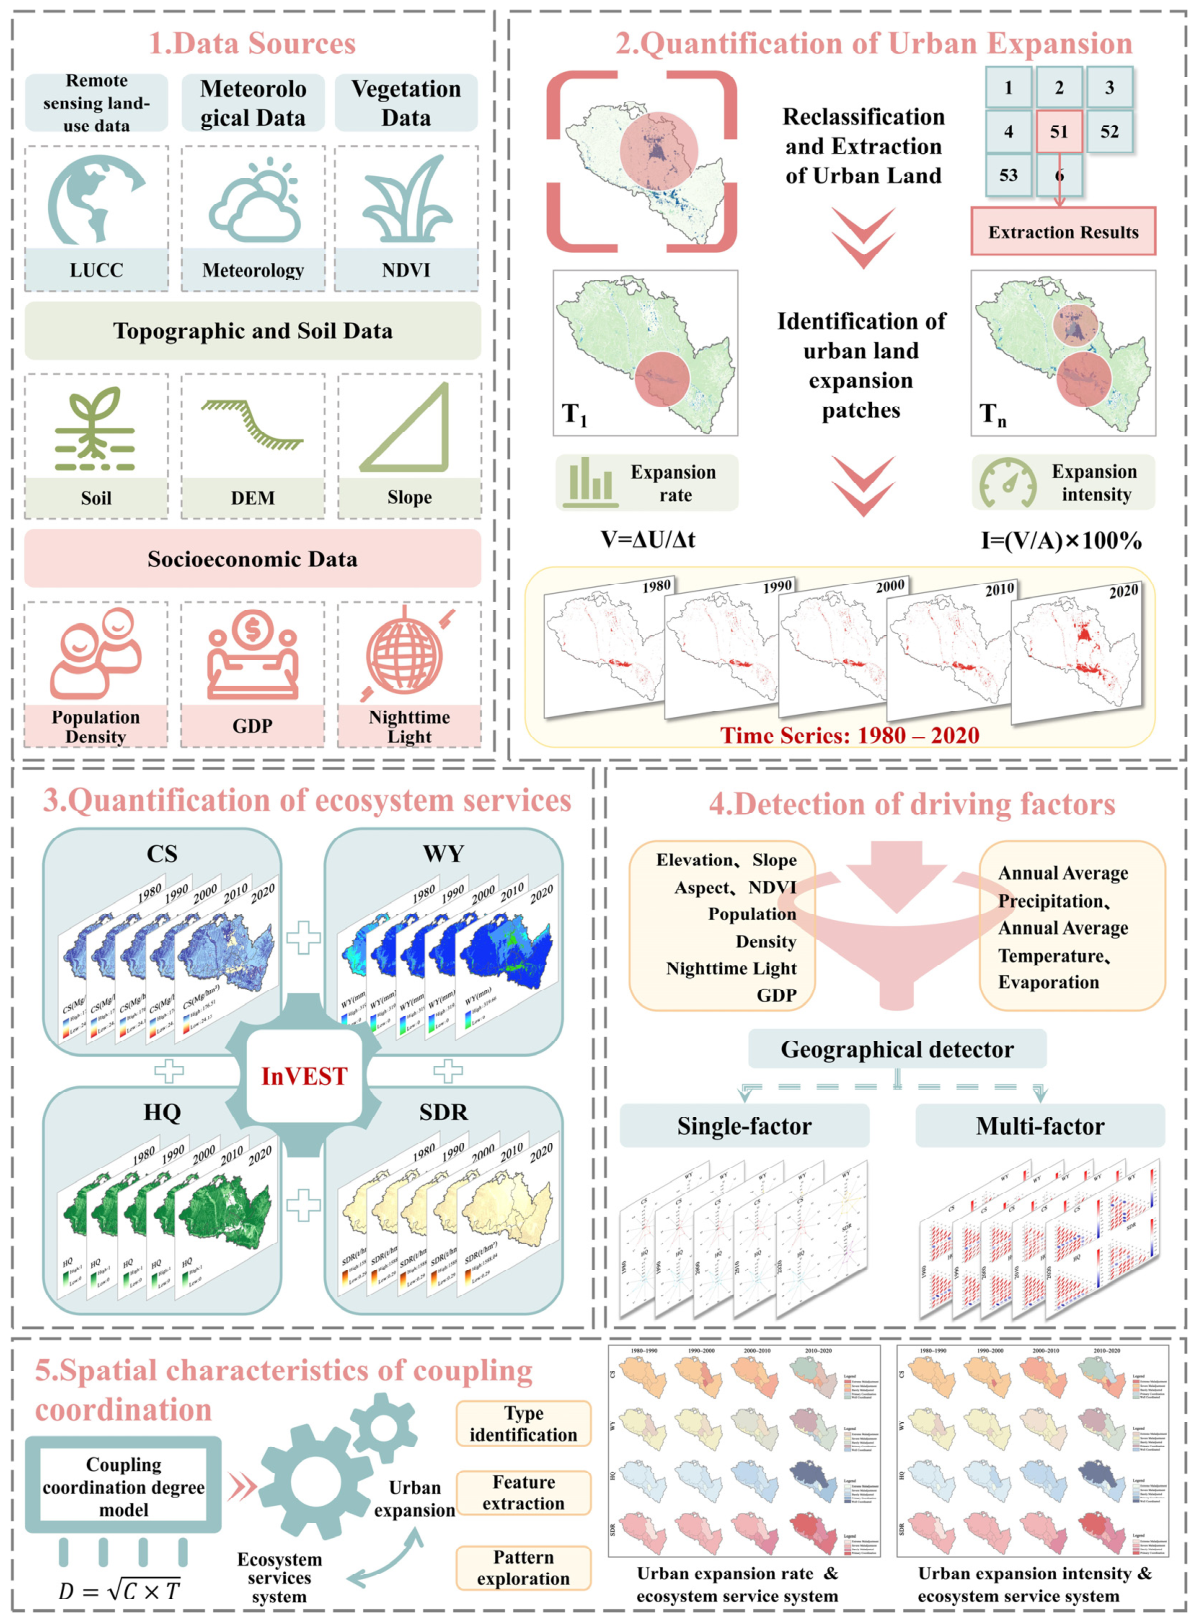
Based on the core logic of “land use change–urban expansion–ecosystem services–coupling coordination–driving mechanisms,” this study constructs a progressive technical framework. Specifically, the land use transfer matrix is utilized to identify the sources and destinations of urban expansion, while the spatiotemporal differences in expansion are quantified in terms of speed and intensity. The InVEST model is employed to assess the spatiotemporal variations in four major ecosystem services. Subsequently, a modified coupling coordination degree model is adopted to measure the synergy level between urban expansion and ecosystem services. Finally, the Geodetector (Geographical Detector) is applied to analyze driving factors and interaction mechanisms. This comprehensive approach fully supports the realization of the research objectives (Figure 2).

3.1. Land Use Transfer Matrix

The land use transfer matrix intuitively reveals the mutual conversion relationships among different land use types within a specific region over various periods. By providing information on the sources, destinations, and transferred areas of various land categories, it comprehensively reflects the characteristics of structural changes in regional land use and the direction of type evolution [38,39]. In this study, the transfer matrix was employed to analyze the land use dynamics of Lanzhou from 1980 to 2020. Using a 10-year time interval, the study statistically analyzed the transfer structure and spatial direction among land types for each period. Furthermore, the annual transfer rates between different types were calculated to quantitatively characterize the process of land use change. The mathematical form of the transfer matrix is expressed as [40]:
S ij = S 11 S 1 n S n 1 S nn
where S represents the area; n denotes the number of land use types; and S i j indicates the area transferred from land use type i at the beginning of the study period to land use type j at the end of the period.

3.2. Quantifying Urban Expansion

3.2.1. Urban Expansion Speed

The urban expansion speed index serves to quantify the rate of urban spatial growth over a specific study period. This index is derived by calculating the ratio of the newly added construction land area to the total initial construction land area [41]. Its formula is [42]:
U E G = U i + T U i T
where: U i + T represents the construction land area (km2) of the study area in the year i + T ; U i represents the construction land area (km2) in the year i ; and T is the time interval in years.

3.2.2. Urban Expansion Intensity

Urban expansion intensity is defined as the ratio of newly added construction land area to the total land area, typically expressed as a percentage. The UEI index facilitates the comparison of the intensity and rate of urban construction land expansion across different time periods [43]. The specific formula is as follows [44]:
U E I = U S × T × 100
where: U E I represents the urban expansion intensity of Lanzhou from year i to year i + T ; S represents the total land area of the study region; ΔT is the time interval; and ΔU represents the net increase in construction land area between the starting and ending years.

3.3. Quantification of Ecosystem Services

3.3.1. Carbon Storage

Carbon storage refers to the capacity of an ecosystem to absorb and fix atmospheric carbon dioxide through photosynthesis and store it within biomass and soil. Based on the Carbon Storage module of the InVEST model, this study estimates the carbon storage of Lanzhou City by integrating land use types with carbon pool parameters. The total carbon storage comprises four components: aboveground biomass, belowground biomass, dead organic matter, and soil organic carbon [45]. The calculation formula is expressed as [46]:
C total   =   C above   +   C below   +   C dead   +   C soil
In Equation (2): C total   , C above , C below , C dead and C soil represent total carbon storage, aboveground carbon storage, belowground carbon storage, dead organic matter carbon storage, and soil organic carbon storage, respectively. The unit for all variables is t/hm2.
Given the complexity of regional vegetation types and the limitations of sample data, empirical models for carbon density were constructed using Mean Annual Precipitation ( MAP ) and Mean Annual Temperature ( MAT ). The formulas are as follows [47]:
C SP   =   3.3968   ×   MAP   +   3.39961
C BP = 6.798   ×   e 0.0054   ×   MAP
C BT = 28   ×   MAT + 398
where: C SP represents soil carbon density; C BP and C BT represent biomass carbon density derived from precipitation and temperature, respectively; the units for these densities are kg/m2. MAP denotes mean annual precipitation (mm), and MAT denotes mean annual temperature (°C).

3.3.2. Water Yield

Water yield refers to the capacity of an ecosystem to provide usable water resources to humans through processes such as precipitation interception, soil infiltration, and runoff. Based on the Water Yield module of the InVEST model, this study estimated the annual water yield for Lanzhou from 1980 to 2020 at the grid scale, utilizing the Budyko hydrothermal equilibrium principle and integrating land use type parameters [48]. The core formula is as follows [49]:
Y xj   =   1 AET xj P x   ×   P x
AET xj P x = 1 + ω x R x 1 + ω x R xj + 1 R xj
ω x = Z   ·   AW C x P x
R x = k xj   ·   E T o P x
AW C x = min MS D x ,   R D x   ×   PAW C x
where: Y xj is the annual water yield (m3) for grid cell x on landscape type j ; AET xj is the mean annual evapotranspiration for grid cell x on landscape type j ; P x is the mean annual precipitation for grid cell x ; ω x is a non-physical parameter characterizing the natural climate-soil properties (dimensionless); R xj is the dryness index for grid cell x on landscape type j (dimensionless); AW C x is the volumetric plant-available water content; k xj is the vegetation evapotranspiration coefficient; Z is the seasonality factor; E T o is the potential evapotranspiration (mm); MS D x is the maximum soil depth; R D x is the root depth.

3.3.3. Habitat Quality

Habitat quality refers to the capacity of an ecosystem to provide a suitable living environment for biodiversity, which is jointly influenced by land use patterns and disturbances from threat factors [50]. Based on the InVEST Habitat Quality model, this study utilized land use data from 1980 to 2020 along with threat factor parameters to quantitatively assess the spatiotemporal variations in habitat quality in Lanzhou. The calculation formula is as follows [51]:
Q xj   =   H j 1 D xj z D xj z   +   K z
where: Q xj represents the habitat quality of grid cell x in land use type j ; H j represents habitat suitability; D xj indicates the degree of habitat degradation; z is a normalization constant, set to 2.5; and K is the half-saturation constant, with a default value of 0.5.
The formula for habitat degradation ( D x j ) is:
D xj   =   r = 1 R y = 1 r y w r r = 1 R w r r y i rxy β x S jr
where: R represents the number of threat factors; r denotes a specific threat factor; Y r represents the total number of grid cells in the threat factor layer r ; w r is the weight of the threat factor; r y indicates the intensity of threat factor r in grid cell y , ranging from 0 to 1; i rxy represents the impact of threat factor r in grid cell y on the habitat in grid cell x ; β x denotes the accessibility level of grid cell x ; and S jr indicates the sensitivity of land use type j to threat factor r .
The impact distance function ( i rxy ) for linear decay is:
i rxy   =   1 d xy d r   max
where: d xy represents the linear distance between grid cells x and y ; and d r   max represents the maximum influence distance of threat factor r .

3.3.4. Soil Conservation Service

Soil conservation refers to the capacity of an ecosystem to reduce soil erosion and maintain soil quality and ecological functions through its intrinsic mechanisms, such as soil fixation by vegetation and soil aggregation [52]. Utilizing this module, and integrating data on land use, climate, soil, and topography of the study area, this study conducted a quantitative spatial analysis of soil conservation services to reveal the spatial distribution characteristics of soil conservation functions in Lanzhou. The formulas are as follows [53]:
SEDRET x   =   R x   ×   K x   ×   L S x   ×   1 C x   ×   P x   +   SED R x
SED R x = S E x y = 1 x - 1 USL E y z = y = 1 x - 1 1 S E z
USL E x =   R x   ×   K x   ×   LS x   ×   C x   ×   P x
where: SEDRET x and SED R x represent the total soil retention and sediment retention of grid cell x , respectively, with units of t/(hm2·a); USL E x and USL E y represent the actual erosion amount of grid cell x and its upslope grid cell y , respectively, with units of t/(hm2·a);   R x , K x , LS x , C x and P x are the rainfall erosivity factor, soil erodibility factor, topographic (slope length-gradient) factor, cover-management factor, and support practice factor for grid cell x , respectively; S E z represents the sediment retention efficiency of grid cell x .

3.4. Modified Coupling Coordination Degree Model

To evaluate the degree of interaction between urban land expansion and ecosystem services, this paper employs a modified coupling coordination degree model. This model quantitatively characterizes the synergy level from two dimensions: “coupling degree” and “coordination degree” [54]. The calculations are as follows [55]:
C = 1 i > j , j = 1 n ( U i U j ) 2 m = 1 n 1 m × ( i = 1 n U i max U i ) 1 n 1
T = i = 1 n a i × U i , i = 1 n a i = 1
D = C × T
where: C is the coupling degree; U i is the value of the i -th subsystem; n is the number of subsystems; T is the comprehensive evaluation index of the subsystems; a i is the weight of the i -th subsystem. Given that urban land expansion and ecosystem services are considered equally important in this study, a i is assigned a value of 0.5 for both. D represents the coupling coordination level. The value of D is classified into the following levels: 0 < D ≤ 0.2: Severe incoordination; 0.2 < D ≤ 0.4: Moderate incoordination; 0.4 < D ≤ 0.6: On the verge of incoordination; 0.6 < D ≤ 0.8: Primary coordination; 0.8 < D ≤ 1: Good coordination.

3.5. Geographical Detector

This study employed the factor detector and interaction detector within the Geographical Detector (Geodetector) model. The factor detector measures the explanatory power of independent variables regarding the spatial differentiation of dependent variables using the q-value. Meanwhile, the interaction detector identifies whether the combined action of any two driving factors enhances or weakens the explanatory power for the spatial distribution of ecosystem services. The formula for the q -value is [56]:
q   =   1 1 N σ 2 h = 1 L N h σ h 2
where: q represents the explanatory power of the factor, with a value range of [0, 1]; h denotes the stratification (or partition) of the factor, with a total of L strata; N is the total number of samples in the entire area; σ 2 is the discrete variance of the entire area; N h is the number of samples in stratum h; and σ h 2 is the discrete variance of stratum h.
Based on the geodetector package in the R programming environment, this study utilized the two aforementioned detectors to quantitatively analyze the influence mechanisms of natural environmental and socioeconomic factors on the spatiotemporal evolution of ecosystem services. Prior to the analysis, variance inflation factor (VIF) analysis was employed to test the multicollinearity among the ten driving factors, thereby ensuring the relative independence of the selected variables. Furthermore, considering that the geographic detector method can quantify only the explanatory power of driving factors but cannot explicitly reveal the direction of their effects, Pearson correlation analysis was introduced as a complementary method. The positive and negative correlation coefficients were subsequently used to identify the directional influences of individual driving factors on ecosystem services. Considering the complex characteristics of ecosystems and the impact of human activities within the context of urbanization, this study selected three categories of driving factors: Natural Environmental Factors: These include topographic factors (Elevation X1, Slope X2, Aspect X3) and climatic factors (Mean Annual Precipitation X4, Mean Annual Temperature X5, Evaporation X6). Topographic factors were used to quantify the impact of terrain on the distribution of ecosystem services, while climatic factors play a key role in determining the spatial patterns of regional ecosystem services [57]. Ecological Factors: The Normalized Difference Vegetation Index (NDVI, X7) was selected. It reflects trends in ecosystem service changes and serves as a critical indicator of ecosystem evolution [58]. Socioeconomic Factors: These include Population Density (X8), Night-time Light (X9), and GDP (X10). These factors were used to measure the direct or indirect impacts of socioeconomic activities on the evolution of ecosystem services during the urbanization process [59].

4. Results

4.1. Land Use Change

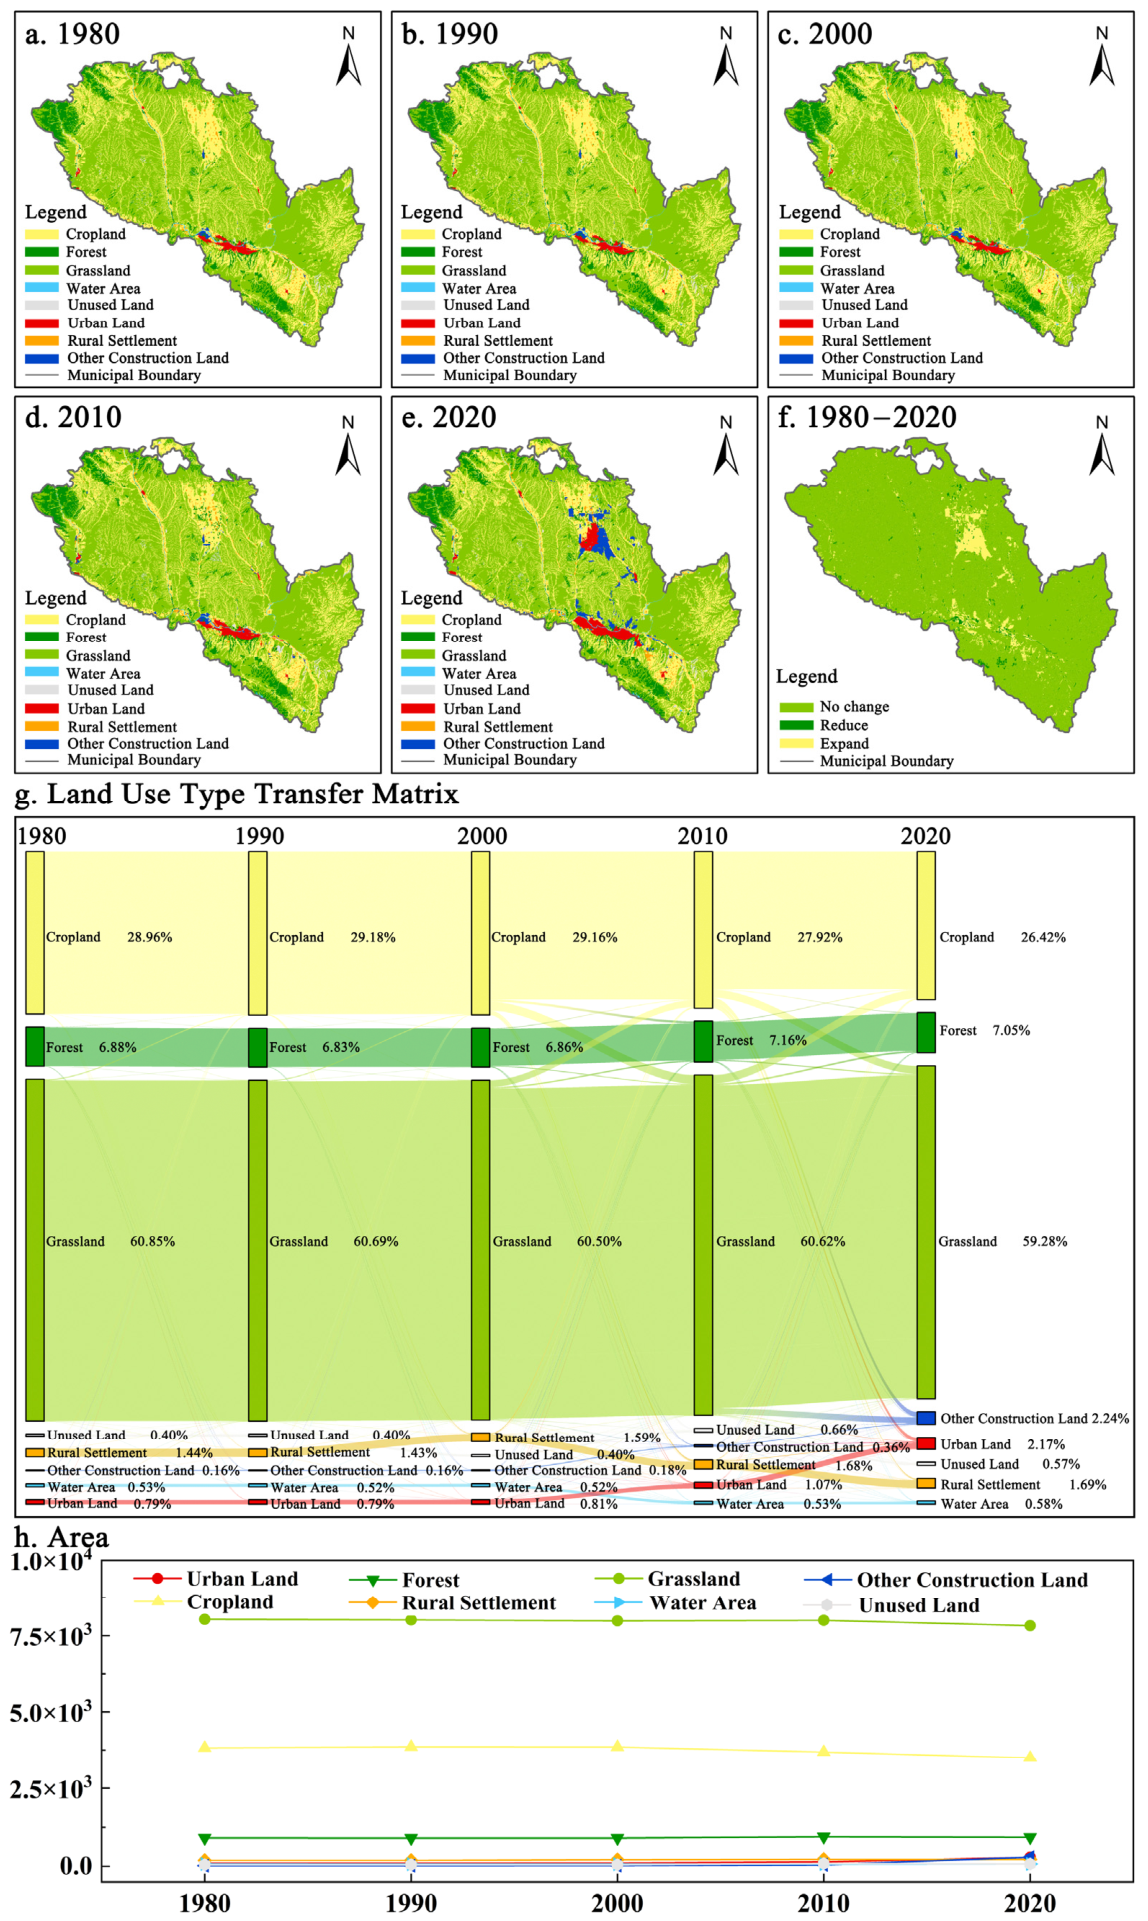
Between 1980 and 2020, grassland persistently dominated the land-use structure of Lanzhou, being widely distributed across the mountainous and hilly regions of Yongdeng, Gaolan, and Yuzhong counties, with an average share of 60.39% (Figure 3; Table A1). Cropland and woodland represented the next most prevalent land-use categories, primarily located in the valley plains and piedmont terraces along the Yellow River and its tributaries. In terms of grassland transitions, conversion intensity remained relatively low during 1980–2000, occurring mainly along valley margins and basin fringes, predominantly towards cropland. During 2000–2010, the conversion of grassland became more pronounced, with transitions to cropland and woodland extending into low-relief peri-urban hilly areas. From 2010 to 2020, grassland conversion intensified markedly, becoming highly concentrated in the northern Qinwangchuan Basin, where conversions to cropland and other construction land reached 197.41 km2 and 141.71 km2, respectively.
Over the four-decade period, urban land exhibited a sustained expansion trajectory. Between 1980 and 1990, the spatial structure of the traditional core districts within the river valley, including Chengguan and Qilihe, remained largely unchanged. Since 2000, urban land has expanded steadily, reaching 286.83 km2 by 2020 and accounting for 2.17% of the total area. During this phase, the spatial focus of urban growth shifted significantly from the central valley corridor towards the northern Lanzhou New Area, the eastern Yuzhong Basin, and the valley terraces of Honggu District, giving rise to a polycentric and multi-nodal expansion pattern.
With respect to land-use transitions, cropland served as the principal source of urban land expansion, with its conversion to built-up land displaying clear temporal fluctuations. During 1980–1990, the conversion proportion reached 22.42%, primarily concentrated in the valley plains surrounding the urban core. This proportion subsequently declined, before increasing again to 19.77% after 2010, with conversions mainly occurring along the margins of the Qinwangchuan area, the periphery of Gaolan County, and the Yuzhong New Town development zone. Meanwhile, both woodland and unused land exhibited a turning point around 2010, characterized by an initial increase followed by a subsequent decline. Woodland expanded steadily in earlier periods, particularly within the ecological barrier zones of the northern and southern mountains, but decreased after 2010 due to growing land demand driven by peripheral urban expansion. Changes in unused land were primarily concentrated in northern development areas and followed a similar pattern of initial expansion followed by contraction.

4.2. Spatiotemporal Evolution Characteristics of Urban Expansion and Ecosystem Services

4.2.1. Speed and Intensity of Urban Land Expansion

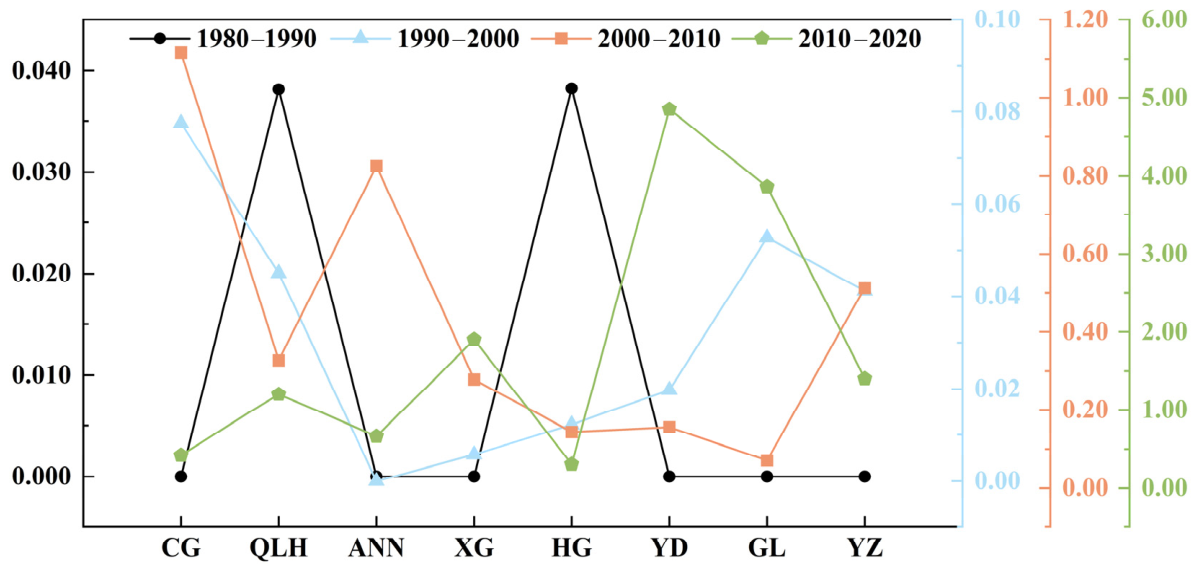
From 1980 to 2020, the rate of urban expansion in Lanzhou exhibited marked spatiotemporal heterogeneity, with an overall trend of acceleration over time. This trend was particularly evident during 2010–2020, when expansion activity in several districts and counties substantially exceeded that of earlier periods (Figure 4 and Table A3). During 1980–1990, urban expansion remained at a low and stable level. Within the urban core, only Qilihe and Honggu districts (both 0.04 km2/year) showed marginal growth, whereas Chengguan, Anning, and Xigu districts, together with the peripheral counties (Yongdeng, Gaolan, and Yuzhong), exhibited no measurable expansion, indicating a largely stable urban configuration.
Between 1990 and 2000, differentiation in expansion rates began to emerge within the urban core. Chengguan District recorded the highest growth rate (0.08 km2/year), followed by Qilihe, while Honggu and Xigu remained at relatively low levels. During this period, peripheral counties, particularly Gaolan and Yuzhong, also experienced modest increases in expansion rates.
During 2000–2010, urban expansion entered a phase of pronounced acceleration, with especially rapid growth observed in the urban core. Chengguan’s expansion rate increased sharply to 1.12 km2/year, while Anning (0.83 km2/year) and Xigu (0.28 km2/year) also exhibited substantial increases. Among peripheral areas, Yuzhong (0.51 km2/year) expanded relatively rapidly, and Yongdeng showed moderate growth.
In the period 2010–2020, the spatial focus of urban expansion shifted towards the northern peripheral regions. Yongdeng (4.85 km2/year) and Gaolan (3.86 km2/year) recorded the highest expansion rates across the study area. Within the urban core, Xigu and Qilihe maintained relatively high growth levels, whereas Chengguan and Honggu experienced a relative deceleration compared with the preceding decade.
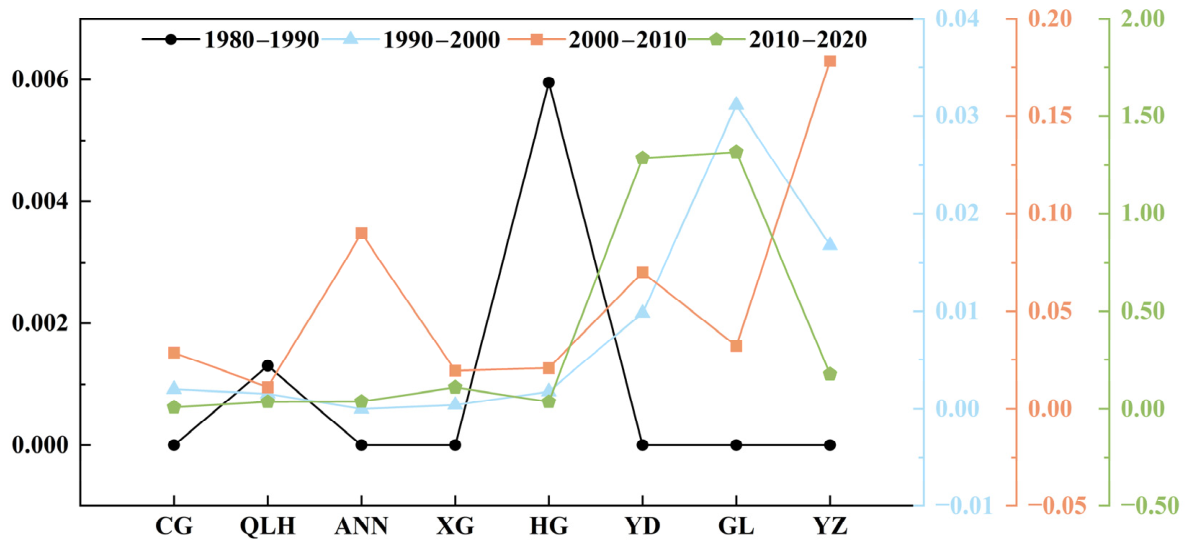
From 1980 to 2020, the intensity of urban expansion in Lanzhou exhibited a clear stage-wise differentiation, with an overall trend of fluctuating increase over time (Figure 5 and Table A4). During 1980–1990, expansion intensity remained at an extremely low level. Within the urban core, only Honggu District (0.01) and Qilihe District (0.13 × 10⁻²) showed marginal expansion, whereas Anning, Chengguan, and Xigu districts, as well as the peripheral counties (Yongdeng, Gaolan, and Yuzhong), recorded no detectable expansion.
Between 1990 and 2000, regional disparities began to emerge. Expansion intensity was relatively higher in peripheral counties, with Gaolan reaching 0.03, followed by Yuzhong (0.02) and Yongdeng (0.01). In contrast, all districts within the urban core remained at low levels, with Anning still exhibiting no expansion.
During 2000–2010, expansion intensity increased markedly. Among peripheral areas, Yuzhong County recorded a relatively high intensity of 0.18. Meanwhile, internal differentiation within the urban core became evident, with Anning (0.09) and Xigu (0.02) showing more pronounced expansion, while Chengguan, Honggu, and Qilihe also experienced moderate increases compared to the previous period.
In 2010–2020, the spatial pattern of expansion intensity shifted, with the center of gravity moving towards the northern peripheral regions. Gaolan (1.32) and Yongdeng (1.29) ranked highest in expansion intensity across the study area. Within the urban core, Xigu District (0.11) maintained a relatively high level, whereas Anning and Chengguan exhibited comparatively lower intensities.

4.2.2. Spatiotemporal Differentiation Patterns of Ecosystem Services

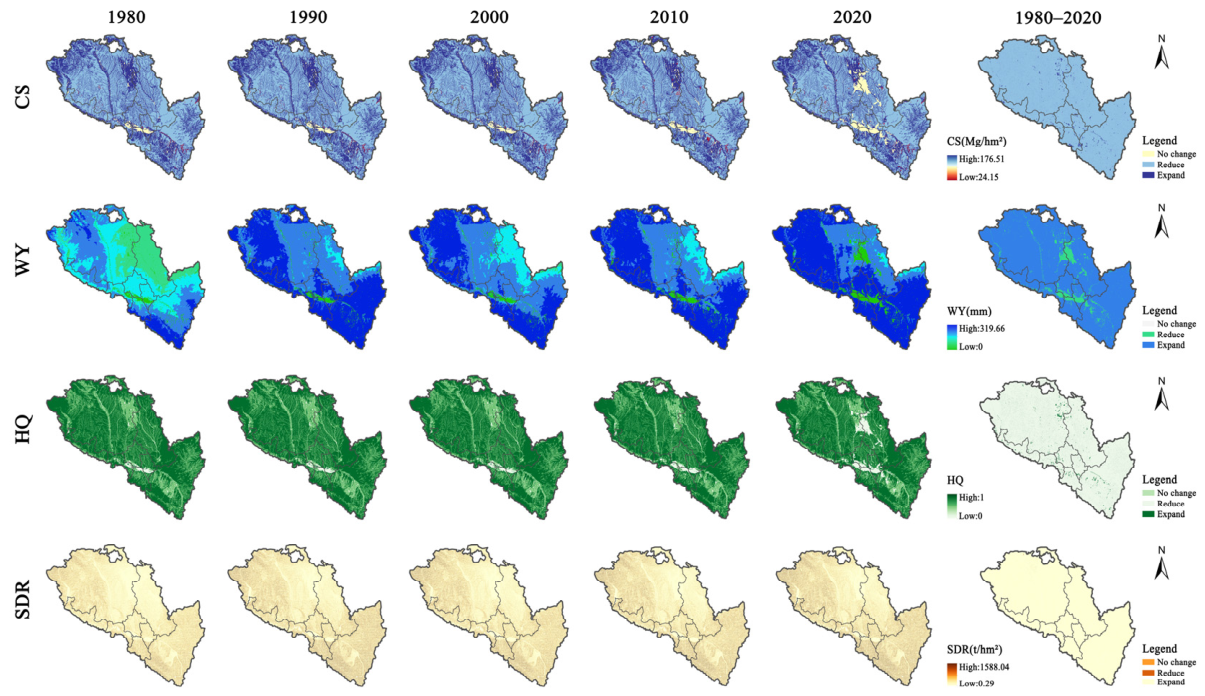
Between 1980 and 2020, the four key ecosystem services in Lanzhou exhibited pronounced spatial heterogeneity and well-defined gradient patterns (Figure 6), with detailed class proportions and temporal variations presented in Table A2.
Carbon storage displayed a clear southeast–northwest gradient, with lower values in the southeast and higher values in the northwest. The medium-value class (average proportion of 60.39%) constituted the dominant category, being extensively distributed across the loess hilly regions of southern Yongdeng, central Gaolan, and northern Yuzhong. High-value areas were mainly concentrated in the northwestern part of Yongdeng and the southern mountainous margins of Yuzhong, whereas the urban core districts (Chengguan and Qilihe) were characterized by concentrated low values. Over time, the class composition changed markedly, with low- and lower-value areas increasing by 0.18% and 3.71%, respectively, while medium- and higher-value areas declined by 1.57% and 2.54%.
Water yield exhibited a pronounced gradient increasing from southeast to northwest, with high-value areas dominating the overall pattern (average proportion of 43.19%), primarily located in Yongdeng and Gaolan in the northwestern periphery. From a temporal perspective, the proportion of lower-value areas in the urban core (Chengguan and Qilihe) and southern Yuzhong decreased by 24.17%, while medium-value areas in relatively flat valley zones (central Yuzhong and southern Gaolan) declined substantially by 31.92%. In contrast, low-value areas expanded progressively from northwest to southeast, with an overall increase of 3.60%.
Habitat quality exhibited a distinct “low-center, high-periphery” spatial configuration. High-value areas (average proportion of 67.35%) were predominantly distributed in the forested mountainous regions of northwestern Yongdeng and southern Yuzhong, whereas low-value areas (average proportion of 3.31%) were concentrated in the urban core (Chengguan and Qilihe) and along major transport corridors. During the study period, the class structure underwent notable changes, with the proportion of low-value areas increasing by 3.71%, lower-value areas (widely distributed in central Yuzhong and southern Gaolan) decreasing by 2.54%, and high-value areas declining by 1.40%.
Soil conservation exhibited substantial spatial differentiation but relatively limited temporal variability. Low-value areas (average proportion of 78.54%) were widely distributed across the flat valley zones of Chengguan, Qilihe, Xigu, and eastern Yuzhong, whereas higher-value classes were mainly concentrated in the mountainous margins of northwestern Yongdeng and southern Yuzhong. Over time, the class composition showed modest adjustments, with the proportions of low-, lower-, and medium-value areas decreasing by 1.56%, 1.85%, and 1.01%, respectively, while higher- and high-value areas increased slightly.

4.3. Driving Factors of Spatiotemporal Changes in Ecosystem Services

Prior to the quantitative detection of driving factors, variance inflation factor (VIF) analysis was performed to test the multicollinearity among the selected variables. The results showed that the VIF values of the ten driving factors ranged from 1.25 to 4.32, all below the critical threshold of 5, indicating the absence of significant multicollinearity and confirming the statistical reliability of the model evaluation results.
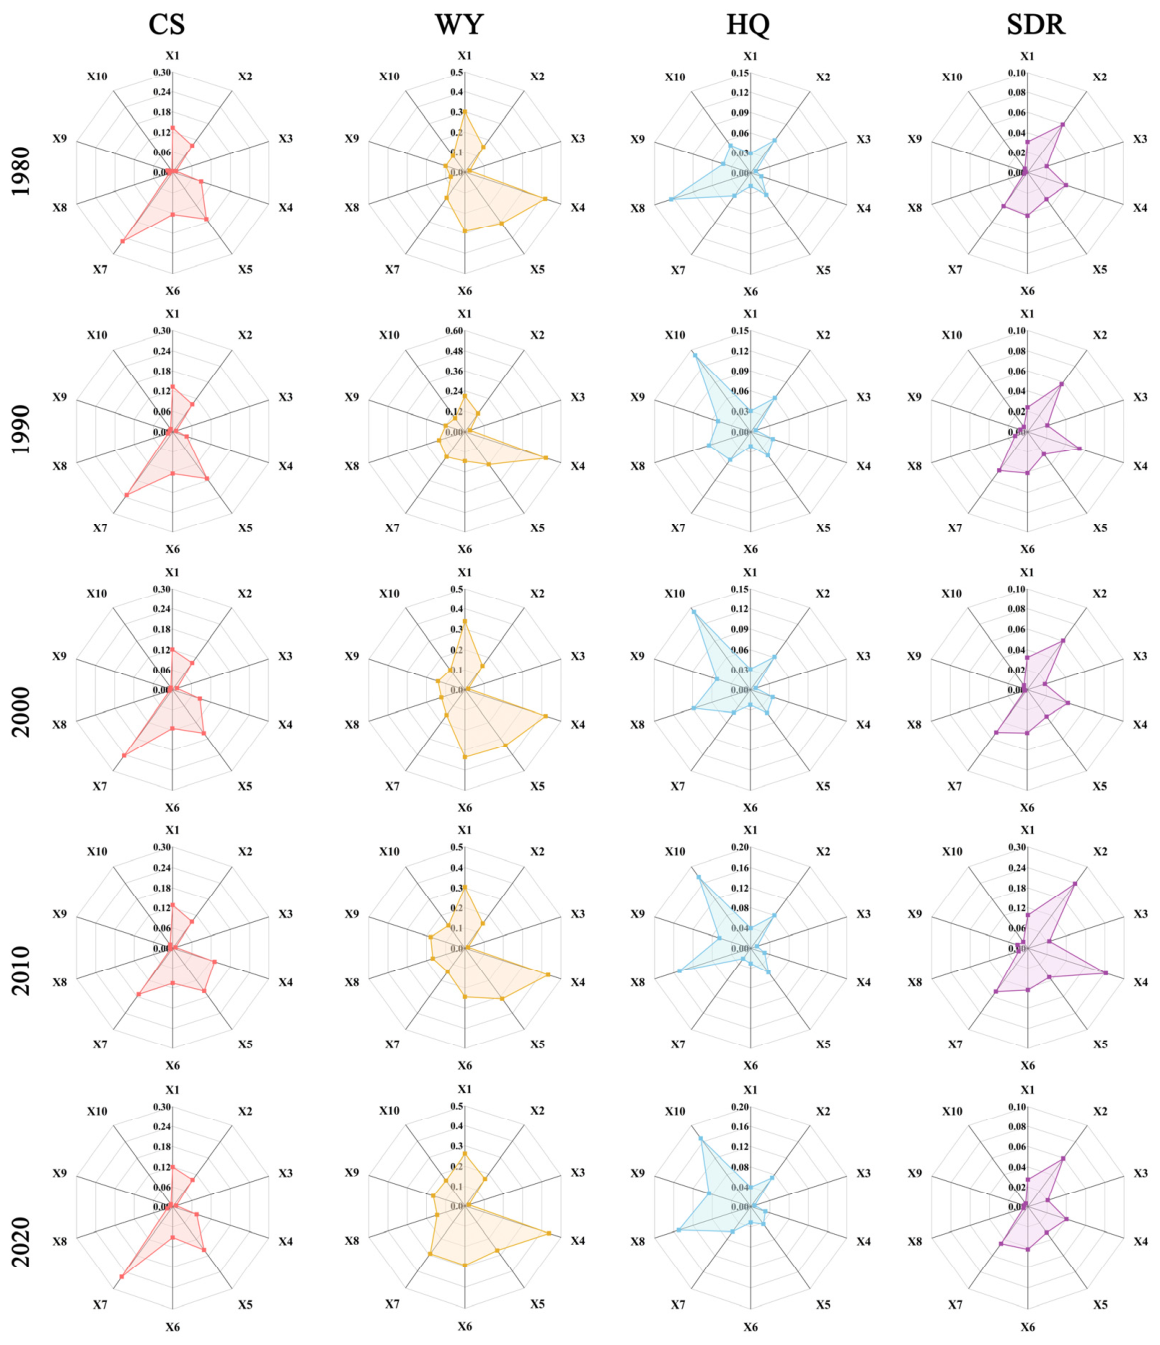
From 1980 to 2020, the driving mechanisms of ecosystem services in the study area exhibited pronounced stage-specific variations (Figure 7). Natural factors consistently played a dominant role, whereas the influence of anthropogenic activities increased substantially over time. In terms of influence direction, natural factors generally exerted positive effects on ecosystem services, while socioeconomic factors exhibited significant negative stress effects. Regarding topographic factors, slope (X2) maintained a persistent controlling effect on soil conservation, with q values ranging from 0.06 to 0.24, and showed a significant positive correlation with soil conservation services, indicating that areas with steeper slopes exhibited a stronger dependence on soil conservation functions. Elevation (X1) demonstrated relatively strong explanatory power for water yield services, with q values ranging from 0.21 to 0.34.
Among the climatic factors, annual precipitation (X4) exerted a strong positive driving effect on water yield services, with the q value reaching a peak of 0.51 in 1990. In contrast, temperature (X5) exhibited a negative correlation with carbon sequestration services by influencing evapotranspiration processes, with q values ranging from 0.16 to 0.17. The vegetation factor NDVI (X7) showed a significant positive correlation with carbon sequestration services, with q values ranging from 0.17 to 0.26.
With respect to socioeconomic factors, population density (X8) and GDP (X10) exerted significant negative stress effects on habitat quality, while their explanatory power increased continuously over time. Specifically, the q value of population density increased from 0.12 to 0.15, whereas that of GDP increased from 0.05 to 0.17. These findings suggest that, with the intensification of economic development and human activities, the disturbances induced by urban expansion on ecosystem services became increasingly pronounced during 1980–2020.
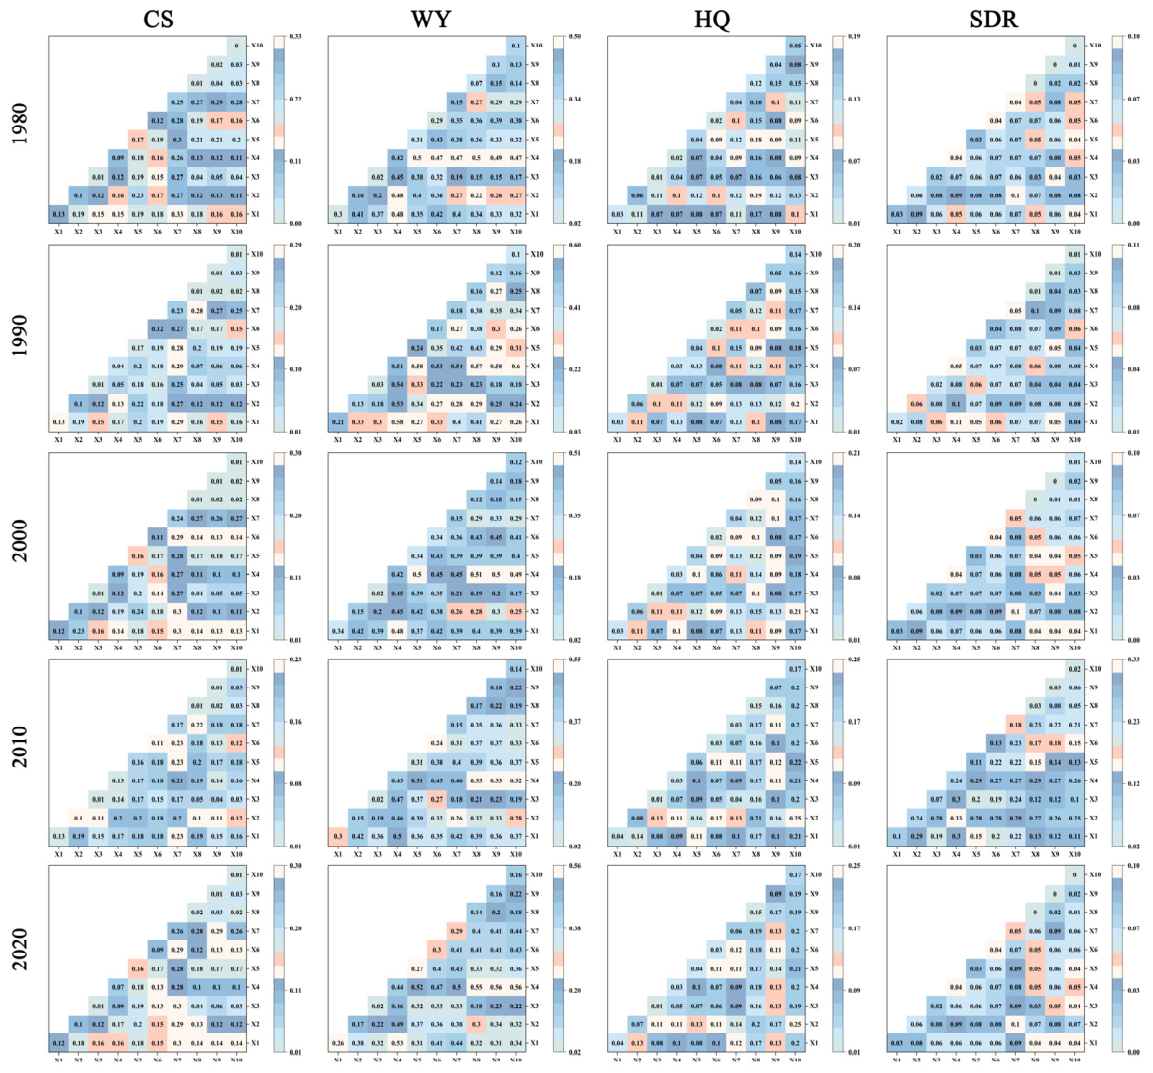
Between 1980 and 2020, the interactions among driving factors of ecosystem services in the study area were significantly enhanced, exhibiting an evolutionary characteristic shifting from “natural factor dominance” to “synergy between natural and human factors. “The interaction between climatic and economic factors had the most pronounced impact on water yield services (Figure 8). The interaction q-values between mean annual precipitation (X4) and GDP (X10) reached 0.56 and 0.50 in 1990 and 2020, respectively. These values were significantly higher than single-factor effects, indicating that water resource supply is controlled simultaneously by climate and economic activities. Regarding carbon sequestration services, the interaction q-value between NDVI (X7) and elevation (X1) increased from a lower level in 1980 to 0.33. Meanwhile, its interaction with slope (X2) strengthened to over 0.30 after 2000, suggesting that vegetation and topographic conditions have a synergistic enhancement effect on carbon storage. For soil conservation services, the interaction between slope (X2) and mean annual precipitation (X4) reached 0.33 in 2010, which was higher than in other periods. The interaction between NDVI (X7) and slope (X2) rose to 0.10 in 2020, reflecting that vegetation restoration and topography jointly inhibit soil erosion. Overall, the synergistic enhancement among climatic factors (e.g., precipitation), topographic factors (e.g., slope, elevation), and socioeconomic factors (e.g., GDP, population density) became the primary driving force for the changes in various ecosystem services from 1980 to 2020.

4.4. Coupling Coordination Analysis of Urban Land Expansion and Ecosystem Services

4.4.1. Coupling Coordination Analysis of Urban Land Expansion Intensity and Ecosystem Services

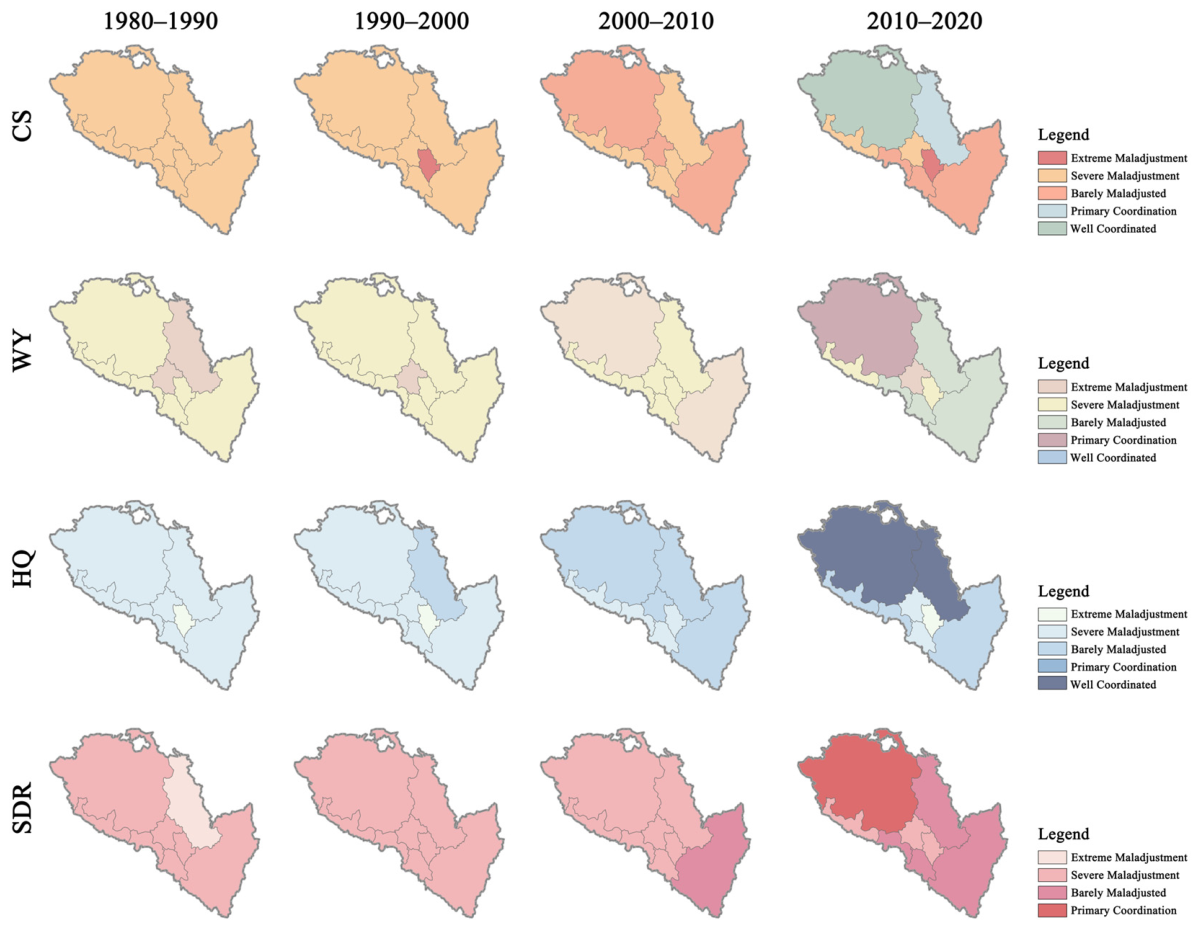
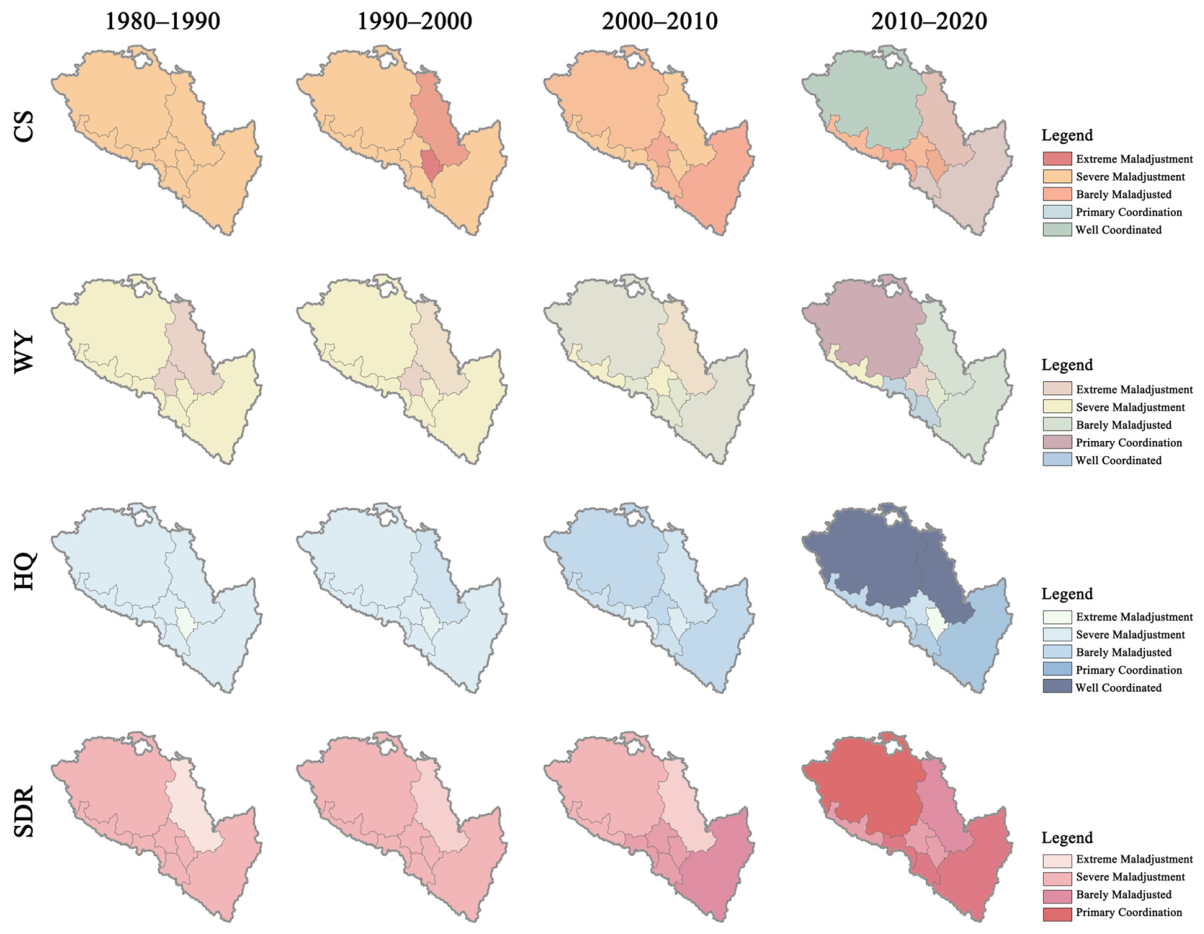
Overall, during the study period, the coordination level between the two underwent an evolutionary process shifting from widespread incoordination to gradual improvement. However, significant differences in development trends were observed between the central urban areas and the peripheral counties (Figure 9).
From 1980 to 1990, the coupling coordination degree was generally in a state of incoordination. In the central urban area, water yield capacity in Chengguan (0.21), Xigu (0.23), Anning (0.25), and Honggu (0.30) districts, as well as soil conservation service in Qilihe District (0.29), all exhibited moderate incoordination. Among the peripheral counties, carbon storage in Gaolan County (0.15) was at a level of severe incoordination, while water yield capacity in Yongdeng (0.26) and Yuzhong (0.32) counties also remained at moderate incoordination levels. This indicates that the initial stage of urban expansion exerted widespread stress on ecosystem services.
From 1990 to 2000, this situation of widespread incoordination did not undergo fundamental change. In the central urban area, Chengguan District was in moderate incoordination regarding carbon storage (0.26) and remained deeply mired in severe incoordination regarding habitat quality (0.17). Anning District even exhibited severe incoordination in carbon storage (0.20). In contrast, the peripheral Yuzhong County remained in a stage of moderate incoordination for water yield capacity (0.33) and carbon storage (0.31), failing to escape the predicament of incoordination.
From 2000 to 2010, the coordination state entered a critical transition period. The improvement in coordination degrees in peripheral counties was particularly evident. Yuzhong County reached the level of “on the verge of incoordination” in water yield capacity (0.57), carbon storage (0.49), and soil conservation service (0.55). Although it had not yet crossed into the coordination range, it showed a positive trend. Conversely, in the central urban area, apart from Xigu District which remained in moderate incoordination for habitat quality (0.30), most areas, such as Qilihe and Honggu districts, were largely in a state of moderate incoordination or on the verge of incoordination. The ecological pressure resulting from urban expansion remained substantial.
From 2010 to 2020, the spatial differentiation pattern of coupling coordination degrees was further consolidated. The peripheral counties demonstrated strong momentum for improvement: Yongdeng County achieved “good coordination” in both water yield capacity (0.84) and habitat quality (0.91), and Gaolan County also realized “good coordination” in habitat quality (0.99). Although Yuzhong County showed progress in multiple service indicators, it basically remained at the level of “on the verge of incoordination” or transitioning toward “primary coordination.” While the overall coordination level of the central urban area improved compared to the previous period, most areas still hovered between severe and moderate incoordination. For instance, Chengguan District remained in severe incoordination regarding water yield capacity (0.18) and habitat quality (0.11), while multiple indicators for Qilihe, Anning, and Honggu districts were generally in states of moderate incoordination or on the verge of incoordination.

4.4.2. Coupling Coordination Analysis of Urban Land Expansion Speed and Ecosystem Services

Overall, the coordination level between the two evolved from widespread severe incoordination in the initial stage to being dominated by “on the verge of incoordination” and “primary coordination” in the later stage. However, distinct differences existed in the evolutionary paths of the central urban area and peripheral counties (Figure 10).
From 1980 to 1990, the coordination status was generally poor. In the central urban area, Chengguan District exhibited moderate incoordination in water yield capacity (0.21) and carbon storage (0.27), and severe incoordination in habitat quality (0.19). The coupling coordination degrees for various ecosystem services in Qilihe, Xigu, Anning, and Honggu districts also mostly fell within the moderate incoordination range. Peripheral counties were similarly in a state of incoordination; for instance, water yield capacity in Yongdeng (0.26), carbon storage in Gaolan (0.15), and water yield capacity in Yuzhong (0.32) all fell into the categories of severe or moderate incoordination. This indicates that the rapid initial phase of urban land expansion caused widespread negative impacts on ecosystem services.
From 1990 to 2000, incoordination remained the dominant theme, though slight local improvements emerged. In the central urban area, Chengguan District remained in moderate incoordination for carbon storage (0.32) but slipped into severe incoordination for water yield capacity (0.13), reflecting the instability of its internal development. Most peripheral areas, such as Yongdeng (water yield 0.28) and Yuzhong (water yield 0.31), still hovered in the moderate incoordination stage, showing slow improvement in coordination.
From 2000 to 2010, the region entered a critical turning point. Progress in peripheral counties was particularly significant; Yuzhong County transitioned from incoordination to “on the verge of incoordination” in water yield capacity (0.53) and soil conservation service (0.52). Meanwhile, the central urban area also showed a positive catching-up trend. Chengguan District reached “on the verge of incoordination” in carbon storage (0.55) and soil conservation service (0.54), as did Qilihe District in carbon storage and soil conservation service (0.50). This marked a preliminary improvement in the relationship between urban expansion speed and ecological protection in the central region.
From 2010 to 2020, the coupling coordination pattern was further optimized, presenting a trend of “periphery leading, center following.” Peripheral counties achieved high-level coordinated development: Yongdeng County attained “good coordination” in water yield capacity (0.85), carbon storage (0.91), and habitat quality (0.92). The coordination degree in the central urban area also generally improved; Qilihe District reached “primary coordination” in carbon storage and soil conservation service (0.71). However, Chengguan District remained in moderate incoordination for water yield capacity (0.28), and Anning District was in severe incoordination for carbon storage (0.20), revealing persistent development shortcomings within the central urban area.

5. Discussion

5.1. Drivers of the Coupling Coordination Between Urban Expansion and Ecosystem Services

The evolution of the coupling coordination between urban expansion and ecosystem services in Lanzhou reflects a complex transition process characteristic of valley cities operating under pronounced geographical constraints, wherein interactions between policy interventions and socio-economic drivers facilitate a shift from low-level competition towards higher-level synergies [60].
First, geomorphological conditions impose “hard constraints” that underpin regional differentiation. The distinctive “two mountains flanking a river” configuration has generated a path-dependent, corridor-oriented mode of urban expansion [61]. This terrain significantly limits lateral growth, intensifying competition between construction land and valley ecological corridors within a confined spatial framework, thereby constituting the primary physical explanation for persistently low coupling coordination in the urban core [62]. By contrast, the relatively open spatial conditions in peripheral counties provide greater developmental flexibility, enabling cluster-based expansion patterns that reduce direct encroachment on ecologically sensitive areas, highlighting the importance of aligning urban expansion trajectories with underlying geomorphological structures.
Second, policy transformation has fundamentally reconfigured the development paradigm of urbanization [28,63]. During 1980–2010, an extensive growth model prioritized economic expansion at the expense of ecological assets, leading to pronounced trade-offs among ecosystem functions. In contrast, the post-2010 policy shift not only promoted ecological restoration—through initiatives such as reforestation—but also encouraged more intensive land use via stock-oriented planning strategies. This transition suggests that policy serves not only as an external regulatory mechanism but also as a key endogenous driver capable of mitigating resource constraints and enhancing coupling coordination.
Finally, the interaction enhancement effect between natural and socioeconomic factors constituted the fundamental driving force underlying system evolution [64]. The geographic detector results indicated that these interactions were not characterized by simple additive effects but rather by synergistic amplification effects under ecologically fragile conditions. With the intensification of socioeconomic activities, population density and economic output interacted with ecological baseline conditions, such as natural precipitation, to form complex compound driving mechanisms. Consequently, the central urban areas experienced pronounced “pressure superposition” under conditions of high population concentration, whereas in the peripheral regions, the supporting role of natural factors became increasingly prominent due to relatively low development intensity. These findings further emphasize that urban development strategies should fully consider the differentiated responses of individual administrative units under varying conditions of natural carrying capacity and economic development intensity [65,66,67].

5.2. Comparison with Previous Studies

The results of this study indicate that the relationship between urban expansion and ecosystem services in Lanzhou experienced an overall transition from imbalance to gradual improvement during 1980–2020, although marked regional differences were observed. This finding is generally consistent with previous studies suggesting that urban expansion can significantly affect the supply capacity of ecosystem services [68,69,70]. Existing research has demonstrated that the expansion of construction land reshapes ecological spatial patterns through land-use conversion, thereby influencing ecosystem services such as carbon storage, habitat quality, and water conservation. In the present study, the central urban area remained at a relatively low coordination level during the early stage of rapid urban expansion, further indicating that intensive construction activities exert persistent pressure on ecosystem services.
Compared with studies conducted in plain cities or coastal urban agglomerations [71,72], Lanzhou, as a representative valley-type city, exhibits more pronounced spatial constraints during urban expansion. Constrained by the distinctive geomorphological pattern of “mountains flanking a central valley”, construction land expansion has mainly occurred along the Yellow River valley and transportation corridors, forming a linear urban spatial structure. Within the limited valley space, construction land is more likely to compete intensively with ecological land types, including cropland and grassland, thereby contributing to stronger spatial differentiation of ecosystem services. These findings suggest that topographic conditions play an important role in shaping urban expansion patterns and their corresponding ecological effects.
Regarding the driving mechanisms, the results indicate that natural environmental factors consistently constitute the fundamental basis affecting the spatial differentiation of ecosystem services, whereas the influence of socioeconomic factors, such as population and GDP, gradually strengthened during the later study period. The geographic detector results further reveal significant interaction enhancement effects among most factors, indicating that the evolution of ecosystem services is generally driven by the combined effects of multiple factors. This finding is in agreement with previous studies emphasizing that ecosystem services are jointly influenced by natural environmental conditions and anthropogenic activities [73,74,75].
Nevertheless, several limitations should be noted in this study. First, the results of the coupling coordination degree model may be affected by spatial scale and indicator construction methods, and the characteristics of spatial differentiation may vary across different scales. Second, although the geographic detector model can effectively identify the explanatory power of driving factors, it remains insufficient in capturing the temporal lag effects associated with continuous ecological processes and policy interventions. In addition, this study was conducted based on five temporal nodes between 1980 and 2020, which may limit the characterization of short-term dynamic changes. Future research should incorporate higher temporal resolution data, multi-scenario simulations, and dynamic modeling approaches to further explore the long-term feedback relationships between urban expansion and ecosystem services.

5.3. Policy Implications

Building on the study’s findings and considering the unique characteristics of valley-type cities in Lanzhou alongside the ecological protection imperatives of the Yellow River Basin, several policy recommendations are proposed. First, spatial governance should be optimized through the delineation of differentiated development boundaries. The national land development strategy of “northward expansion, southern control, western optimization, and eastern coordination” should be rigorously implemented. In the central urban area, ecological protection redlines and urban development boundaries must be clearly demarcated, while increases in construction land within the valley core should be strictly controlled. Redevelopment of underutilized land and urban renewal initiatives should be promoted to mitigate the pressures of land use change on ecosystem services [76,77,78]. In peripheral counties, moderate expansion of urban space may be permissible under the premise of ecological security, facilitating a “valley core–peripheral cluster” spatial configuration that alleviates ecological pressures on the urban core.
Second, ecological restoration initiatives should be reinforced to enhance critical ecosystem service functions [79]. In alignment with the ecological protection plan for the Yellow River Basin, priority interventions should include greening of the surrounding mountains, restoration of riverside wetlands, and integrated soil and water conservation projects, thereby strengthening carbon storage, water retention, and soil conservation capacities. In regions exhibiting low habitat quality, the establishment of ecological corridors and green space networks is recommended to improve urban ecological microcirculation [80].
Third, a coordinated governance framework should be established to facilitate the synergistic development of ecological and economic systems [81]. The coupling coordination between urban expansion and ecosystem services should be integrated into local government planning and performance evaluation systems. An “urban development–ecological compensation” mechanism is advised, wherein the central urban area provides ecological compensation to peripheral counties demonstrating effective ecological outcomes. Furthermore, industrial restructuring in the urban core should be encouraged, emphasizing a transition toward greener and higher-value industries, thereby reducing the ecological pressures imposed by high-energy-consumption and high-pollution sectors. Through the integrated implementation of spatial governance, ecological restoration, and institutional mechanisms, a systematic policy framework can be established to support the sustainable development of valley-type cities.

6. Conclusions

This study presents a systematic assessment of the spatiotemporal co-evolution of urban expansion and ecosystem services in Lanzhou, a representative valley city, over the period 1980–2020. The findings indicate that, under the pronounced topographic constraint of a “two mountains flanking a river” configuration, urban expansion exhibits a distinctly corridor-oriented pattern. Such a spatial form results in a highly localized and concentrated encroachment of construction land upon ecological spaces, particularly cropland. From a spatiotemporal perspective, the coupling coordination relationship demonstrates a marked “core–periphery” differentiation: the urban core, constrained by historically intensive development and limited by terrain conditions, shows a lag in the improvement of ecosystem service coordination, whereas peripheral counties, characterized by relatively abundant ecological space and moderate cluster-based expansion, display greater potential for coordinated development. Overall, the coupling relationship between urbanization and ecosystem services in Lanzhou has transitioned from a state of widespread imbalance driven by extensive expansion to a more locally coordinated pattern under policy intervention, reflecting an adaptive reconfiguration of urban development pathways within a complex environmental setting.
Based on the above findings, this study further elucidates the driving mechanisms underlying the interaction between urban expansion and ecosystem services in valley-type cities, confirming that geomorphological constraints constitute the physical foundation, policy orientation functions as the regulatory variable, and the interaction enhancement effect between natural and socioeconomic factors represents the fundamental driving force of system evolution. The primary theoretical contribution of this study lies in the integration of a modified coupling coordination degree model and the geographic detector method to clarify the complex “pressure–state–response” interactions under ecologically fragile conditions, thereby enriching the theoretical understanding of urbanization processes and ecological effects in valley-type cities.
Nevertheless, several limitations remain in this study. For instance, the interpretation of multi-temporal land-use remote sensing data may involve scale-related uncertainties in capturing changes in fine-scale ecological patches, while the long-term disturbances induced by extreme climate change on ecosystem service provision were not fully incorporated into the analysis. Future research should focus on developing dynamic simulation models of urban expansion and ecosystem services under multiple scenarios, further exploring the feedback mechanisms associated with different planning strategies, and strengthening quantitative studies on cross-scale ecological compensation effects. Such efforts would provide more robust scientific support for territorial spatial planning and high-quality development under complex geomorphological conditions.

Author Contributions

Conceptualization, S.W. and X.T.; methodology, S.W.; software, S.W.; validation, S.W., X.T. and C.Z.; formal analysis, S.W.; investigation, S.W.; resources, X.T.; data curation, S.W.; writing—original draft preparation, S.W.; writing—review and editing, X.T. and C.Z.; visualization, S.W.; supervision, X.T. and C.Z.; project administration, X.T.; funding acquisition, C.Z. All authors have read and agreed to the published version of the manuscript.

Funding

This research received no external funding.

Data Availability Statement

All datasets used in this study were obtained from publicly available sources. Land use remote sensing monitoring data were derived from the Resource and Environmental Science and Data Center (RESDC) of the Chinese Academy of Sciences (https://www.resdc.cn/ (accessed on 20 June 2025)). Soil physicochemical property data were sourced from the FAO Harmonized World Soil Database (HWSD v1.2; https://www.fao.org/soils-portal/data-hub/soil-maps-and-databases/harmonized-world-soil-database-v12/en/ (accessed on 20 June 2025)). Meteorological data (precipitation, temperature, and evapotranspiration) and socio-economic variables (population density and GDP) were obtained from the RESDC and Copernicus Publications. Topographic data (DEM, slope, and aspect) were provided by the RESDC. Normalized Difference Vegetation Index (NDVI) data were sourced from NASA, and night-time light data were obtained from Scientific Data. No new primary datasets were generated in this study; the processed data and results produced during the analyses are available from the corresponding author upon reasonable request.

Conflicts of Interest

The authors declare no conflicts of interest.

Appendix A

Table A1. Percentage of Area by Land Use Type, 1980–2020 (Unit: %).
Land Use Type19801990200020102020
Grassland60.8560.6960.5060.6259.28
Urban Land0.790.790.801.072.17
Cropland28.9629.1829.1627.9226.41
Forest6.896.836.867.167.04
Rural Settlements1.441.431.591.681.69
Other Construction Land0.160.160.170.362.24
Water Body0.520.520.520.530.58
Unused Land0.390.390.390.670.58
Table A2. Proportions of Ecosystem Services Statistics, 1980–2020 (Unit: %).
Ecosystem ServiceLevel19801990200020102020
Carbon SequestrationLow0.402.3960.8528.967.41
Relatively Low0.402.3860.6829.187.36
Medium0.402.5760.5029.167.38
Relatively High0.663.1160.6227.927.69
High0.576.1059.2826.427.63
Water YieldLow3.2624.5734.6428.688.03
Relatively Low3.090.314.5339.8152.26
Medium3.410.9614.5241.9539.17
Relatively High4.110.508.5035.8251.06
High6.860.402.7224.5765.45
Habitat QualityLow2.3928.960.400.5367.73
Relatively Low2.3829.180.400.5267.52
Medium2.5729.160.400.5267.36
Relatively High3.1127.920.660.5367.79
High6.1026.420.570.5866.33
Soil ConservationLow79.508.526.613.680.86
Relatively Low78.287.105.795.473.36
Medium78.637.476.205.282.41
Relatively High78.357.155.945.503.06
High77.936.685.605.634.16
Table A3. Urban Expansion Speed, 1980–2020 (Unit: km2/year).
Region1980–19901990–20002000–20102010–2020
CG0.000.081.120.42
QLH0.040.050.331.20
ANN0.000.000.830.66
XG0.000.010.281.90
HG0.040.010.140.31
YD0.000.020.164.85
GL0.000.050.073.86
YZ0.000.040.511.40
Table A4. Urban Expansion Intensity, 1980–2020.
Region1980–19901990–20002000–20102010–2020
CG0.000.000.030.01
QLH0.000.000.010.04
ANN0.000.000.090.04
XG0.000.000.020.11
HG0.010.000.020.04
YD0.000.010.071.29
GL0.000.030.031.32
YZ0.000.020.180.18

References

  1. Kundu, D.; Pandey, A.K. World urbanisation: Trends and patterns. In Developing National Urban Policies: Ways Forward to Green and Smart Cities; Springer: Singapore, 2020; pp. 13–49. [Google Scholar]
  2. Seto, K.C.; Güneralp, B.; Hutyra, L.R. Global forecasts of urban expansion to 2030 and direct impacts on biodiversity and carbon pools. Proc. Natl. Acad. Sci. USA 2012, 109, 16083–16088. [Google Scholar] [CrossRef]
  3. Liu, X.; Pei, F.; Wen, Y.; Li, X.; Wang, S.; Wu, C.; Cai, Y.; Wu, J.; Chen, J.; Feng, K. Global urban expansion offsets climate-driven increases in terrestrial net primary productivity. Nat. Commun. 2019, 10, 5558. [Google Scholar] [CrossRef]
  4. Qader, S.H.; Dash, J.; Alegana, V.A.; Khwarahm, N.R.; Tatem, A.J.; Atkinson, P.M. The role of earth observation in achieving sustainable agricultural production in arid and semi-arid regions of the world. Remote Sens. 2021, 13, 3382. [Google Scholar] [CrossRef]
  5. Huang, J.; Yu, H.; Guan, X.; Wang, G.; Guo, R. Accelerated dryland expansion under climate change. Nat. Clim. Change 2016, 6, 166–171. [Google Scholar] [CrossRef]
  6. Huang, J.; Li, Y.; Fu, C.; Chen, F.; Fu, Q.; Dai, A.; Shinoda, M.; Ma, Z.; Guo, W.; Li, Z. Dryland climate change: Recent progress and challenges. Rev. Geophys. 2017, 55, 719–778. [Google Scholar] [CrossRef]
  7. Lyu, B.; Gao, Z.; Wang, Y.; Liu, J.; Zhang, L.; Song, J.; Pan, Y.; Cheng, M.; Liu, S.; Chen, Q. Seasonal Dynamics and Trade-Offs/Synergies of Cultural Ecosystem Services in Urban Parks: A Case Study of Chengdu, China. Land 2025, 14, 2126. [Google Scholar] [CrossRef]
  8. Sheng, S.; Zhang, P.; Huang, J.; Ning, L. Research Advances and Emerging Trends in the Impact of Urban Expansion on Food Security: A Global Overview. Agriculture 2025, 15, 1509. [Google Scholar] [CrossRef]
  9. Guo, J.; Wei, X.; Zhang, F.; Ding, Y. Coupled Assessment of Land Use Changes and Ecological Benefits Using Multi-Source Remote Sensing Data. Agriculture 2025, 15, 1358. [Google Scholar] [CrossRef]
  10. Tian, S.; Wu, W.; Chen, S.; Li, Z.; Li, L. Socioeconomic factors behind the relationship between urban expansion and ecosystem services: A multiscale study in China. Landsc. Ecol. 2025, 40, 80. [Google Scholar] [CrossRef]
  11. Zhang, D.; Huang, Q.; He, C.; Wu, J. Impacts of urban expansion on ecosystem services in the Beijing-Tianjin-Hebei urban agglomeration, China: A scenario analysis based on the Shared Socioeconomic Pathways. Resour. Conserv. Recycl. 2017, 125, 115–130. [Google Scholar] [CrossRef]
  12. Admasu, G.T. Urban land use dynamics, the nexus between land use pattern and its challenges: The case of Hawassa city, Southern Ethiopia. Land Use Policy 2015, 45, 159–175. [Google Scholar] [CrossRef]
  13. Shrestha, P.P.; Shrestha, A.M.; Hong, C.Y. Policy-Driven Urban Expansion and Land Use/Land Cover Change in Ewa, Honolulu (2002–2022): Remote Sensing and Machine Learning Analysis of Transit-Oriented Development Impacts. Land 2025, 14, 2041. [Google Scholar] [CrossRef]
  14. Liu, W. Analysis of the Spatial Pattern of Urban Expansion in African Countries Under Different Shared Socioeconomic Pathway (SSP) Scenarios. Land 2025, 14, 558. [Google Scholar] [CrossRef]
  15. Xu, J.; Li, L.; Lin, W.; Xu, D.; Yu, Q.; Xiong, Y.; Shi, Y. Valuation of ecosystem services value based on dynamic equivalent factor in the Yangtze River Delta urban Agglomeration. J. Nat. Conserv. 2026, 89, 127158. [Google Scholar] [CrossRef]
  16. Mizunoya, T. Carbon Storage and Land Use Dynamics in Ghanaian University Campuses: A Scenario-Based Assessment Using the InVEST Model. Land 2025, 14, 1987. [Google Scholar] [CrossRef]
  17. Kim, D.U.; Yoon, H.Y. Objective Parameterization of InVEST Habitat Quality Model Using Integrated PCA-SEM-Spatial Analysis: A Biotope Map-Based Framework. Land 2025, 14, 2050. [Google Scholar] [CrossRef]
  18. He, J.; Yang, J. Spatial–Temporal Characteristics and Influencing Factors of Land-Use Carbon Emissions: An Empirical Analysis Based on the GTWR Model. Land 2023, 12, 1506. [Google Scholar] [CrossRef]
  19. Yu, M.; Zhou, T.; Yi, J.; Ding, G.; Guo, J. Unveiling the Spatiotemporal Evolution and Driving Mechanisms of Ecosystem Carbon Sink in Rapidly Urbanizing Areas: A Case Study of the Yangtze River Delta Region. Land Degrad. Dev. 2025, 36, 4658–4671. [Google Scholar] [CrossRef]
  20. Zhang, L.; Zheng, H.; Zhang, X. Spatiotemporal Changes of Ecosystem Services under Horizontal Ecological Compensation: A Case Study of Miyun Reservoir Basin. J. Resour. Ecol. 2026, 17, 208–219. [Google Scholar] [CrossRef]
  21. Zipperer, W.C.; Wu, J.; Pickett, P.S.T.A. The application of ecological principles to urban and urbanizing landscapes. Ecol. Appl. 2000, 10, 685–688. [Google Scholar] [CrossRef]
  22. Wu, K.; Wang, D.; Lu, H.; Liu, G. Temporal and spatial heterogeneity of land use, urbanization, and ecosystem service value in China: A national-scale analysis. J. Clean. Prod. 2023, 418, 137911. [Google Scholar] [CrossRef]
  23. Cheng, Y.; Kang, Q.; Liu, K.; Cui, P.; Zhao, K.; Li, J.; Ma, X.; Ni, Q. Impact of urbanization on ecosystem service value from the perspective of spatio-temporal heterogeneity: A case study from the Yellow River Basin. Land 2023, 12, 1301. [Google Scholar] [CrossRef]
  24. Tian, P.; Liu, Y.; Li, J.; Pu, R.; Cao, L.; Zhang, H. Spatiotemporal patterns of urban expansion and trade-offs and synergies among ecosystem services in urban agglomerations of China. Ecol. Indic. 2023, 148, 110057. [Google Scholar] [CrossRef]
  25. Horta, M.B.; Carvalho-Ribeiro, S.M.; Mas, J.F.; Martins, F.M.; Resende, F.D.M.; Goulart, F.F.; Fernandes, G.W. Land Cover Patterns of Urban Lots and Their Contribution to Ecological Functions. Sustainability 2024, 16, 3063. [Google Scholar] [CrossRef]
  26. Alberti, M.; Marzluff, J.M. Ecological resilience in urban ecosystems: Linking urban patterns to human and ecological functions. Urban Ecosyst. 2004, 7, 241–265. [Google Scholar] [CrossRef]
  27. Zhou, Z.; Chen, Y. How urban land expansion alters terrain in mountainous and hilly areas: An empirical study in China. Geogr. Sustain. 2025, 6, 100304. [Google Scholar] [CrossRef]
  28. He, S.; Wang, X.; Dong, J.; Wei, B.; Duan, H.; Jiao, J.; Xie, Y. Three-Dimensional Urban Expansion Analysis of Valley-Type Cities: A Case Study of Chengguan District, Lanzhou, China. Sustainability 2019, 11, 5663. [Google Scholar] [CrossRef]
  29. Xiao, X. Ecosystem Health Assessment of the Manas River Basin: Application of the CC-PSR Model Improved by Coupling Coordination Degree. Land 2024, 13, 1336. [Google Scholar] [CrossRef]
  30. Tang, P.; Huang, J.; Zhou, H.; Fang, C.; Zhan, Y.; Huang, W. Local and telecoupling coordination degree model of urbanization and the eco-environment based on RS and GIS: A case study in the Wuhan urban agglomeration. Sustain. Cities Soc. 2021, 75, 103405. [Google Scholar] [CrossRef]
  31. Duo, L.; Wang, J.; Zhang, F.; Xia, Y.; Xiao, S.; He, B.J. Assessing the Spatiotemporal Evolution and Drivers of Ecological Environment Quality Using an Enhanced Remote Sensing Ecological Index in Lanzhou City, China. Remote Sens. 2023, 15, 24. [Google Scholar] [CrossRef]
  32. Rong, Z.; Youyan, J.; Runzhi, L. Projection and reclassification of land use types in Lanzhou, Northwest China. J. Arid. Land 2026, 18, 17–33. [Google Scholar] [CrossRef]
  33. Liang, T.; Ma, W.; Shao, J.; Gao, X.; Luo, J.; Fan, K. Evolution of urban green space carbon sinks and their value in the arid region of Northwest China. Carbon Footpr. 2025, 4, 20. [Google Scholar] [CrossRef]
  34. Shi, Y.F.; Ma, C.; Kong, D.J.; Zhao, J. Effect of Land Creation on Regional Ecological Environment: A Case Study for Lanzhou City, China. Appl. Ecol. Environ. Res. 2019, 17, 5923–5934. [Google Scholar] [CrossRef]
  35. Chen, Y.; Zhang, Z.; Lang, L.; Long, Z.; Wang, N.; Chen, X.; Wang, B.; Li, Y. Measuring the spatial match between service facilities and population distribution: Case of Lanzhou. Land 2023, 12, 1549. [Google Scholar] [CrossRef]
  36. Li, X.; Qian, Y.; Zhang, Z.; Yang, M.; Zeng, J. Rethinking Spatial Equity in Retail Facilities for Young Urbanites in Strip Cities: A Case of Lanzhou. Sustainability 2025, 17, 10362. [Google Scholar] [CrossRef]
  37. Li, J.; Li, G.; Liang, Y.; Yuan, J.; Xu, G.; Yang, C. Spatiotemporal differentiation of the ecosystem service value and its coupling relationship with urbanization: A case study of the Lanzhou-Xining urban agglomeration. Ecol. Indic. 2024, 160, 111932. [Google Scholar] [CrossRef]
  38. Zhang, T.; Meng, M.; Cao, Y.; Jiang, Y.; Liu, J. Research on Effect of Construction of Huitengxile Wind farm to Grassland Ecosystem with Transitions of Land Use and Landscape Pattern. Procedia Eng. 2017, 174, 780–787. [Google Scholar] [CrossRef]
  39. Zhang, Z.; Pan, H.; Gan, J.; Sheng, S.; Lu, G. Spatiotemporal Evolution and Scenario Simulation of Landscape Ecological Risk in Hilly–Gully Regions: A Case Study of Zichang City. Land 2025, 14, 2358. [Google Scholar] [CrossRef]
  40. Niu, W.; Shen, Q.; Xu, Z.; Shang, W. Evaluation of the land use benefit of rapidly expanding cities based on coupling coordination and a transfer matrix. J. Resour. Ecol. 2023, 14, 542–555. [Google Scholar] [CrossRef]
  41. Liu, S.; Wang, Y.; Gong, P.; Zhang, G.J.; Li, X.; Zhao, Y.; Wang, P.; Zhou, J.; Zhou, X.; Yu, L. Regional warming from urbanization is disproportionate to urban expansion rate. One Earth 2025, 8, 101234. [Google Scholar] [CrossRef]
  42. Wang, L.; Jia, Y.; Li, X.; Gong, P. Analysing the driving forces and environmental effects of urban expansion by mapping the speed and acceleration of built-up areas in China between 1978 and 2017. Remote Sens. 2020, 12, 3929. [Google Scholar] [CrossRef]
  43. Indrawati, L.; Murti, B.S.S.H.; Rachmawati, R.; Aji, D.S. Effect of Urban Expansion Intensity on Urban Ecological Status Utilizing Remote Sensing and GIS: A Study of Semarang-Indonesia. IOP Conf. Ser. Earth Environ. Sci. 2020, 451, 012018. [Google Scholar] [CrossRef]
  44. Yang, J.; Li, S.; Lu, H. Quantitative influence of land-use changes and urban expansion intensity on landscape pattern in Qingdao, China: Implications for urban sustainability. Sustainability 2019, 11, 6174. [Google Scholar] [CrossRef]
  45. Gai, Z.; Zheng, W.; Faye, B.; Wang, H.; Du, G. Temporal and Spatial Characteristics and Influencing Factors of Carbon Storage in Black Soil Area Under Topographic Gradient. Land 2025, 14, 16. [Google Scholar] [CrossRef]
  46. Chen, Z.; Jiang, X.; Pan, X.; Chen, Y.; Lei, J.; Wu, T.; Chen, X.; Li, Y.; Shi, T. Multi-scenario land use simulation and carbon storage prediction analysis in the Hainan Tropical Rainforest National Park. Front. Ecol. Evol. 2025, 13, 1539340. [Google Scholar] [CrossRef]
  47. Luo, D.; Zhou, Z.; Zhang, L.; Chen, Q.; Huang, D.; Feng, Q.; Wu, T.; Wu, L. Evolution and driver analysis of forest carbon stocks in karst mountainous areas of southwest China in the context of rocky desertification management. Catena 2024, 246, 108335. [Google Scholar] [CrossRef]
  48. Cao, Y.; Ma, Y.; Bao, A.; Chang, C.; Liu, T. Evaluation of the water conservation function in the Ili River Delta of Central Asia based on the InVEST model. J. Arid. Land 2023, 15, 1455–1473. [Google Scholar] [CrossRef]
  49. Chen, S.; Li, X.; Qian, Z.; Wang, S.; Wang, M.; Liu, Z.; Li, H.; Xia, H.; Zhao, Z.; Li, T. Drought trend and its impact on ecosystem carbon sequestration in Lancang-Mekong River Basin. Acta Geogr. Sin. 2024, 79, 747–764. [Google Scholar] [CrossRef]
  50. Li, M.; Zhou, Y.; Xiao, P.; Tian, Y.; Huang, H.; Xiao, L. Evolution of Habitat Quality and Its Topographic Gradient Effect in Northwest Hubei Province from 2000 to 2020 Based on the InVEST Model. Land 2021, 10, 857. [Google Scholar] [CrossRef]
  51. Wang, X.; Liu, B.; Chen, J.; Arash, M.; Zhang, B.; Chang, Q.; Liu, J.; You, W. Assessing the impact of land use change on habitat quality in Zhongwei through multiscenario simulation using the PLUS and InVEST models. Sci. Rep. 2025, 15, 12355. [Google Scholar] [CrossRef]
  52. Zhang, Z.; Pan, H.; Liu, Y.; Sheng, S. Ecosystem services’ response to land use intensity: A case study of the Hilly and Gully Region in China’s Loess Plateau. Land 2024, 13, 2039. [Google Scholar] [CrossRef]
  53. Sun, S.; Lü, Y.; Feng, X.; Maestre, F.T.; Fu, B. Optimizing soil conservation through comprehensive benefit assessment in river basins. Environ. Sci. Ecotechnology 2025, 23, 100496. [Google Scholar] [CrossRef]
  54. Tang, F.; Wang, L.; Guo, Y.; Fu, M.; Huang, N.; Duan, W.; Luo, M.; Zhang, J.; Li, W.; Song, W. Spatio-temporal variation and coupling coordination relationship between urbanisation and habitat quality in the Grand Canal, China. Land Use Policy 2022, 117, 106119. [Google Scholar] [CrossRef]
  55. Du, H.; Liu, J. Exploring Spatial–Temporal Coupling and Its Driving Factors of Cultural and Tourism Industry in the Beijing–Tianjin–Hebei Urban Agglomeration, China. Sustainability 2025, 17, 890. [Google Scholar] [CrossRef]
  56. Jia, X.; Liu, H.; Zhang, X.; Liang, L.; Liu, D.; Zheng, X. Exploring the Spatiotemporal Driving Forces of Vegetation Cover Variations on the Loess Plateau: A Comprehensive Assessment of Climate Change and Human Activity. Land 2025, 14, 929. [Google Scholar] [CrossRef]
  57. Zhu, L.; Meng, J.; Zhu, L. Applying Geodetector to disentangle the contributions of natural and anthropogenic factors to NDVI variations in the middle reaches of the Heihe River Basin. Ecol. Indic. 2020, 117, 106545. [Google Scholar] [CrossRef]
  58. Zhou, M.; Li, Z.; Gao, M.; Zhu, W.; Zhang, S.; Ma, J.; Ta, L.; Yang, G. Revealing the Eco-Environmental Quality of the Yellow River Basin: Trends and Drivers. Remote Sens. 2010, 16, 18. [Google Scholar] [CrossRef]
  59. Zhao, H.; Gai, Y.; Wang, F.; Cui, L.; Du, Y.; Wang, H.; Tang, L.; Yang, H. Investigation into the supply-demand relationship of carbon sequestration in the yellow river basin using the optimal parameter geographical detector model. Sci. Rep. 2025, 15, 29079. [Google Scholar] [CrossRef]
  60. Sun, Y.; Ma, B.; Zhao, S.; Xie, Y.; Yu, Y.; Hu, W. Urban Expansion Trajectories and Landscape Ecological Risk in Terrain-Constrained Valley Cities: Evidence from Western China (1985–2023). Geographies 2026, 6, 19. [Google Scholar] [CrossRef]
  61. Yang, M.; Qian, Y.; Li, X.; Ou, Y.; Zeng, J. River valley urban network and morphology: A study on the urban morphology evolution of Lanzhou. PLoS ONE 2024, 19, e0302686. [Google Scholar] [CrossRef]
  62. Zhu, R.; Jiang, Y.; Wang, B.; Zhang, Y. Changes in human settlement environments and their drivers in valley cities located in arid and semi-arid regions: A case study of Lanzhou in Western China. Res. Cold Arid. Reg. 2024, 16, 149–158. [Google Scholar] [CrossRef]
  63. Guo, J.; Liu, M. Experimental state rescaling, goal-oriented governance, and urban transformation in China: The case of Lanzhou. Geoforum 2022, 137, 72–82. [Google Scholar] [CrossRef]
  64. Qu, S.; Gao, J.; Wang, L.; Zhang, Y.; Huang, F. Understanding resilience from the perspective of social-ecological system coupling: Dynamic evolution, nonlinear changes and influencing factors. Trans. Earth Environ. Sustain. 2025, 3, 3–27. [Google Scholar] [CrossRef]
  65. Ni, Y.; Feng, C. Urban Expansion in China: Identification, Spatiotemporal Characteristics and Influencing Factors. Appl. Spat. Anal. Policy 2025, 18, 159. [Google Scholar] [CrossRef]
  66. Li, X.; Liu, L.; Dong, X. Quantitative Analysis of Urban Expansion Using RS and GIS, A Case Study in Lanzhou. J. Urban Plan. Dev. 2011, 137, 459–469. [Google Scholar] [CrossRef]
  67. Wang, X.; Tang, X.; Shi, J.; Du, P. Construction and Optimization of Urban and Rural Ecological Security Patterns Based on Ecological Service Importance in a Semi-Arid Region: A Case Study of Lanzhou City. Sustainability 2024, 16, 6177. [Google Scholar] [CrossRef]
  68. Liu, W.; Zhan, J.; Zhao, F.; Yan, H.; Zhang, F.; Wei, X. Impacts of urbanization-induced land-use changes on ecosystem services: A case study of the Pearl River Delta Metropolitan Region, China. Ecol. Indic. 2019, 98, 228–238. [Google Scholar] [CrossRef]
  69. Wu, Y.; Tao, Y.; Yang, G.; Ou, W.; Pueppke, S.; Sun, X.; Chen, G.; Tao, Q. Impact of land use change on multiple ecosystem services in the rapidly urbanizing Kunshan City of China: Past trajectories and future projections. Land Use Policy 2019, 85, 419–427. [Google Scholar] [CrossRef]
  70. Long, H.; Liu, Y.; Hou, X.; Li, T.; Li, Y. Effects of land use transitions due to rapid urbanization on ecosystem services: Implications for urban planning in the new developing area of China. Habitat Int. 2014, 44, 536–544. [Google Scholar] [CrossRef]
  71. Su, Y.; Lu, C.; Su, Y.; Wang, Z.; Huang, Y.; Yang, N. Spatio-temporal evolution of urban expansion based on a novel adjusted index and GEE: A case study of central plains urban agglomeration, China. Chin. Geogr. Sci. 2023, 33, 736–750. [Google Scholar] [CrossRef]
  72. Shi, L.; Liu, F.; Zhang, Z.; Zhao, X.; Liu, B.; Xu, J.; Wen, Q.; Yi, L.; Hu, S. Spatial differences of coastal urban expansion in China from 1970s to 2013. Chin. Geogr. Sci. 2015, 25, 389–403. [Google Scholar] [CrossRef]
  73. Wang, Y.; Zhang, Z.; Chen, X. Quantifying influences of natural and anthropogenic factors on vegetation changes based on geodetector: A case study in the Poyang Lake Basin, China. Remote Sens. 2021, 13, 5081. [Google Scholar] [CrossRef]
  74. Li, L.; Fan, Z.; Feng, W.; Yuxin, C.; Keyu, Q. Coupling coordination degree spatial analysis and driving factor between socio-economic and eco-environment in northern China. Ecol. Indic. 2022, 135, 108555. [Google Scholar] [CrossRef]
  75. Kou, Y.; Chen, S.; Zhou, K.; Qiu, Z.; He, J.; Shi, X.; Zhou, X.; Zhang, Q. Spatiotemporal patterns and coupling coordination analysis of multiscale social–economic–ecological effects in ecologically vulnerable areas based on multi-source data: A case study of the Tuha Region, Xinjiang Province. Land 2024, 13, 282. [Google Scholar] [CrossRef]
  76. Virtudes, A. ‘Good’ Governance Principles in Spatial Planning at Local Scale. Procedia Eng. 2016, 161, 1710–1714. [Google Scholar] [CrossRef]
  77. Kladivo, P.; Roubínek, P.; Opravil, Z.; Nesvadbová, M. Suburbanization and Local Governance—Positive and Negative Forms: Olomouc Case Study. Bull. Geogr. Socio-Econ. Ser. 2015, 27, 95–107. [Google Scholar] [CrossRef]
  78. Zhang, B.; Liu, J.; Zhang, Z.; Zhu, Y. Research on ecological management zoning in Jilin Province based on a human well-being framework. Nat. Commun. 2025, 16, 16730. [Google Scholar] [CrossRef]
  79. Li, Y.; Qin, L.; Wang, Y.; Liu, H.; Zhang, M.; Hao, H. Ecosystem health assessment of the largest lake wetland in the Yellow River basin using an improved vigor-organization-resilience-services model. Ecol. Indic. 2024, 166, 112539. [Google Scholar] [CrossRef]
  80. Li, Y.; Wang, X.H.; Wan, Y.X.; Xu, B. Spatial pattern evolution and driving forces of ecosystem service value in the Yellow River Basin. Front. Environ. Sci. 2025, 13, 1562274. [Google Scholar] [CrossRef]
  81. Kang, S.; Jia, X.; Zhao, Y.; Luo, M.; Wang, H.; Zhao, M. The Coupling Coordination Relationship Between Urbanization and the Eco-Environment in Resource-Based Cities, Loess Plateau, China. ISPRS Int. J. Geo Inf. 2010, 13, 16. [Google Scholar] [CrossRef]
Figure 1. General Situation of the Study Area. Note: JQ represents Jiuquan City, JYG represents Jiayuguan City, ZY represents Zhangye City, JC represents Jinchang City, WW represents Wuwei City, LZ represents Lanzhou City, BY represents Baiyin City, LX represents Linxia Hui Autonomous Prefecture, DX represents Dingxi City, GN represents Gannan Tibetan Autonomous Prefecture, TS represents Tianshui City, LN represents Longnan City, QY represents Qingyang City, and PL represents Pingliang City. YD represents Yongdeng County, HG represents Honggu District, XG represents Xigu District, ANN represents Anning District, GL represents Gaolan County, CG represents Chengguan District, QLH represents Qilihe District, and YZ represents Yuzhong County.
Land 15 00853 g001
Figure 2. Technical Route.
Land 15 00853 g002
Figure 3. Land Use Transition in Lanzhou, 1980–2020.
Land 15 00853 g003
Figure 4. Urban expansion rate, 1980–2020.
Land 15 00853 g004
Figure 5. Urban expansion intensity, 1980–2020.
Land 15 00853 g005
Figure 6. Spatial distribution of ecosystem service types, 1980–2020.
Land 15 00853 g006
Figure 7. Explanatory power of natural environment and socio-economic factors on the spatial distribution pattern of different ecosystem services. Note: X1 represents Elevation, X2 represents Slope, X3 represents Aspect, X4 represents Mean Annual Precipitation, X5 represents Mean Annual Temperature, X6 represents Evaporation, X7 represents NDVI, X8 represents Population Density, X9 represents Night-time Light, and X10 represents GDP.
Land 15 00853 g007
Figure 8. Explanatory power of the interaction between natural environment and socio-economic factors on the spatial distribution pattern of different ecosystem services. Note: X1 represents Elevation, X2 represents Slope, X3 represents Aspect, X4 represents Mean Annual Precipitation, X5 represents Mean Annual Temperature, X6 represents Evaporation, X7 represents NDVI, X8 represents Population Density, X9 represents Night-time Light, and X10 represents GDP.
Land 15 00853 g008
Figure 9. Coupling coordination degree between urban land expansion intensity and ecosystem services in Lanzhou.
Land 15 00853 g009
Figure 10. Coupling coordination degree between urban land expansion rate and ecosystem services in Lanzhou.
Land 15 00853 g010
Table 1. Spatial resolution, sources, and usage of the data.
DataTimeResolutionSourceUsage Description
Land Use Remote Sensing Monitoring Dataset1980–202030 mResource and Environmental Science and Data Center (https://www.resdc.cn; accessed on 20 June 2025)Analyzing land use change and simulation
Soil Data-World Soil Database (https://www.fao.org/soils-portal/data-hub/soil-maps-and-databases/harmonized-world-soil-database-v12/en/; accessed on 20 June 2025)Quantifying ecosystem services
Meteorological Data-Resource and Environmental Science and Data Center (https://www.resdc.cn; accessed on 20 June 2025)
DEM, Slope, Aspect90 mResource and Environmental Science and Data Center (https://www.resdc.cn; accessed on 20 June 2025)Analyzing driving factors of ecosystem services; Driving factors for land use change simulation
Mean Annual Temperature1 kmCopernicus Publications
Mean Annual Precipitation1 kmCopernicus Publications
Evaporation1 kmResource and Environmental Science and Data Center (http://www.resdc.cn; accessed on 20 June 2025)
NDVI1 kmNASA
Population Density1 kmResource and Environmental Science and Data Center (https://www.resdc.cn; accessed on 20 June 2025)
GDP1 kmResource and Environmental Science and Data Center (https://www.resdc.cn; accessed on 20 June 2025)
Night-time Light1 kmScientific Data
Disclaimer/Publisher’s Note: The statements, opinions and data contained in all publications are solely those of the individual author(s) and contributor(s) and not of MDPI and/or the editor(s). MDPI and/or the editor(s) disclaim responsibility for any injury to people or property resulting from any ideas, methods, instructions or products referred to in the content.