Article

How Does the Built Environment Shape Urban Vitality Across Multiple Scales? A Nonlinear Comparative Analysis of Chengdu and Chongqing in China


Jangho Architecture College, Northeastern University, Shenyang 110169, China
*
Author to whom correspondence should be addressed.
Land 2026, 15(5), 844; https://doi.org/10.3390/land15050844 (registering DOI)
Submission received: 24 March 2026 / Revised: 11 May 2026 / Accepted: 12 May 2026 / Published: 14 May 2026

Abstract

The built environment is the core material carrier shaping urban vitality, and its impact on urban vitality constitutes a key research hotspot in urban geography and urban–rural planning. Most existing studies focus on single cities and single scales. They pay insufficient attention to the heterogeneity of their relationship across different city types and spatial scales. They also lack a systematic framework for multi-dimensional comparative analysis. This study takes Chengdu and Chongqing as cases. They are the core cities of the Chengdu–Chongqing Twin-City Economic Circle. Three grid scales are applied. Using the XGBoost–SHAP-integrated model, this paper explores the differences in indicator importance, nonlinear impacts, and threshold effects of built environment on urban vitality. The objectives of this study are as follows: (1) This study will reveal the spatiotemporal differentiation characteristics and patterns of urban vitality across multiple cities, multiple grid scales, and multiple time periods. (2) This study will identify the relative importance of built environment indicators and their heterogeneous patterns across different cities and grid scales. (3) This study will clarify the nonlinear relationship between the built environment and urban vitality, as well as grid-scale differences and city differences. The results show the following: (1) Urban vitality exhibits significant distribution differences across cities, grid scales, and times. (2) In terms of relative importance, mean building height and building density are both important influencing indicators of urban vitality at multiple grid-scales in different cities. The effects of certain built environment indicators on urban vitality vary across cities and grid scales. Road intersection density plays a prominent role in Chengdu, while commercial accessibility has a significant influence in Chongqing. As the scale changes, indicators including road density, road intersection density, and commercial accessibility demonstrate distinct variation patterns. (3) The nonlinear effects of the built environment on urban vitality are significant and differ across cities and grid scales. The nonlinear effects of certain built environment indicators in Chongqing are more complex than those in Chengdu. As the scale changes, the nonlinear effect trends and thresholds of certain built environment indicators also show significant variations. Based on multi-city and multi-scale spatial analysis, this study deepens our systematic understanding of the relationship between the built environment and urban vitality. It provides a quantitative basis for understanding the interaction between human activities and physical spaces in different types of cities and at different grid scales. It also provides a referable paradigm for multi-dimensional analysis in similar studies.

1. Introduction

Chinese cities are transforming and developing from incremental expansion to stock renewal. Enhancing urban vitality (UV) has gradually become the core task for implementing the people-oriented development concept and promoting urban sustainable development. UV, as an important indicator for measuring the attractiveness and livability of a city, directly reflects the development of the urban economy and the improvement of residents’ lives [1,2,3]. However, during the past rapid urbanization process, problems such as the decline of old urban areas, population outflow, and “ghost cities” have emerged [4]. The core issue lies in the imbalance between the built environment (BE) and the demands of human activities. Therefore, analyzing the intrinsic relationship between BE and UV, optimizing the stock space to improve urban vitality, has become a research focus in the field of urban planning [5].

1.1. Urban Vitality and Measurement Methods

The evolution of the concept of UV is centered around the interaction between human activities and the spatial environment. Early relevant theories can be traced back to the UV concept proposed by Jacobs in The Death and Life of Great American Cities. Its core lies in emphasizing human interaction and activity diversity at the street level [6]. Lynch further expanded its connotation, stating that UV represents the ability of urban form to support the core functional demands of human beings [7]. Montgomery focused on sensory experience and activity continuity, pointing out that vibrant spaces should support people’s all-day use of diverse facilities and social interactions [8]. Although a unified definition of UV has not yet been reached in academia, it is widely accepted in existing studies to regard UV as the representation of the intensity and frequency of urban spaces attracting and carrying human socio-economic activities. The assessment methods of UV have evolved from small-scale static description to large-scale dynamic quantification along with technological development. Early studies mostly relied on traditional methods such as field investigations, interviews and questionnaires to conduct small-scale evaluations [9]. For example, some scholars analyzed the influencing factors of neighborhood-level vitality through community interviews and street observations [10]. The emergence of big data has provided new methods for UV measurement. Static data such as POI density and land use diversity are used to reflect the potential for vitality [11,12,13]. Nighttime light data is often used to assess macroeconomic vitality [14,15,16]. Dynamic data such as mobile phone signaling, social media check-ins, and taxi trajectories have enabled real-time capture of the spatiotemporal characteristics of human activities [17,18,19]. Among them, Baidu heatmap data, with its advantages of high resolution, wide coverage, and strong temporal continuity, has become a high-quality data source for dynamic UV measurement. For example, Jiang et al. [20] and Lv et al. [21] used Baidu heatmap data to study the correlation between urban form and vitality, effectively compensating for the lack of a time dimension in POI data and the privacy restrictions in mobile signaling data. Based on the above theoretical consensus and quantitative approach, characterizing UV by crowd gathering intensity directly reflects the capacity of spaces to support and attract human activities. This provides a unified quantitative basis for identifying the impacts of various BE indicators on UV. It also supports the subsequent comparative studies across different cities and multiple grid scales.
Although the assessment methods of UV are constantly updated, most studies still focus on the vitality assessment at specific time points, paying less attention to the differentiated characteristics of UV presented during the dynamic changes over time. The studies of Niu et al. [22] and Ouyang et al. [23] confirm that there is a significant diurnal variation pattern of the BE factor affecting UV. Therefore, analyzing the UV characteristics at different time periods and the changes in their relationship with influencing factors is of vital importance for optimizing the urban stock space and enhancing the overall vitality of the city.

1.2. Relationship Between Built Environment and Urban Vitality

BE serves as the material carrier and spatial foundation for human activities in urban spaces. It refers to the totality of buildings, roads, public spaces, functional facilities, and their spatial combinations formed through human construction [11]. Its structural characteristics and spatial configuration directly shape the patterns of crowd gathering and activity intensity. Thus, it acts as the core physical element that shapes UV [24,25]. Early research on BE focused on Jacobs’ proposition of “high density, small blocks, diverse buildings”, emphasizing the compatibility between the material form of BE and human activities. Based on this, Cervero and Kockelman proposed that the “3D” framework includes three dimensions: “Density, Diversity and Design” [26]. Ewing and Cervero further expanded the framework into the “5D” system, adding two dimensions of “Destination accessibility” and “Distance to transit” [27], forming the BE assessment framework that is widely used in current urban research. Indicator selection is carried out based on the 5D framework mentioned above. It systematically covers the key dimensions and inherent attributes of the BE. The research indicator system is thus established. It provides a unified analytical foundation for subsequent comparative studies on the BE–UV relationship across different cities and multiple grid scales.
The relationship between BE and UV shows significant scale dependence. Existing studies have adopted various research scales such as blocks, sub-districts, and grids for exploration. Ling et al. [28] and Lu et al. [29] focused on the effects of micro-space on local vitality at the scale of neighborhoods. Some researchers also used sub-districts or grids as research units to analyze the correlation between regional space and vitality [30,31]. Regarding the selection of grid scales, 500 m, 1000 m, and 1500 m are widely used spatial units in studies of BE and UV. Yang et al. [32] and Duan et al. [33] adopted the 500 m grid for refined analyses in Shenzhen, Beijing, and Chengdu. Zhan et al. [31] applied the 1000 m grid to conduct research on Hangzhou. Other studies have used even larger grids to explore regional vitality in areas such as the Pearl River Delta urban agglomeration [34]. The 500 m grid supports refined analyses of community walking spaces, convenient service facilities, and block micro-renewal. The 1000 m grid is suitable for identifying functional mixing, traffic organization, and vitality linkage mechanisms at the district level. The 1500 m grid can be used to evaluate public service radiation, resource coordination, and overall vitality distribution at the cluster level. Different grid scales correspond to differentiated spatial analysis granularities and can reveal the mechanism of the built environment’s influence on UV at multiple levels. However, most current studies are limited to single-scale analysis and lack comparisons of effect differences across multiple grid scales. Their conclusions are difficult to fully adapt to urban construction work at different levels. Meanwhile, most of the existing studies focus on a single city. Although the basic effect relationship between BE and UV has been revealed, there is a lack of systematic comparisons among different types of cities. Most studies have focused on cities with flat terrain and homogeneous space [33,35], while paying insufficient attention to those with complex topography and unique spatial patterns. They neglect the reshaping effect of regional background characteristics on the mechanism of BE. Conclusions drawn solely from single-city studies cannot be directly applied to the planning practice of other types of cities, and also suffer from inadequate adaptability. Therefore, exploring the effects of the BE on UV across different cities and grid scales, while revealing their commonalities and heterogeneous patterns, can reduce universal decisions that ignore differences in urban planning decisions.

1.3. Research Objectives and Structure

To fill the aforesaid research gaps, this research is carried out across three key dimensions. In the urban dimension, it focuses on two cities: Chengdu and Chongqing. In the scale dimension, it adopts three grid scales as research units: 500 m × 500 m, 1000 m × 1000 m, and 1500 m × 1500 m. In the temporal dimension, it covers four time periods, including daytime and nighttime on both weekdays and weekends. XGBoost–SHAP model is employed to explore the nonlinear effects of BE on UV across different cities, different grid scales, and different time periods. The specific research objectives are as follows: (1) This study will reveal the spatiotemporal differentiation characteristics and patterns of UV across multiple cities, multiple grid scales, and multiple time periods. (2) This study will identify the relative importance of BE indicators and their heterogeneous patterns across different cities and grid scales. (3) This study will clarify the nonlinear relationship between BE and UV, as well as the grid-scale differences and city differences.
The structure of this paper is organized as follows. Section 2 presents the research design and methodology, including the study area, research framework, indicator system, and model construction. Section 3 demonstrates the main results, covering the spatiotemporal distribution characteristics of UV, the relative importance of BE indicators, as well as the nonlinear effects and threshold effects. Section 4 provides further discussion, focusing on the impact differences across different cities and grid scales, and clarifies the research limitations and future directions. Section 5 summarizes the main conclusions of this study.

2. Materials and Methods

2.1. Study Area

Chengdu and Chongqing are the only two megacities in western China. As the core carriers of the Chengdu–Chongqing Twin-City Economic Circle, they hold an important strategic position in China’s urbanization pattern. The two cities are adjacent to each other and share similar development levels. However, they differ significantly in natural conditions, spatial structure, and development models, making them ideal samples for the comparative study of BE and UV [36].
From the perspective of natural conditions, Chengdu is located on the Chengdu Plain in the western Sichuan Basin. It features flat and open terrain with strong spatial continuity and homogeneous urban expansion, representing a typical plain city. Chongqing is situated in the parallel ridge-and-valley region of eastern Sichuan, at the confluence of the Yangtze River and Jialing River. It experiences dramatic topographic fluctuations and is obviously divided by mountains and water systems, making it a representative mountainous city in China. In terms of urban spatial structure, Chengdu is dominated by a mono-centric, circular, and radial layout. The urban core is highly concentrated, and multiple groups develop collaboratively in the periphery, with continuous and balanced distribution of functions and population [37,38]. Chongqing presents a poly-centric and clustered spatial structure. The city is separated by natural landforms into several relatively independent development groups, each with relatively complete internal functions and prominent overall spatial heterogeneity [39,40]. Regarding the scale and socio-economic characteristics, Chengdu covers an area of 14,300 square kilometers. By the end of 2024, its permanent resident population was 21.474 million, with an urbanization rate of 80.80%. Chongqing covers an area of 82,400 square kilometers. In 2024, its permanent resident population was 31.9047 million, with an urbanization rate of 72.14%. Both cities are in the mature stage of urbanization with dense populations and complex functions, where the interaction between human activities and BE is intensive.
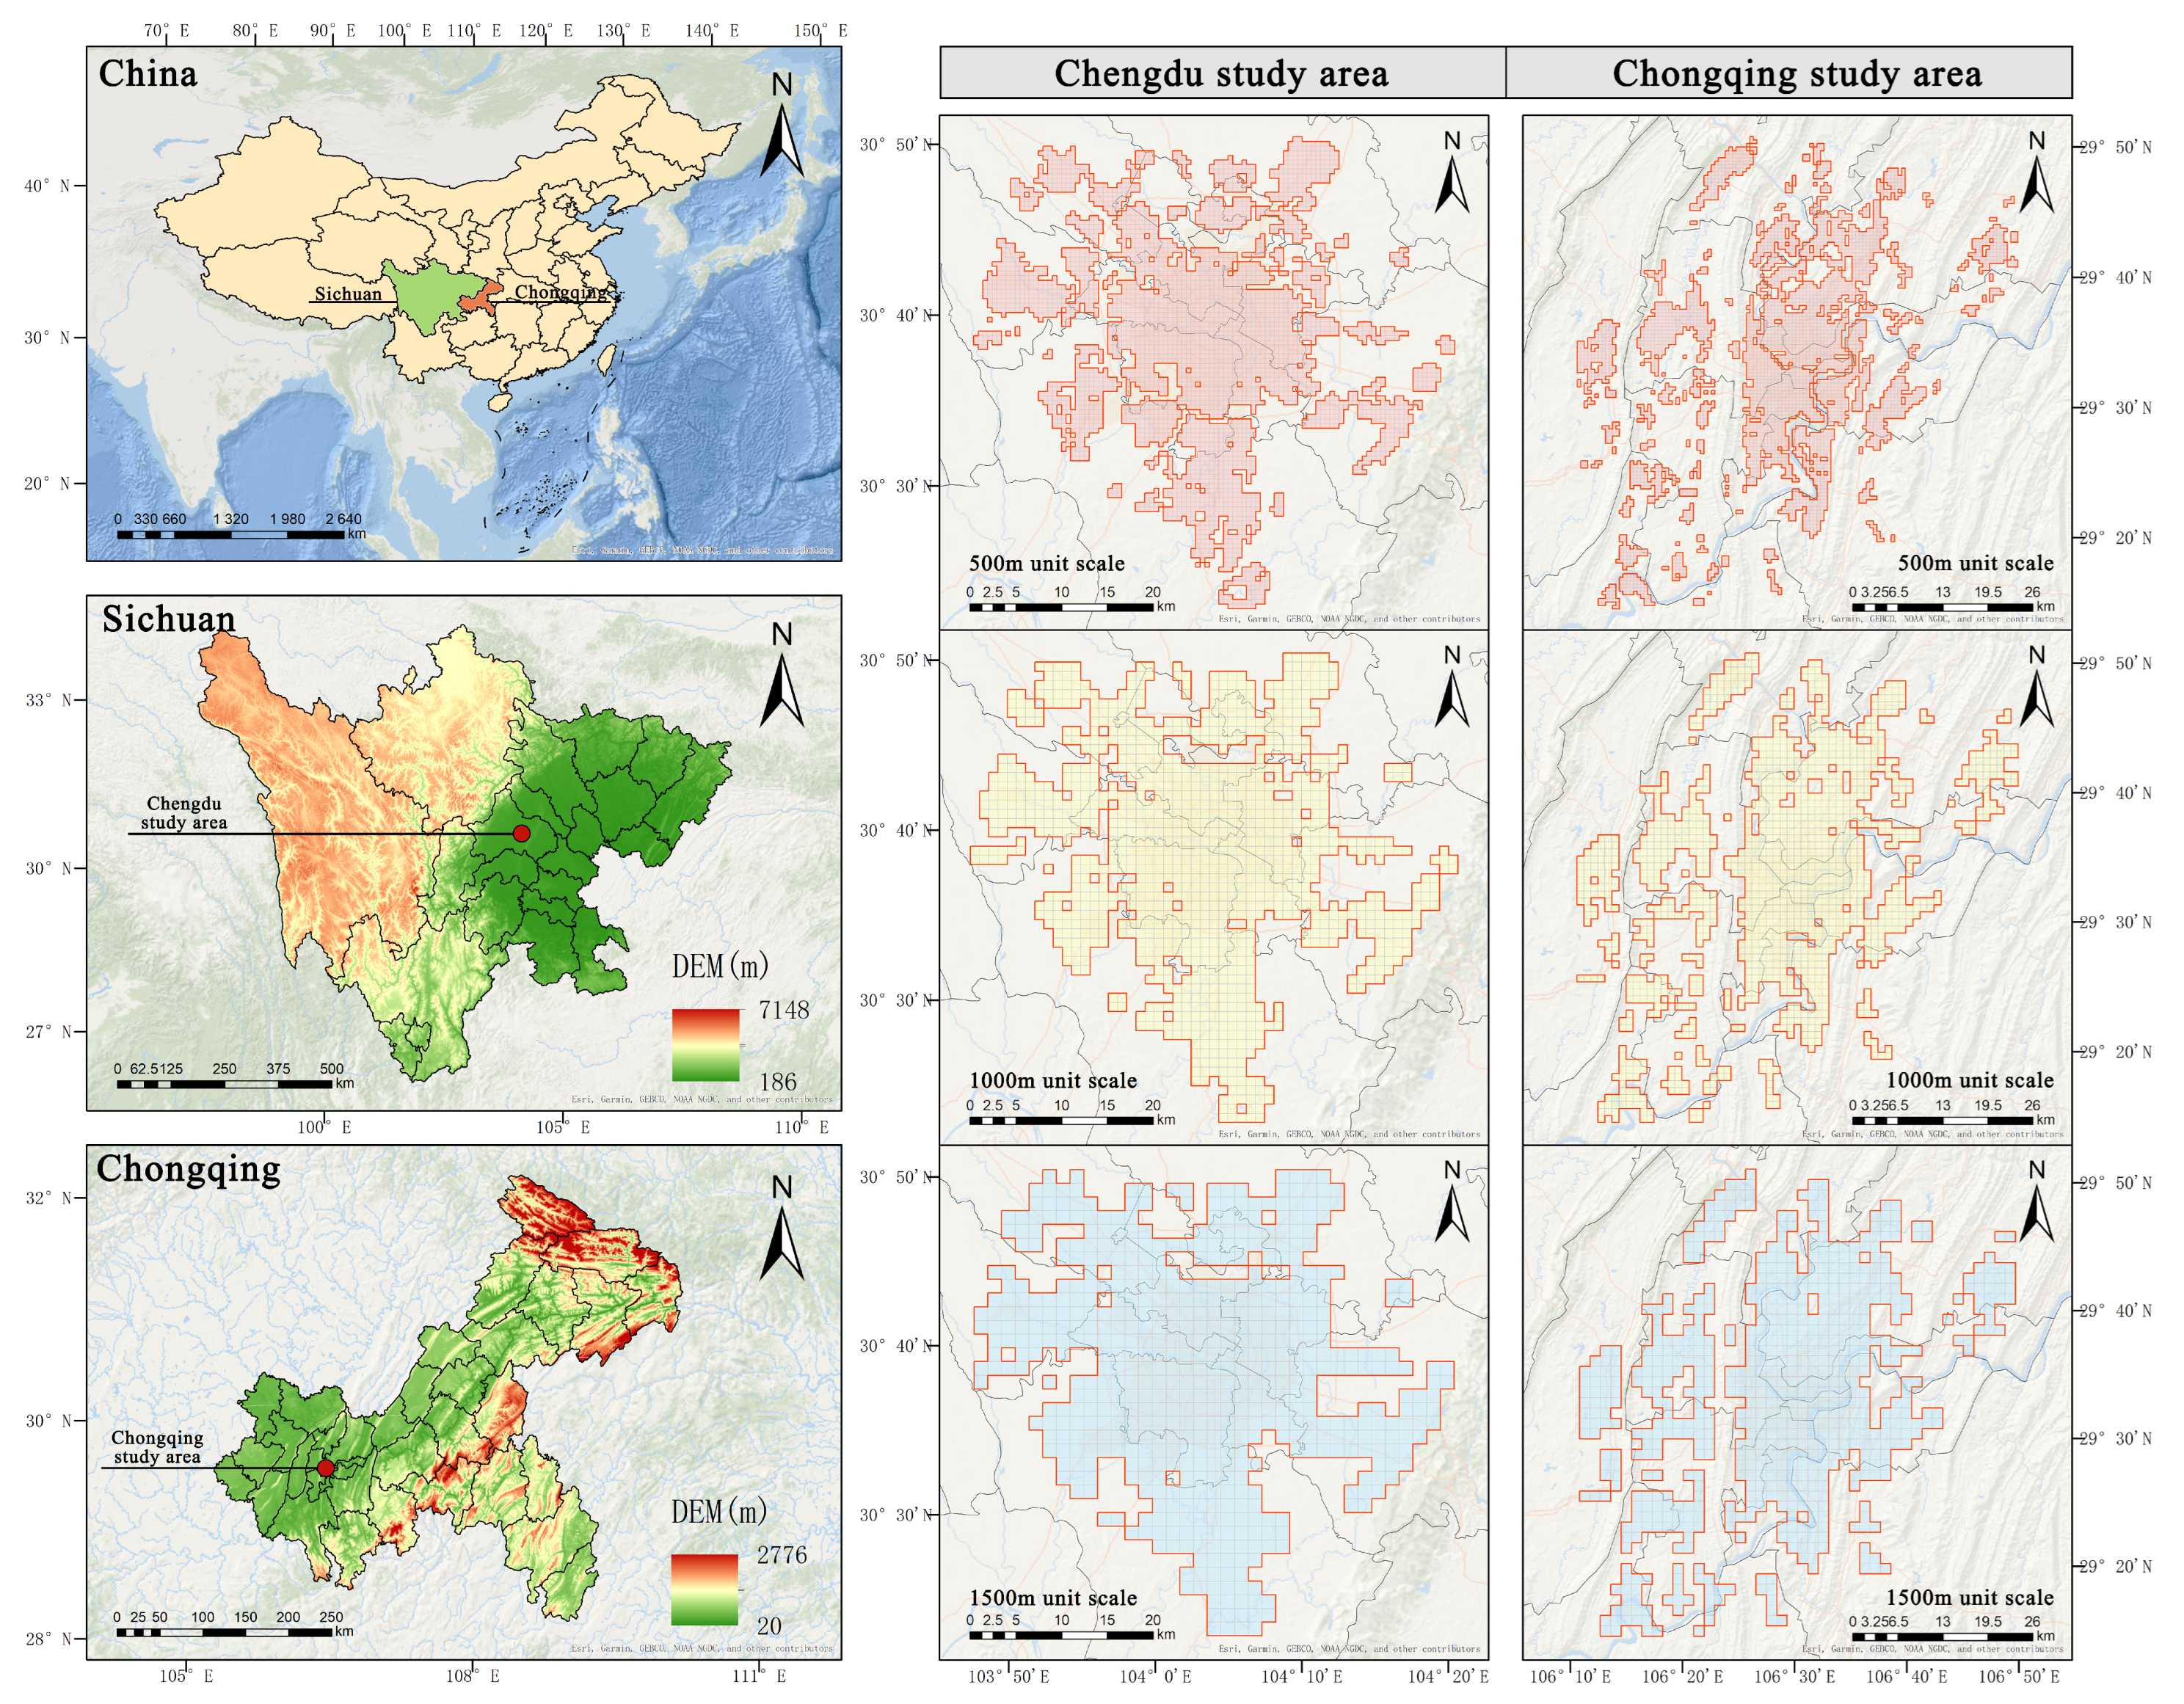
This research selected the built-up area of the central city in Chengdu and Chongqing as the study area. The study area of Chengdu involved the five traditional districts of Jinjiang, Qingyang, Jinniu, Wuhou, and Chenghua, as well as the surrounding districts of Longquanyi, Xindu, and Pi County, which are the core areas of population agglomeration and function composite in Chengdu. The Chongqing study area involved the central administrative districts such as Yuzhong District, Jiulongpo District, and Nan’an District, as well as the surrounding areas such as Shapingba District, Banan District, and Bishan County, which were the centralized bearing area of Chongqing’s economy, culture, and population. In terms of study area screening within the above administrative divisions, this research integrated data such as Baidu heatmap, land use nature, and building outlines to screen out spaces with valid information, eliminating non-urban areas, uncompleted urban areas, and mountain ranges and rivers within the urbanized areas. Finally, the built-up area of the central city with continuous urban BE and concentrated human activities was focused on, as shown in Figure 1.
This research adopted the nested grid method to divide the research units. Regular grids are adopted as the basic analytical units, with the advantages of standardized spatial scale and uniformly controllable granularity. It can strictly control the interference of scale variables and support the standardized horizontal comparison of the impacts of BE on UV under different resolutions. In contrast, traditional administrative boundaries suffer from irregular morphology, large differences in unit area, and difficulty in unifying scale hierarchies, which cannot satisfy the demands of multi-scale parallel comparison and quantitative attribution in this study. At the same time, it is objectively recognized that regular grid units cannot fully carry the urban social correlation characteristics implied by administrative jurisdictions. Therefore, this study only focuses on the influence of the law of BE on UV from a multi-scale grid perspective and does not attempt to cover the complex mechanisms at the level of urban administrative and social relations. This research adopted the nested grid method to divide the research units, setting three grid scales of 500 m × 500 m, 1000 m × 1000 m, and 1500 m × 1500 m to fully cover the study scope. After eliminating invalid units of Chengdu and Chongqing at each scale in accordance with the above screening principles, the quantities of final effective units are 3318 and 3448 at the 500 m grid scale, 1092 and 1257 at the 1000 m grid scale, and 574 and 688 at the 1500 m × 1500 m grid scale, which together constitute a multi-scale nested research unit system.

2.2. Research Framework

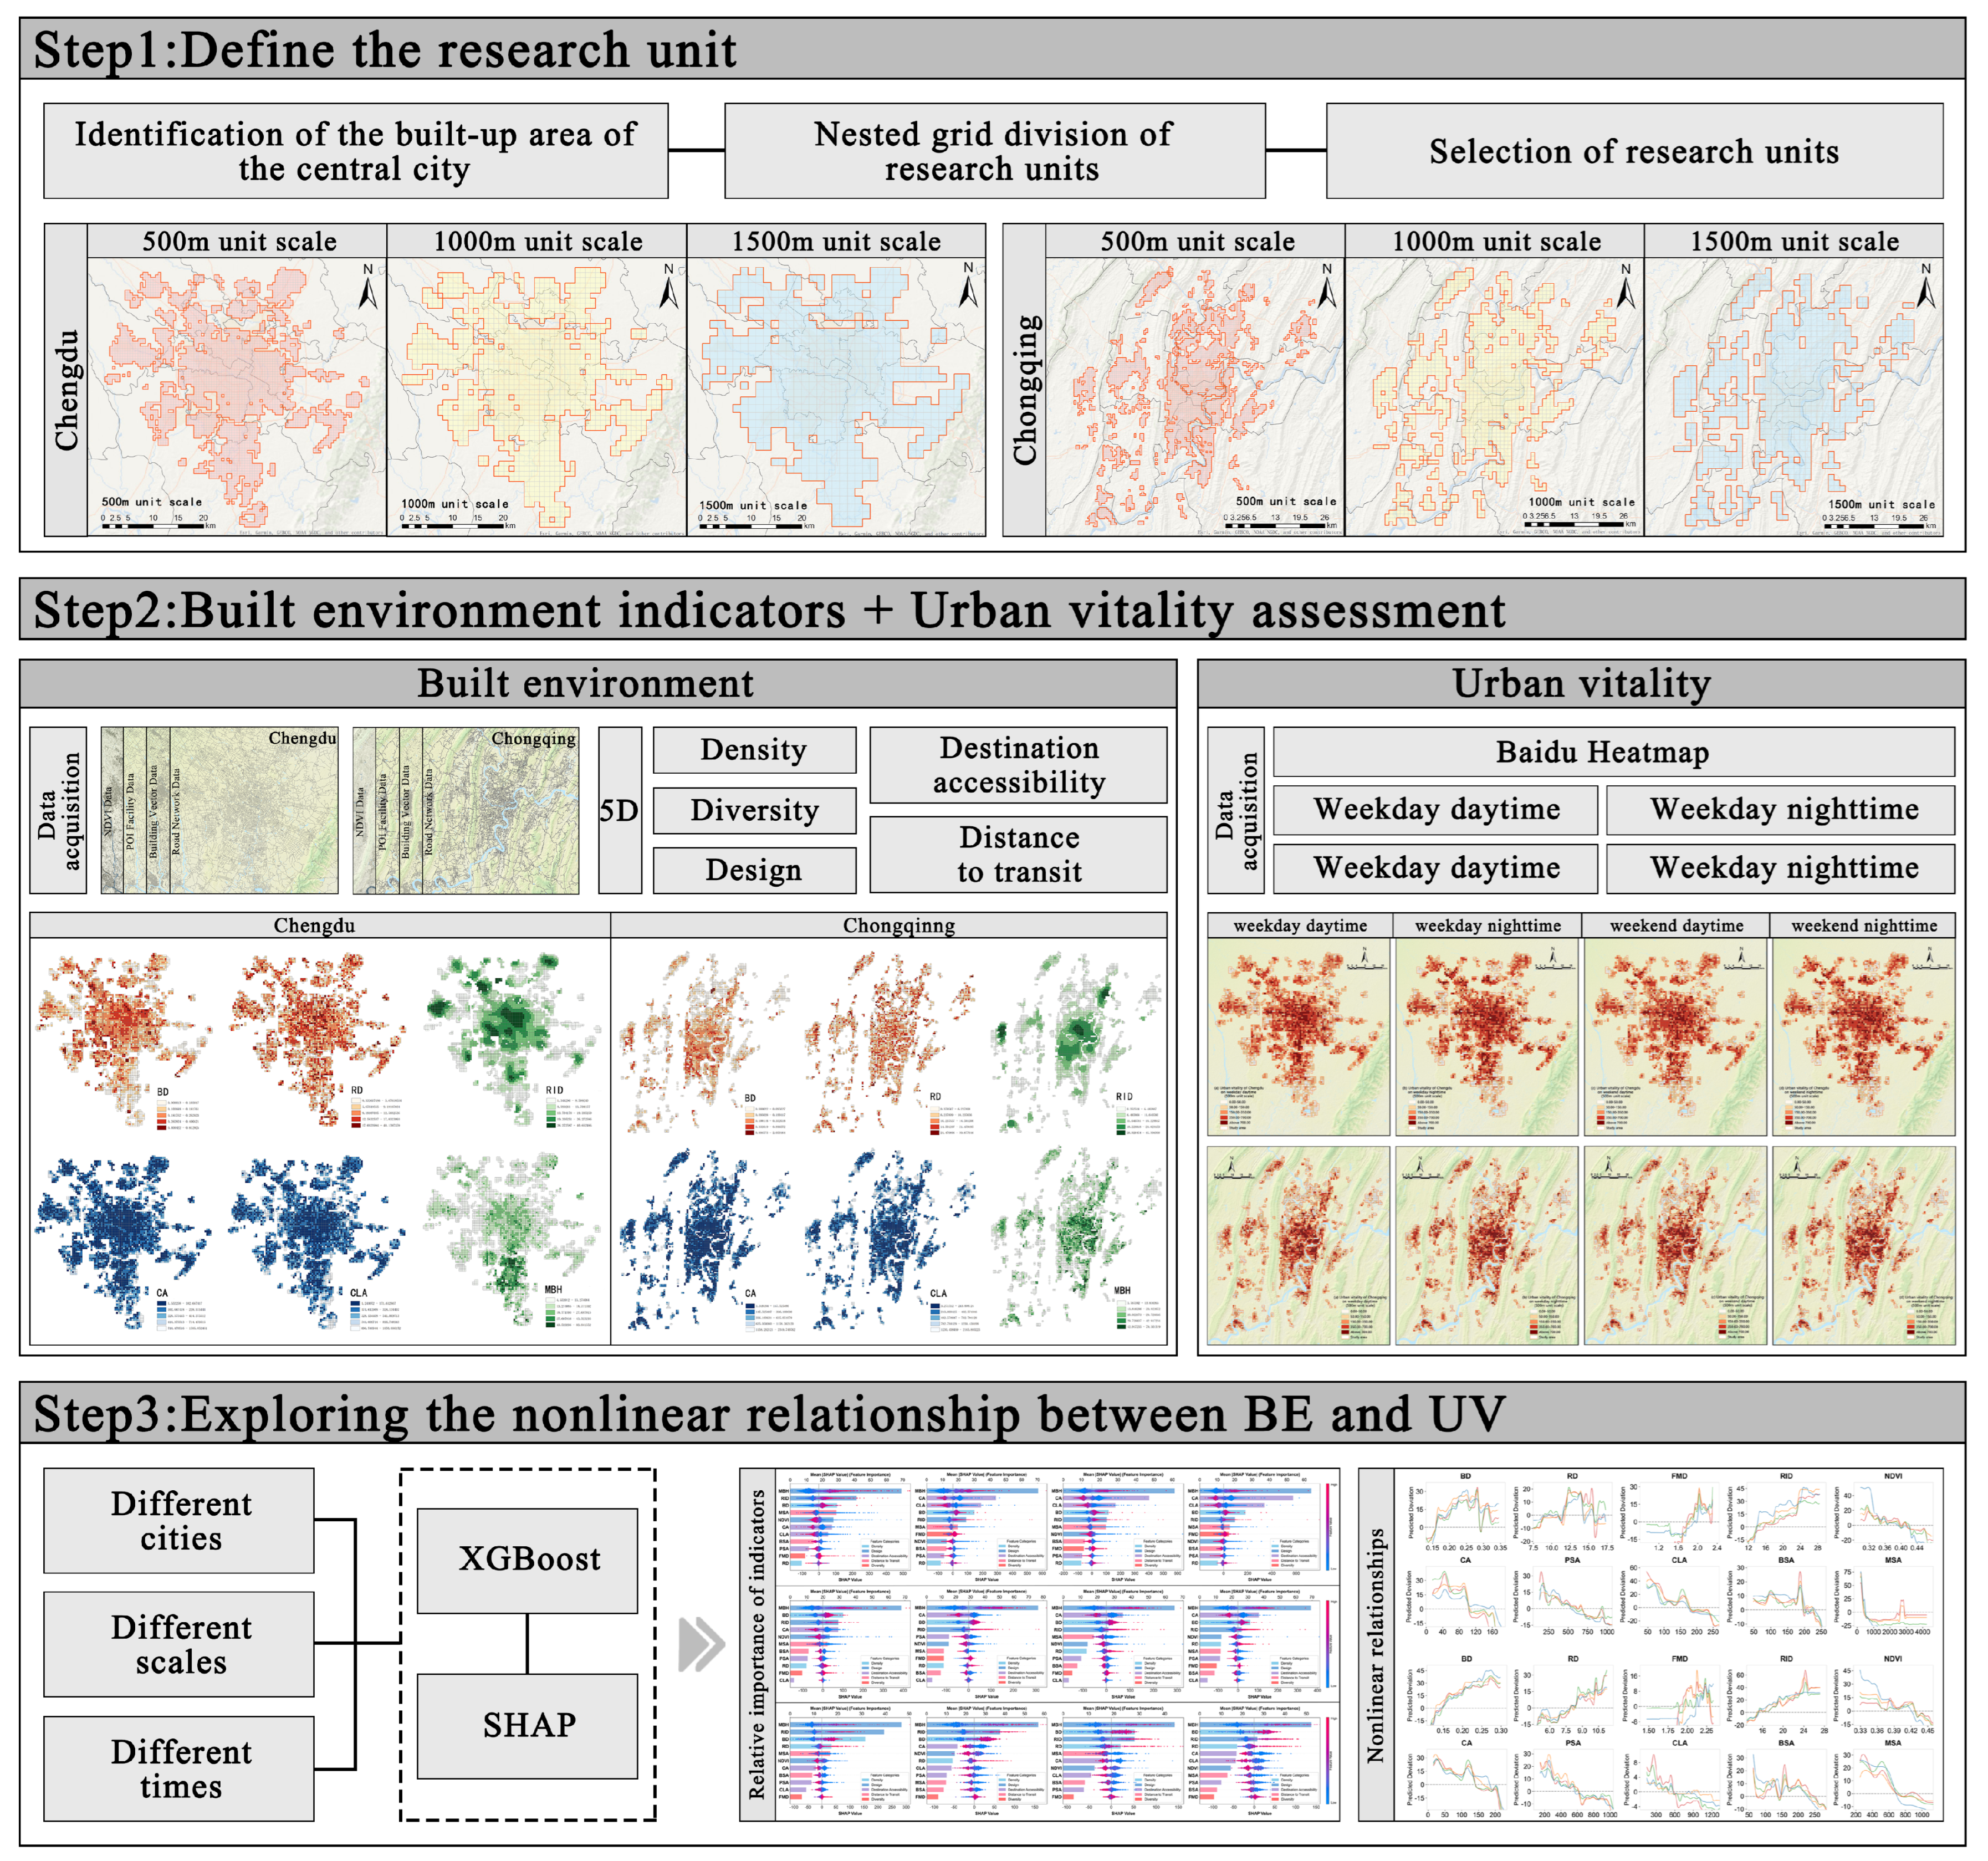
This research divided the study area into grids to explore the effects of BE in different cities, at different grid scales, and over different time periods on UV. The research framework is shown in Figure 2. The research framework consists of three main parts. The first part is the definition of the research units. First, the built-up areas of the central urban areas of the two cities are identified. Then, the nested grid division method is adopted to construct three scales of square grids, namely 500 m, 1000 m, and 1500 m. Finally, effective research units at each scale were screened and determined. The second part includes BE indicator extraction and UV assessment. On the one hand, BE indicators of each research unit were extracted from five dimensions based on the “5D” framework, including Density, Diversity, Design, Destination accessibility, and Distance to transit. On the other hand, Baidu heatmap data were collected to obtain crowd activity data for four periods, weekday daytime, weekday nighttime, weekend daytime, and weekend nighttime, so as to characterize UV levels at different periods. The third part is the multi-dimensional exploration of nonlinear relationships. Based on sample data across different cities, grid scales, and time periods, the XGBoost model was used to fit the nonlinear relationship between BE and UV, and the SHAP method was combined to interpret the relative importance of each indicator. Finally, the influence laws and heterogeneous characteristics of BE on UV were systematically revealed.

2.3. Variables and Date

2.3.1. Urban Vitality

Baidu heatmap data was used to characterize UV (https://lbs.baidu.com/, accessed on 5 December 2024). Based on the user location information of the Baidu Map LBS platform, this data was aggregated by GPS, Wi-Fi, and other positioning technologies, which could dynamically reflect the crowd aggregation intensity of different spatial units. This study adopts a comparative framework covering weekdays and weekends, as well as daytime and nighttime, to capture the daily rhythmic characteristics of UV and support the quantitative analysis of short-term disparities in UV. Long-cycle factors such as seasonal variations and unexpected events may introduce additional confounding variables, masking the stable influence mechanism of BE on UV and hindering the accurate identification of core research objectives. Accordingly, such factors are not incorporated into the analytical framework of this study. Finally, Baidu heatmap data for Chengdu and Chongqing from May to September 2024 was selected, including 12 sunny and cloudy days each, with 6 working days and 6 rest days for each city. Each day was divided into two time periods, daytime (8:00–17:00) and nighttime (18:00–22:00), and the average heatmap value of each time point within the period was calculated. Then, combined with the area of each research unit, the corresponding UV was obtained.

2.3.2. Built Environment

As shown in Table 1, based on the “5D” indicator system and combined with the actual situation of urban built-up areas in the study cities, this study constructs a BE indicator system containing 5 dimensions and 11 indicators. Specifically, the Density dimension includes Building Density (BD) [41,42] and Road Network Density (RD) [41,42,43]; the Diversity dimension includes Functional Mix Degree (FMD) [44,45]; the Design dimension includes Road Intersection Density (RID) [44,46], the Normalized Difference Vegetation Index (NDVI) [30,46], and Mean Building Height (MBH) [45,47]; the Destination accessibility dimension includes Commercial Accessibility (CA) [30,35,48], Park and Square Accessibility (PSA) [9,49], and Cultural and Leisure Accessibility (CLA) [30,48]; and the Distance to transit dimension includes Bus Stop Accessibility (BSA) [9,46] and Metro Station Accessibility (MSA) [9,50].

2.4. Model Construction

Early studies on the relationship between BE and UV mostly relied on traditional linear models such as OLS and GWR [51,52]. However, the complexity of the urban system determines that the relationship between them is not simply linear. With the deepening of research, the nonlinear relationship and threshold effects between them have gradually become the core of academic attention. Machine learning methods such as random forest and gradient-boosted decision tree have shown significant advantages in related research due to their powerful nonlinear fitting ability and anti-interference. Among them, the Extreme Gradient Boosting (XGBoost) model optimizes the prediction accuracy through the ensemble learning framework, which can effectively handle high-dimensional data and capture the complex interaction effects between indicators, and has been proven to be an effective tool for analyzing the nonlinear relationship between BE and UV [28]. Although the prediction performance of the XGBoost model was excellent, its “black box” nature limited the explanation of the mechanism of variable effects [53]. Therefore, the Shapley Additive exPlanations (SHAP) method was introduced to enhance the interpretability of the model. This method is based on the Shapley value principle in game theory. By quantifying the marginal contribution of each BE feature to the model’s prediction results, it realized the global and local analysis of the model’s decision-making process [54]. Therefore, XGBoost–SHAP not only retained the advantages of nonlinear fitting of the model, but also made up for the defects of its lack of interpretability. It provided a clear quantitative basis for revealing the relationship mechanism between BE and UV.
The XGBoost model was employed to analyze the nonlinear relationship between BE and UV across different cities, grid scales, and time periods. For the core parameters of XGBoost, this research divided the dataset into a training set and test set according to the ratio of 8:2 and optimized the parameter combination through grid search. The test results show that, when n_estimators = 300, learning_rate = 0.1, and max_depth = 5, the model achieved the best R2 score on the test set, ensuring both fitting accuracy and good generalization ability.

3. Results

3.1. The Spatiotemporal Characteristics of Urban Vitality

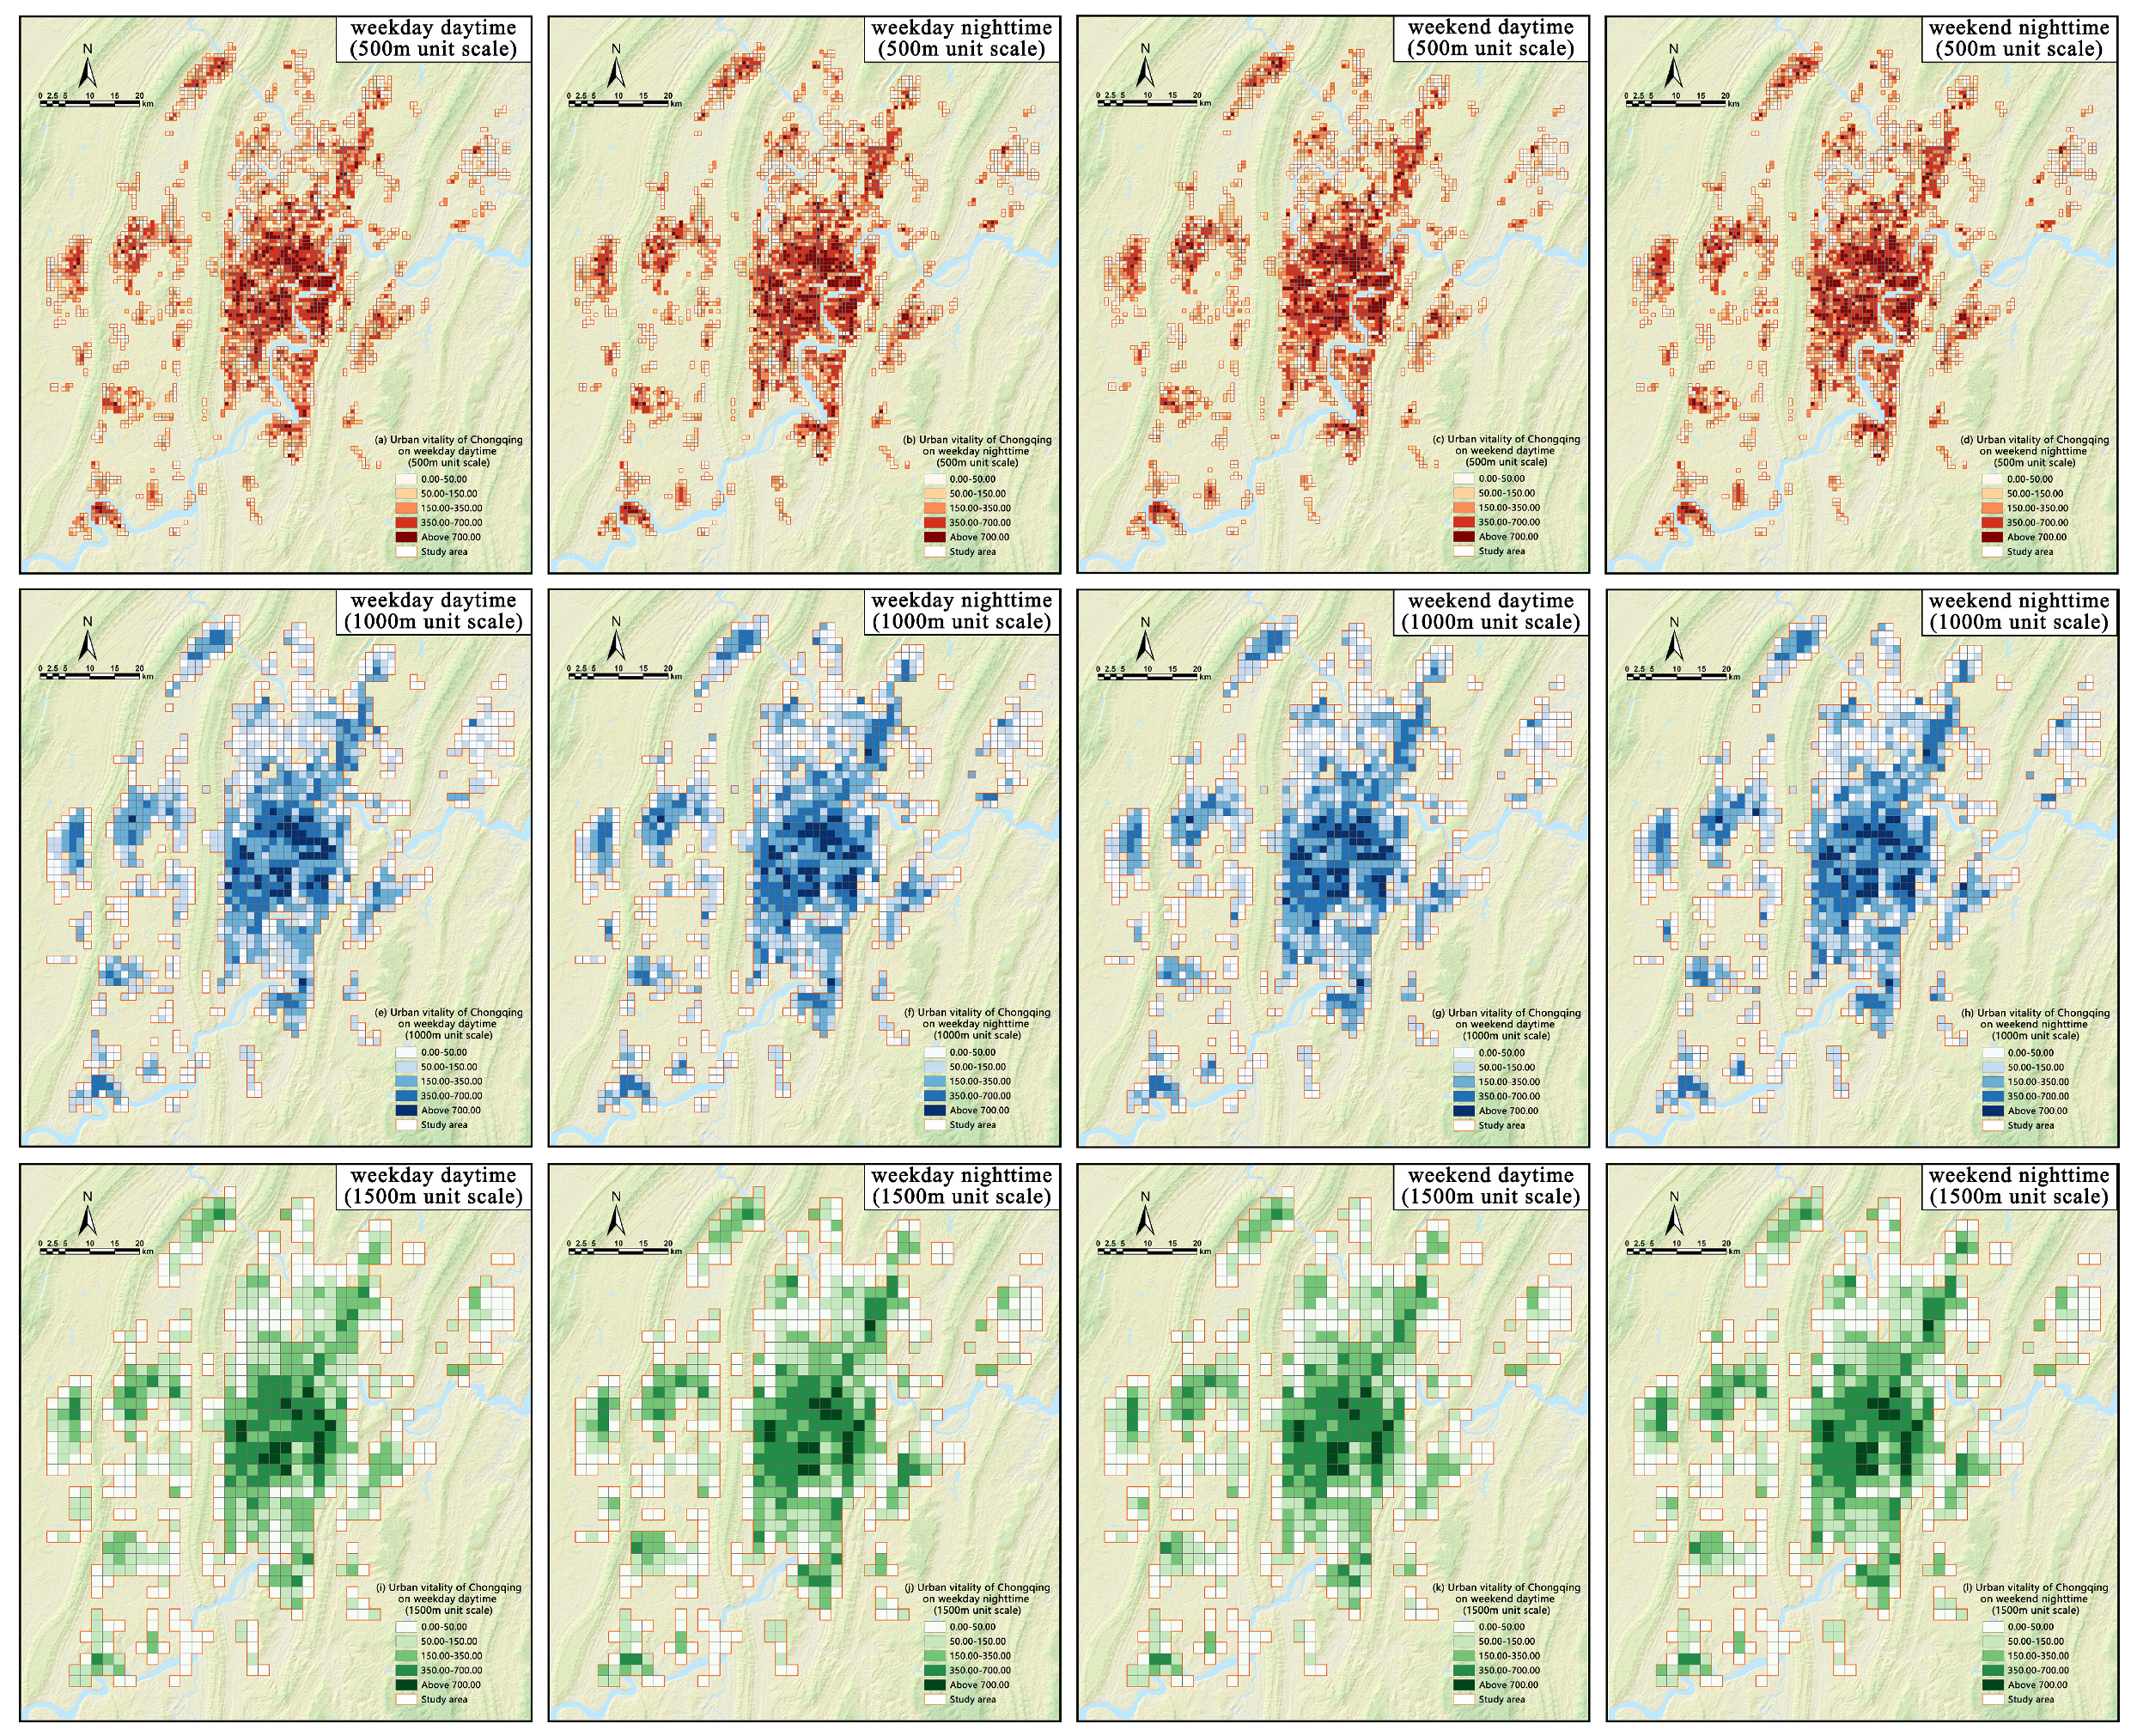
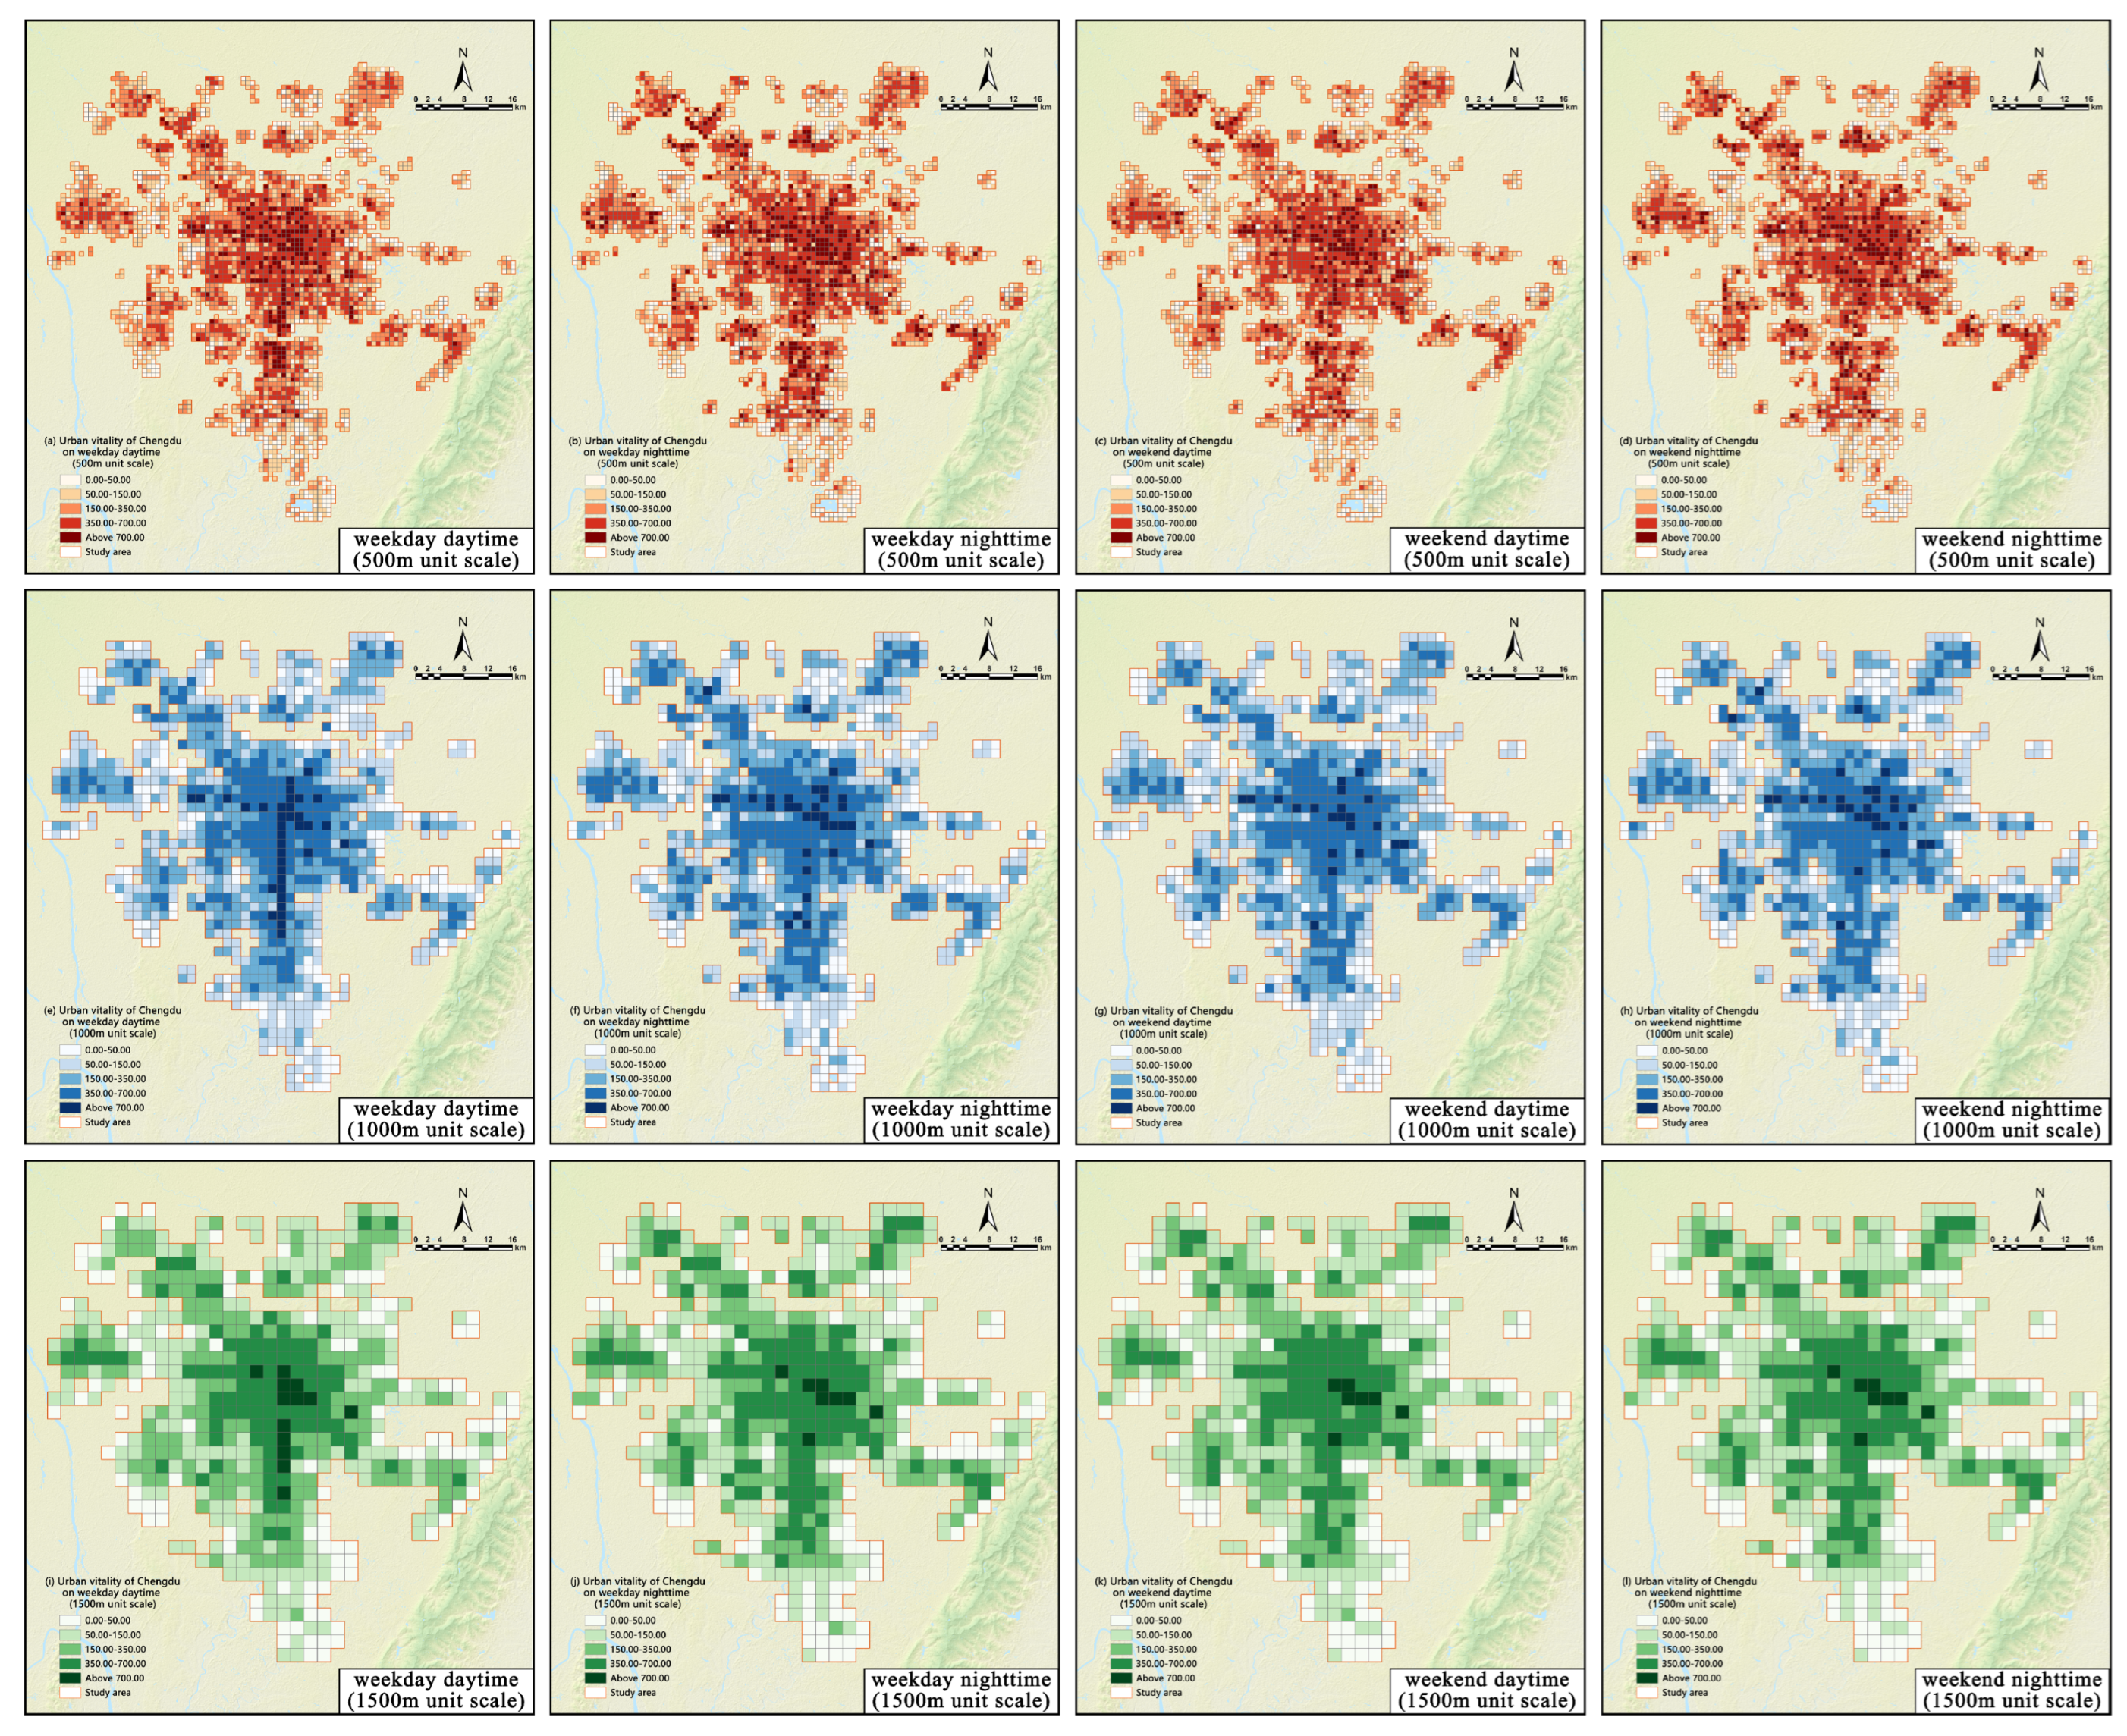
UV in Chengdu is higher on weekdays than on weekends and higher in the nighttime than in the daytime. In Chongqing, UV is higher in the nighttime than in the daytime, while the difference in UV between weekdays and weekends is negligible. In terms of the mean value, Chengdu’s UV is higher than that of Chongqing. In terms of the standard deviation, the variation in UV in Chongqing is more pronounced. These differences in time periods and cities reflect how UV is shaped by the rhythm of human activities across time periods and distinct urban spaces. The results of Global Moran’s I test indicate that Moran’s I values of UV are all higher than 0.4. All corresponding p-values are less than 0.001, and Z-scores exceed 29. UV presents significant spatial autocorrelation characteristics. Figure 3 and Figure 4 show the spatial distribution of UV in Chengdu and Chongqing with three unit scales of 500 m, 1000 m, and 1500 m in the daytime and nighttime of weekdays and weekends.
From the perspective of the spatial distribution of UV in different cities: The distribution pattern of UV in Chengdu presents a structure of one primary core with multiple secondary cores and a central radial layout. The one primary core refers to the primary UV core formed by the high UV values in the five traditional central districts. The multiple secondary cores denote the regional vitality cores formed in the surrounding districts and counties. The central radial layout indicates the radial high-UV-value zones along the connecting lines from the primary UV core to the secondary regional cores in the surrounding areas. The UV distribution pattern in Chongqing presents a structure of a single urban agglomeration with multiple cores separated by mountains and rivers. The single urban agglomeration with multiple cores refers to the high-UV-value zone of the central UV formed by the convergence of multiple cores such as the central Yuzhong District, the eastern part of Jiulongpo District, and the western part of Nan’an District, as well as the regional vitality cores formed by the scattered distribution of multiple cores in the surrounding districts and counties. Being separated by mountains and rivers means that the urban center forms a multi-core converged central area due to river barriers, while the surrounding areas form multiple scattered regional cores due to mountain barriers. The two cities exhibit distinctly different UV spatial distribution patterns. In terms of spatial variation in UV, Chengdu shows a high level of continuity with gentle changes, whereas Chongqing has poor continuity with drastic changes. Such differences may be associated with the distinct development models adopted by the two cities under different natural base conditions.
From the perspective of the spatial distribution of UV at different grid scales: Firstly, in terms of the overall distribution of UV, the 500 m grid scale shows the most detailed pattern. And as the scale increases, the distribution structure of UV becomes more intuitive. Secondly, in terms of the differences in UV focal points, the mean value of UV data decreases and the influence of extreme values weakens as the scale increases. As can be seen from Figure 3 and Figure 4, the UV distribution shows that, as the scale increases, the regional vitality becomes more uniform and integrated, and the differences are relatively reduced. At the same time, the number of high-value areas decreases, and high vitality is concentrated in specific regions. Therefore, comparing the differences in UV distribution at various grid scales can provide an intuitive reference for the actual work of improving UV at different levels.
From the perspective of the spatial distribution of the UV in different time periods: Firstly, a comparison between daytime and nighttime shows that high UV values converge in the core areas at daytime while spreading to the peripheral areas at nighttime. This might be related to the different activities at daytime and nighttime and their effects on the utilization of functional spaces. In the daytime, human activities are mainly focused on work, thus gathering in the core area. In the nighttime, activities mainly center around living, and they disperse to the periphery of the city. Secondly, in comparison between weekdays and weekends, high UV values concentrate in several hotspots within the core areas on weekdays, while they are relatively evenly distributed across the core areas on weekends. Finally, the reason why changes in Chongqing’s UV are less obvious than those in Chengdu may be that the development of Chongqing’s urban functional spaces is constrained by natural conditions. Its spatial functional mixing degree is higher than that of Chengdu, resulting in smaller temporal changes in people’s activity spaces.

3.2. The Relative Importance of Built Environment on Urban Vitality

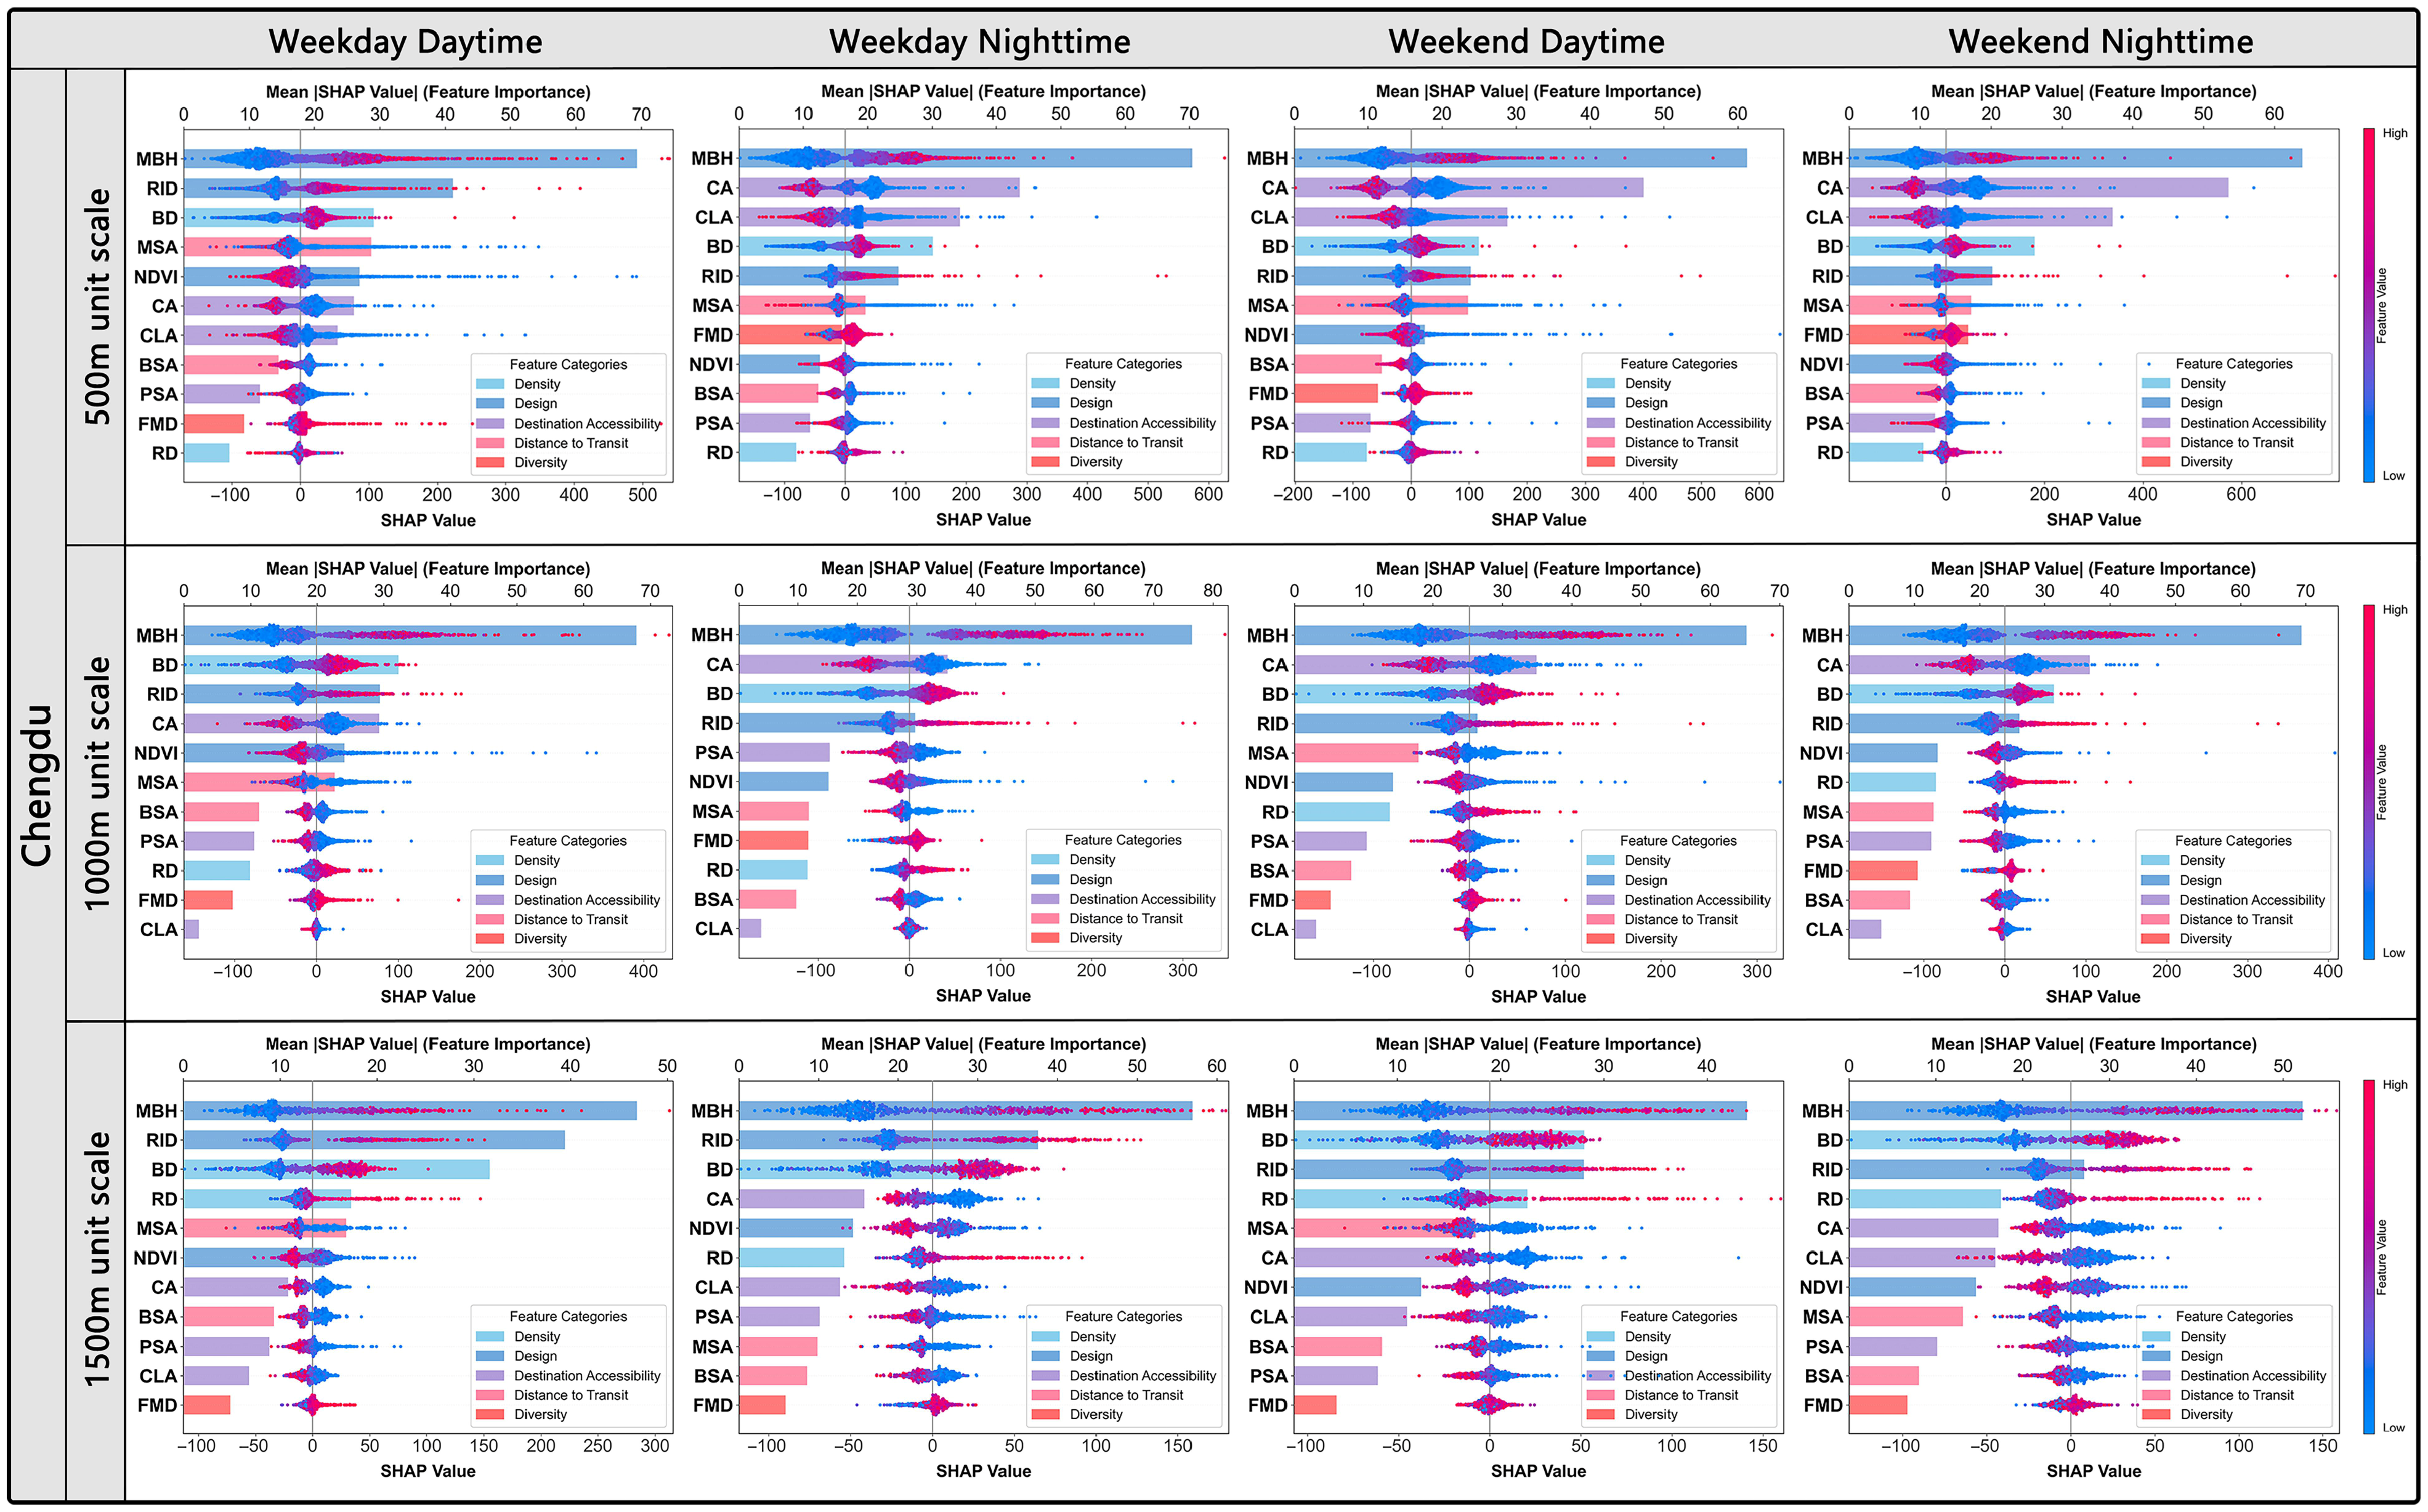
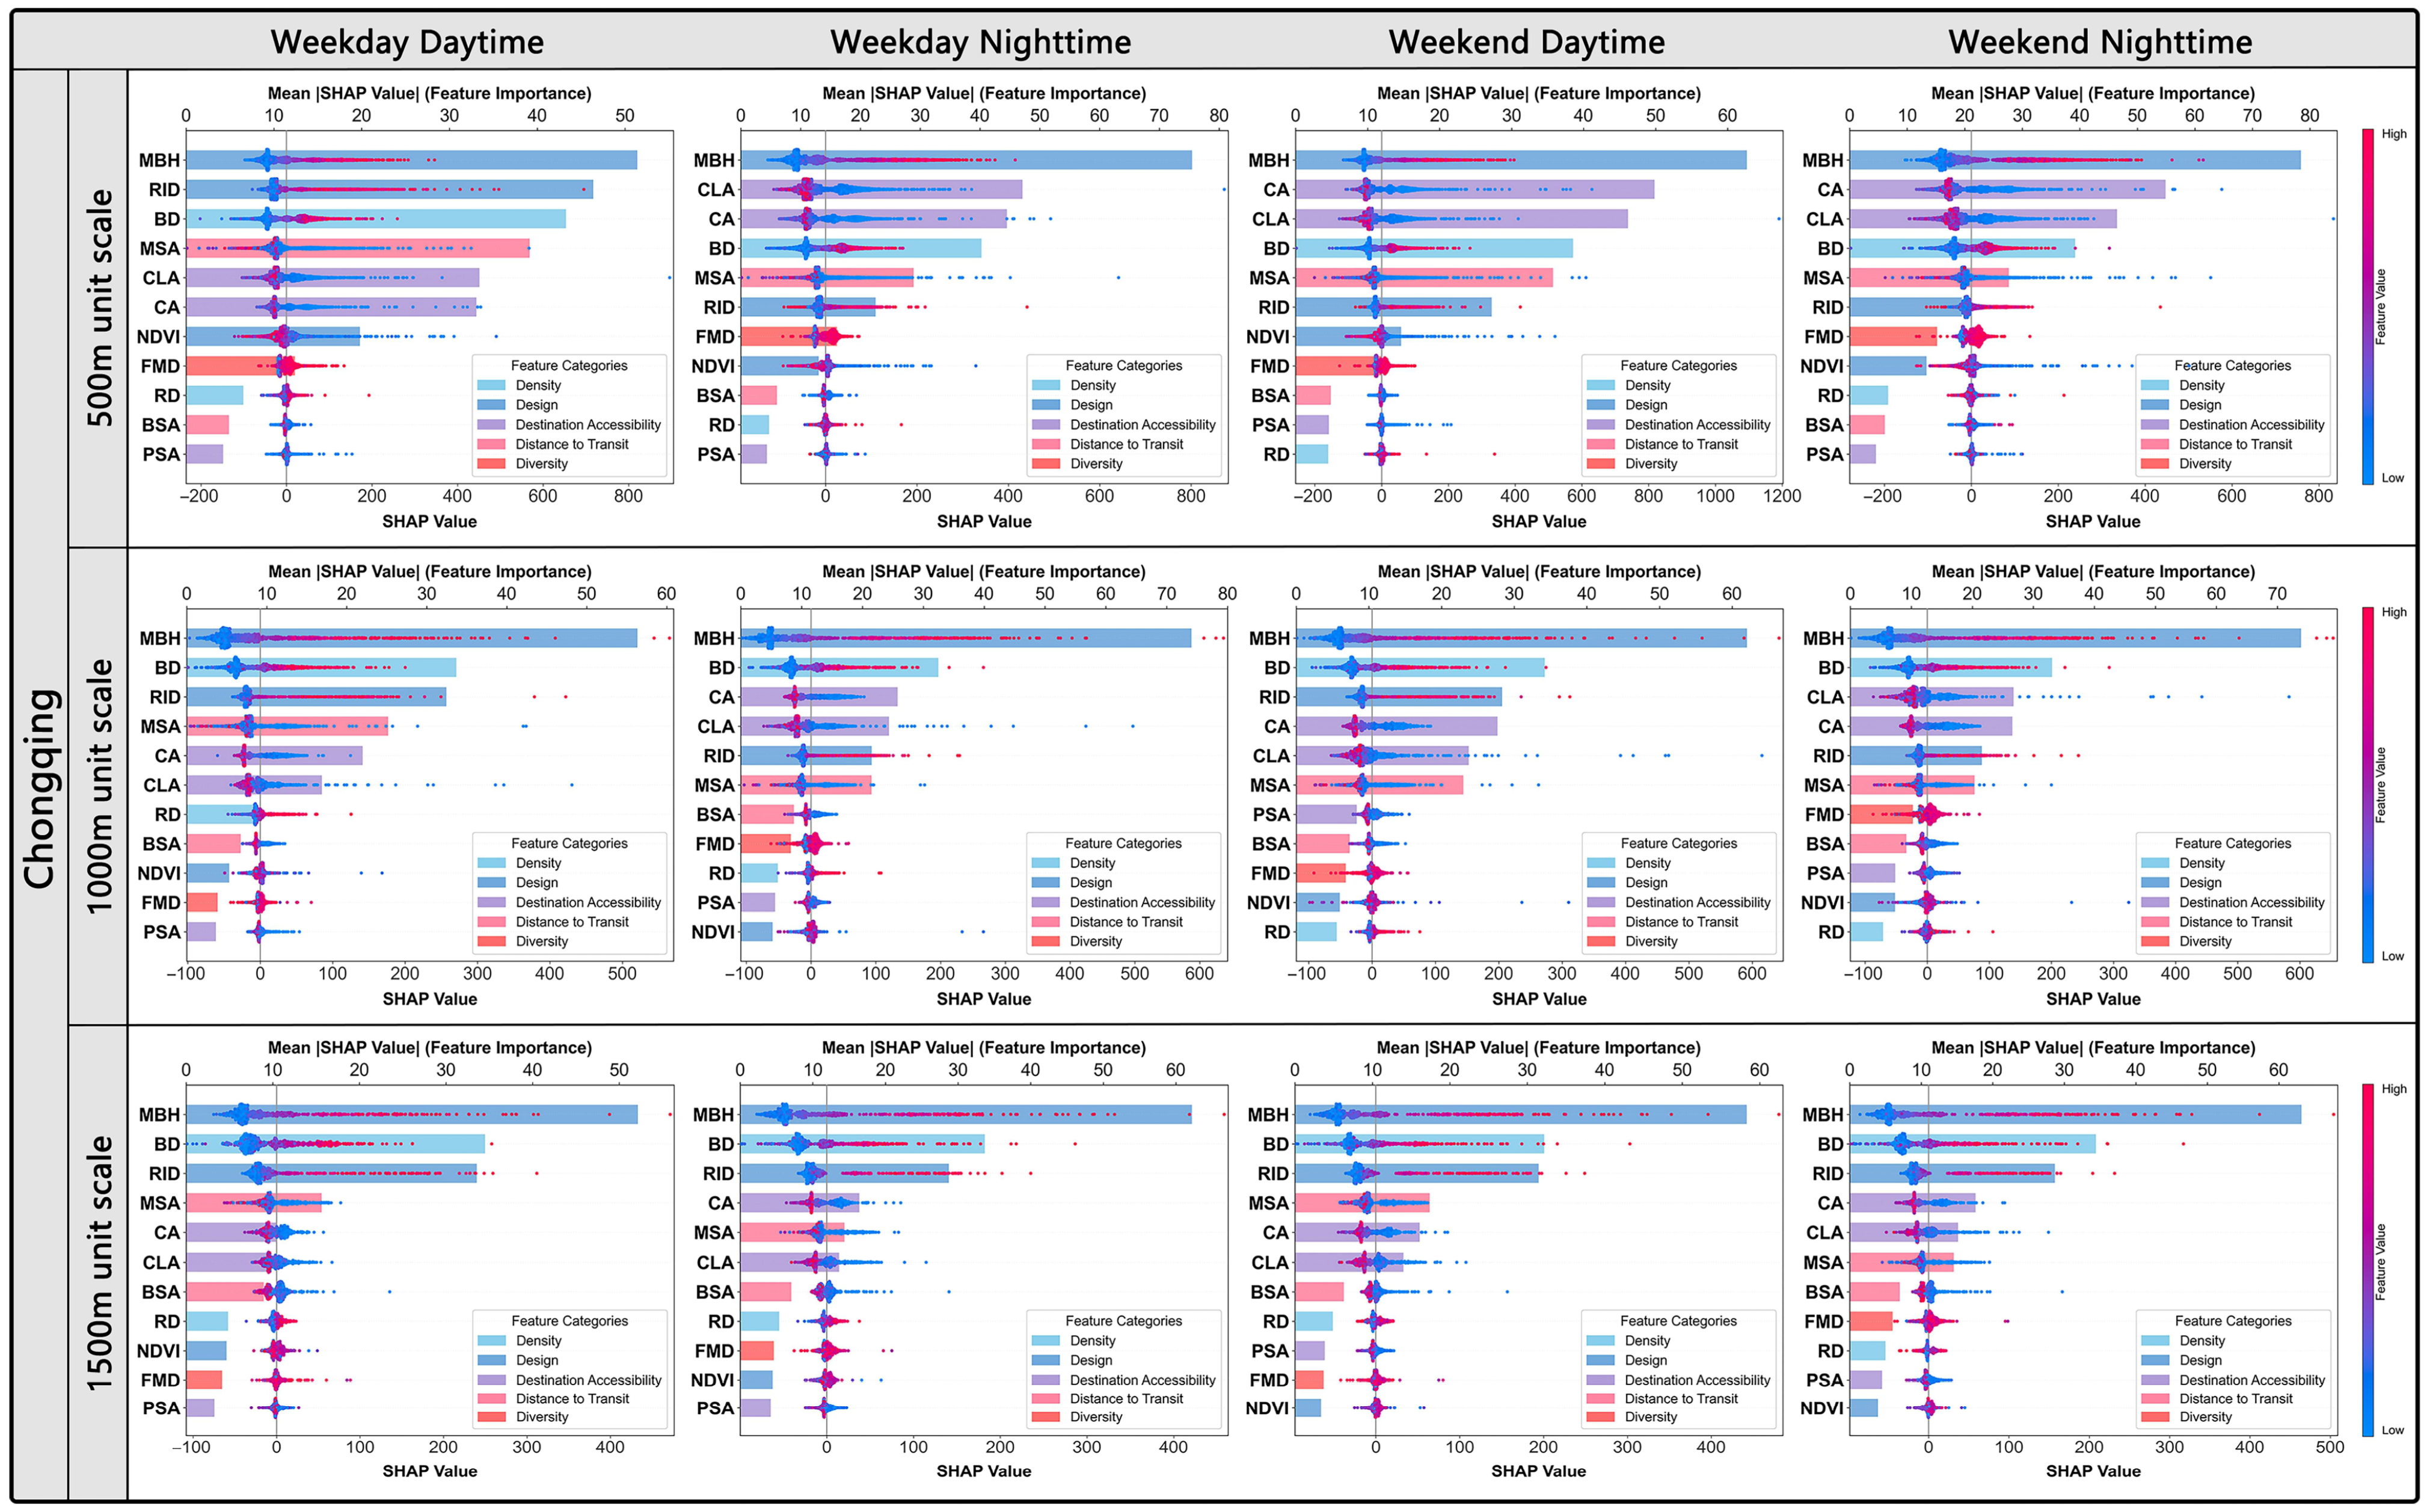
This research adopts the XGBoost model for analysis, and the relative contributions of each indicator under the corresponding conditions are presented by visualizing the SHAP values of all indicators, with the results shown in Figure 5 and Figure 6. In these figures, BE indicators are ranked in descending order of their relative importance to UV, with a higher ranking representing a stronger relative influence. The mean absolute SHAP values on the upper horizontal axis correspond to the bars, reflecting the importance of each indicator’s effect on UV, and a larger value indicates a greater absolute influence.
Firstly, by combining the results of the bee swarm plots, the overall effects of BE indicators on UV can be observed. Among them, the indicators that have a positive effect are BD, RD, FMD, RID and MBH. The indicators that have a negative effect are NDVI, CA, PSA, CLA, BSA and MSA. Secondly, in the figure showing the indicators of relative importance, we focus on the indicators that have a strong influence on UV, as well as the patterns of urban, scale, and time differences exhibited by some indicators in different cities, different grid scales, and different time periods.
In Chengdu, at the 500 m grid scale, MBH, RID, CA, CLA, and BD have strong influences. Moreover, the effects of each indicator vary significantly between weekday daytime and other time periods. The relative influences of MSA and RID at daytime on weekdays are stronger than at other times. This might be due to the fact that traffic elements such as subways and road intersections are more susceptible to the stronger commuting demand at daytime on weekdays. Conversely, the relative influences of CA and CLA are weaker, which is related to the lower demand for commercial, cultural, and leisure activities. At the 1000 m grid scale, each indicator remains relatively consistent in different time periods. MBH, RID, CA, and BD have strong influences. At the 1500 m grid scale, MBH, RID, BD, and RD have strong influences. The influence of MSA is higher at daytime than at nighttime, which also reflects that more transportation demands at daytime will increase the influence of the subway.
Overall, among the three grid scales in Chengdu, there are many commonalities and differences in the effects of BE indicators on UV. In terms of commonalities, indicators such as MBH, RID, and BD have strong influences. In terms of differences, as the scale increases, the relative influence of RD rises, the relative influence of RID also increases, the relative influence of CA decreases, and the relative influence of CLA first decreases and then increases.
In Chongqing, at the 500 m grid scale, MBH, CA, CLA, BD, and MSA have stronger influences. Moreover, the differences in each indicator between weekday daytime and other time periods are basically the same as those in Chengdu. At the 1000 m grid scale, MBH, RID, CA, CLA, and BD have stronger influences. At the same time, this grid scale also shows the same time difference as the 500 m grid scale, but the degree of difference is smaller. At the 1500 m grid scale, each indicator remains relatively consistent at different time periods. MBH, RID, CA, BD, and MSA have stronger influences.
Overall, for the three grid scales in Chongqing, BE indicators also show commonalities and differences in the scale dimension. In terms of commonalities, indicators show that MBH, CA, and BD have strong influences. In terms of differences, as the scale increases, the relative influence of RID increases and the relative influences of CA and CLA both decrease.
In conclusion, Chengdu and Chongqing also share many commonalities and differences in urban dimensions. Firstly, in terms of commonalities, regarding all indicators, MBH and BD consistently have stronger influences. Regarding the scale difference pattern, both show that as the scale increases, the relative influence of RID rises and the relative influence of CA decreases. And except for individual indicators whose relative influences rise, the overall absolute influence of BE indicators on UV decreases.
Secondly, in terms of differences, regarding all indicators, RID has a relatively strong influence in Chengdu, whereas CA has relatively strong influences in Chongqing. Regarding the scale difference pattern, compared to Chongqing, as the scale increases, the absolute and relative influences of BE indicators on UV change more significantly in Chengdu. For example, the more significant rise in the relative influence of RD in Chengdu. Meanwhile, CLA presents distinctly different variation trends in the two cities.

3.3. Dominant Key Indicators and Heterogeneous Key Indicators

Based on the above results, this study identifies the dominant key indicators and heterogeneous key indicators at three grid scales within each city, as well as the differential indicators between the two cities. Relevant details are shown in Table 2. Subsequent research on the nonlinear relationship and threshold effects between BE and UV will be conducted around these indicators.

3.4. Nonlinear and Threshold Effects of Built Environment on Urban Vitality

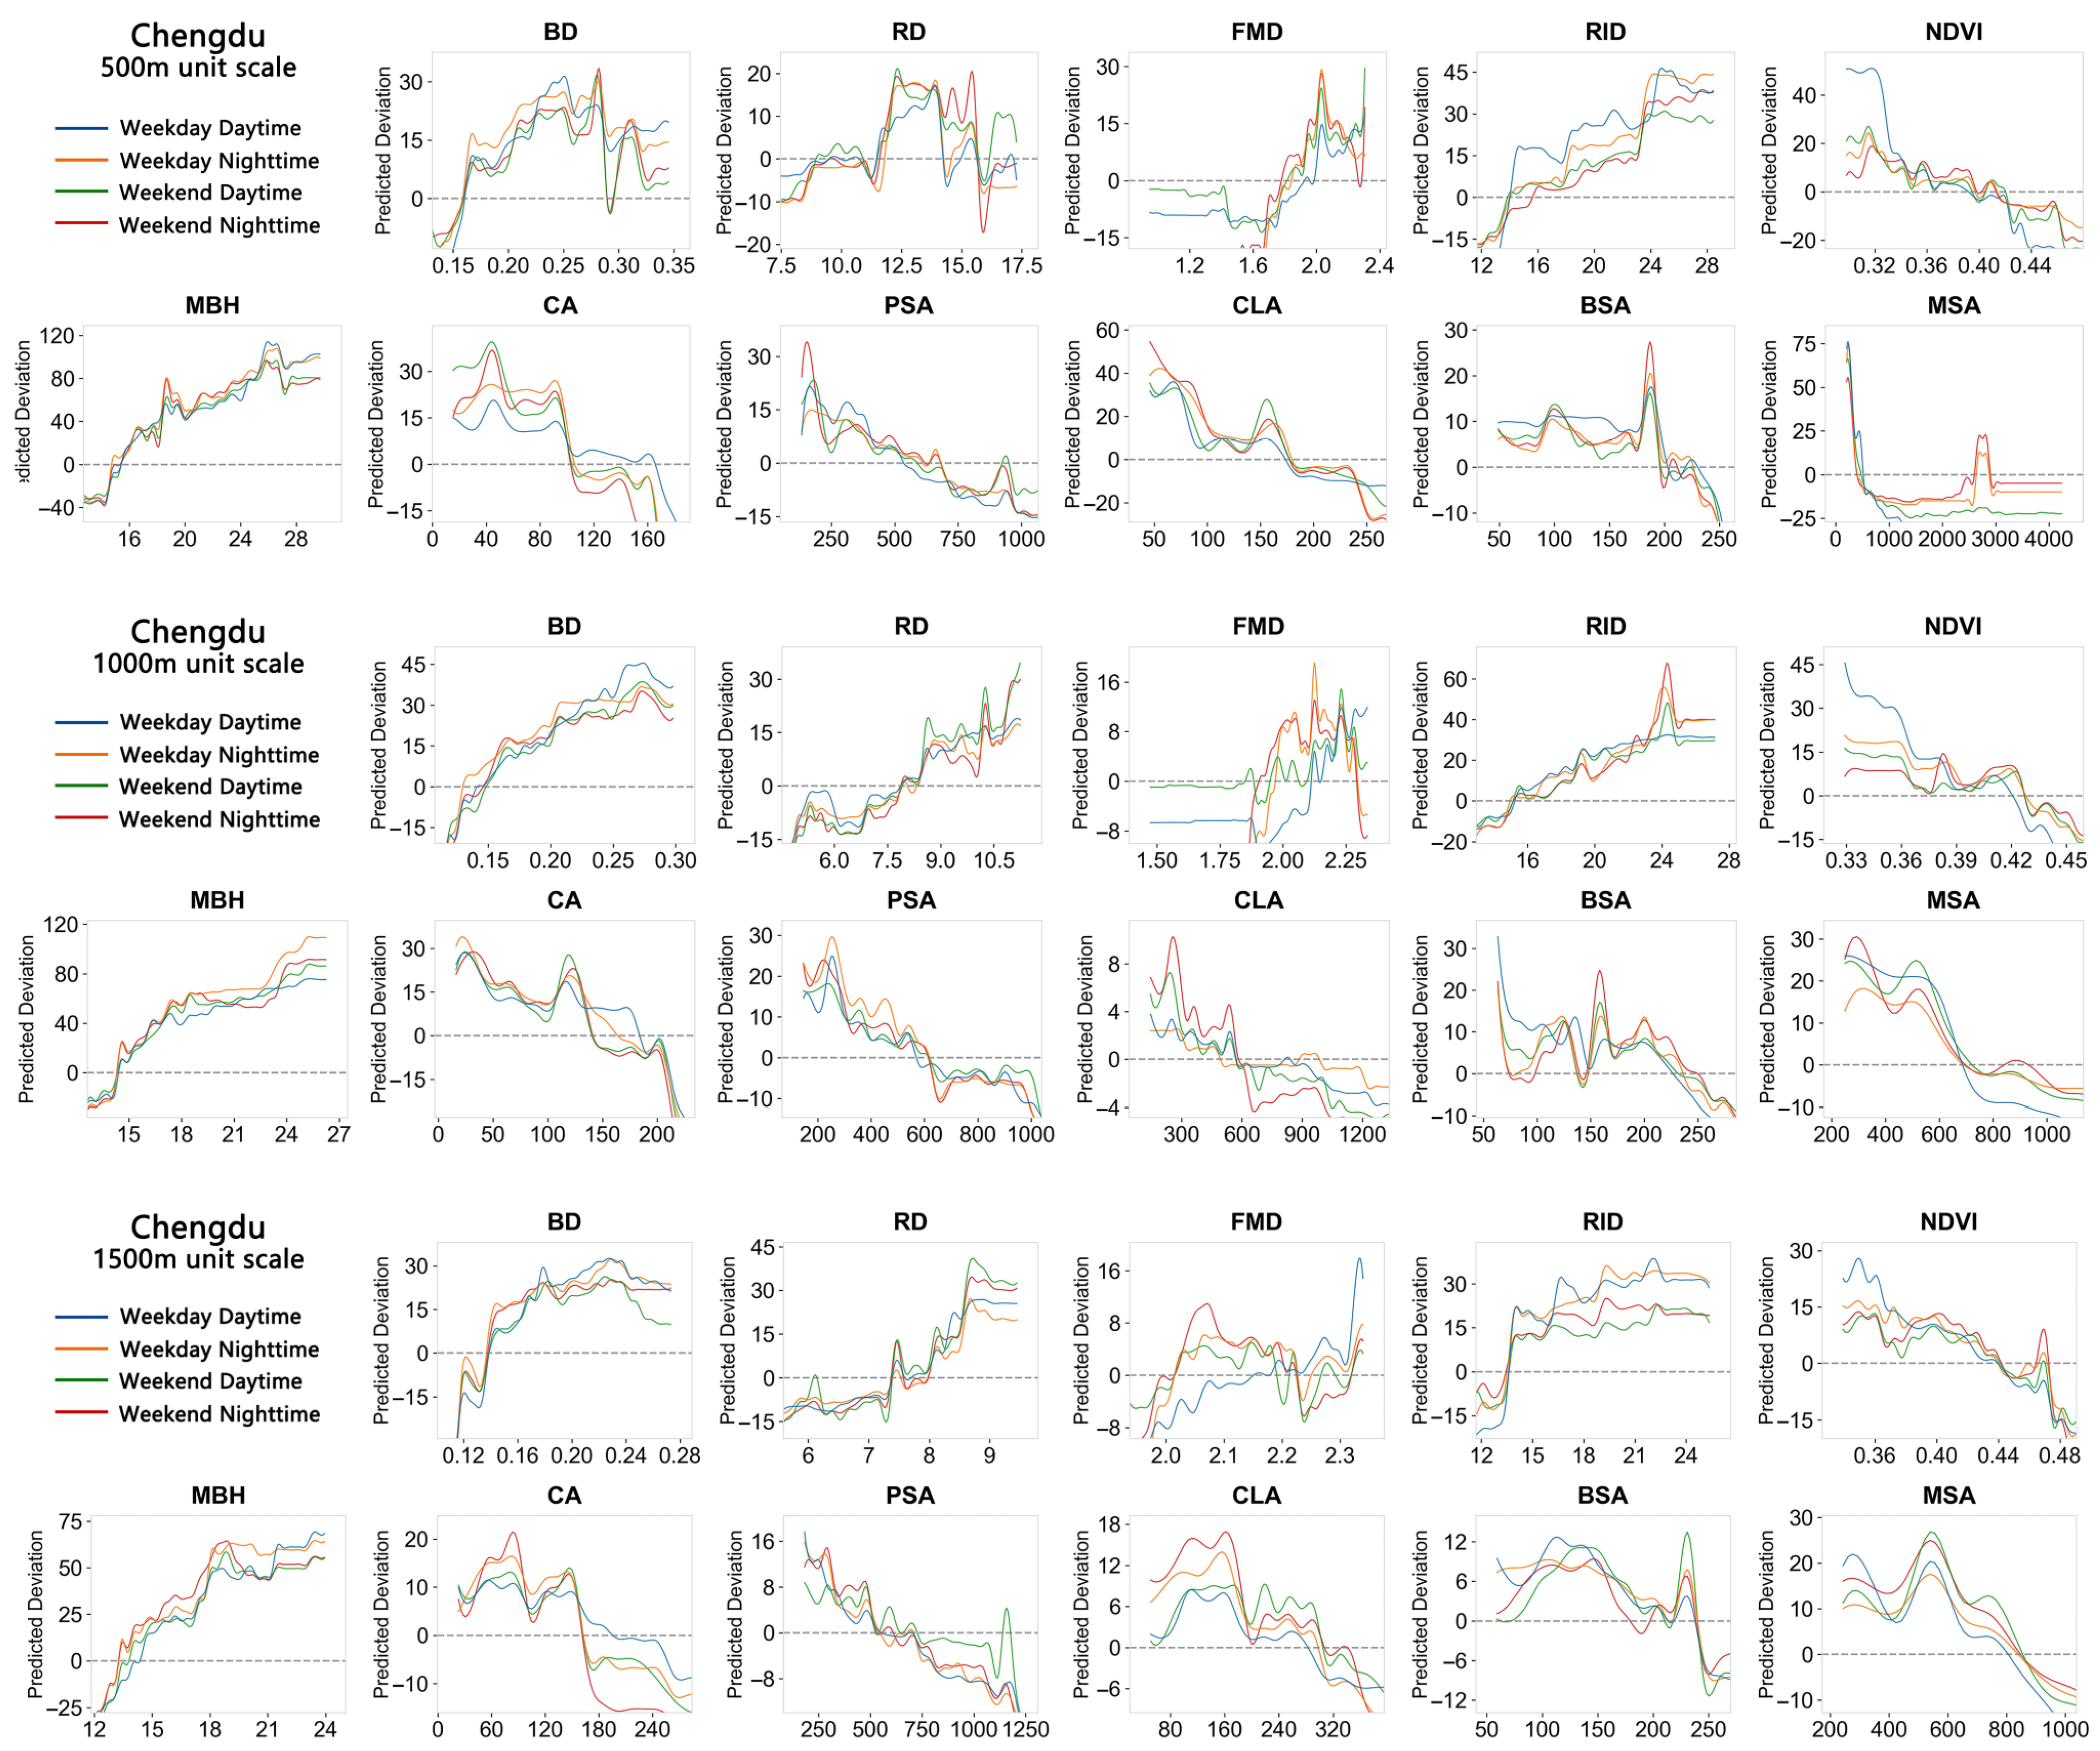
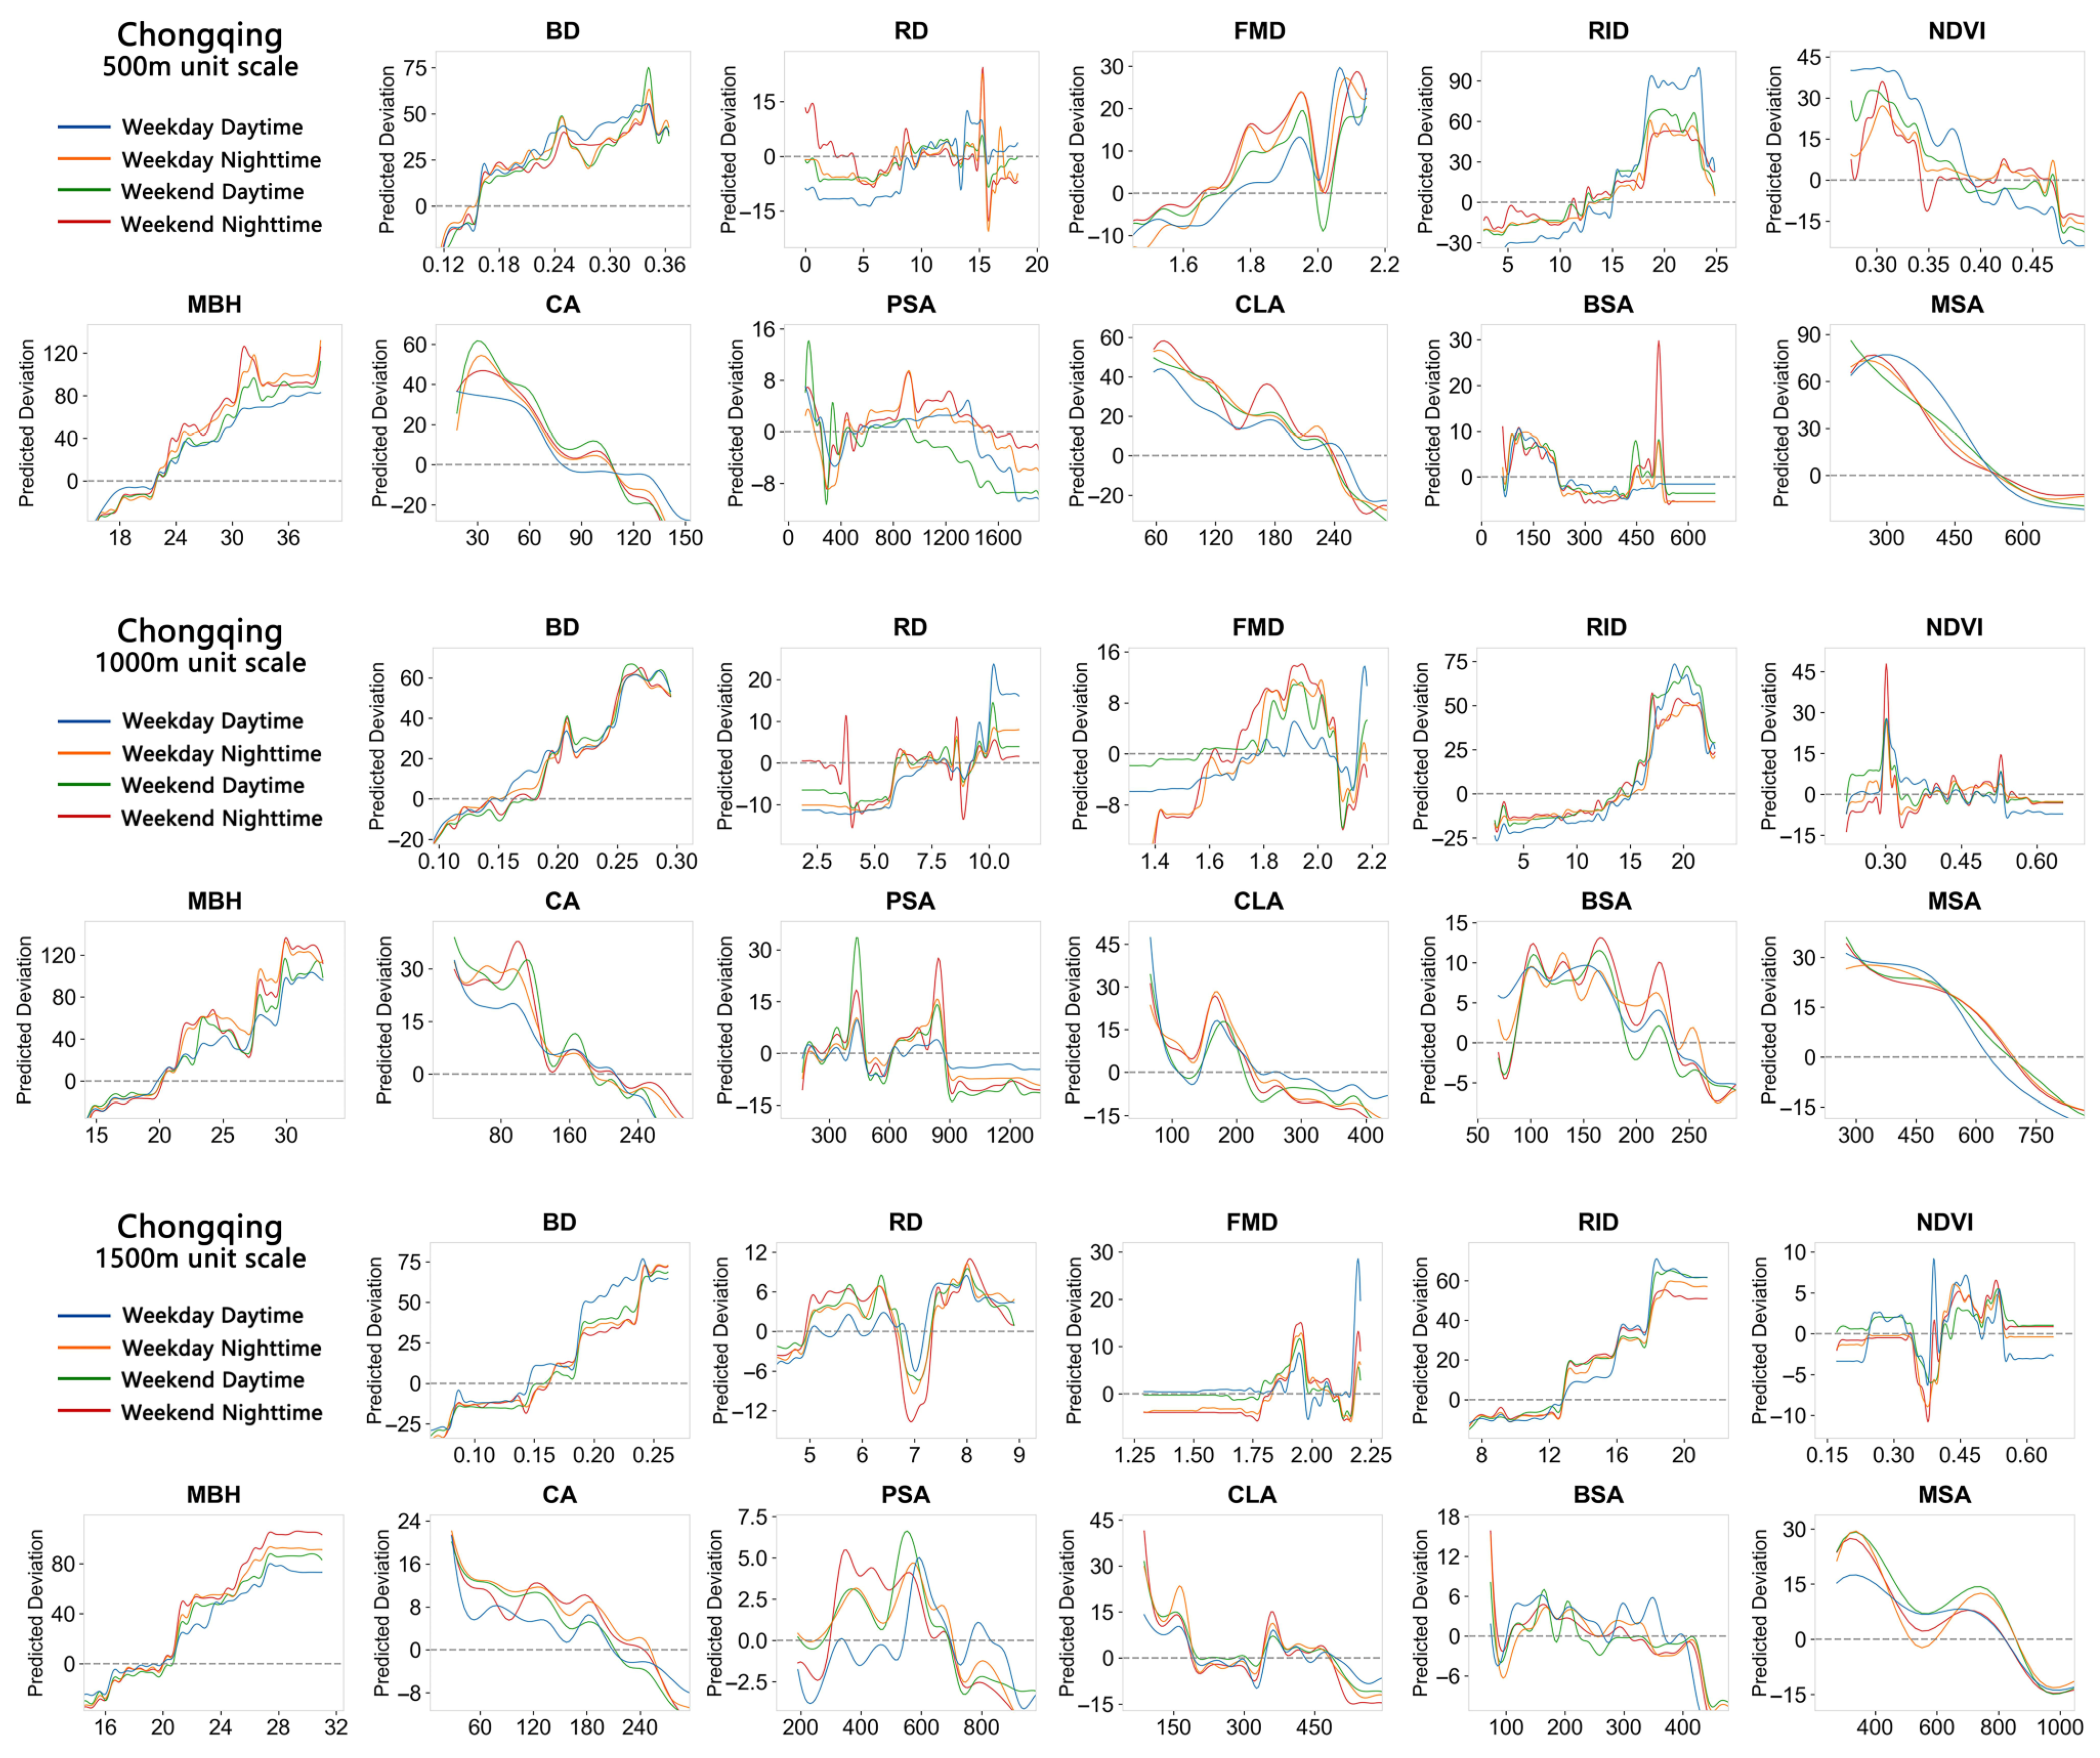
To analyze the nonlinear relationship and threshold effects between BE and UV, partial dependence plots (PDPs) were constructed. The results are shown in Figure 7 and Figure 8. The parts above 0 in the image have a positive significance for enhancing UV. Therefore, the focus is placed on the threshold points at the 0 value and the variation trends of the sections above the 0 value.
In Chengdu, BD, RID, and MBH are dominant key indicators. RD, RID, CA, and CLA are heterogeneous key indicators. The following focuses on their nonlinear effects on UV. In terms of dominant key indicators, BD has a threshold of around 0.15 in all three grid scales. When BD is greater than this value, it is meaningful for increasing UV. At the 500 m grid scale, when BD is in the range of 0.15–0.25, its effect on UV is positive, and it becomes negative after exceeding 0.25. At the 1000 m grid scale, when BD reaches 0.26, its influence on UV reaches the maximum and then remains stable. At the 1500 m grid scale, when BD is greater than 0.23, its influence on UV changes from positive to negative. Overall, in terms of commonality, the changes in BD in all three grid scales basically show a trend of first positive and then negative effect on UV. In terms of differences, in the small scale, as BD increases, it shows a relatively obvious negative effect on UV when it reaches a larger value. RID has a threshold value of around 14 in all three grid scales. When RID is greater than this value, it is meaningful for increasing UV. At the 500 m grid scale, when RID is in the range of 14–24, its influence on UV gradually increases to a high value and then remains stable. At the 1000 m grid scale, when RID is in the range of 15–24, except for the final appearance of a relatively high peak, it is basically consistent with the small scale. At the 1500 m grid scale, RID quickly reaches a stage high value after 13.5, rises gradually to another high value at 19, and then remains stable. Overall, in terms of commonalities, the effect of RID on UV generally shows a trend of rising to a high value followed by stability. MBH has a threshold value of around 14 in all three grid scales. When MBH is greater than this value, it is meaningful for increasing UV. From the overall trend, all three grid scales show a trend of gradually increasing influence on UV after reaching the threshold. Overall, in terms of differences, the three grid scales of MBH remain stable at 26, 25, and 22, respectively, after reaching these values, indicating that, as the scale increases, the influence on UV reaches the high value stable range earlier.
In terms of heterogeneous key indicators, at the 500 m grid scale, the value of RD within the range of 11.5–14.0 is meaningful for improving UV. When RD reaches 11.5, its influence on improving UV rapidly increases to a high value, then stabilizes at 14.0, and rapidly decreases thereafter. The high value on weekends persists until 16.0 before decreasing. At the 1000 m grid scale, RD reaches 8.5 and its influence on UV gradually increases. At the 1500 m grid scale, RD reaches 7.5 and shows the same trend as the medium scale, reaching a high value at 8.5 and remaining stable. Overall, in terms of differences, as the scale increases, the threshold decreases. And in the small scale, as RD increases, it shows a relatively obvious negative effect on UV when reaching a larger value. At the 500 m grid scale, the value of CA is meaningful for improving UV before reaching 100. At the 1000 m grid scale, the threshold is 140, and at the 1500 m grid scale, it is 160. All three grid scales show a negative effect on UV before reaching the threshold. The thresholds of the three grid scales reach at a later time on weekdays, which are 165, 180, and 200, respectively. Overall, in terms of differences, as the scale increases, the threshold increases. At the grid scale of 500 m, the value of CLA is meaningful for improving UV before reaching 180. At the 1000 m grid scale, the threshold is 570, and at the 1500 m grid scale, it is 310. CLA shows a similar overall trend to CA. Overall, in terms of differences, the threshold first increases and then decreases as the scale increases.
In Chongqing, BD, MBH, and CA are dominant key indicators. RID, CA, and CLA are heterogeneous key indicators, and we also pay attention to their nonlinear effects. In terms of dominant key indicators, BD has a threshold of around 0.16 at all three grid scales. When BD is greater than this value, it is meaningful for improving UV. At the 500 m grid scale, when BD is in the range of 0.16–0.34 it has a positive effect on UV, and becomes negative when greater than 0.34. At the 1000 m grid scale, when the value of BD reaches 0.25, it has the greatest influence on UV, and then it remains stable with a slight decrease. At the 1500 m grid scale, when the value of BD is 0.24, it reaches a high value of influence and remains stable. In the medium scale, the threshold value on weekdays is smaller than that on weekends. In the large scale, the daytime threshold value on weekdays is smaller than other times and has a higher influence within the meaningful range. Overall, in terms of commonalities, BD generally exhibits a trend where its influence on UV gradually rises to a high value and then stabilizes. In terms of differences, at the small scale, as BD increases, it shows a more obvious negative effect on UV when reaching a larger value. MBH has a threshold value of around 20 at all three grid scales. When MBH is greater than this value, it is meaningful for improving UV. From the overall trend, the three grid scales show the same change trend as BD. Overall, in terms of differences, as the scale increases, the influence of MBH on UV reaches a high value and stabilizes earlier. CA at the 500 m grid scale is meaningful for improving UV before reaching 110. At the 1000 m and 1500 m grid scales, the thresholds are 200 and 230, respectively. From the overall trend, the three grid scales all show a negative effect on UV. Among them, the small scale on weekdays has a lower influence on improving UV than other times, and the threshold is 80. At the large scale, the daytime threshold is around 210 and the nighttime threshold is around 250. Overall, in terms of differences, as the scale increases, the threshold rises.
In terms of heterogeneous key indicators, at the three grid scales, the threshold of RID is around 14. When RID is greater than this value, it is meaningful for improving UV. When RID is in the range of 14–19 at the 500 m grid scale, its influence on UV rises rapidly to a high value, then remains stable, and drops rapidly when it reaches 23. At the 1000 m grid scale, when the RID is in the range of 14.5–20, the influence rises rapidly to a high value, then remains stable, and drops rapidly when it reaches 21.5. When the RID is in the range of 13–19 at the grid scale of 1500 m, its influence first gradually increases, then rapidly rises to a high value, and subsequently remains stable. Overall, in terms of commonality, the three grid scales basically show a trend of increasing influence to a high value and then stabilizing, followed by a slight decrease. At the 500 m grid scale, CLA has a significant effect on improving UV before reaching 240, and shows a negative effect on UV in the range. At the 1000 m grid scale, the threshold is 230, with its influence on UV declining rapidly at first, rebounding to a high value when CLA reaches 175, and then gradually decreasing thereafter. At the 1500 m grid scale, values below 200 and those within the range of 350–500 are meaningful for enhancing UV. The effect drops sharply before the CLA value reaches 200 and remains at a relatively low level within 350–500. Overall, in terms of commonality, the three grid scales have a relatively consistent effect trend before CLA reaches 200.
To sum up, the two cities also exhibit commonalities and differences in terms of the nonlinear relationships and threshold effects between BE indicators and UV. The BD threshold values of both cities are around 0.15, basically showing a trend of positive effect initially and then negative effect later on UV. Moreover, a more obvious negative effect occurs when the small-scale BD is relatively large. The threshold value of RD decreases as the scale increases. And at a small scale, the same pattern as BD appears. In terms of differences, compared with Chengdu, the RD of Chongqing shows two discontinuous meaningful intervals. The threshold of RID is around 14. In terms of differences, Chengdu shows a pattern of first rising to a high value and then remaining stable, while Chongqing shows a slight decrease after stability. And when the RID value is large in Chongqing, the negative effect on UV is more obvious at the small and medium scales. MBH shows a pattern of reaching the high-value stable range earlier as the scale increases, but its threshold in Chongqing is larger than that in Chengdu. There is no significant difference in CA, showing a pattern of a gradually decreasing influence on UV. And as the scale increases, the threshold increases. In terms of the differences in CLA, compared with Chongqing, the threshold in Chengdu first increases and then decreases as the scale increases. In terms of BSA differences, Chengdu shows a negative effect, and as the scale becomes larger, the threshold increases. In summary, the effect patterns of BE indicators on UV in the two cities are generally consistent, but some indicators have urban differences. In particular, the nonlinear effects of indicators in Chongqing are more complex and variable than those in Chengdu, featuring frequent positive–negative shifts in the effect on UV and intermittent meaningful ranges.

4. Discussion

4.1. Relative Importance Varies Across Different Cities and Grid Scales

Based on the previous results and existing studies, it has been proven that BE has significant effects on UV. Furthermore, analysis across different scales of research units in distinct cities has revealed significant urban and scale differences in the effects of BE indicators on UV. This finding is consistent with the conclusions of Jiang et al. [34] and Wei et al. [55].
Across the three grid scales in Chengdu, BD, RID, and MBH are all dominant key indicators influencing UV. This result is in line with Jacobs’ principle of “high density, small blocks, and diverse buildings” for fostering vitality [56,57]. Higher BD and MBH can efficiently gather population and their activities, providing the basic carrier for UV [9,47]. While denser RID can enhance spatial accessibility and pedestrian friendliness, reducing the cost of activity participation, and thereby stimulating the continuous flow of people and vitality [46].
In terms of the differences in the three grid scales, as the scale increases, the relative influence of RD increases significantly. This indicates that RD exerts a more significant impact on improving UV at large scales, which is different from the scale change pattern discovered by Fang et al. [58]. The reason might be that, in the small scale, the core role of the road network is to meet the travel needs within the community, and its efficiency is easily overshadowed by indicators such as the accessibility of local commercial and leisure facilities. At a large scale, the road network assumes the key role of connecting various urban groups and functional areas, and its accessibility determines the efficiency of cross-regional flow of people and goods, thereby exerting a more significant driving effect on UV at large scales. RID also shows the same pattern slightly weaker than RD. The reason for this might be that, at a large scale, intersections, as key connection points of regional transportation, have a more amplified effect on the aggregation and diversion of the flow of people and have a greater influence on UV at large scales. Differently from the above two factors, the relative influence of CA decreases with the increase in the scale, indicating that CA has a significant influence on improving UV at small scales. This could be attributed to the fact that, at a small scale, commercial facilities are primarily oriented toward daily life and convenient services, and their accessibility is linked to the intensity of residents’ participation in immediate activities such as daily consumption [30,48,59]. At a large scale, commercial facilities exhibit regional-level clustering characteristics, and their service coverage covers more areas, diluting the direct driving effects on local vitality and exerting more indirect effects through industrial agglomeration and other means. Finally, the relative influence of CLA first declines and then rises with an increase in scale. The reason for this might be that, in Chengdu, at the small scale, community-level cultural and leisure facilities, such as community activity centers, are deeply integrated with residents’ daily lives and have a relatively strong relative influence. At the medium scale, the relative influence decreases, which might be due to the overlapping coverage of community-level facilities reducing human reliance on a single facility. It might also be that the core radiation circle of urban-level facilities has not yet been reached, making it difficult for people to be attracted, resulting in a decrease in the relative influence. At the large scale, urban-level cultural and leisure facilities, such as large sports venues and libraries, have become the iconic attractions of cities, driving a recovery in their relative influence.
Across the three grid scales in Chongqing, BD and MBH are also important influencing indicators at each grid scale. The continuous high influence of CA in Chongqing indicates that the convenience of residents’ access to commercial services has become a core factor in connecting the scattered spaces of mountainous cities and activating local vitality.
Focusing on the differences in the three grid scales, the variation patterns of RID and CA with the grid scale are consistent with those in Chengdu. However, the relative influence of CLA in Chongqing shows a trend of gradually decreasing as the scale increases. This is because, at large scales, the layout of urban-level cultural and leisure facilities is more significantly constrained by topography, resulting in a limited radiation range. Such facilities thus struggle to drive UV effectively across the whole city, and their relative influence diminishes accordingly, failing to stage a rebound.
Finally, the commonalities and differences between Chengdu and Chongqing are analyzed. Firstly, in terms of commonalities, regarding the influences of indicators, BD and MBH maintain strong relative influences in both cities. This indicates that this pattern is less affected by the differences among different cities. Regarding the scale difference pattern, except for a few indicators, the overall absolute influence of BE indicators on UV decreases as the scale increases. This might be due to the weakening of influence caused by the expansion of scale. At the small scale, the elements directly act on the surrounding limited range of scenes and are closely associated with the UV. As the scale increases, the representation of UV shifts from local vitality to overall vitality. The effect range of the BE indicator relative to the study scale is diluted, and its influence on overall vitality is weakened.
Secondly, in terms of differences, regarding the influences of indicators, RID has a stronger relative influence in Chengdu than in Chongqing. This might be due to the fewer barriers in plain cities, where intersections fully exert their functions and effectively connect various functional spaces, thereby enhancing UV. Meanwhile, in Chongqing, compared to Chengdu, CA maintains a high relative influence. The main reason for this is that, under the “multi-core and decentralized” spatial pattern of mountainous cities [44,60], commercial facilities, as the core attraction points of the clusters, have a higher connection effect on the decentralized spaces than in plain cities. Regarding the scale difference pattern, the changes in the absolute and relative influence of BE indicators with grid scale show more pronounced disparities in Chengdu. This may be due to the high degree of spatial homogenization in plain cities, where the effectiveness of the BE is more sensitive to scale changes. Meanwhile, in mountainous cities, the heterogeneity and fragmentation of the space buffer the differences caused by scale changes and the changes in indicators influence are suppressed. For example, as the scale increases, the relative influence of RD in Chengdu increases more significantly than in Chongqing. This is because Chongqing is a mountainous city and road network construction is restricted by the terrain, making it difficult to form the continuous and dense road network of plain cities. At a large scale, an improvement in road network density cannot effectively achieve efficient connection by breaking terrain barriers to enhance UV.

4.2. Nonlinear and Threshold Effects Across Different Cities and Grid Scales

Previous studies have shown that there is a nonlinear relationship and threshold effect between BE and UV [35,61]. Building on this foundation, the different effects and variation patterns of BE indicators on UV across different cities and grid scales are further revealed.
Firstly, take Chengdu as an example. In terms of dominant key indicators, the threshold of BD is around 0.15 at all three grid scales, showing a pattern of an initially positive and then negative effect on UV. This is largely consistent with the findings of Yuan et al. [62] and Han & Zhang [63]. Moreover, at the small scale, when BD is larger, it has a more obvious negative effect. This reflects that there is a clear and moderate range for the enhancement of UV by BD, and beyond the critical value of 0.25, it will be inhibited due to issues such as overcrowding and decreased comfort. This phenomenon is more obvious in the small-scale space. RID has a threshold of around 14 at all three grid scales, and its influence on UV shows a pattern of initially rising to a high value and then remaining stable. It also shows a clear moderate range. In actual work, it is necessary to pay attention to the fact that, when this indicator is raised to a certain value, its influence basically no longer increases. The overall positive effect of RID on UV is consistent with the view of Sung & Lee [64], but different from the discovery of Shao et al. [65]. MBH has a threshold of around 14 at all three grid scales, and the trend is similar to RID, but it reaches a high-value stable range earlier as the scale increases. This indicates that the overall enhancement of urban macro and overall vitality does not need to overly pursue the building height of a single area; a moderate high value can achieve the balance of UV enhancement and spatial comfort.
In terms of heterogeneous key indicators, similar to BD, RD also shows a relatively obvious negative effect at the small scale when its value is larger. This indicates that RD should not be set at an excessively high level in small-scale planning. Nevertheless, the relationship between RD and UV is still dominated by a positive effect, which is different from the views of Ha & Kim [50] and Tan et al. [66], where RD is regarded as a negative-effect indicator. In addition, the threshold value of RD is found to decrease with an increase in scale, suggesting that the effective threshold of RD for UV enhancement declines as the scale expands. And the reason for this may lie in the change in the functional positioning of road networks in different urban grid scales. At the small scale, the road network mainly serves short-distance daily travel and needs to reach a high density to meet human needs. Meanwhile, at the medium and large scales, the core function of the road network tends to be cross-regional connectivity, and the enhancement in UV focuses on continuity and accessibility, so the density requirement is reduced. The indicators of the Destination accessibility dimension all show a trend of gradually decreasing influence on UV. Among them, CA shows that, as the scale increases, the threshold rises. This indicates that, at the small scale, commercial facilities focus on meeting the immediate needs of daily life, and human sensitivity to distance is high. The distance threshold is controlled within a relatively close range to efficiently meet activity needs. As the scale increases, commercial facilities also focus on regional-level services, and human sensitivity to the distance of them in the larger scale decreases and the threshold rises. Different from CA, the threshold of CLA rises first and then decreases as the scale increases. This echoes the previous pattern of the relative influence of CLA in Chengdu, which first decreases and then increases. At the small scale, community-level facilities are the carrier, and human sensitivity to distance is high, with a lower threshold. At the medium scale, consistent with the reasons for the low relative influence of CLA, cultural and leisure facilities enter a transitional phase where the dominant role shifts from community-level to urban-level facilities. The radiation effect of urban-level facilities begins to influence this grid scale, and, at the same time, human sensitivity to the effective distance of community-level facilities decreases, jointly leading to an increase in the distance threshold. At the large scale, because urban-level facilities play a leading role in enhancing UV, it is different from the middle scale, where a higher threshold is adapted to the distance resistance brought by the dispersion of facilities. The effective distance is more determined by the radiation radius, and the distance threshold decreases. From another perspective, this indicates the logical succession of the function of cultural and leisure facilities from community-dispersed service to city-concentrated radiation as the scale becomes larger.
Secondly, this section compares the nonlinear research results and scale difference patterns of BE indicators in Chongqing and further discusses the similarities and differences in relevant indicators across the two cities. In terms of commonality, BD and CA show basically the same patterns in both cities. This indicates that the nonlinear relationship between these indicators and UV is less affected by urban differences. In terms of differences, the threshold of MBH in Chongqing is higher than that in Chengdu. The reason for this is that the natural base of separated by mountains and rivers in Chongqing leads to scattered and scarce available construction land and cannot be developed in a continuous low-density manner like the plain cities. Therefore, in the limited group space, if one wants to efficiently gather population and carry out multiple functions, a higher MBH becomes an inevitable choice for construction. So, compared to Chengdu, the threshold of MBH in Chongqing is higher. Meanwhile, compared with Chengdu, when the RID value is larger, Chongqing shows a more obvious negative effect on UV at small and medium scales. This may be due to the multi-group spatial layout of Chongqing imposing more rigid constraints on the effectiveness of RID. At this grid scale, when the RID value is large, intersections are mostly concentrated within a single group, and the excessive density is more likely to lead to a decline in road traffic efficiency within Chongqing’s dispersed groups, thereby having a negative effect on UV.
In addition to the easily explained urban indicator differences mentioned above, the nonlinear relationships between RD, CLA, PSA, BSA, and UV in Chongqing show a more complex changing state. Ultimately, it is due to the spatial structure of mountainous cities. As mentioned above, the multi-group and fragmented space leads to the terrain boundaries blocking the scope of the road network and various facilities, which can only present effective influence intervals that are suitable for an individual group or the entire city. There are often ineffective areas in the indicator efficacy, manifested as different degrees of discontinuity. At the same time, Chongqing’s small but complete local system leads to relatively weaker cross-group linkage needs. The effect logic of some BE indicators in Chongqing is different from the continuous patterns of plain cities [67], further amplifying the complexity of the nonlinear relationship between BE and UV.

4.3. Limitations and Future Research

Although this research analyzed the relationship between BE and UV from multiple dimensions, there are still some limitations. Firstly, it is relatively simple to use the crowd aggregation intensity reflected by Baidu heatmap data to characterize UV. Without the integration of multiple data such as economic activity and social interaction frequency, the characterization of UV remains somewhat limited in its comprehensiveness. In the future, relevant data such as economy, society, and culture can be supplemented to construct a multi-dimensional assessment framework for UV, obtaining a more comprehensive UV. Secondly, the BE “5D” indicator system adopted here is primarily designed to guide urban construction practices, and lacks subjective perceptual indicators at the human scale. Subsequent studies could introduce street view image data and extract human-centric perceptual indicators by combining computer vision technologies so as to enrich the content of the “5D” system. Furthermore, in the study of the urban differences in the relationship between BE and UV, macro-structural factors such as social networks and institutional policies can be incorporated into the BE indicator system. This integration would help more comprehensively reveal the deep differences in UV across different cities. Finally, the research focused on analyzing the independent effect of individual BE indicators, but did not deeply explore the interaction effects among BE indicators, and the exploration of the synergy effect of multiple factors was insufficient. In the future, the interaction and synergistic threshold effect among the indicators can be systematically explored to provide more targeted support for urban space optimization.

5. Conclusions

Taking Chengdu and Chongqing as examples, the spatiotemporal distribution characteristics of UV at three grid scales and across four periods for the two cities are presented based on Baidu heatmap data. The XGBoost–SHAP model is applied to analyze the nonlinear effects of the BE on UV across different cities, grid scales, and time periods. The main conclusions are as follows:
(1)
UV presents significant heterogeneity across cities, grid scales, and time periods. In terms of urban disparity, UV in Chengdu exhibits a spatial pattern of one dominant core supplemented by multiple sub-centers with a radial central layout, while Chongqing features a pattern of polycentric clusters separated by mountains and water systems. In terms of scale disparity, the distribution of UV tends to be more uniform as the spatial scale increases. In terms of temporal disparity, nighttime UV is higher than daytime UV, and the spatial agglomeration and dispersion of high-value UV areas change dynamically over time.
(2)
The relative importance of BE impacts on UV demonstrates both common characteristics and heterogeneous differences. For Chengdu, BD, RID, and MBH serve as dominant key indicators; for Chongqing, the dominant key indicators include BD, MBH, and CA. In terms of urban differences, RID exerts a stronger influence in Chengdu, and CA plays a more significant role in Chongqing. In terms of scale disparity, indicators such as RD, RID, CA, and CLA show differentiated changing patterns with the variation in spatial scales.
(3)
BE exerts pronounced nonlinear effects and threshold effects on UV, with distinct differences across cities and grid scales. Most indicators, such as BD and CA, share consistent influencing patterns in both cities. In terms of urban differences, several indicators of Chongqing including MBH and RID differ from those of Chengdu due to the unique spatial characteristics of mountainous cities. Some indicators represented by RD and CLA even present more complex nonlinear variations. In terms of scale disparity, the nonlinear influence trends and threshold values of RD, CA, CLA, and other indicators change with scale adjustment, reflecting obvious scale heterogeneity.
In summary, in different urban construction projects, decision-makers should pay attention to the differences in the effect of different urban backgrounds on the relationship between BE and UV. Such as the differential effects of RID and CA, and the varying effects of MBH and RID, between plain and mountainous cities. In different-scale construction projects, decision-makers should focus on the dominant key indicators and heterogeneous key indicators of BE at each scale. For example, large-scale planning should pay attention to RD level, and small-scale planning should pay more attention to the situation of CA. On this basis, the nonlinear relationship and threshold effect between BE indicators and UV under the corresponding situation are identified. Accordingly, a more suitable reference is provided for determining the value range of the optimization level of BE indicators in line with actual work.

Author Contributions

Conceptualization, Y.N. and E.W.; methodology, Y.N. and E.W.; software, Y.N.; validation, Y.N.; formal analysis, Y.N.; investigation, Y.N.; resources, Y.N. and E.W.; data curation, Y.N.; writing—original draft preparation, Y.N.; writing—review and editing, Y.N. and E.W.; visualization, Y.N.; supervision, E.W.; project administration, E.W.; funding acquisition, E.W. All authors have read and agreed to the published version of the manuscript.

Funding

This research was funded by the Key Project of Liaoning Provincial Social Science Planning Foundation (L25AGL007), and the 20th Batch of College Student’ Innovative Entrepreneurial Training Plan Program at Northeastern University (261571).

Data Availability Statement

Data will be made available on request.

Conflicts of Interest

The authors declare no conflicts of interest.

Abbreviations

The following abbreviations are used in this manuscript:
BEBuilt Environment
UVUrban Vitality
POIPoint of Interest
SHAPShapley Additive exPlanation
XGBoostExtreme Gradient Boosting
BDBuilding Density
RDRoad Density
FMDFunctional Mix Degree
RIDRoad Intersection Density
NDVINormalized Difference Vegetation Index
MBHMean Building Height
CACommercial Accessibility
PSAPark and Square Accessibility
CLACultural and Leisure Accessibility
BSABus Stop Accessibility
MSAMetro Station Accessibility

References

  1. Glaeser, E. Cities, Productivity, and Quality of Life. Science 2011, 333, 592–594. [Google Scholar] [CrossRef] [PubMed]
  2. Mouratidis, K.; Poortinga, W. Built Environment, Urban Vitality and Social Cohesion: Do Vibrant Neighborhoods Foster Strong Communities? Landsc. Urban Plan. 2020, 204, 103951. [Google Scholar] [CrossRef]
  3. Liu, H.; Gou, P.; Xiong, J. Vital Triangle: A New Concept to Evaluate Urban Vitality. Comput. Environ. Urban Syst. 2022, 98, 101886. [Google Scholar] [CrossRef]
  4. Jin, X.; Long, Y.; Sun, W.; Lu, Y.; Yang, X.; Tang, J. Evaluating Cities’ Vitality and Identifying Ghost Cities in China with Emerging Geographical Data. Cities 2017, 63, 98–109. [Google Scholar] [CrossRef]
  5. Lyu, G.; Angkawisittpan, N.; Fu, X.; Sonasang, S. Investigating the Relationship between Built Environment and Urban Vitality Using Big Data. Sci. Rep. 2025, 15, 579. [Google Scholar] [CrossRef]
  6. Jacobs, J. The Death and Life of Great American Cities; Random House: New York, NY, USA, 1961. [Google Scholar]
  7. Lynch, K.A. A Theory of Good City Form; MIT Press: Cambridge, MA, USA, 1981. [Google Scholar]
  8. Montgomery, J. Making a City: Urbanity, Vitality and Urban Design. J. Urban Des. 1998, 3, 93–116. [Google Scholar] [CrossRef]
  9. Sung, H.-G.; Go, D.-H.; Choi, C.G. Evidence of Jacobs’s Street Life in the Great Seoul City: Identifying the Association of Physical Environment with Walking Activity on Streets. Cities 2013, 35, 164–173. [Google Scholar] [CrossRef]
  10. Zarin, S.Z.; Niroomand, M.; Heidari, A.A. Physical and Social Aspects of Vitality Case Study: Traditional Street and Modern Street in Tehran. Procedia-Soc. Behav. Sci. 2015, 170, 659–668. [Google Scholar] [CrossRef]
  11. He, Q.; He, W.; Song, Y.; Wu, J.; Yin, C.; Mou, Y. The Impact of Urban Growth Patterns on Urban Vitality in Newly Built-up Areas Based on an Association Rules Analysis Using Geographical ‘Big Data’. Land Use Policy 2018, 78, 726–738. [Google Scholar] [CrossRef]
  12. Xia, C.; Yeh, A.G.-O.; Zhang, A. Analyzing Spatial Relationships between Urban Land Use Intensity and Urban Vitality at Street Block Level: A Case Study of Five Chinese Megacities. Landsc. Urban Plan. 2020, 193, 103669. [Google Scholar] [CrossRef]
  13. Zhang, Y.; Tu, T.; Long, Y. Inferring Ghost Cities on the Globe in Newly Developed Urban Areas Based on Urban Vitality with Multi-Source Data. Habitat Int. 2025, 158, 103350. [Google Scholar] [CrossRef]
  14. Gong, H.; Wang, X.; Wang, Z.; Liu, Z.; Li, Q.; Zhang, Y. How Did the Built Environment Affect Urban Vibrancy? A Big Data Approach to Post-Disaster Revitalization Assessment. Int. J. Environ. Res. Public Health 2022, 19, 12178. [Google Scholar] [CrossRef]
  15. Jin, A.; Ge, Y.; Zhang, S. Spatial Characteristics of Multidimensional Urban Vitality and Its Impact Mechanisms by the Built Environment. Land 2024, 13, 991. [Google Scholar] [CrossRef]
  16. Zhang, J.; Liu, X.; Tan, X.; Jia, T.; Senousi, A.M.; Huang, J.; Yin, L.; Zhang, F. Nighttime Vitality and Its Relationship to Urban Diversity: An Exploratory Analysis in Shenzhen, China. IEEE J. Sel. Top. Appl. Earth Obs. Remote Sens. 2022, 15, 309–322. [Google Scholar] [CrossRef]
  17. Kim, Y.-L. Data-Driven Approach to Characterize Urban Vitality: How Spatiotemporal Context Dynamically Defines Seoul’s Nighttime. Int. J. Geogr. Inf. Sci. 2020, 34, 1235–1256. [Google Scholar] [CrossRef]
  18. Wang, X.; Zhang, Y.; Yu, D.; Qi, J.; Li, S. Investigating the Spatiotemporal Pattern of Urban Vibrancy and Its Determinants: Spatial Big Data Analyses in Beijing, China. Land Use Policy 2022, 119, 106162. [Google Scholar] [CrossRef]
  19. Li, Q.; Cui, C.; Liu, F.; Wu, Q.; Run, Y.; Han, Z. Multidimensional Urban Vitality on Streets: Spatial Patterns and Influence Factor Identification Using Multisource Urban Data. ISPRS Int. J. Geo-Inf. 2021, 11, 2. [Google Scholar] [CrossRef]
  20. Jiang, Y.; Han, Y.; Liu, M.; Ye, Y. Street Vitality and Built Environment Features: A Data-Informed Approach from Fourteen Chinese Cities. Sustain. Cities Soc. 2022, 79, 103724. [Google Scholar] [CrossRef]
  21. Lv, G.; Zheng, S.; Hu, W. Exploring the Relationship between the Built Environment and Block Vitality Based on Multi-Source Big Data: An Analysis in Shenzhen, China. Geomat. Nat. Hazards Risk 2022, 13, 1593–1613. [Google Scholar] [CrossRef]
  22. Niu, N.; Li, L.; Li, X.; He, J. The Structural Dimensions and Community Vibrancy: An Exploratory Analysis in Guangzhou, China. Cities 2022, 127, 103771. [Google Scholar] [CrossRef]
  23. Ouyang, J.; Fan, H.; Wang, L.; Zhu, D.; Yang, M. Revealing Urban Vibrancy Stability Based on Human Activity Time-Series. Sustain. Cities Soc. 2022, 85, 104053. [Google Scholar] [CrossRef]
  24. Liu, S.; Zhang, L.; Long, Y. Urban Vitality Area Identification and Pattern Analysis from the Perspective of Time and Space Fusion. Sustainability 2019, 11, 4032. [Google Scholar] [CrossRef]
  25. Li, M.; Liu, J.; Lin, Y.; Xiao, L.; Zhou, J. Revitalizing Historic Districts: Identifying Built Environment Predictors for Street Vibrancy Based on Urban Sensor Data. Cities 2021, 117, 103305. [Google Scholar] [CrossRef]
  26. Cervero, R.; Kockelman, K. Travel Demand and the 3Ds: Density, Diversity, and Design. Transp. Res. Part D Transp. Environ. 1997, 2, 199–219. [Google Scholar] [CrossRef]
  27. Ewing, R.; Cervero, R. Travel and the Built Environment: A Meta-Analysis. J. Am. Plan. Assoc. 2010, 76, 265–294. [Google Scholar] [CrossRef]
  28. Ling, Z.; Zheng, X.; Chen, Y.; Qian, Q.; Zheng, Z.; Meng, X.; Kuang, J.; Chen, J.; Yang, N.; Shi, X. The Nonlinear Relationship and Synergistic Effects between Built Environment and Urban Vitality at the Neighborhood Scale: A Case Study of Guangzhou’s Central Urban Area. Remote Sens. 2024, 16, 2826. [Google Scholar] [CrossRef]
  29. Lu, S.; Shi, C.; Yang, X. Impacts of Built Environment on Urban Vitality: Regression Analyses of Beijing and Chengdu, China. Int. J. Environ. Res. Public Health 2019, 16, 4592. [Google Scholar] [CrossRef]
  30. Li, X.; Li, Y.; Jia, T.; Zhou, L.; Hijazi, I.H. The Six Dimensions of Built Environment on Urban Vitality: Fusion Evidence from Multi-Source Data. Cities 2022, 121, 103482. [Google Scholar] [CrossRef]
  31. Zhan, D.; Wang, Y.; Wu, Q.; Zhang, W. Nonlinear Effects of the Urban Built Environment on Urban Vitality: A Case Study of Hangzhou, China. J. Geogr. Sci. 2025, 35, 1183–1203. [Google Scholar] [CrossRef]
  32. Yang, J.; Cao, J.; Zhou, Y. Elaborating Non-Linear Associations and Synergies of Subway Access and Land Uses with Urban Vitality in Shenzhen. Transp. Res. Part A Policy Pract. 2021, 144, 74–88. [Google Scholar] [CrossRef]
  33. Duan, J.; Wang, H.; Liu, L.; Zhang, J. The Attraction Gradient of Urban Functions: How Does Functional Mix at Multiple Scales Predict Urban Vitality. Cities 2025, 156, 105516. [Google Scholar] [CrossRef]
  34. Jiang, Y.; Sun, Z.; Wei, D.; Zhao, P.; Yang, L.; Lu, Y. Revealing the Spatiotemporal Pattern of Urban Vibrancy at the Urban Agglomeration Scale: Evidence from the Pearl River Delta, China. Appl. Geogr. 2025, 181, 103694. [Google Scholar] [CrossRef]
  35. Wang, X.; Zhang, Y.; Li, C.; Yin, C.; Shao, C. Investigating Nonlinear and Spatially Heterogeneous Impacts of the Built Environment on Urban Vitality. Sustain. Cities Soc. 2025, 135, 107033. [Google Scholar] [CrossRef]
  36. Pan, H.; Yang, C.; Quan, L.; Liao, L. A New Insight into Understanding Urban Vitality: A Case Study in the Chengdu-Chongqing Area Twin-City Economic Circle, China. Sustainability 2021, 13, 10068. [Google Scholar] [CrossRef]
  37. Chen, Y.; Yu, B.; Shu, B.; Yang, L.; Wang, R. Exploring the Spatiotemporal Patterns and Correlates of Urban Vitality: Temporal and Spatial Heterogeneity. Sustain. Cities Soc. 2023, 91, 104440. [Google Scholar] [CrossRef]
  38. Lu, S.; Huang, Y.; Shi, C.; Yang, X. Exploring the Associations Between Urban Form and Neighborhood Vibrancy: A Case Study of Chengdu, China. ISPRS Int. J. Geo-Inf. 2019, 8, 165. [Google Scholar] [CrossRef]
  39. Sheng, J.; He, Y.; Lu, T.; Wang, F.; Huang, Y.; Leng, B.; Zhang, X.; Chen, Y. Unveiling Urban Vitality and Its Interactions in Mountainous Cities: A Human Behaviour Perspective on Community-Level Dynamics. Cities 2025, 159, 105780. [Google Scholar] [CrossRef]
  40. Sheng, J.; He, Y.; Lu, T.; Wang, F.; Huang, Y.; Leng, B.; Zhang, X.; Chen, Y. Exploring Urban Vitality Characteristics and Interactive Mechanisms at the Community Scale through the Lens of Human Behaviour: A Case Study of Chongqing, China. ISPRS Ann. Photogramm. Remote Sens. Spat. Inf. Sci. 2024, X-4-2024, 303–310. [Google Scholar] [CrossRef]
  41. Lian, A.; Zhang, Y.; Cai, Y.; Wang, Z.; Sun, X.; Jiao, Y.; Dong, R. Exploring the Nonlinear Relationship and Interaction Effects between the Built Environment and Street Vitality Using Machine Learning Methods. Ecol. Front. 2025, 46, 932–946. [Google Scholar] [CrossRef]
  42. Chen, S.; Lang, W.; Li, X. Evaluating Urban Vitality Based on Geospatial Big Data in Xiamen Island, China. Sage Open 2022, 12, 21582440221134519. [Google Scholar] [CrossRef]
  43. Zeng, Z.; Li, Y.; Tang, H. Multidimensional Spatial Driving Factors of Urban Vitality Evolution at the Subdistrict Scale of Changsha City, China, Based on the Time Series of Human Activities. Buildings 2023, 13, 2448. [Google Scholar] [CrossRef]
  44. Yang, J.; Wang, E. Exploring the Nonlinear Impacts of Built Environment on Urban Vitality from a Spatiotemporal Perspective at the Block Scale in Chongqing. ISPRS Int. J. Geo-Inf. 2025, 14, 225. [Google Scholar] [CrossRef]
  45. Sun, F.; Wang, E. Unveiling the Spatial Heterogeneity of Urban Vitality Using Machine Learning Methods: A Case Study of Tianjin, China. Land 2025, 14, 1316. [Google Scholar] [CrossRef]
  46. Fan, Z.; Duan, J.; Luo, M.; Zhan, H.; Liu, M.; Peng, W. How Did Built Environment Affect Urban Vitality in Urban Waterfronts? A Case Study in Nanjing Reach of Yangtze River. ISPRS Int. J. Geo-Inf. 2021, 10, 611. [Google Scholar] [CrossRef]
  47. Meng, Y.; Xing, H. Exploring the Relationship between Landscape Characteristics and Urban Vibrancy: A Case Study Using Morphology and Review Data. Cities 2019, 95, 102389. [Google Scholar] [CrossRef]
  48. Tang, L.; Lin, Y.; Li, S.; Li, S.; Li, J.; Ren, F.; Wu, C. Exploring the Influence of Urban Form on Urban Vibrancy in Shenzhen Based on Mobile Phone Data. Sustainability 2018, 10, 4565. [Google Scholar] [CrossRef]
  49. Wu, J.; Ta, N.; Song, Y.; Lin, J.; Chai, Y. Urban Form Breeds Neighborhood Vibrancy: A Case Study Using a GPS-Based Activity Survey in Suburban Beijing. Cities 2018, 74, 100–108. [Google Scholar] [CrossRef]
  50. Ha, Y.; Kim, H. COVID-19 and Urban Vitality: The Association between Built Environment Elements and Changes in Local Points of Interest Using Social Media Data in South Korea. Sustain. Cities Soc. 2025, 123, 106271. [Google Scholar] [CrossRef]
  51. Huang, B.; Wu, B.; Barry, M. Geographically and Temporally Weighted Regression for Modeling Spatio-Temporal Variation in House Prices. Int. J. Geogr. Inf. Sci. 2010, 24, 383–401. [Google Scholar] [CrossRef]
  52. Li, M.; Pan, J. Assessment of Influence Mechanisms of Built Environment on Street Vitality Using Multisource Spatial Data: A Case Study in Qingdao, China. Sustainability 2023, 15, 1518. [Google Scholar] [CrossRef]
  53. Ozkan, J. Thinking Outside the Black Box: CardioPulse Takes a Look at Some of the Issues Raised by Machine Learning and Artificial Intelligence. Eur. Heart J. 2023, 44, 1007–1009. [Google Scholar] [CrossRef]
  54. Hu, S.; Xiong, C.; Chen, P.; Schonfeld, P. Examining Nonlinearity in Population Inflow Estimation Using Big Data: An Empirical Comparison of Explainable Machine Learning Models. Transp. Res. Part A Policy Pract. 2023, 174, 103743. [Google Scholar] [CrossRef]
  55. Wei, L.; Luo, Y.; Wang, M.; Cai, Y.; Su, S.; Li, B.; Ji, H. Multiscale Identification of Urban Functional Polycentricity for Planning Implications: An Integrated Approach Using Geo-Big Transport Data and Complex Network Modeling. Habitat Int. 2020, 97, 102134. [Google Scholar] [CrossRef]
  56. Gómez-Varo, I.; Delclòs-Alió, X.; Miralles-Guasch, C. Jane Jacobs Reloaded: A Contemporary Operationalization of Urban Vitality in a District in Barcelona. Cities 2022, 123, 103565. [Google Scholar] [CrossRef]
  57. Delclòs-Alió, X.; Miralles-Guasch, C. Looking at Barcelona through Jane Jacobs’s Eyes: Mapping the Basic Conditions for Urban Vitality in a Mediterranean Conurbation. Land Use Policy 2018, 75, 505–517. [Google Scholar] [CrossRef]
  58. Fang, C.; He, S.; Wang, L. Spatial Characterization of Urban Vitality and the Association With Various Street Network Metrics From the Multi-Scalar Perspective. Front. Public Health 2021, 9, 677910. [Google Scholar] [CrossRef]
  59. Mouratidis, K.; Delclòs-Alió, X. Urban Vitality versus Urban Livability: Does Vibrancy Matter for Neighborhood Satisfaction and Neighborhood Happiness? Cities 2026, 168, 106473. [Google Scholar] [CrossRef]
  60. Zhang, Z.; Liu, J.; Wang, C.; Zhao, Y.; Zhao, X.; Li, P.; Sha, D. A Spatial Projection Pursuit Model for Identifying Comprehensive Urban Vitality on Blocks Using Multisource Geospatial Data. Sustain. Cities Soc. 2024, 100, 104998. [Google Scholar] [CrossRef]
  61. Li, L.; Yang, Q.; Cai, J.; Zheng, X.; Zhang, S.; Ding, M.; Wu, Y. Nonlinear Effects of Built Environment on Living Street Vitality Considering Spatial Heterogeneity: Evidence from Xiamen Island, China. Front. Archit. Res. 2025; in press. [CrossRef]
  62. Yuan, L.; Sho, K.; Eom, S.; Nishi, H.; Hasegawa, D.; Zhao, H.; Aoki, T.; Zhu, J.; Matsuo, K.; Masumura, A. Changes in Visitor Behaviour across COVID-19 Pandemic: Unveiling Urban Visitation Dynamics and Non-Linear Relationships with the Built Environment Using Mobile Big Data. Habitat Int. 2024, 154, 103216. [Google Scholar] [CrossRef]
  63. Han, C.; Zhang, Z. Nonlinear Effects of Built Environment Perception and Objective Features on Street Vitality in Historic Districts. Front. Archit. Res. 2025, 15, 1075–1091. [Google Scholar] [CrossRef]
  64. Sung, H.; Lee, S. Residential Built Environment and Walking Activity: Empirical Evidence of Jane Jacobs’ Urban Vitality. Transp. Res. Part D Transp. Environ. 2015, 41, 318–329. [Google Scholar] [CrossRef]
  65. Shao, J.; Long, Y.; Liu, X.; Zheng, Y.; Song, Y.; Wang, J.; Liu, B.; Yang, J.; Chen, Y.; Zhang, F. Machine Learning-Based Study on Factors Influencing Street Vitality in Urban Fringe Commercial Districts: A Case of Wuhan. Front. Archit. Res. 2025, 15, 582–608. [Google Scholar] [CrossRef]
  66. Tan, Y.; Song, J.; Bai, Y.; Li, Y. Beyond Objective Features: Integrating Subjective Perceptions to Decipher Urban Vitality via Multimodal Machine Learning. Habitat Int. 2026, 168, 103676. [Google Scholar] [CrossRef]
  67. Wen, D.; Wang, L.; Cao, Q.; Hong, M.; Wang, H.; Bian, G. A Comparative Study of the Effects of Urban Morphology on Land Surface Temperature in Chengdu and Chongqing, China. Sci. Rep. 2024, 14, 25130. [Google Scholar] [CrossRef]
Figure 1. Location of the study area and division of research units.
Land 15 00844 g001
Figure 2. Research framework.
Land 15 00844 g002
Figure 3. Distribution of urban vitality in Chengdu.
Land 15 00844 g003
Figure 4. Distribution of urban vitality in Chongqing.
Land 15 00844 g004
Figure 5. Relative importance and bee swarm plots of BE’s impacts on UV in Chengdu.
Land 15 00844 g005
Figure 6. Relative importance and bee swarm plots of BE’s impacts on UV in Chongqing.
Land 15 00844 g006
Figure 7. Nonlinear effects and threshold effects of BE on UV in Chengdu.
Land 15 00844 g007
Figure 8. Nonlinear effects and threshold effects of BE on UV in Chongqing.
Land 15 00844 g008
Table 1. Description of built environment indicators.
DimensionIndicatorCalculation FormulaVariable DefinitionData Source
DensityBuilding Density
(BD)
B D = A b u i l d i n g A g r i d A b u i l d i n g —building footprint area within the grid
A g r i d —area of the grid unit
Zenodo.
(https://zenodo.org/records/12674244, accessed on 8 December 2024)
Road Network
Density
(RD)
R D = L r o a d A g r i d L r o a d —length of road within the grid
A g r i d —area of the grid unit
OSM data.
(https://www.openstreetmap.org, accessed on 7 December 2024)
DiversityFunctional
Mix Degree
(FMD)
F M D = k = 1 m p k ln ( p k ) p k —proportion of POI category k within the grid
m —number of POI categories
(calculated using
Shannon’s diversity index)
Gaode Map.
(https://www.openstreetmap.org, accessed on 12 December 2024)
DesignRoad Intersection
Density
(RID)
R I D = N i n t e r s e c t i o n A g r i d N i n t e r s e c t i o n —number of road intersections within the grid
A g r i d —area of the grid unit
OSM data.
Normalized Difference
Vegetation Index
(NDVI)
N D V I = N D V I ¯ g r i d N D V I ¯ g r i d —average NDVI value of pixels within the gridAI Earth.
(https://engine-aiearth.aliyun.com, accessed on 15 December 2024)
Mean Building Height
(MBH)
M B H = j = 1 n H j n H j —height of building j within the grid
n —total number of buildings in the grid
Zenodo
Destination accessibilityCommercial
Accessibility
(CA)
C A = d m i n , c o m m e r c i a l d m i n , c o m m e r c i a l —Euclidean distance from grid centroid to the nearest commercial POIGaode Map
Park and Square
Accessibility
(PSA)
P S A = d m i n , p a r k d m i n , p a r k —Euclidean distance from grid centroid to the nearest park or squareGaode Map
Cultural and Leisure
Accessibility
(CLA)
C L A = d m i n , c u l t u r e d m i n , c u l t u r e —Euclidean distance from grid centroid to the nearest cultural or leisure POIGaode Map
Distance to transitBus Stop Accessibility
(BSA)
B S A = d m i n , b u s d m i n , b u s —Euclidean distance from grid centroid to the nearest bus stopGaode Map
Metro Station
Accessibility
(MSA)
M S A = d m i n , m e t o r d m i n , m e t o r —Euclidean distance from grid centroid to the nearest metro stationGaode Map
Table 2. Dominant key indicators and heterogeneous key indicators.
Dominant Key
Indicators Across
Scales
Heterogeneous Key
Indicators Across
Scales
Dominant Key
Indicators Between
Cities
Heterogeneous Key
Indicators Between
Cities
ChengduBuilding Density (BD),
Road Intersection Density (RID),
Mean Building Height (MBH)
Road Network Density (RD),
Road Intersection Density (RID),
Commercial Accessibility (CA),
Cultural and Leisure
Accessibility (CLA)
Building Density (BD),
Mean Building Height (MBH)
Road Network Density (RD),
Road Intersection Density (RID),
Commercial Accessibility (CA),
Cultural and Leisure
Accessibility (CLA)
ChongqingBuilding Density (BD),
Mean Building Height (MBH),
Commercial Accessibility (CA)
Road Intersection Density (RID),
Commercial Accessibility (CA),
Cultural and Leisure
Accessibility (CLA)
Disclaimer/Publisher’s Note: The statements, opinions and data contained in all publications are solely those of the individual author(s) and contributor(s) and not of MDPI and/or the editor(s). MDPI and/or the editor(s) disclaim responsibility for any injury to people or property resulting from any ideas, methods, instructions or products referred to in the content.