Article

Modeling Employment Sectoral Distribution Using POI Data: Assessing Tourism Functions in Data-Scarce Destinations
1
School of Geographical Sciences, Nanjing University of Information Science & Technology, Nanjing 210044, China
2
Research Center of Urban Sustainable Development, Nanjing University of Information Science & Technology, Nanjing 210044, China
3
State Key Laboratory of Lake and Watershed Security, Nanjing Institute of Geography and Limnology, Chinese Academy of Sciences, Nanjing 210008, China
*
Author to whom correspondence should be addressed.
Land 2026, 15(5), 831; https://doi.org/10.3390/land15050831
Submission received: 1 April 2026 / Revised: 4 May 2026 / Accepted: 8 May 2026 / Published: 13 May 2026

Abstract

With the advancement of urbanization, the functions of cities continue to expand and deepen, among which the tourism function plays an increasingly important role in urban and regional economic development. To resolve the challenges in data acquisition for urban function classification and assessment, this study introduces POI data and machine learning methods to construct an employment sector distribution model. This enables the estimation of tourism-related employment data in Pacific Island countries. The tourism function of these cities is quantitatively evaluated based on two dimensions: functional scale and functional intensity. The results show that: (1) The constructed employment sector distribution model demonstrates strong predictive performance. The error rate for the total employed population in each island country is below 10%. The Bootstrap robustness test confirms that predicted values for all countries fall within the 95% confidence interval. The number of tourism employees shows a significant positive correlation with inbound tourist numbers and the count of tourism-related POIs at the 0.01 level. Empirical validation shows tourism-related sector error rates of 4.44% for Ningbo and 9.02% for Wuxi, both of which are under 10%. (2) Tourism in thirteen countries, including Samoa and Tonga, constitutes a fundamental function of the national economy, whereas in Papua New Guinea, tourism is a non-fundamental function, reflecting a lower degree of economic reliance on the tourism sector. (3) A provisional typology of tourism functions is proposed, identifying Fiji and The Cook Islands as robustly specialized, while Papua New Guinea remains characterized by stable low-specialization. The remaining 11 countries occupy transitional positions where classification is sensitive to prediction uncertainty. Subject to this caveat, the PICs are provisionally categorized into three groups: medium-to-large specialized (Fiji, Cook Islands, Vanuatu, and Samoa), small specialized (Tuvalu, Palau, Solomon Islands, and Tonga), and low-specialization (Papua New Guinea, Kiribati, Federated States of Micronesia, Nauru, Niue, and Marshall Islands). The classification results can guide these island nations in enhancing their tourism functions, fostering sound regional development, and enabling more effective participation in global governance.

1. Introduction

With the deepening of globalization and the expansion of world city networks, the identification of urban functions has regained significance by helping position cities in global competition. Urban functions represent the specialized roles and divisions of labor a city performs within a regional socio-economic system, reflecting its external influence across economic, political, and cultural dimensions [1,2]. Among these, the tourism function is an integral component of a city’s overall functional profile. It acts as a bridge between regional economies, where its development both derives from and enhances the city’s general socio-economic capacity. Consequently, scientifically assessing the tourism function is a critical prerequisite for optimizing industrial layouts and promoting sustainable regional development.
The identification of urban functions has historically evolved from qualitative descriptions to sophisticated quantitative modeling. Aurousseau [3] pioneered this field by classifying urban functions into six categories—administration, defense, culture, production, transport, and recreation—to lay a theoretical foundation. Subsequently, Nelson [4] applied a statistical method based on frequency distribution and standard deviations to measure functional specialization, while Webb [5] introduced industrial indices to refine these classifications. Furthering this technical evolution, Maxwell [6] utilized multivariate analysis to identify functional types, and Berry [7] applied factor analysis to organize urban systems into comprehensive frameworks. In China, early research was localized to specific provinces [8] until Zhou Yixing et al. [9] established a multi-tier classification system using national labor force structure data. To capture long-term shifts, Cao Guangzhong et al. [10] conducted systematic tracking research using data from the fifth, sixth, and seventh national population censuses, revealing the dynamic spatial patterns of China’s urban functions between 2000 and 2020. While these traditional approaches provided essential frameworks, the transition toward modern big data has addressed long-standing limitations regarding data granularity and timeliness. Recent advancements have seen scholars integrate multi-source data, such as nighttime light imagery and enterprise employment registrations, to refine urban function classification [11,12]. Within the specific domain of tourism, researchers have moved beyond general descriptions; for instance, some have proposed systematic methods to classify tourism cities by measuring their capacity to attract visitors and facilitate cultural exchange [13], while others have utilized gravity models and spatial analysis to evaluate the regional appeal of tourism functions [14,15,16]. Despite these advancements, a significant research gap persists: traditional and early big-data models frequently depend on high-quality, consistent industrial or statistical data. In many regions, such data are scarce or inconsistent, creating a bottleneck for in-depth functional research [17,18].
To overcome these data limitations, Points of Interest (POIs) have emerged as a high-potential geographic data source. Because POI data represent physical entities associated with specific socio-economic activities, they provide a direct link between spatial distribution and urban functional roles [19]. Recently, POI data have been effectively applied to delineate functional zones [20,21] and identify urban centers [22]. By serving as a spatial proxy for economic activities, POI data can supplement or even replace traditional statistical sources, offering a robust basis for modeling employment structures and evaluating urban functions in a more granular and timely manner.
The selection of the Pacific Island Countries (PICs) as the empirical context for this study is motivated by their representative data scarcity and pronounced economic reliance on tourism. On one hand, PICs typify a broader class of Small Island Developing States (SIDS) that lack unified, long-term statistical collection mechanisms. This data deficit systematically hinders evidence-based assessments of urban functions and sectoral employment structures. For PICs specifically, such gaps mean that shifts in tourism-driven labor markets often go unmonitored, preventing effective regional planning. On the other hand, tourism constitutes a dominant pillar of economic activity across most PICs. As highlighted in ref. [23], these nations are key partners in the Belt and Road Initiative, where international tourism receipts account for a substantial share of Gross Domestic Product (GDP) and employment. However, the lack of unified data collection identified in the previous literature limits the ability to evaluate these tourism functions systematically. The coexistence of acute data limitations and high tourism dependency makes PICs an ideal testbed for this research. These nations serve as a strategically important environment for developing a transferable employment estimation framework that operates independently of traditional census data.
Although this study focuses on the PICs, the methodological logic is inherently transferable. This logic involves extracting POI-employment associations—defined as the spatial correlations between functional Points of Interest and localized labor distribution—from a data-rich training region and applying them to a structurally similar but data-poor target region. This framework can be adapted to other SIDS and remote regions facing comparable statistical constraints, such as certain Caribbean or Indian Ocean island states. Extending the approach to the Indian Ocean is particularly viable because those states share a similar structural reliance on tourism-led development and encounter analogous POI-sectoral distributions. Future research could incorporate training samples from a more diverse set of such island economies to further strengthen the model’s generalizability across different geographic and institutional settings.
Based on the aforementioned methodology, this study further explores the following specific research problems: (1) the implementation of cross-regional data transfer modeling, which involves using learned parameters from data-abundant areas to estimate variables in data-deficient regions; (2) the verification of POI data as a viable substitute for traditional statistics in tourism-centric economies; and (3) the construction of a quantitative framework for tourism functions applicable to regions with heterogeneous data availability. By addressing these points, the findings aim to provide a methodological reference for urban function assessment in data-scarce environments and offer scientific evidence for regional planning in the PICs.

2. Materials and Methods

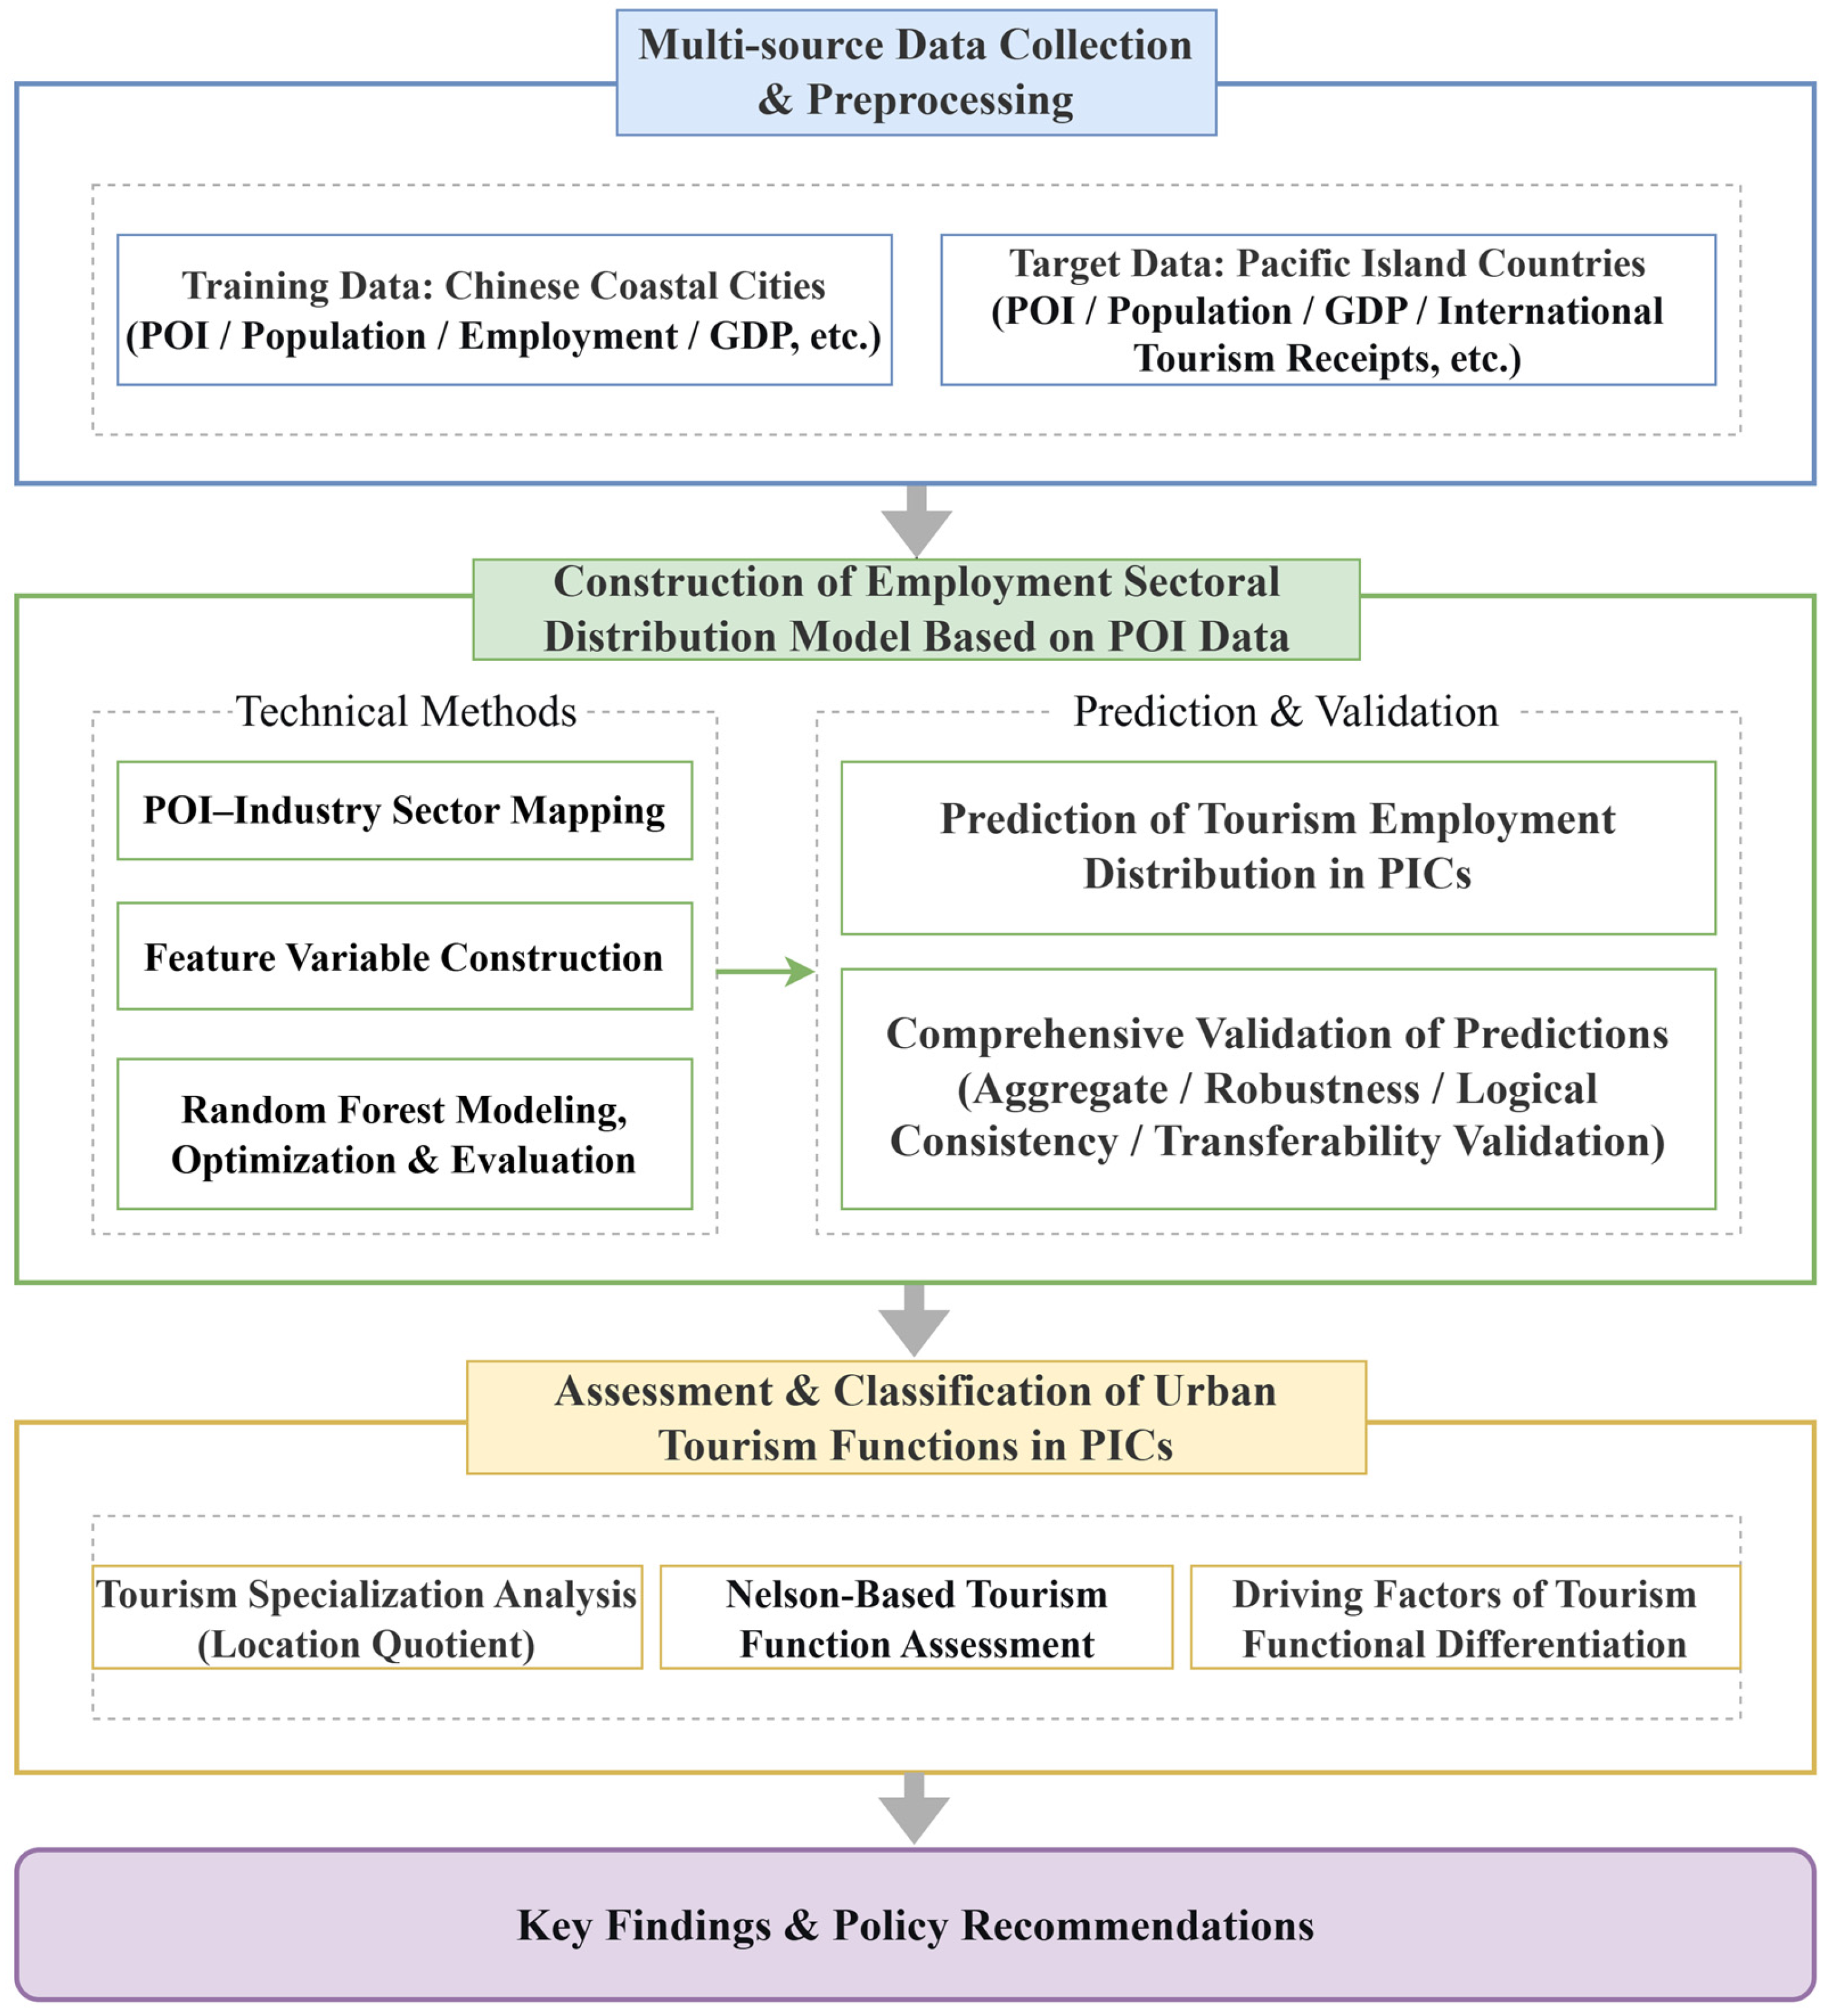
Figure 1 illustrates the methodological framework, providing a concise overview of the analytical workflow. This structured approach begins with the collection and preprocessing of multi-source data, which facilitates the construction and comprehensive validation of a POI-based employment sectoral distribution model. Subsequently, this model is applied to the systematic assessment, classification, and interpretation of urban tourism functions across the Pacific Island Countries.

2.1. Overview of the Study Area

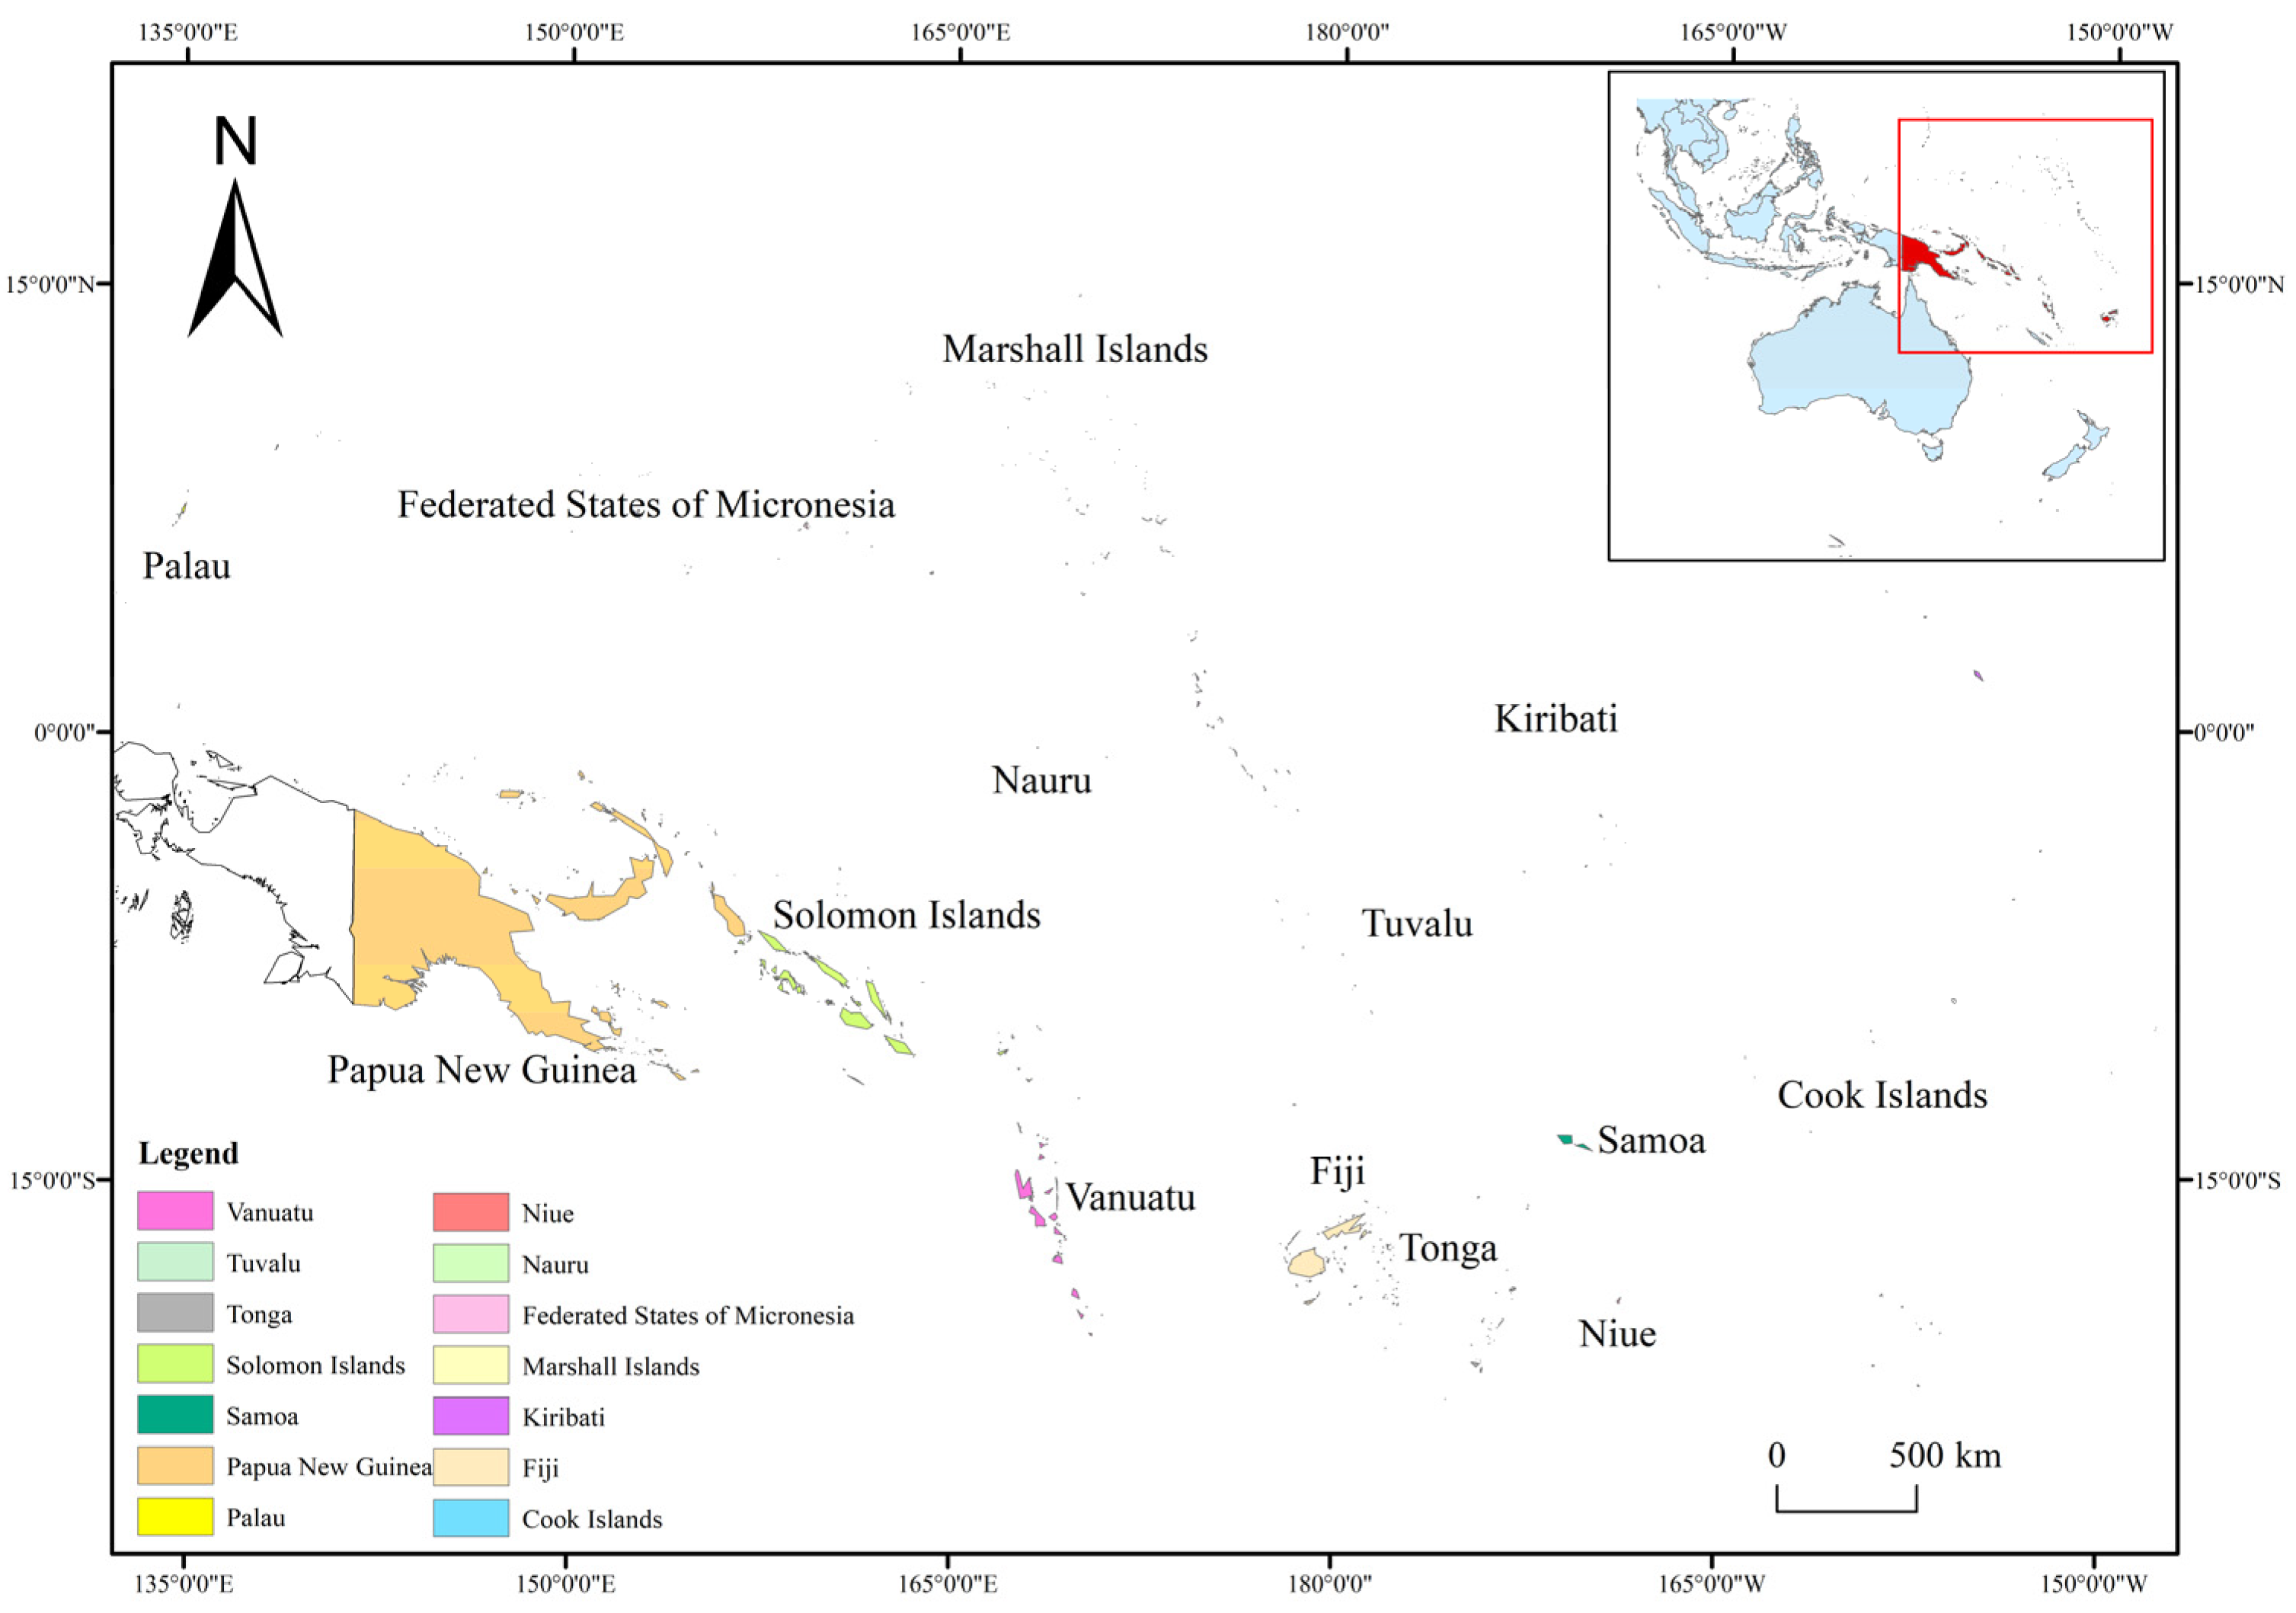
The Pacific Island Countries (PICs) encompass 14 sovereign nations in the South Pacific, excluding Australia and New Zealand [24,25]. These include Papua New Guinea, Fiji, Samoa, Tonga, Kiribati, Vanuatu, The Federated States of Micronesia, the Solomon Islands, Nauru, Tuvalu, The Marshall Islands, Palau, The Cook Islands, and Niue [26] (Figure 2). Geographically and culturally, these nations are distributed across three distinct subregions: Melanesia, characterized by larger volcanic islands and high cultural diversity; Micronesia, which consists primarily of small coral atolls in the north; and Polynesia, defined by vast oceanic distances and shared maritime traditions.
Collectively, the region comprises over 10,000 islands with a total land area of approximately 550,000 km2 and a population of roughly 7.5 million. The constituent nations exhibit a wide disparity in scale and demographics. Papua New Guinea is the largest nation, with a land area of 462,800 km2 and a population of approximately 5.3 million. In contrast, Nauru represents the smallest, covering only 21 km2 with a population of about 12,800 [27].
These unique geographical and demographic characteristics fundamentally shape the regional economic landscape. The combination of limited land resources and a vast collective Exclusive Economic Zone (EEZ) of 28 million km2 underscores the “small islands, large ocean” paradigm, driving a heavy reliance on marine ecosystems. Consequently, the economy is dominated by fisheries, agriculture, and tourism. Although most PICs are categorized as developing economies, tourism has emerged as a vital pillar and has experienced rapid growth. This expansion, fueled by improved regional air connectivity and an increasing global demand for remote ecotourism, has significantly boosted local revenues while placing urgent demands on infrastructure development and service quality [23].

2.2. Data Sources and Preprocessing

2.2.1. Demographic and Economic Data

This study utilizes datasets from coastal cities in China and various Pacific Island Countries to construct and validate an employment distribution model. Data from Chinese coastal cities serve as the primary basis for model development, while data from Pacific Island Countries are used for model application and regional context analysis.
For the model construction phase, data from 44 coastal cities in China, including Xiamen, Ningde, Quanzhou, Zhangzhou, Fuzhou, and Putian, were collected for the period 2012 to 2017. These cities were selected due to their geographical and developmental similarities to the study’s target island regions. Information regarding annual total population, sectoral employment, and Gross Domestic Product (GDP) was extracted from the China City Statistical Yearbook for the corresponding years. To facilitate employment estimation, POI data were processed by classifying points into specific industry sectors and calculating their spatial density. By establishing a correlation between POI density and official sectoral employment figures, we determined the employment weights for different categories, thereby enabling the refined estimation of the employed population across various urban zones.
For the Pacific Island Countries, demographic and economic datasets were primarily sourced from the World Bank, official national statistical offices (such as those of Fiji and Papua New Guinea), and the Population Division of the United Nations Department of Economic and Social Affairs. Employment data were estimated based on regional reports from the World Bank and the International Labour Organization (ILO). Additionally, variables such as inbound tourist arrivals, GDP, and the proportion of international tourism revenue to total exports were obtained from the World Bank. These data points were integrated with the POI-based model to analyze and estimate employment patterns within the specific geographical and economic frameworks of the Pacific region.

2.2.2. POI Data Collection and Processing

The POI dataset was integrated from two distinct sources to ensure comprehensive coverage across different geographic scales. Data for coastal prefecture-level cities in China were retrieved from Baidu Maps’ public resources, representing the status as of September 2024. To complement this, POI data for Pacific Island Countries were obtained from OpenStreetMap (OSM), current as of December 2024. Each entry includes essential attributes such as name, coordinates, address, and administrative district. Following systematic screening and cleaning, the final dataset comprises approximately 17 million records for Chinese coastal cities and over 14,000 records for Pacific Island Countries. This integration, aligned with the respective regional update cycles, ensures that the resulting database reflects the most recent spatial characteristics of both the domestic and international study areas.

2.3. Construction of an Employment Sectoral Distribution Model Based on POI Data

2.3.1. Feature and Target Variable Data Preparation

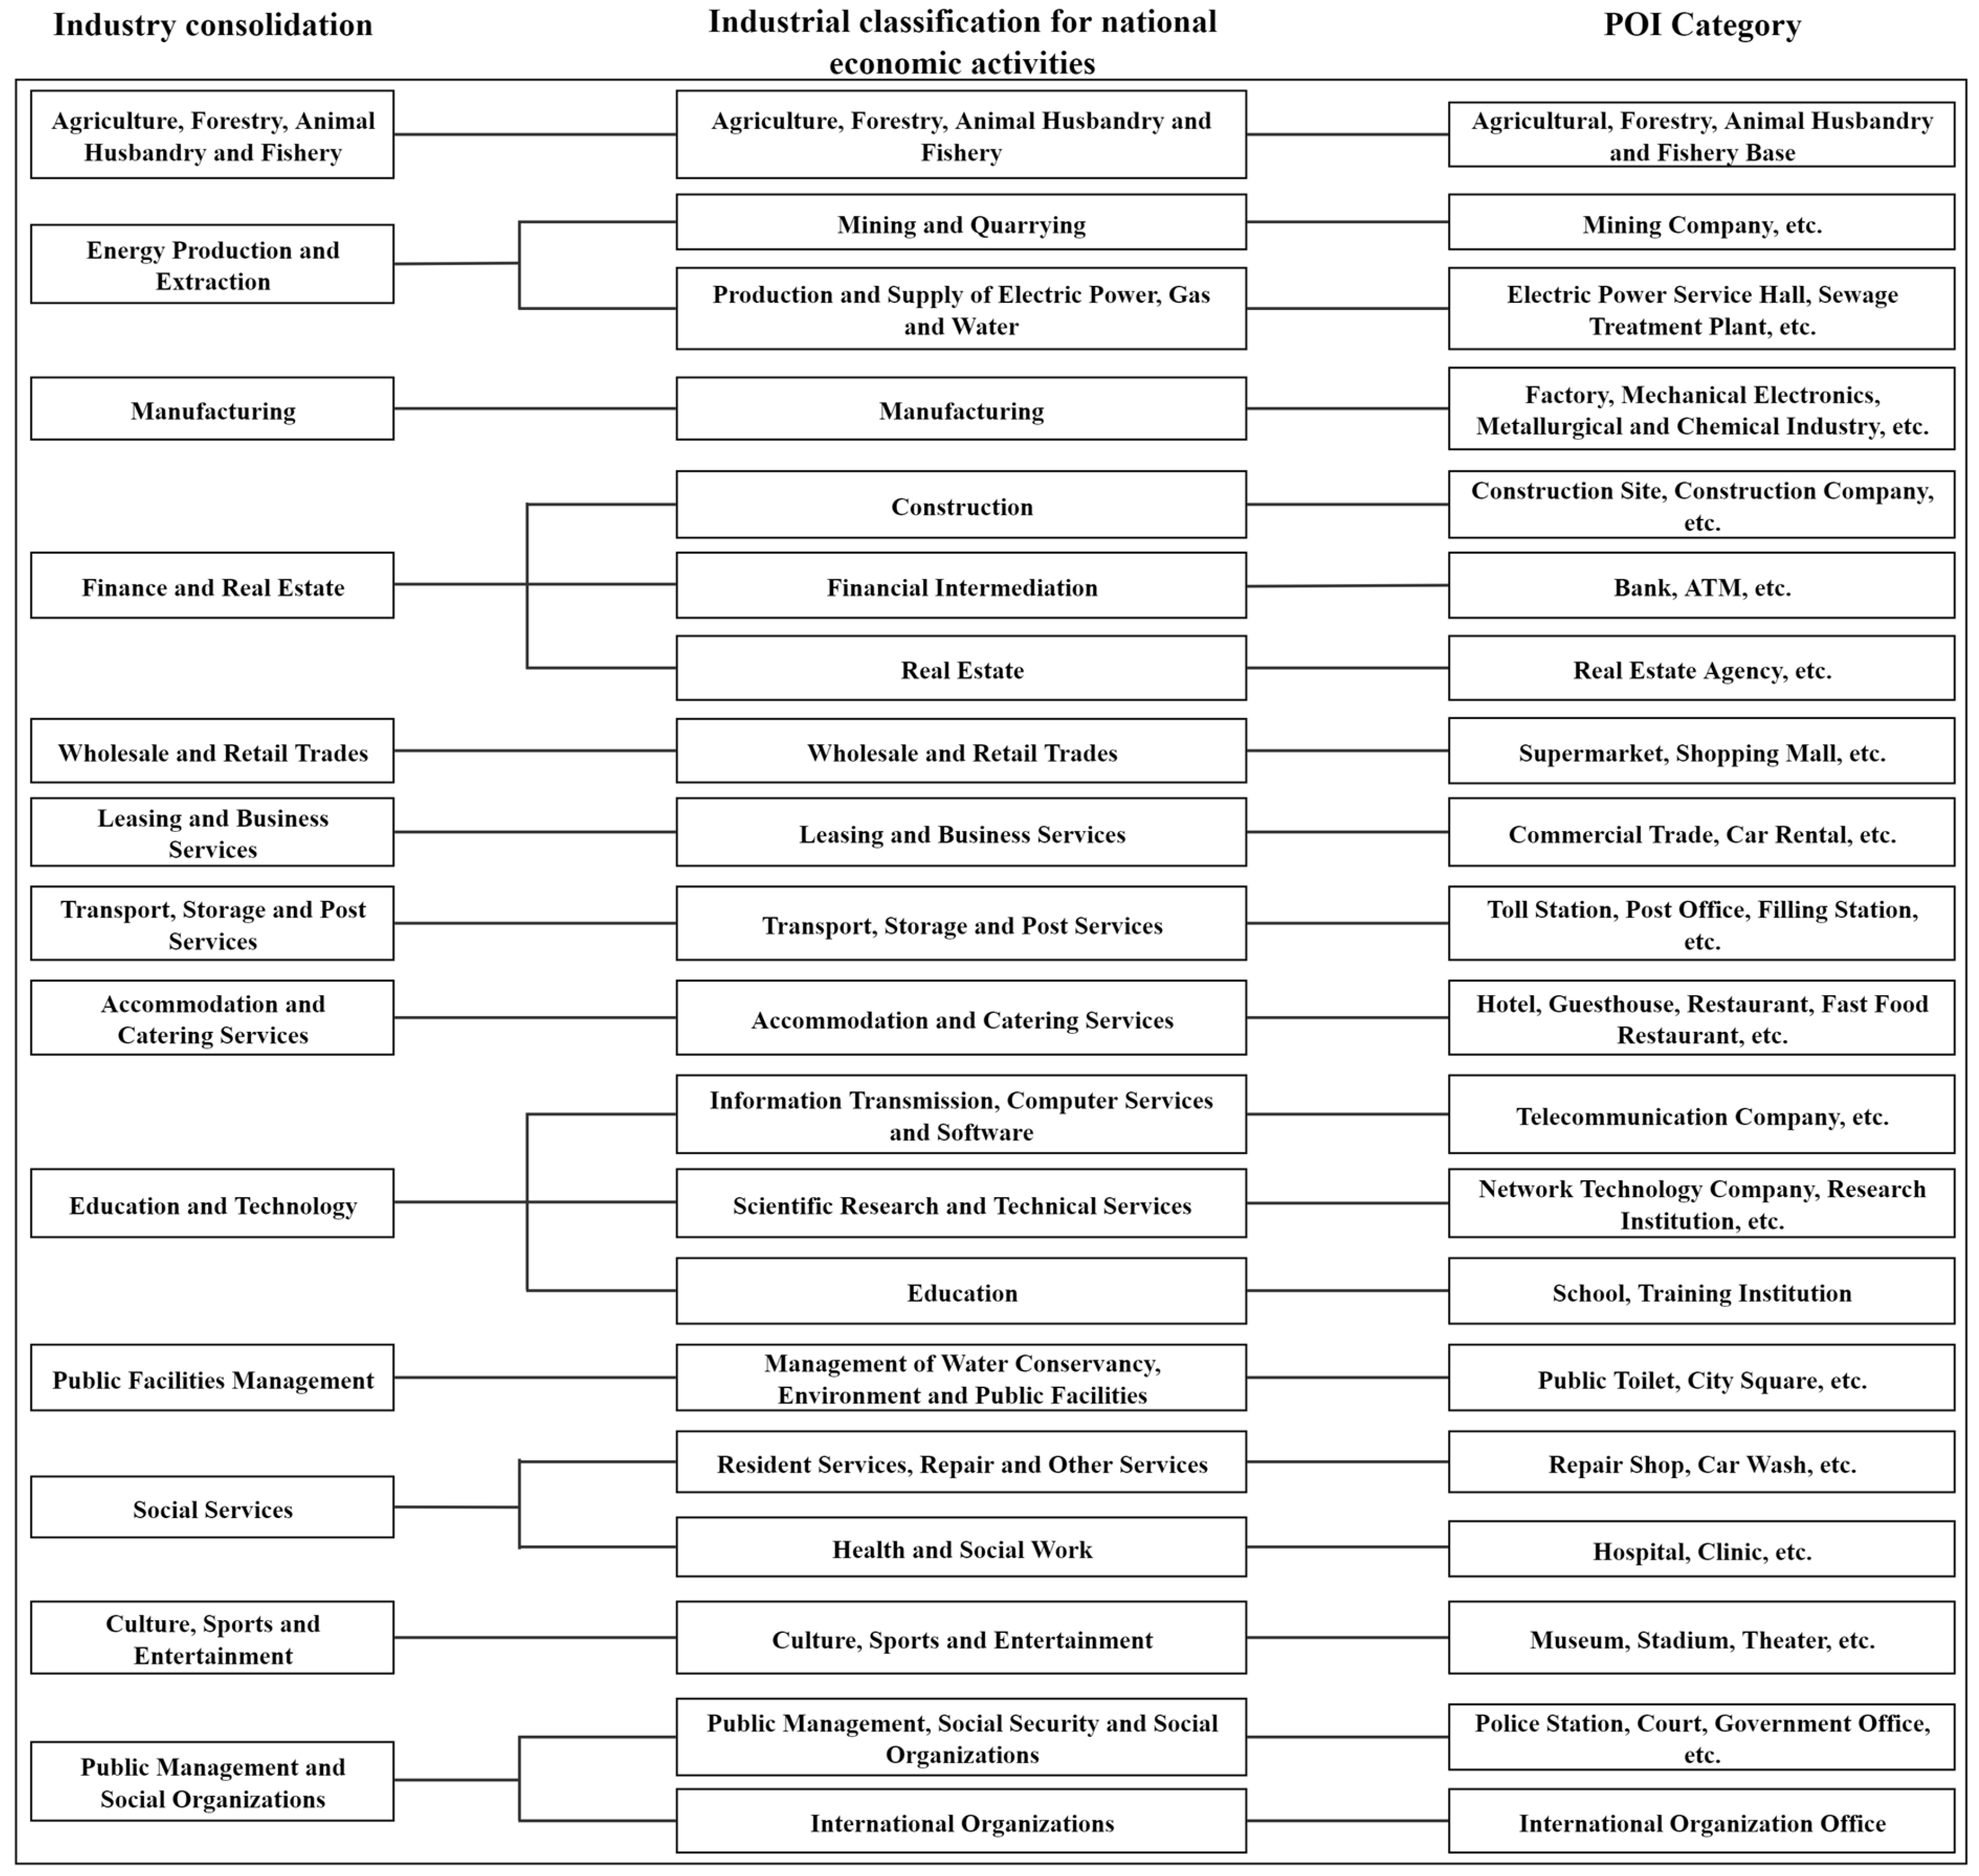
To determine the most appropriate modeling basis, a comparative analysis was conducted across three categories of Chinese city samples: nationwide, inland, and coastal. Through an evaluation of marine dependency, industrial structure, and spatial scale, it was determined that coastal prefecture-level cities exhibit the highest structural parity with Pacific Island Countries. Consequently, 44 coastal cities were selected to form the basis of the model. The sectoral classification was initially based on the Industrial Classification for National Economic Activities (GB/T 4754-2017) of China. To ensure sectoral consistency for international comparison, logically similar industries were merged into 13 broad sectors by incorporating the classification methodologies found in existing studies [28,29,30].
As POI data offer a high-resolution reflection of urban functions and economic activities, they provide the necessary spatial granularity to support the construction of the employment distribution model. Accordingly, POI data for both China and Pacific Island Countries were reclassified [31,32,33] to establish a precise mapping between POI categories and the identified national economic sectors, as shown in Figure 3. Because industries such as Wholesale and Retail Trades; Leasing and Business Services; Transport, Storage, and Post Services; Accommodation and Catering Services; Public Facilities Management; and Culture, Sports, and Entertainment are fundamentally driven by tourist demand and service provision, they were identified as tourism-related sectors. These sectors serve as the essential framework for subsequent specialized tourism function assessments.
In terms of variable configuration, the proportion of POI counts for each sector relative to the total POI count in the city was used as a structural feature variable to characterize the city’s industrial composition. Additionally, the annual total population and GDP were introduced as scale feature variables to reflect the labor force and overall economic scale of the city or region. The target variable was defined as the proportion of the employed population in each sector relative to the total population. Missing values in the dataset were imputed using the median to ensure data integrity. By modeling relative values rather than absolute figures, this approach enhances the transferability of the model across cities of varying sizes.
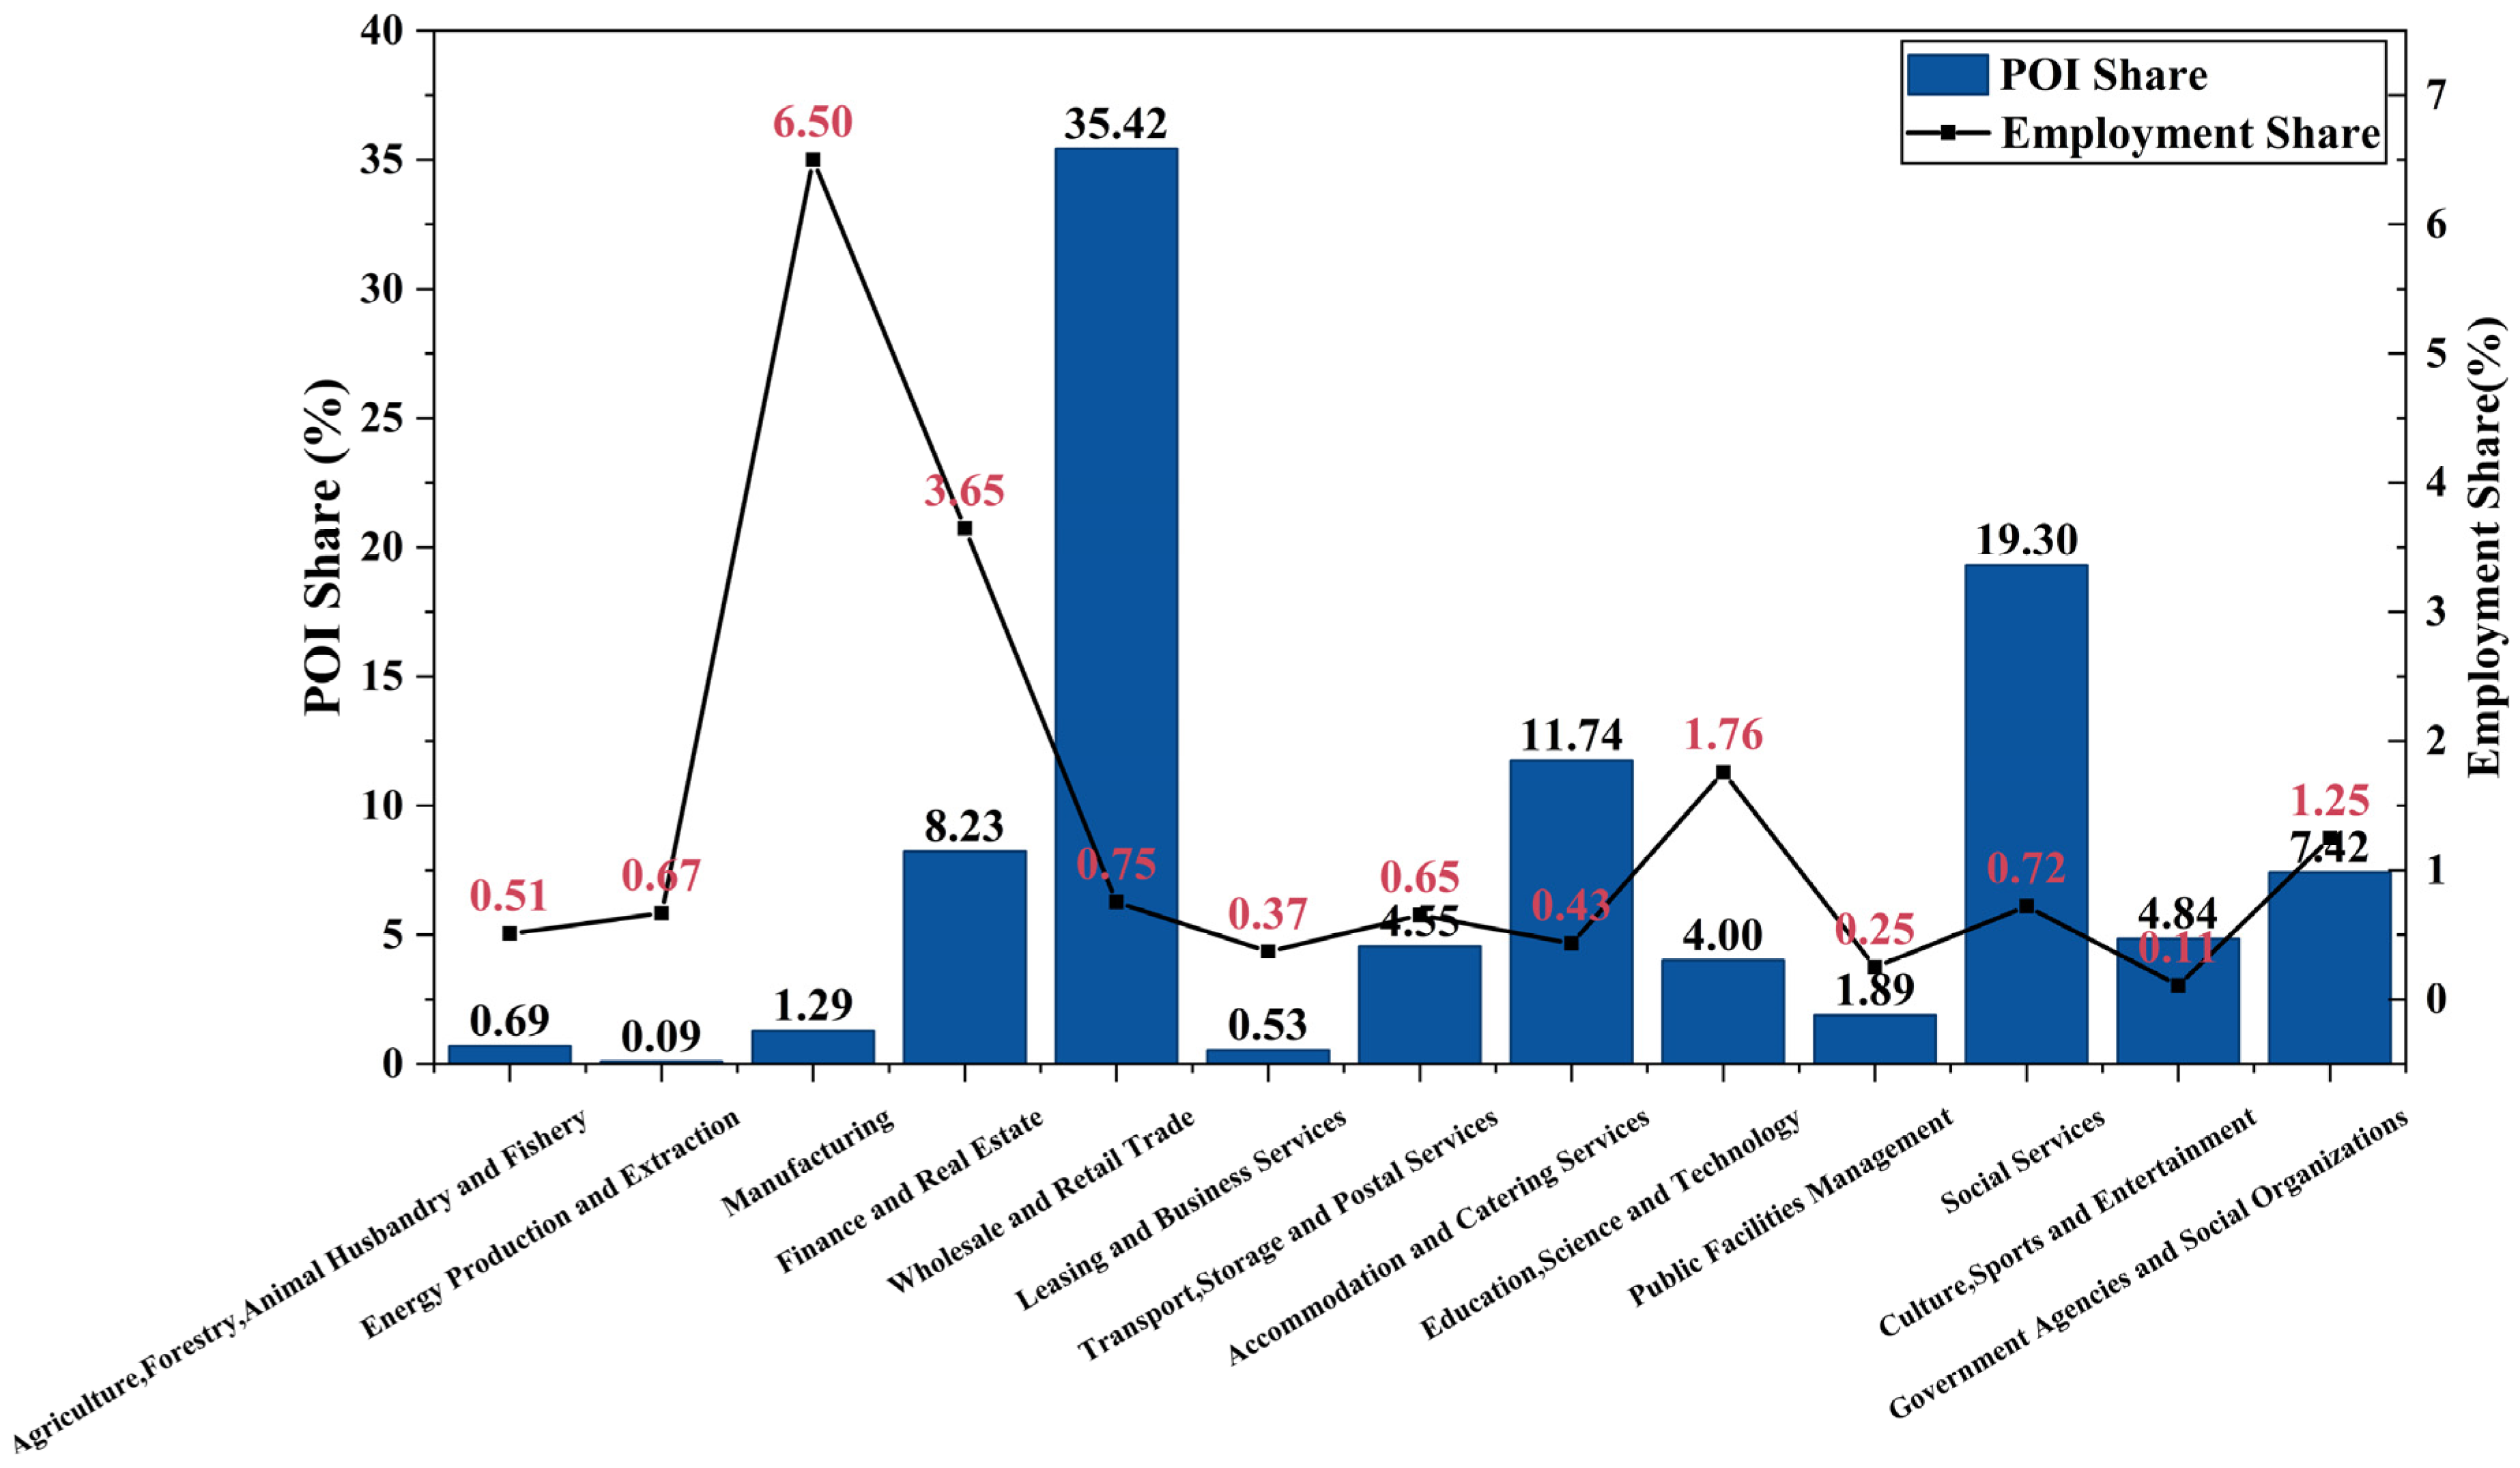
Prior to model construction, an exploratory data analysis (EDA) was conducted to examine the structural relationship between POI shares and employment shares. Figure 4 presents the overall POI structure and employment structure of the training sample (44 Chinese coastal cities, averaged over 2012–2017). A pronounced misalignment between POI density and employment intensity is evident across sectors; specifically, Wholesale and Retail Trades accounts for 35.42% of total POIs but only 0.75% of total employment, whereas Manufacturing contributes merely 1.29% of POIs yet represents 6.50% of employment. This divergence underscores that POI-employment relationships are sector-specific and non-linear.
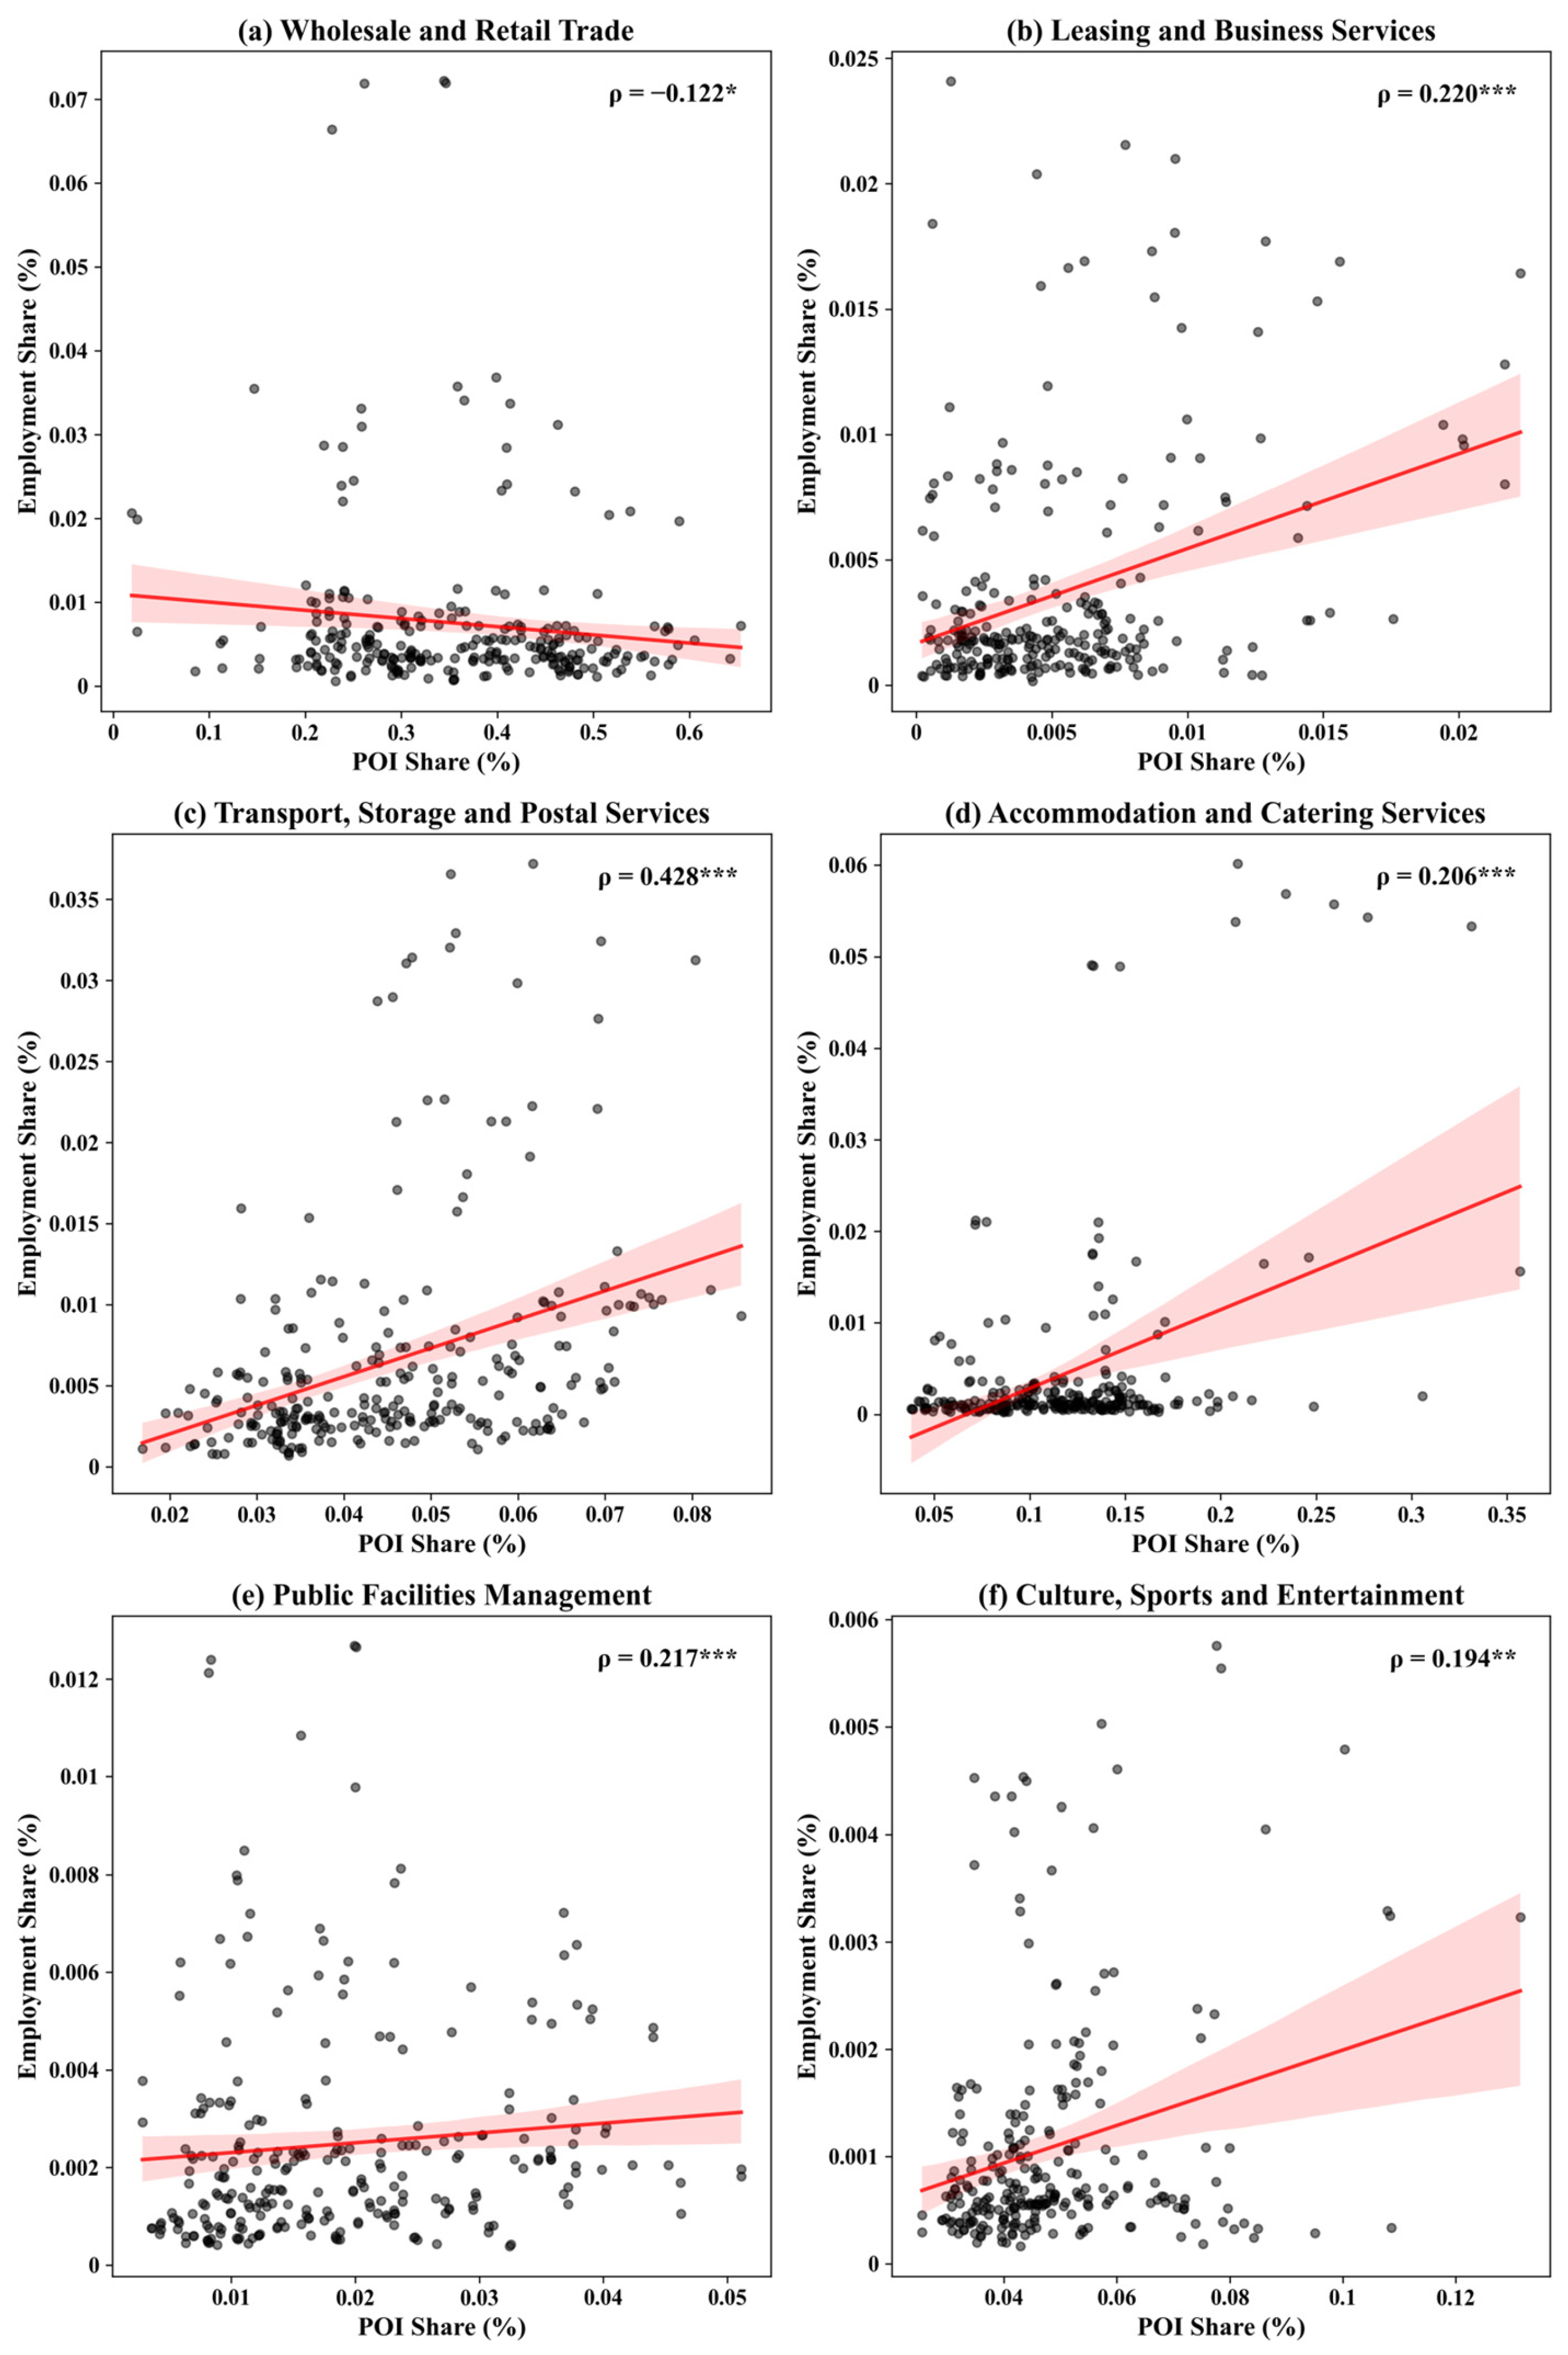
To determine if these structural misalignments preclude the use of POIs as predictors, a statistical correlation analysis was performed to assess whether POI shares carry sufficient information to track employment variations within specific sectors. Scatter plots with linear regression fits and 95% confidence intervals were generated alongside Spearman rank correlation coefficients (Figure 5). While linear fits were utilized for visualization, strict linearity was not assumed or expected for these distributions. All six tourism-related sectors exhibit statistically significant correlations. Five sectors show positive correlations: Transport, Storage and Postal Services (ρ = 0.428, p < 0.001), Leasing and Business Services (ρ = 0.220, p < 0.001), Accommodation and Catering Services (ρ = 0.206, p < 0.001), Public Facilities Management (ρ = 0.185, p < 0.01), and Culture, Sports and Entertainment (ρ = 0.163, p < 0.01). Wholesale and Retail Trades displays a significant negative correlation (ρ = −0.122, p < 0.05), reflecting a structural mismatch: cities with abundant small retail POIs (e.g., convenience stores) tend to have lower employment shares in this sector, as each establishment absorbs limited labor.
Notably, the dispersion patterns around the fitted lines depart from linearity; several sectors display heteroscedastic distributions or threshold-like clustering at lower value ranges. This is particularly evident in Public Facilities Management and Culture, Sports and Entertainment, where data points are concentrated at low POI shares with limited employment variation, suggesting that employment in these sectors is influenced by factors beyond POI density alone. These EDA findings justify two primary methodological decisions. First, the significant correlations confirm that POI shares contain measurable predictive information, validating their use as core model features. Second, the observed heteroscedasticity and non-linear mapping indicate that a linear model alone would be inadequate. This motivates the adoption of the random forest algorithm, which offers distinct advantages over linear models by effectively capturing complex non-linear relationships and handling heteroscedastic distributions without requiring restrictive functional assumptions.
To provide quantitative context, the share of tertiary industry in GDP was compared between 44 Chinese coastal cities (2012–2017 average) and nine PICs with complete World Bank data (Palau, Marshall Islands, Samoa, Vanuatu, Kiribati, Micronesia, Fiji, Tonga, and Papua New Guinea). The mean tertiary share was 41.85% (SD = 7.89%) for coastal cities and 61.62% (SD = 9.87%) for PICs. A Student’s t-test confirms a significant difference (t = −6.56, p < 0.001, Cohen’s d = −2.40), reflecting distinct developmental trajectories: coastal cities retain substantial manufacturing bases, while PICs exhibit service-dominated economies centered on tourism and fisheries.
While these macro-compositions differ, they do not preclude cross-regional transfer, as the underlying spatial-economic mechanisms remain comparable across contexts. This applicability is supported by two factors. First, the coefficients of variation are comparable (0.19 for coastal cities and 0.16 for PICs), suggesting that both groups exhibit equivalent levels of internal structural heterogeneity. Second, and more fundamentally, the model utilizes relative proportions—POI and employment shares—rather than absolute economic output. It transfers the structural mapping between spatial facility signatures and sectoral employment, a relationship governed by the internal functional logic of urban economies. The significant data gaps for the remaining five PICs underscore the pervasive data-scarcity challenge that necessitates this cross-regional approach. By establishing these structural mappings in data-rich coastal cities, the model addresses the lack of longitudinal records in PICs, while the wide dispersion in PIC data (SD = 9.87%) further justifies the typological classification developed in Section 3.5.2. Residual structural discrepancies and their potential impact on transferability are further examined in Section 4.4.

2.3.2. Random Forest Modeling, Optimization, and Evaluation

This study selected the random forest algorithm to construct mapping models for the proportion of POIs relative to the employed population across 12 sectors. This choice followed a comprehensive evaluation of multiple machine learning models and was primarily motivated by the algorithm’s capacity to handle potential noise in POI and macroeconomic population data. Additionally, random forest regression is notable for its insensitivity to multicollinearity and outliers, as well as its result interpretability [34,35,36]. Samples from 44 cities between 2012 and 2017 were randomly divided into a training set (80%) and a test set (20%). The Scikit-learn library was employed for dataset partitioning and to maintain spatial distribution uniformity.
Systematic hyperparameter tuning was conducted to improve model performance and generalization. The optimization process involved a grid search combined with five-fold cross-validation to identify the most effective configurations for key parameters, such as the number of decision trees, maximum depth, and the minimum number of samples per leaf node. The parameter combination that exhibited the most stable performance across the validation sets was selected for the final model construction. To quantitatively evaluate the accuracy of the employment sectoral distribution model, the coefficient of determination (R2), root mean square error (RMSE), and mean absolute error (MAE) were employed [37]. Furthermore, the SHAP method was utilized to analyze feature importance within the random forest model [38]. SHAP values represent the average marginal contribution of each feature to the prediction, where larger absolute values signify a more substantial influence on the model output.

2.4. Urban Function Assessment Methods

2.4.1. Tourism Specialization Index

The specialization index reflects the concentration and specialization of the tourism industry within a region. It is measured using the location quotient (LQ), which indicates the role and importance of tourism relative to the regional average [14,39]. For the calculation of this index, e i j represents the number of tourism employees in city i , and e i denotes the total employed population in that city; meanwhile, E i j represents the total number of tourism employees across all cities in the region, and E i signifies the total regional employed population. The formula for the location quotient L Q i is:
L Q i = e i j / e i E i j / E i
Higher L Q i values indicate a greater degree of specialization [40]. Due to the geographic dispersion and small land areas of Pacific Island Countries, each nation is treated as a discrete urban unit to ensure the specialization index accurately captures the unique regional characteristics of these island economies.

2.4.2. Hierarchical Evaluation of Tourism Function Scale and Intensity

The assessment of tourism functions is conducted across two distinct dimensions: scale and intensity. The tourism function scale measures the relative importance of a city’s total tourism reception volume within the regional urban system, utilizing inbound tourist arrivals as the primary indicator. In contrast, tourism function intensity measures the economic significance of the tourism industry within a city’s specific economic system, using the proportion of employees in tourism-related sectors as the indicator.
To classify these functions, the Nelson method of urban function classification was applied [13]. The procedure involves several concise steps. First, the regional mean ( X ¯ ) of the parameter values is determined as the threshold for identifying specialization. Second, the standard deviation ( σ ) of the function parameters was calculated.
The function scale is categorized into three levels based on inbound arrivals: cities with values less than X ¯ are classified as small scale; those between X ¯ and X ¯ + σ are medium scale; and those exceeding X ¯ + σ are large scale. The function intensity is divided into two levels based on employment proportions: cities with values less than X ¯ are classified as low specialization, while those exceeding X ¯ are classified as specialized.

2.4.3. Classification of Tourism Functions

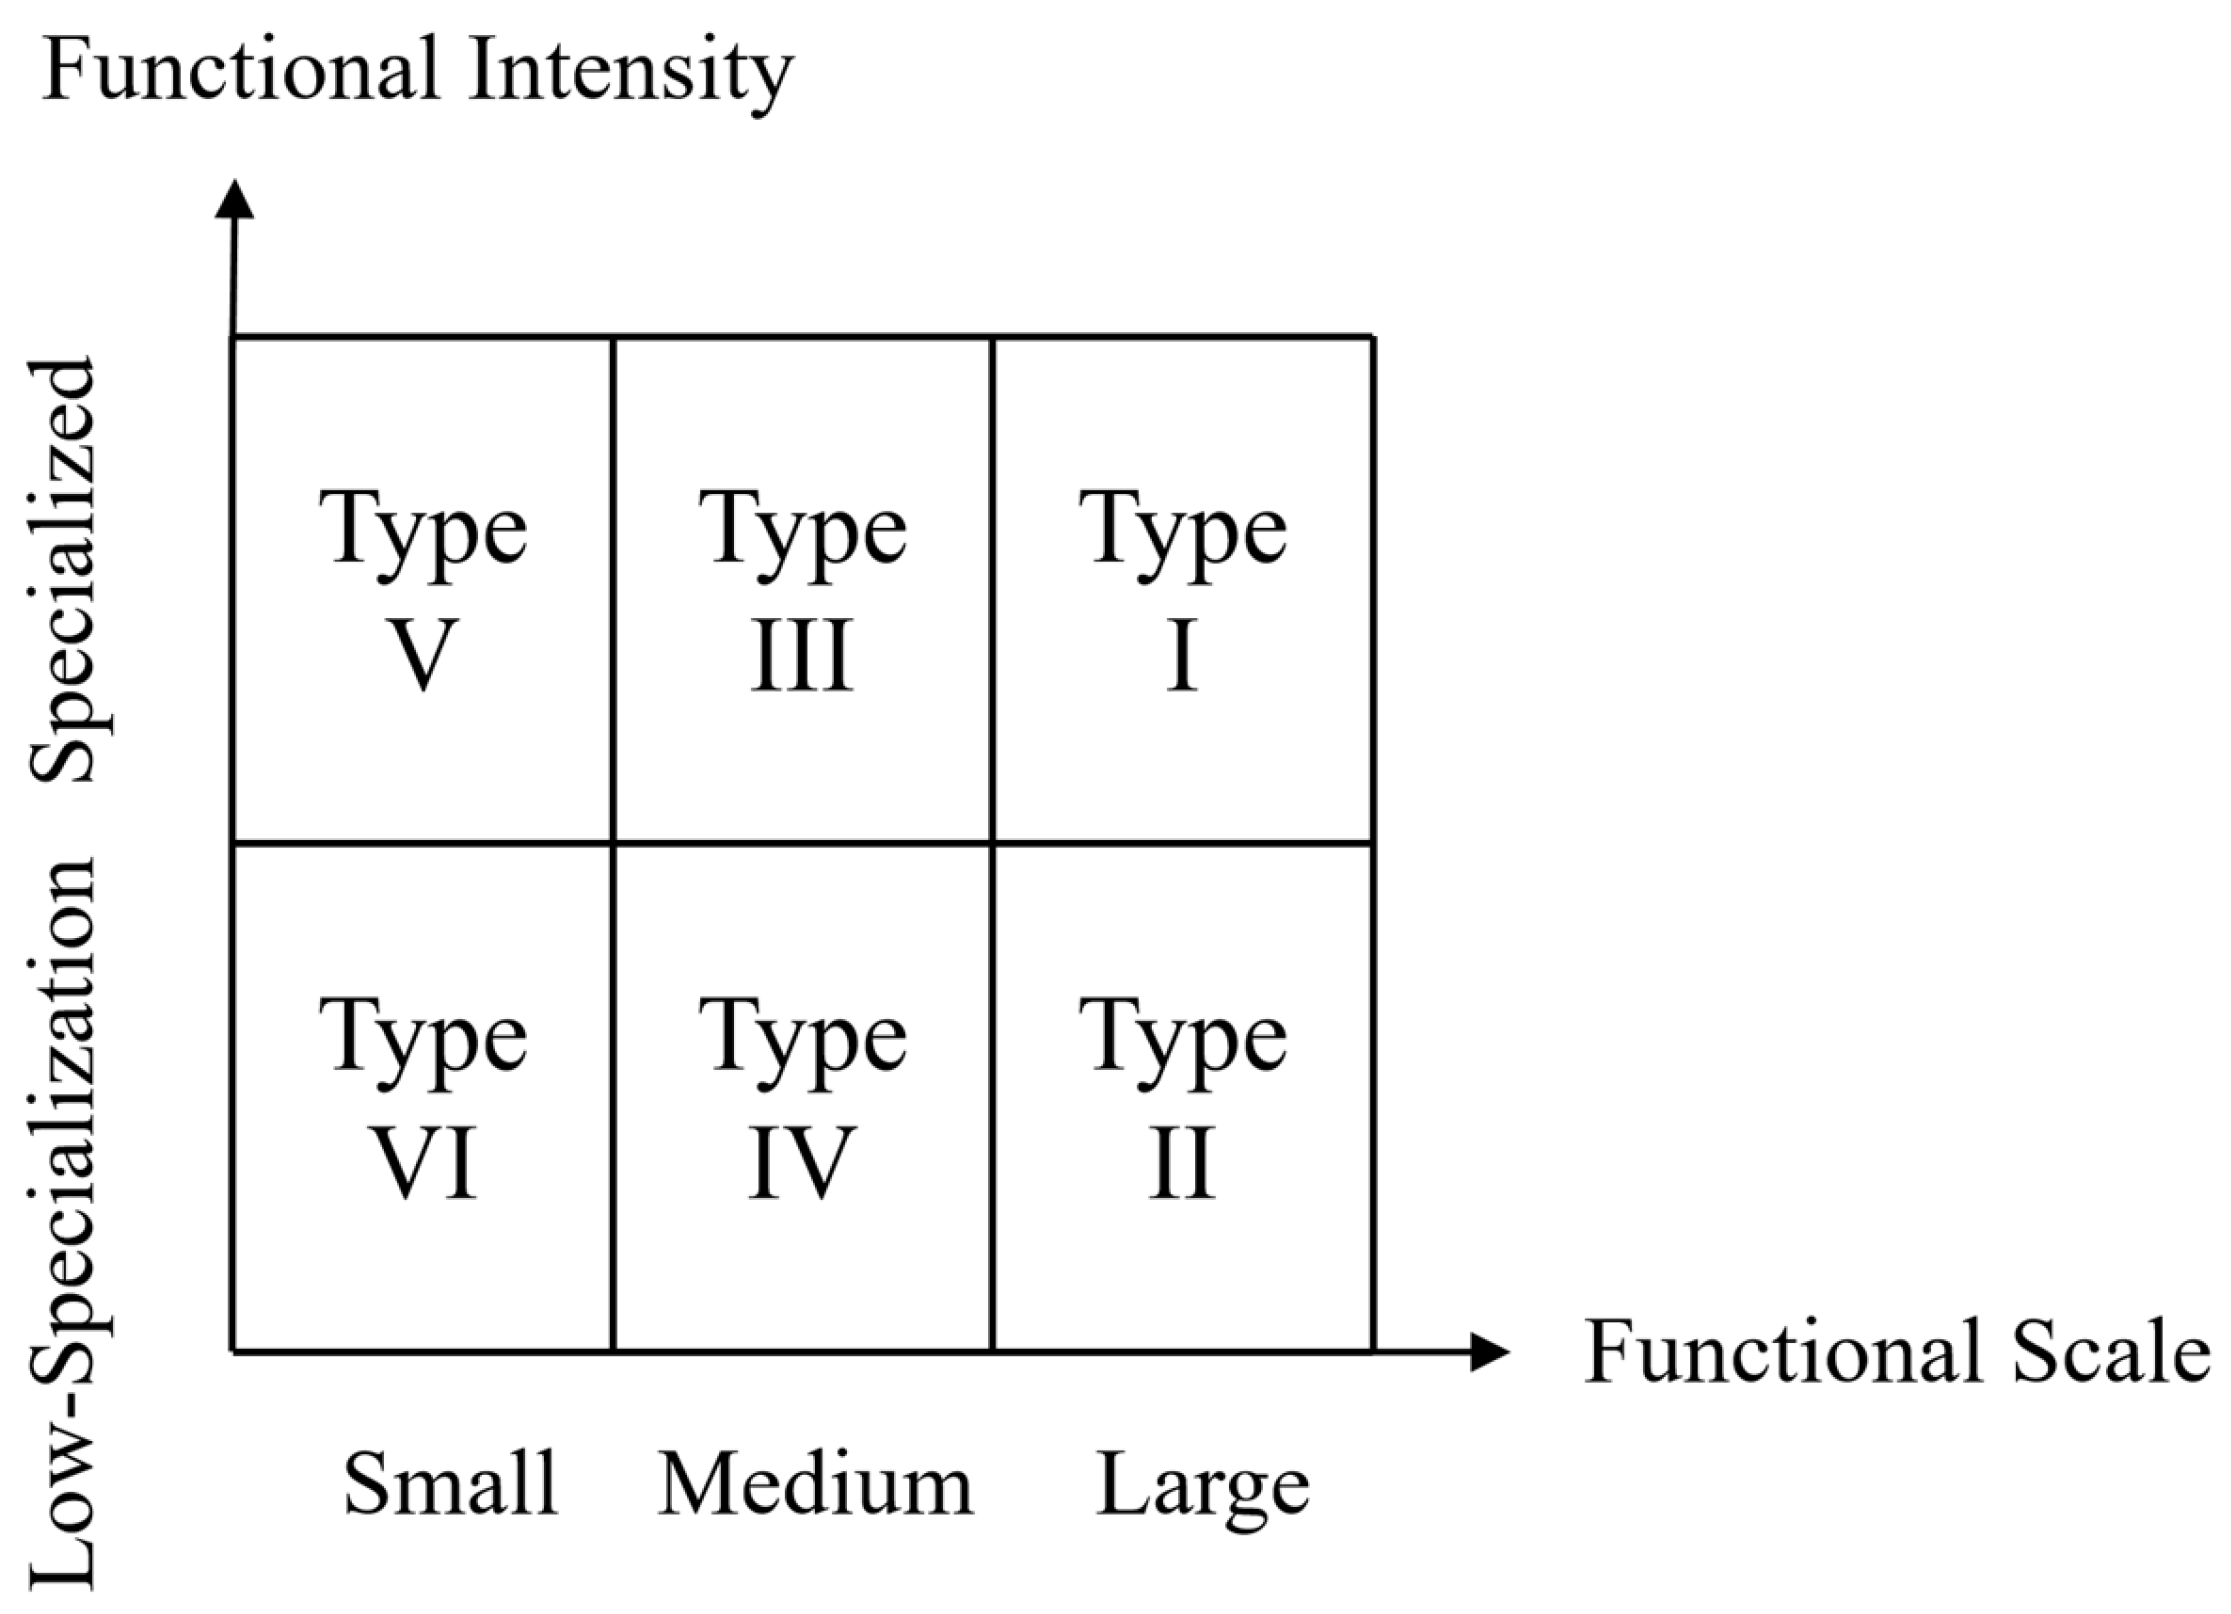
To delineate the functional characteristics of tourism across the assessed units, a 2 × 3 grid matrix was employed to categorize them into six distinct types based on hierarchical classification results (Figure 6). These results, which integrate the dimensions of reception scale and functional intensity, provide a comprehensive measure of the magnitude and economic specialization of tourism within each city. For systematic analysis, these six types are consolidated into three broader categories based on their functional attributes. Type I and Type III cities are categorized as medium-large specialized types due to their substantial reception scales and high tourism intensity. Although Type V cities possess a limited reception scale, they exhibit a high degree of tourism specialization and are thus classified as small specialized tourism cities. Conversely, Types II, IV, and VI are collectively identified as the low-specialization type, as they demonstrate relatively low tourism functional intensity within the overall urban economy. Within this category, Type II maintains a large reception scale despite low specialization; Type IV exhibits characteristics that may evolve into medium-sized specialization; and Type VI represents the nascent stage of tourism development with both low scale and specialization [13].
The classification criteria are derived from the Nelson method, utilizing regional means and standard deviations of functional scale and intensity as thresholds. This approach was selected over unsupervised classification or continuous dimensionality reduction techniques, such as K-means clustering or principal component analysis (PCA), for several reasons. First, the classification relies on only two dimensions with clear economic meanings and interpretable thresholds. In this low-dimensional context, cluster analysis offers limited advantages for capturing non-linear structures and may produce unstable groupings given the small sample size (14 countries), compromising replicability. Second, while PCA extracts continuous variation, it requires subjective cut-off points to form discrete categories, and its outputs are often less straightforward than original indicators. Finally, the logic of this matrix ensures the results are readily communicable to policy audiences. By clarifying the distinction between “medium-to-large specialized” and “low-specialization” units, this framework provides clear foundations for tailored development paths. Future studies could cross-validate these findings with alternative statistical methods to further calibrate the classification boundaries of the 2 × 3 matrix.

3. Results

3.1. Random Forest Model Performance

To assess the added value of the random forest (RF) model relative to a linear baseline, a Multiple Linear Regression (MLR) model was constructed using identical predictors and data splits. As shown in Table 1, RF demonstrates consistent superiority over MLR across all sectors, with mean R2 values of 0.676 and 0.296, respectively. The advantage is most evident in sectors where POI–employment relationships are highly non-linear. For instance, Manufacturing yields an RF R2 of 0.655 compared to an MLR R2 of −0.244, while Leasing and Business Services exhibits a 0.741 R2 gap between the two models. Even in sectors with stronger linear components, such as Public Facilities Management, RF exhibits marked performance differences (0.826 vs. 0.586). These results confirm that the non-linear patterns identified in the exploratory data analysis (Section 2.3.1) cannot be adequately captured by a linear model, thereby justifying the adoption of RF for modeling.
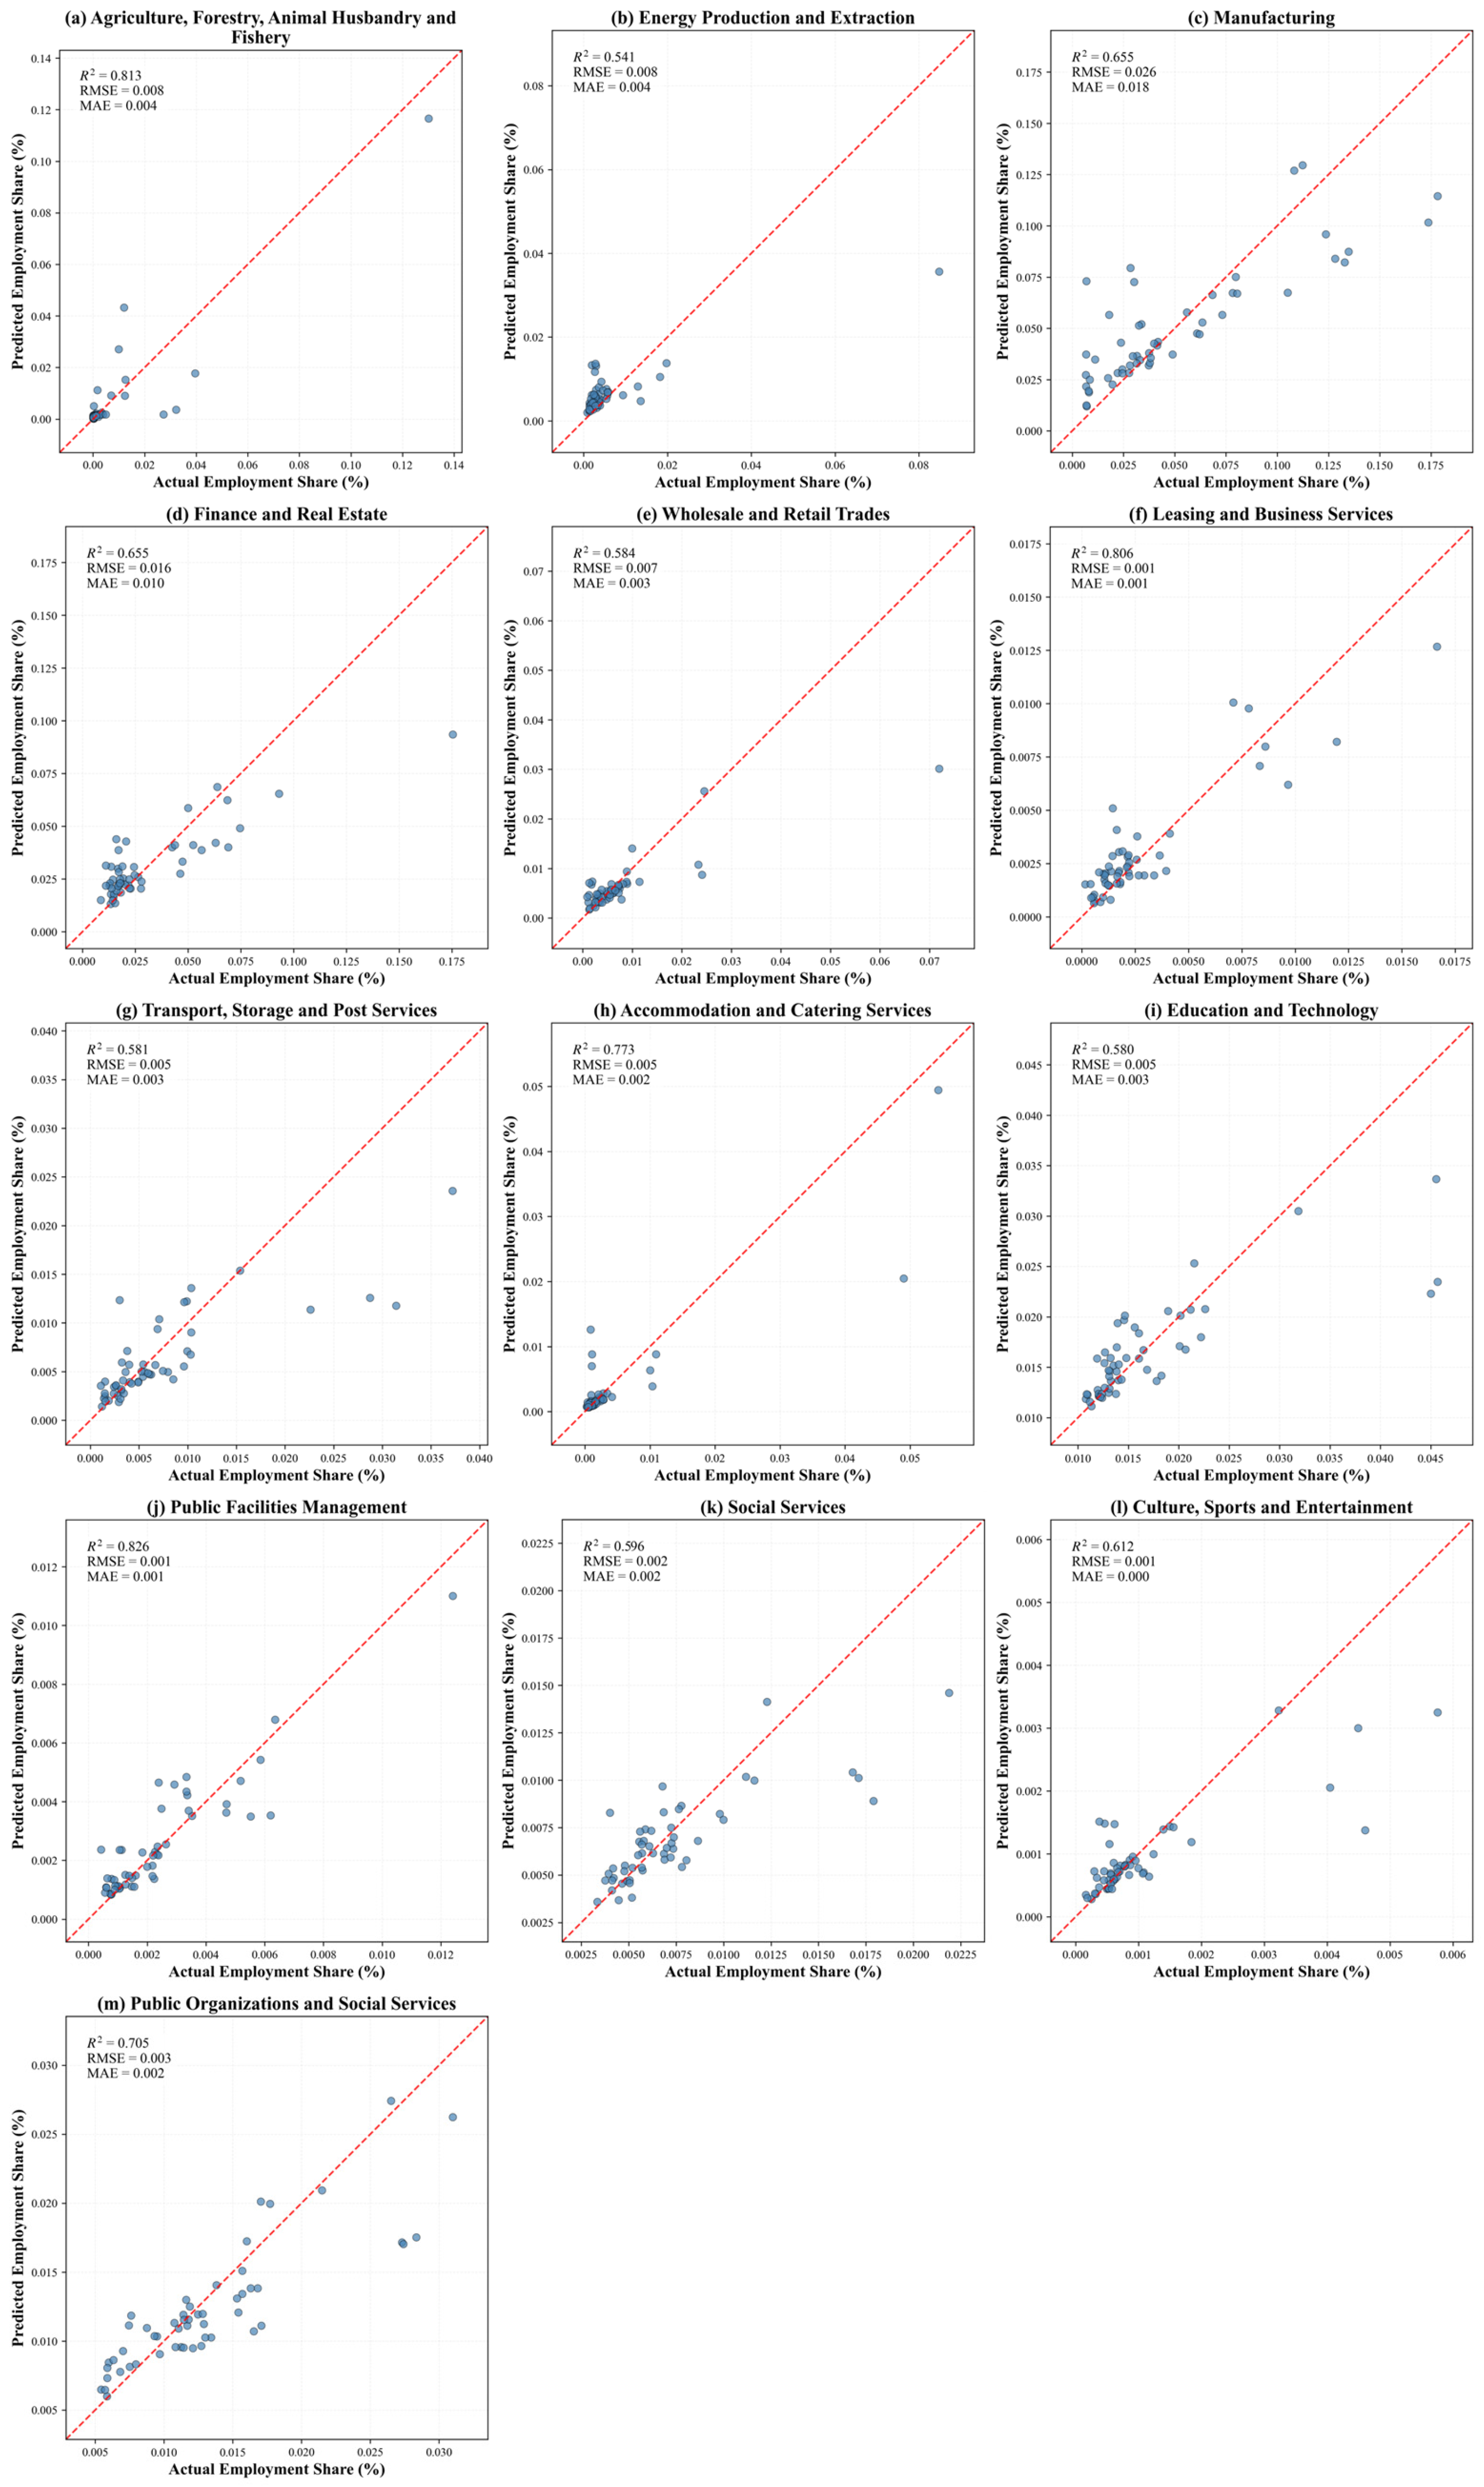
Having established the necessity of a non-linear approach, we evaluate the RF model’s predictive accuracy using three standard metrics: the coefficient of determination (R2), which measures the proportion of variance explained by the model; the root mean square error (RMSE), which quantifies the magnitude of prediction deviations; and the mean absolute error (MAE), which reflects the average absolute difference between predicted and actual values. The model performance results, alongside scatter plots of predicted versus actual values, are presented in Figure 7.
The R2 for each sector ranges from 0.541 to 0.826, indicating generally robust model performance. Specifically, simulation results for Public Facilities Management, Agriculture, and Leasing and Business Services achieved high accuracy, explaining approximately 82.60%, 81.30%, and 80.60% of the variance, respectively. These high values suggest that the employment distribution in these sectors is closely tied to identifiable spatial signatures and POI-based infrastructure, which the RF model effectively captures. In contrast, the R2 for Energy Production and Extraction was relatively low at 0.541. This discrepancy suggests that while the model effectively captures patterns in most sectors, the dynamics of energy-related industries may be influenced by complex exogenous factors—such as global market volatility, localized resource extraction constraints, or specific policy interventions—that the current spatial parameters could not fully accommodate. Furthermore, the RMSE across all sectors ranged from 0.001 to 0.026, and the MAE ranged from 0.000 to 0.018. These low error levels reflect minimal absolute deviations, confirming the predictive stability of the model across diverse economic activities.
To empirically validate the designation of the six sectors as tourism-oriented, we examined the association between their employment shares and the scale of the tourism economy within the training sample. Utilizing 169 valid city-year observations (36 coastal cities with comprehensive records from 2012 to 2017), we calculated Spearman rank correlation coefficients between sectoral employment shares and total tourism revenue. This validation step is essential to confirm the representativeness of these industries and ensure the methodological framework remains robust across varied economic contexts. The aggregate employment share of these sectors demonstrates a statistically significant positive relationship with tourism revenue (ρ = 0.465, p < 0.001), confirming their collective sensitivity to the scale of tourism activity. Individually, all six sectors exhibit significant positive correlations (p < 0.001): Leasing and Business Services (ρ = 0.491), Culture, Sports and Entertainment (ρ = 0.475), Wholesale and Retail Trades (ρ = 0.474), Transport, Storage and Postal Services (ρ = 0.406), Accommodation and Catering Services (ρ = 0.388), and Public Facilities Management (ρ = 0.333). These findings provide empirical justification for classifying these industries as a cohesive, tourism-sensitive group. While these sectors in the training sample also cater to substantial non-tourism demand—such as general urban retail, domestic logistics, and local business services—the strength of the observed statistical associations underscores their fundamental link to the tourism sector. Given that tourism constitutes the primary economic driver in Pacific Island Countries (PICs), the reliance of these sectors on tourism is expected to be even more pronounced than these training-domain results indicate, further validating the application of this classification to the PIC context.

3.2. Interpretability Analysis Based on SHAP Method

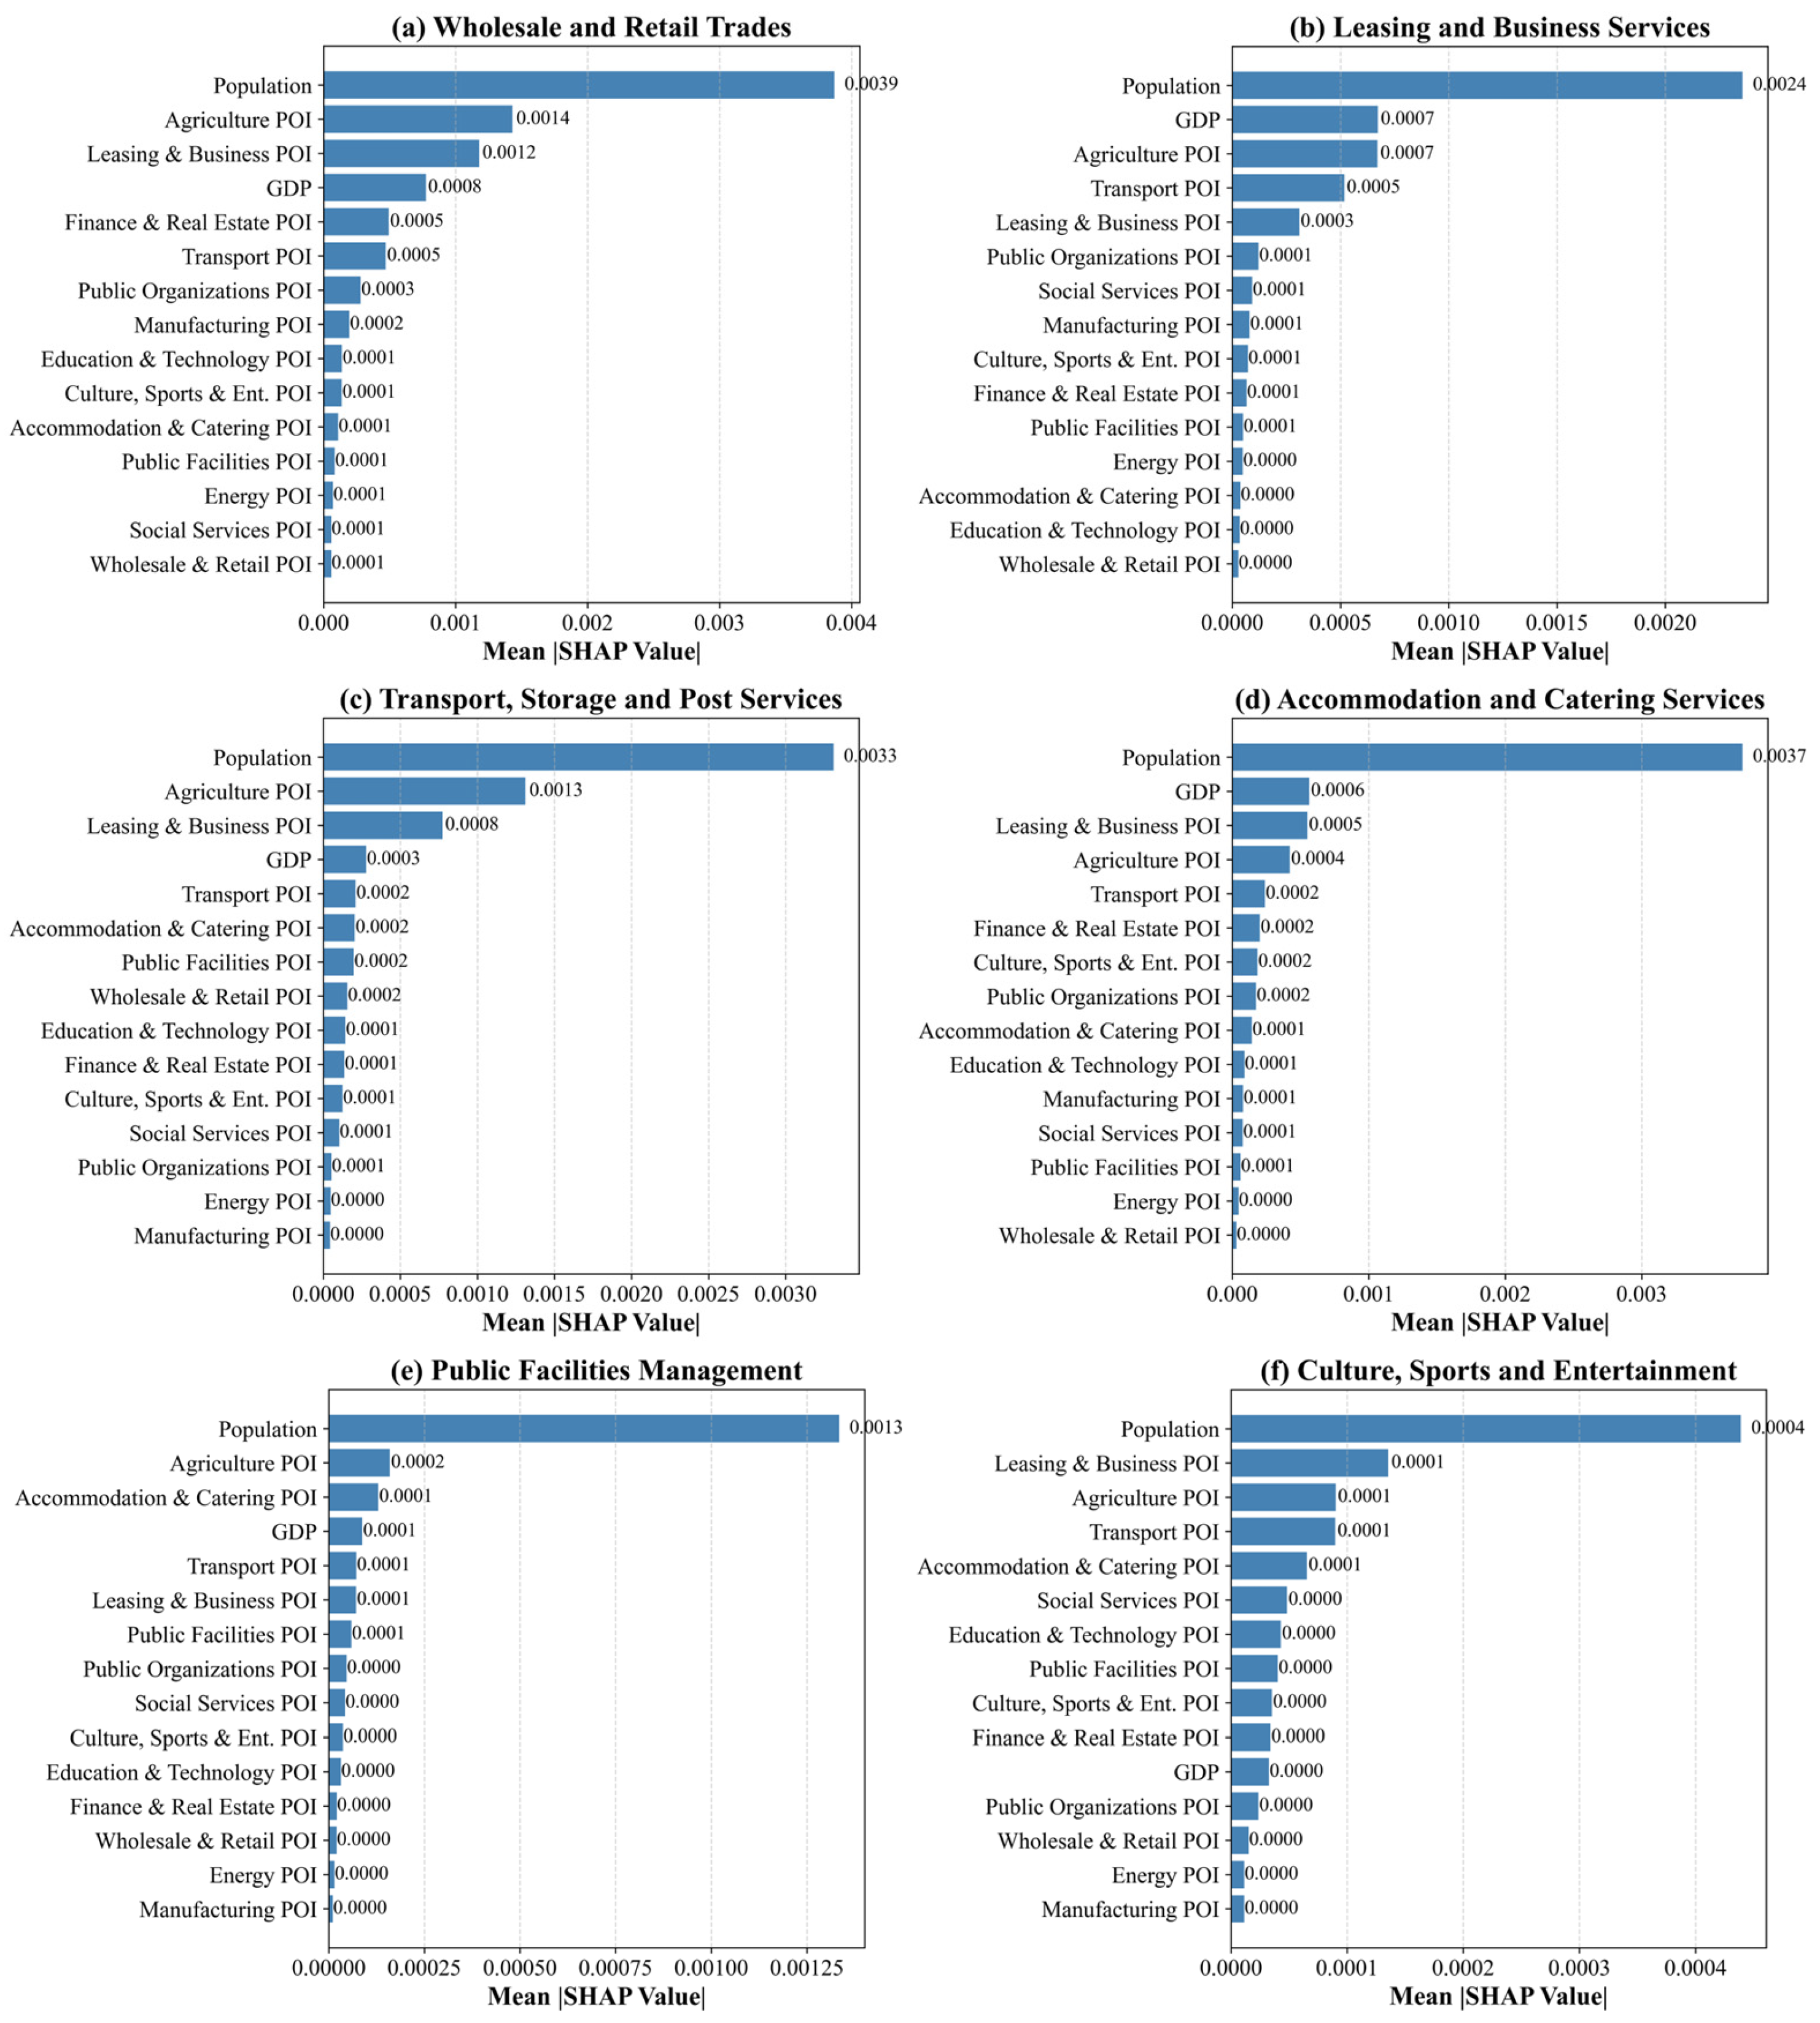
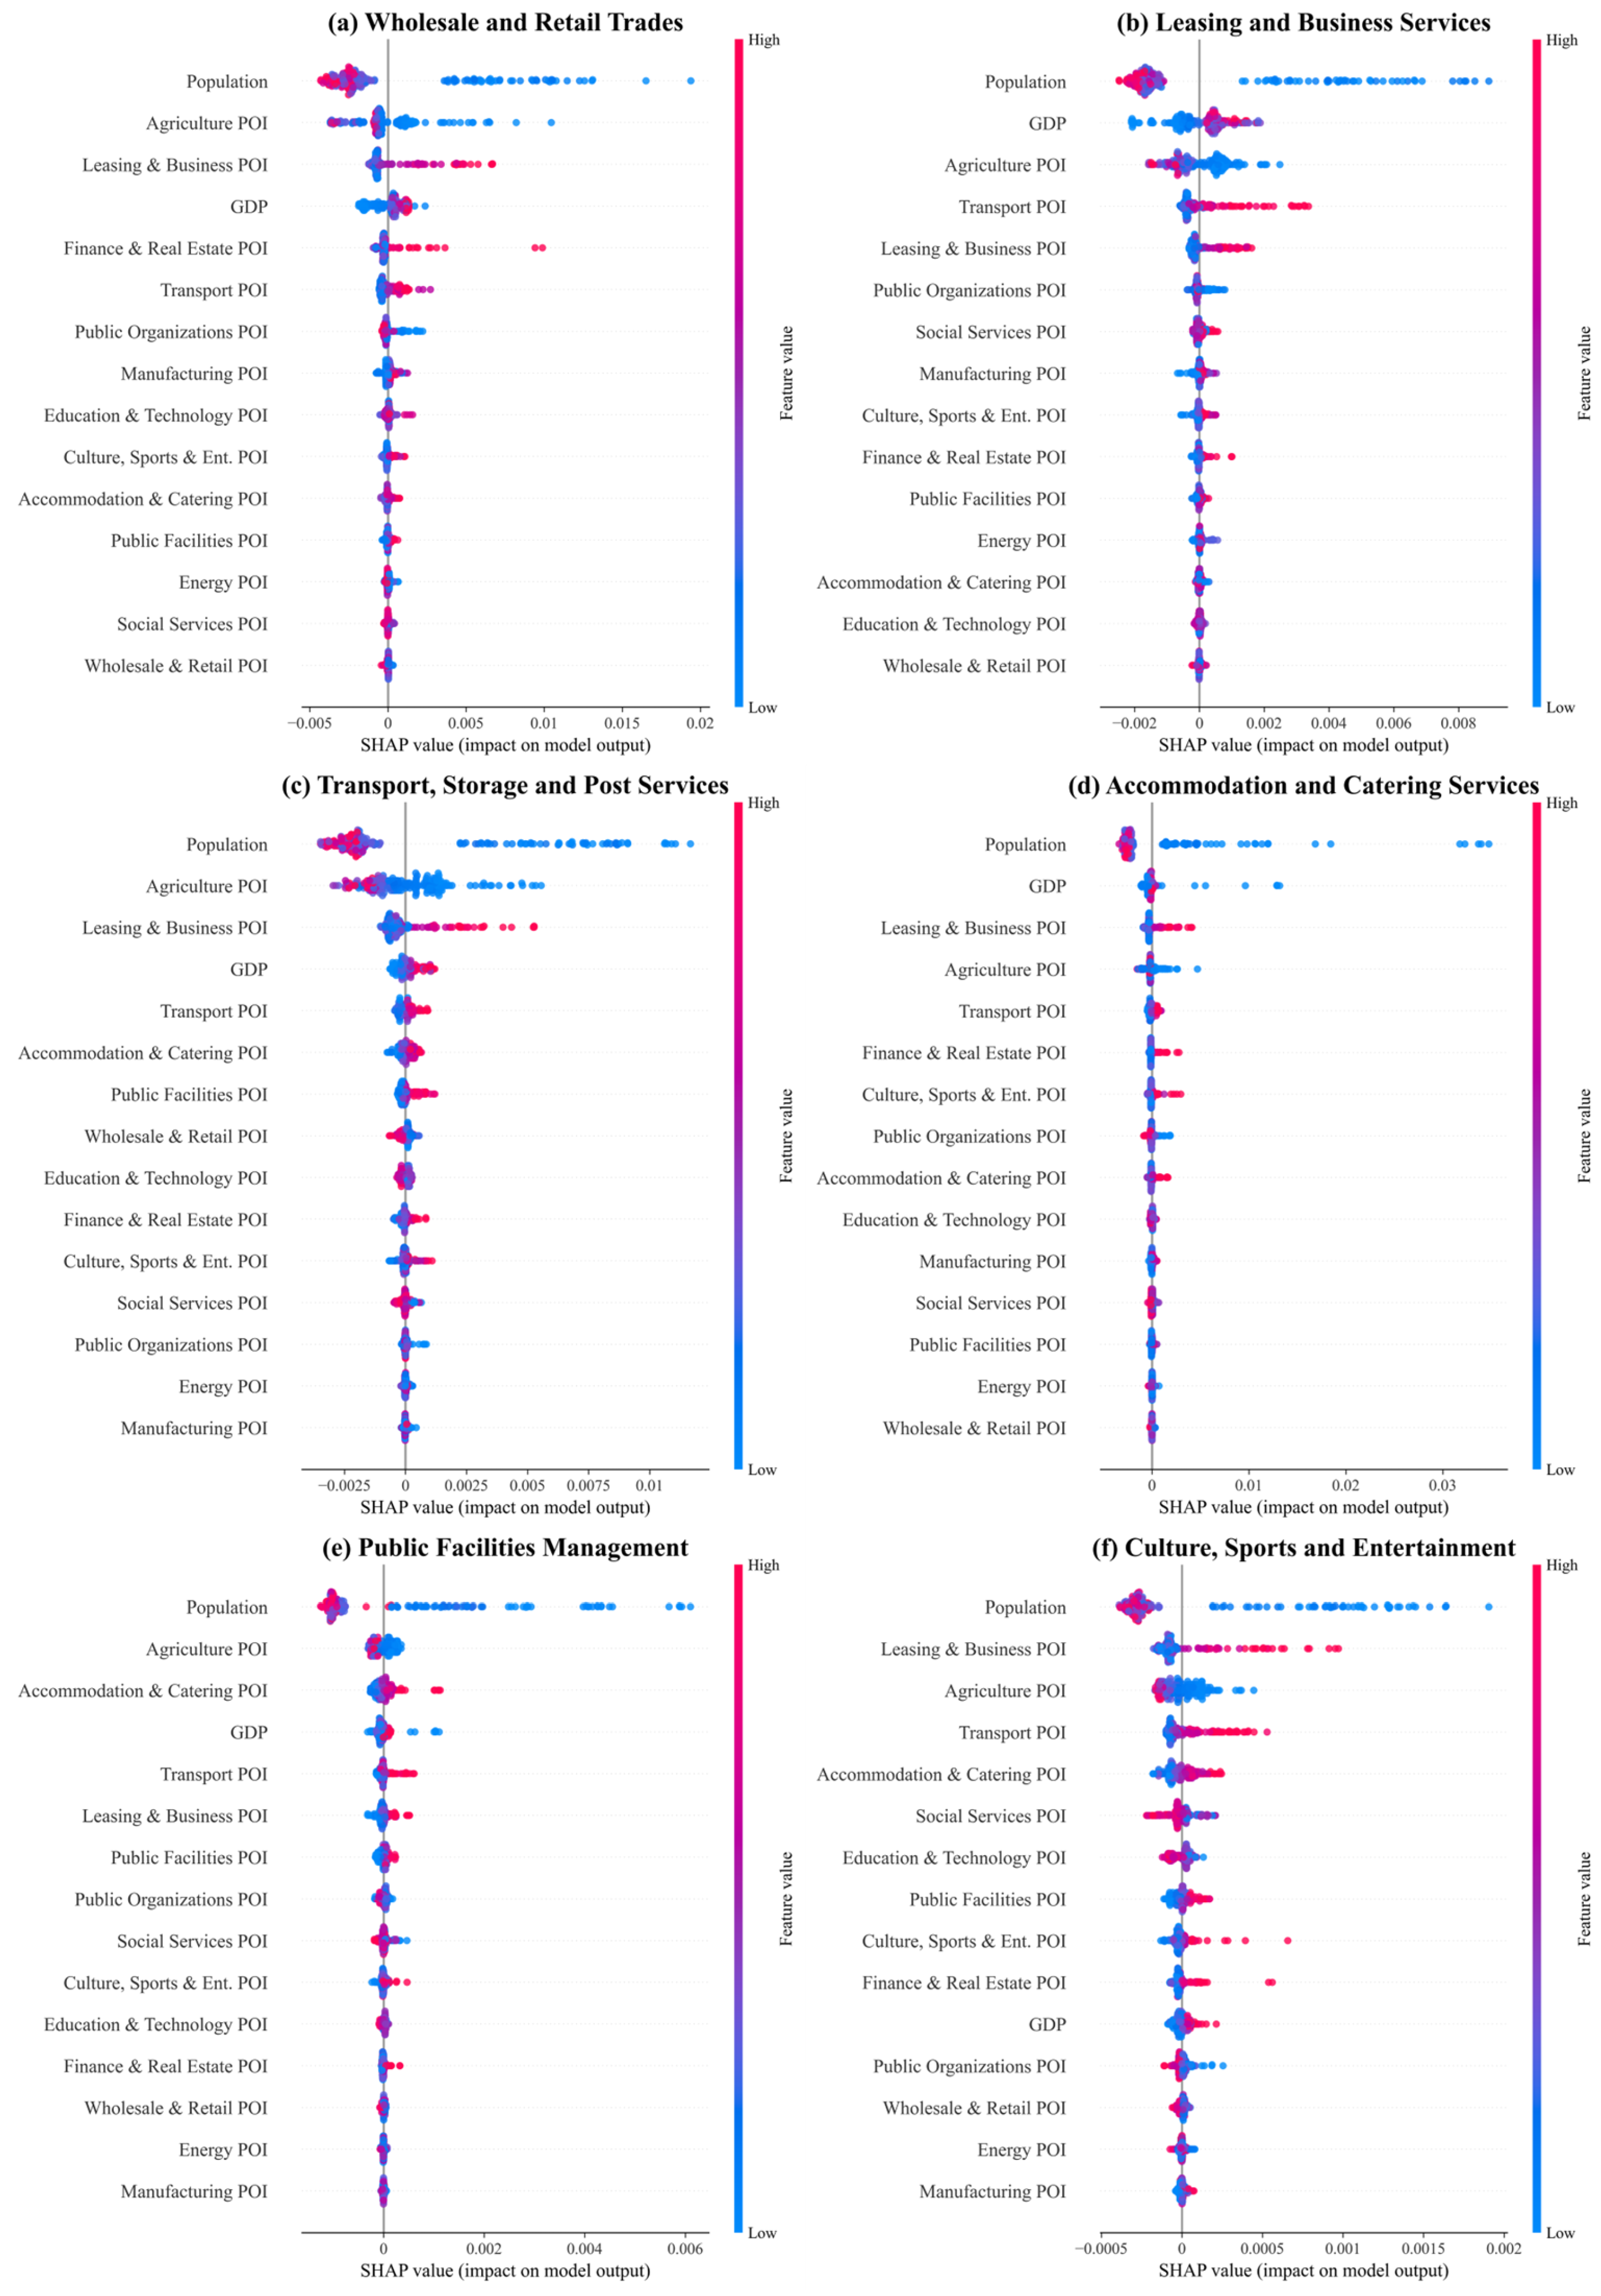
To elucidate how specific features influence the predicted proportion of employees in tourism-related sectors, this study applied the SHAP method to the random forest model. SHAP values quantify the average marginal contribution of each feature to the model’s output, where higher absolute values indicate a stronger influence. Figure 8 and Figure 9 illustrate the feature importance rankings and summary plots across the six analyzed sectors.
Total year-end population and GDP emerged as the most significant predictors across all sectors, as city scale fundamentally dictates employment structure. The random forest model utilizes these macro-level indicators—specifically population and GDP—to categorize city size tiers before refining predictions with local POI data. A comparative analysis reveals distinct sectoral patterns: for wholesale and retail, larger cities exhibit a lower employment share, indicating that smaller cities with limited industrial diversity rely more heavily on this sector. Conversely, for the leasing and business services, transport, storage and postal services, and accommodation and catering sectors, higher population and GDP values correlate with increased employment proportions, consistent with the higher service industry density in major urban centers. Notably, in the public facilities management sector, the SHAP value contribution of population significantly exceeds that of any other feature, reflecting an employment demand almost entirely driven by urban scale. In contrast, the culture, sports, and entertainment sector displays relatively low SHAP values for all variables, suggesting its employment share is less constrained by quantifiable economic factors and more influenced by qualitative drivers such as local policy and cultural traditions.

3.3. Prediction Results of Tourism-Related Employment Distribution in Pacific Island Countries

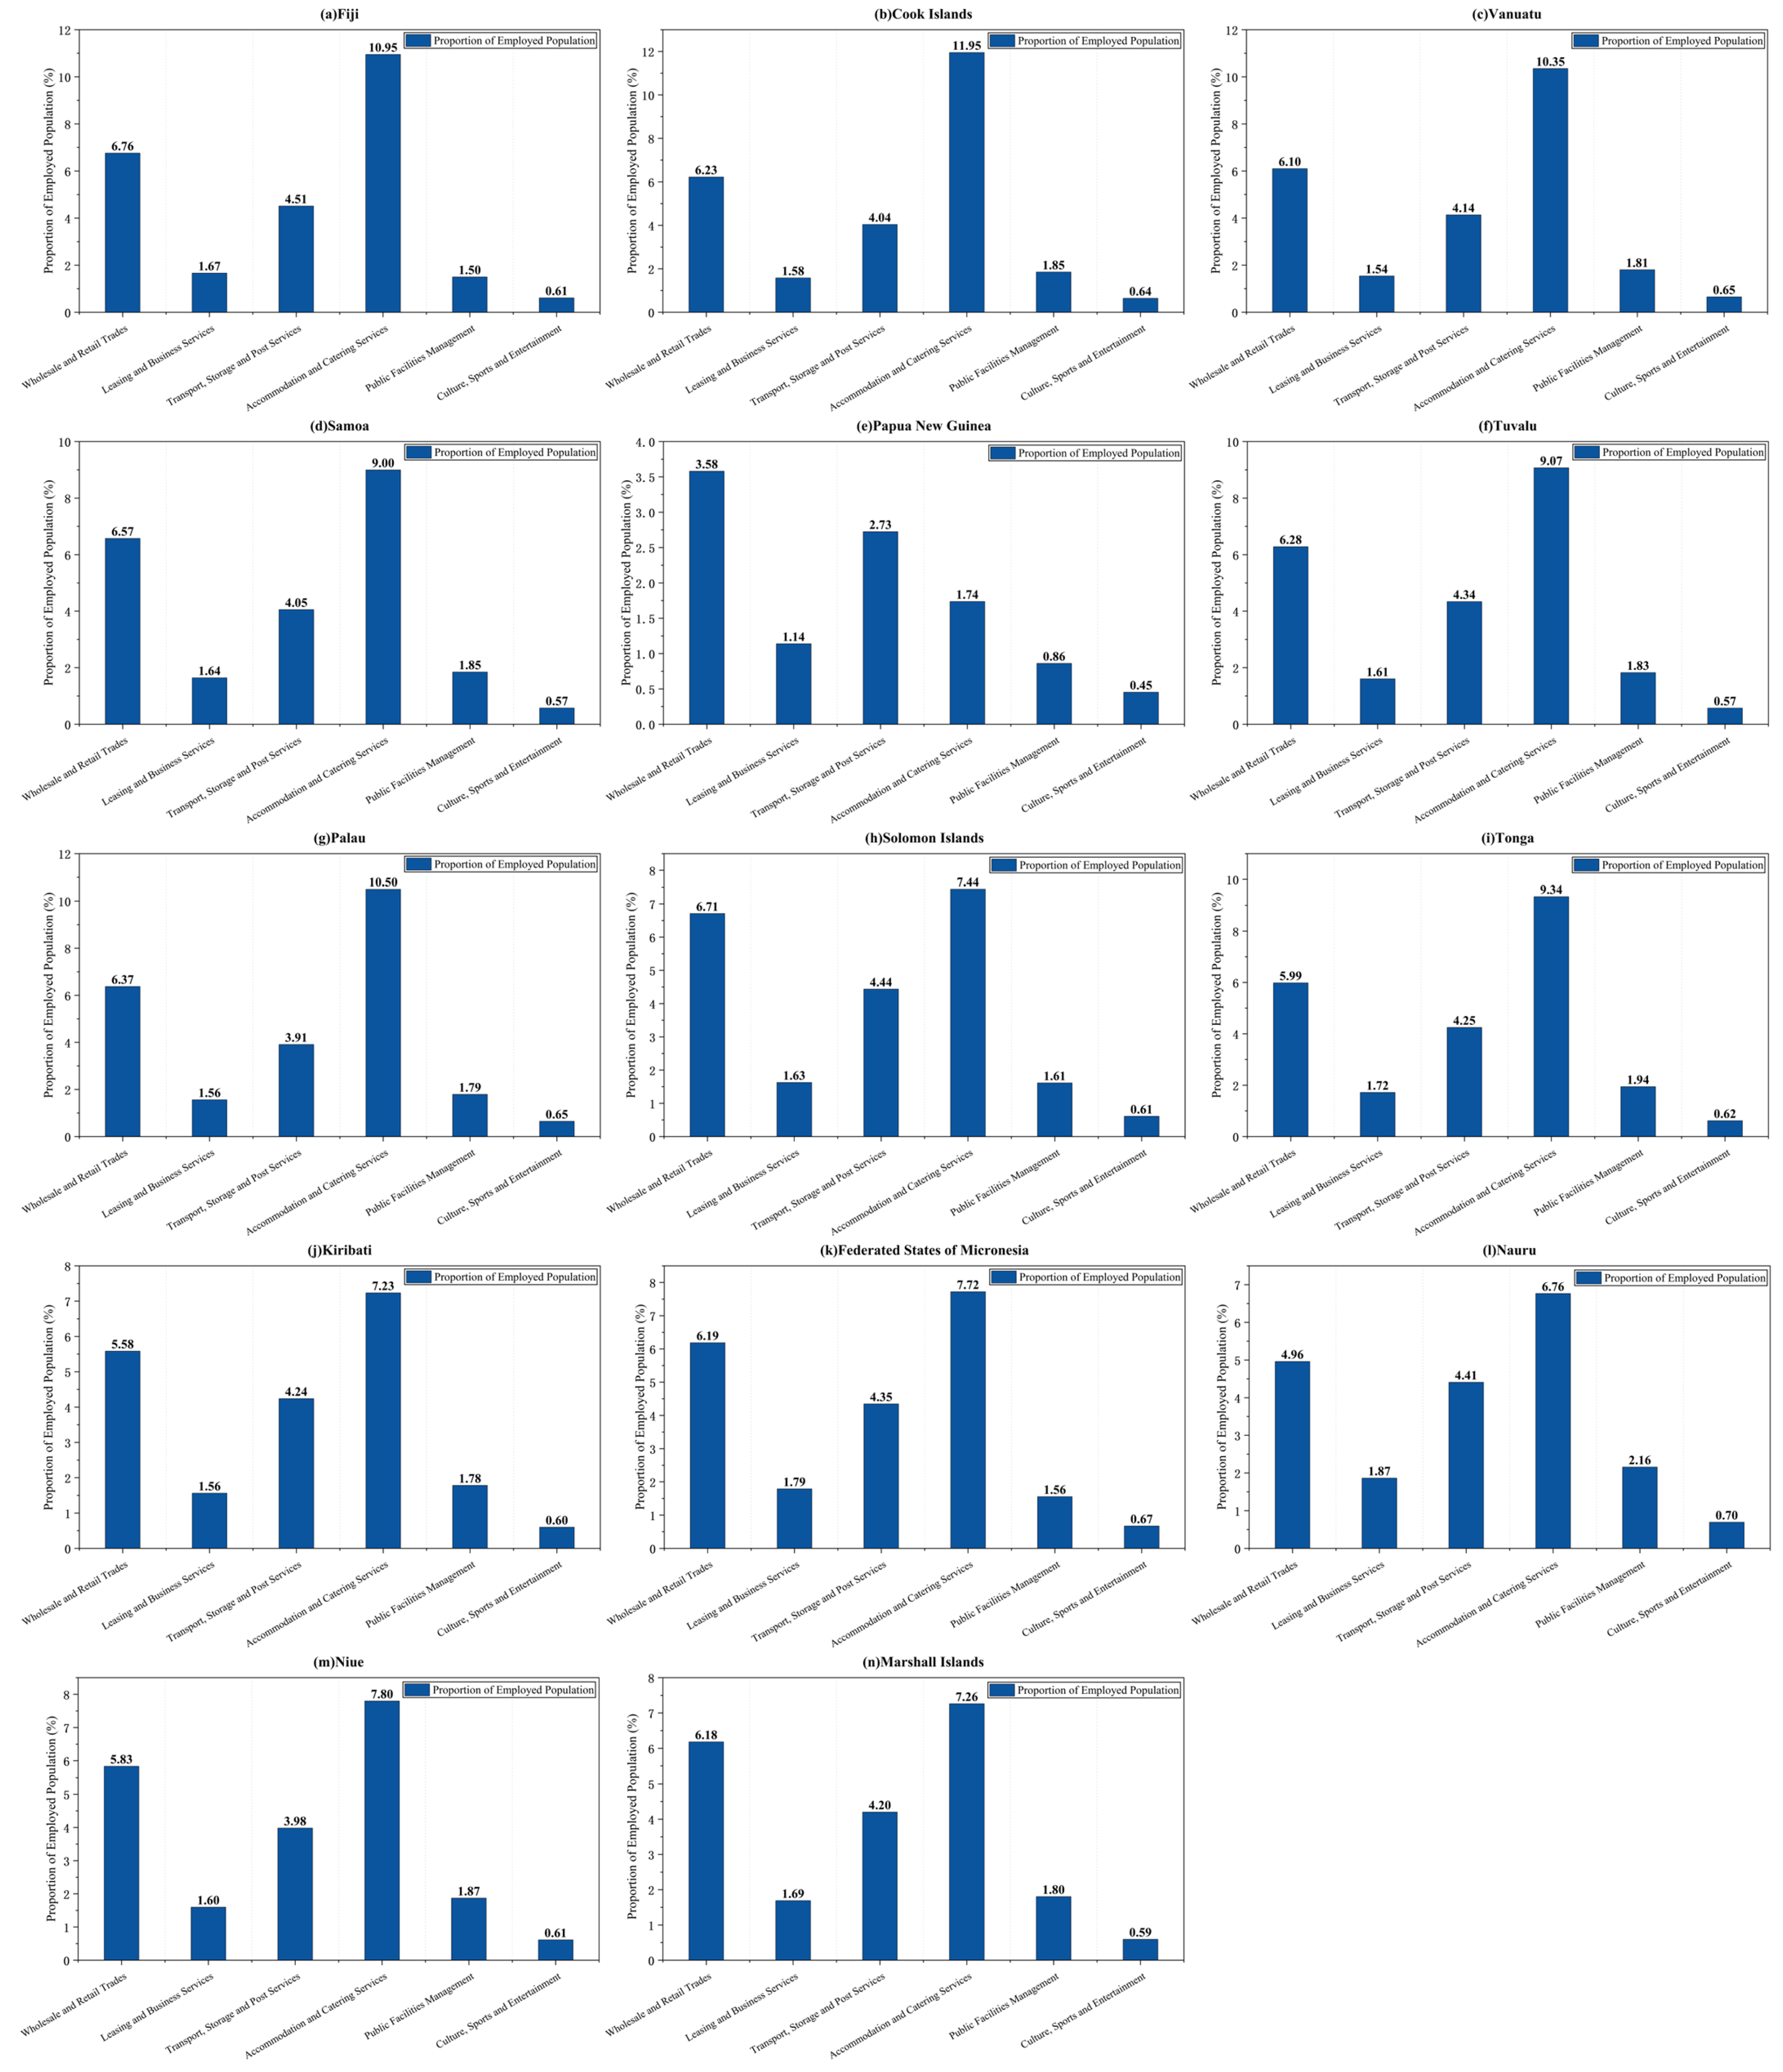
The following analysis evaluates the forecasted distribution of the labor force within tourism-related industries to clarify the economic structure of Pacific Island Countries. As illustrated in Figure 10, tourism employment is primarily concentrated in two sectors: Accommodation and Catering Services, and Wholesale and Retail Trades. In most analyzed nations, the total employment proportion in tourism-related sectors is high, consistently exceeding 20%. Specifically, Fiji and The Cook Islands reach levels of approximately 26%, while Papua New Guinea remains a notable exception.
Detailed sectoral comparisons reveal that Accommodation and Catering Services represents the highest employment share, accounting for 11.95% in The Cook Islands and 10.95% in Fiji, with most other countries ranging between 7% and 11%. The Wholesale and Retail Trades sector follows, with proportions between 5% and 7%. Other sectors maintain more stable or secondary roles: Transport, Storage, and Post Services typically accounts for 4% to 4.5%, while Public Facilities Management ranges from 1.5% to 2%, peaking at 2.16% in Nauru. Conversely, Culture, Sports, and Entertainment and Leasing and Business Services both show low employment proportions, generally remaining below 2%; for example, Samoa’s Culture, Sports, and Entertainment sector accounts for only 0.57%. In contrast, Papua New Guinea exhibits significantly lower proportions across all sectors, with Accommodation and Catering Services at only 1.74% and Wholesale and Retail Trades at 3.58%, indicating that the tourism industry occupies a relatively small share of its overall employment structure.

3.4. Comprehensive Validation of Employment Sectoral Distribution Predictions

To evaluate the reliability and applicability of the model in the Pacific Island Countries, this study conducted a comprehensive validation of the prediction results from four aspects: aggregate consistency, robustness based on Bootstrap resampling, logical consistency, and empirical validation of model transferability. Specifically, the aggregate consistency test assesses overall predictive accuracy; Bootstrap resampling evaluates sensitivity to training data; the logical consistency test verifies alignment with economic principles; and cross-regional validation explores the model’s performance on external cases.

3.4.1. Aggregate Consistency Test

The aggregate consistency test assessed the degree of agreement between the total employed population predicted by the model and the actual statistical data, setting an acceptable criterion of an error rate below 10% [41]. The results (Table 2) show that the error rates for all 14 countries were below 10%, with six countries achieving error rates within 9% and most other countries also closely approaching this error rate, indicating good robustness at the aggregate level. Although the absolute error for Papua New Guinea was relatively large, indicating potential accumulated forecasting errors in predicting larger economies, the overall results demonstrate the model’s acceptable predictive consistency in predicting the total employed population.

3.4.2. Robustness Test Based on Bootstrap Resampling

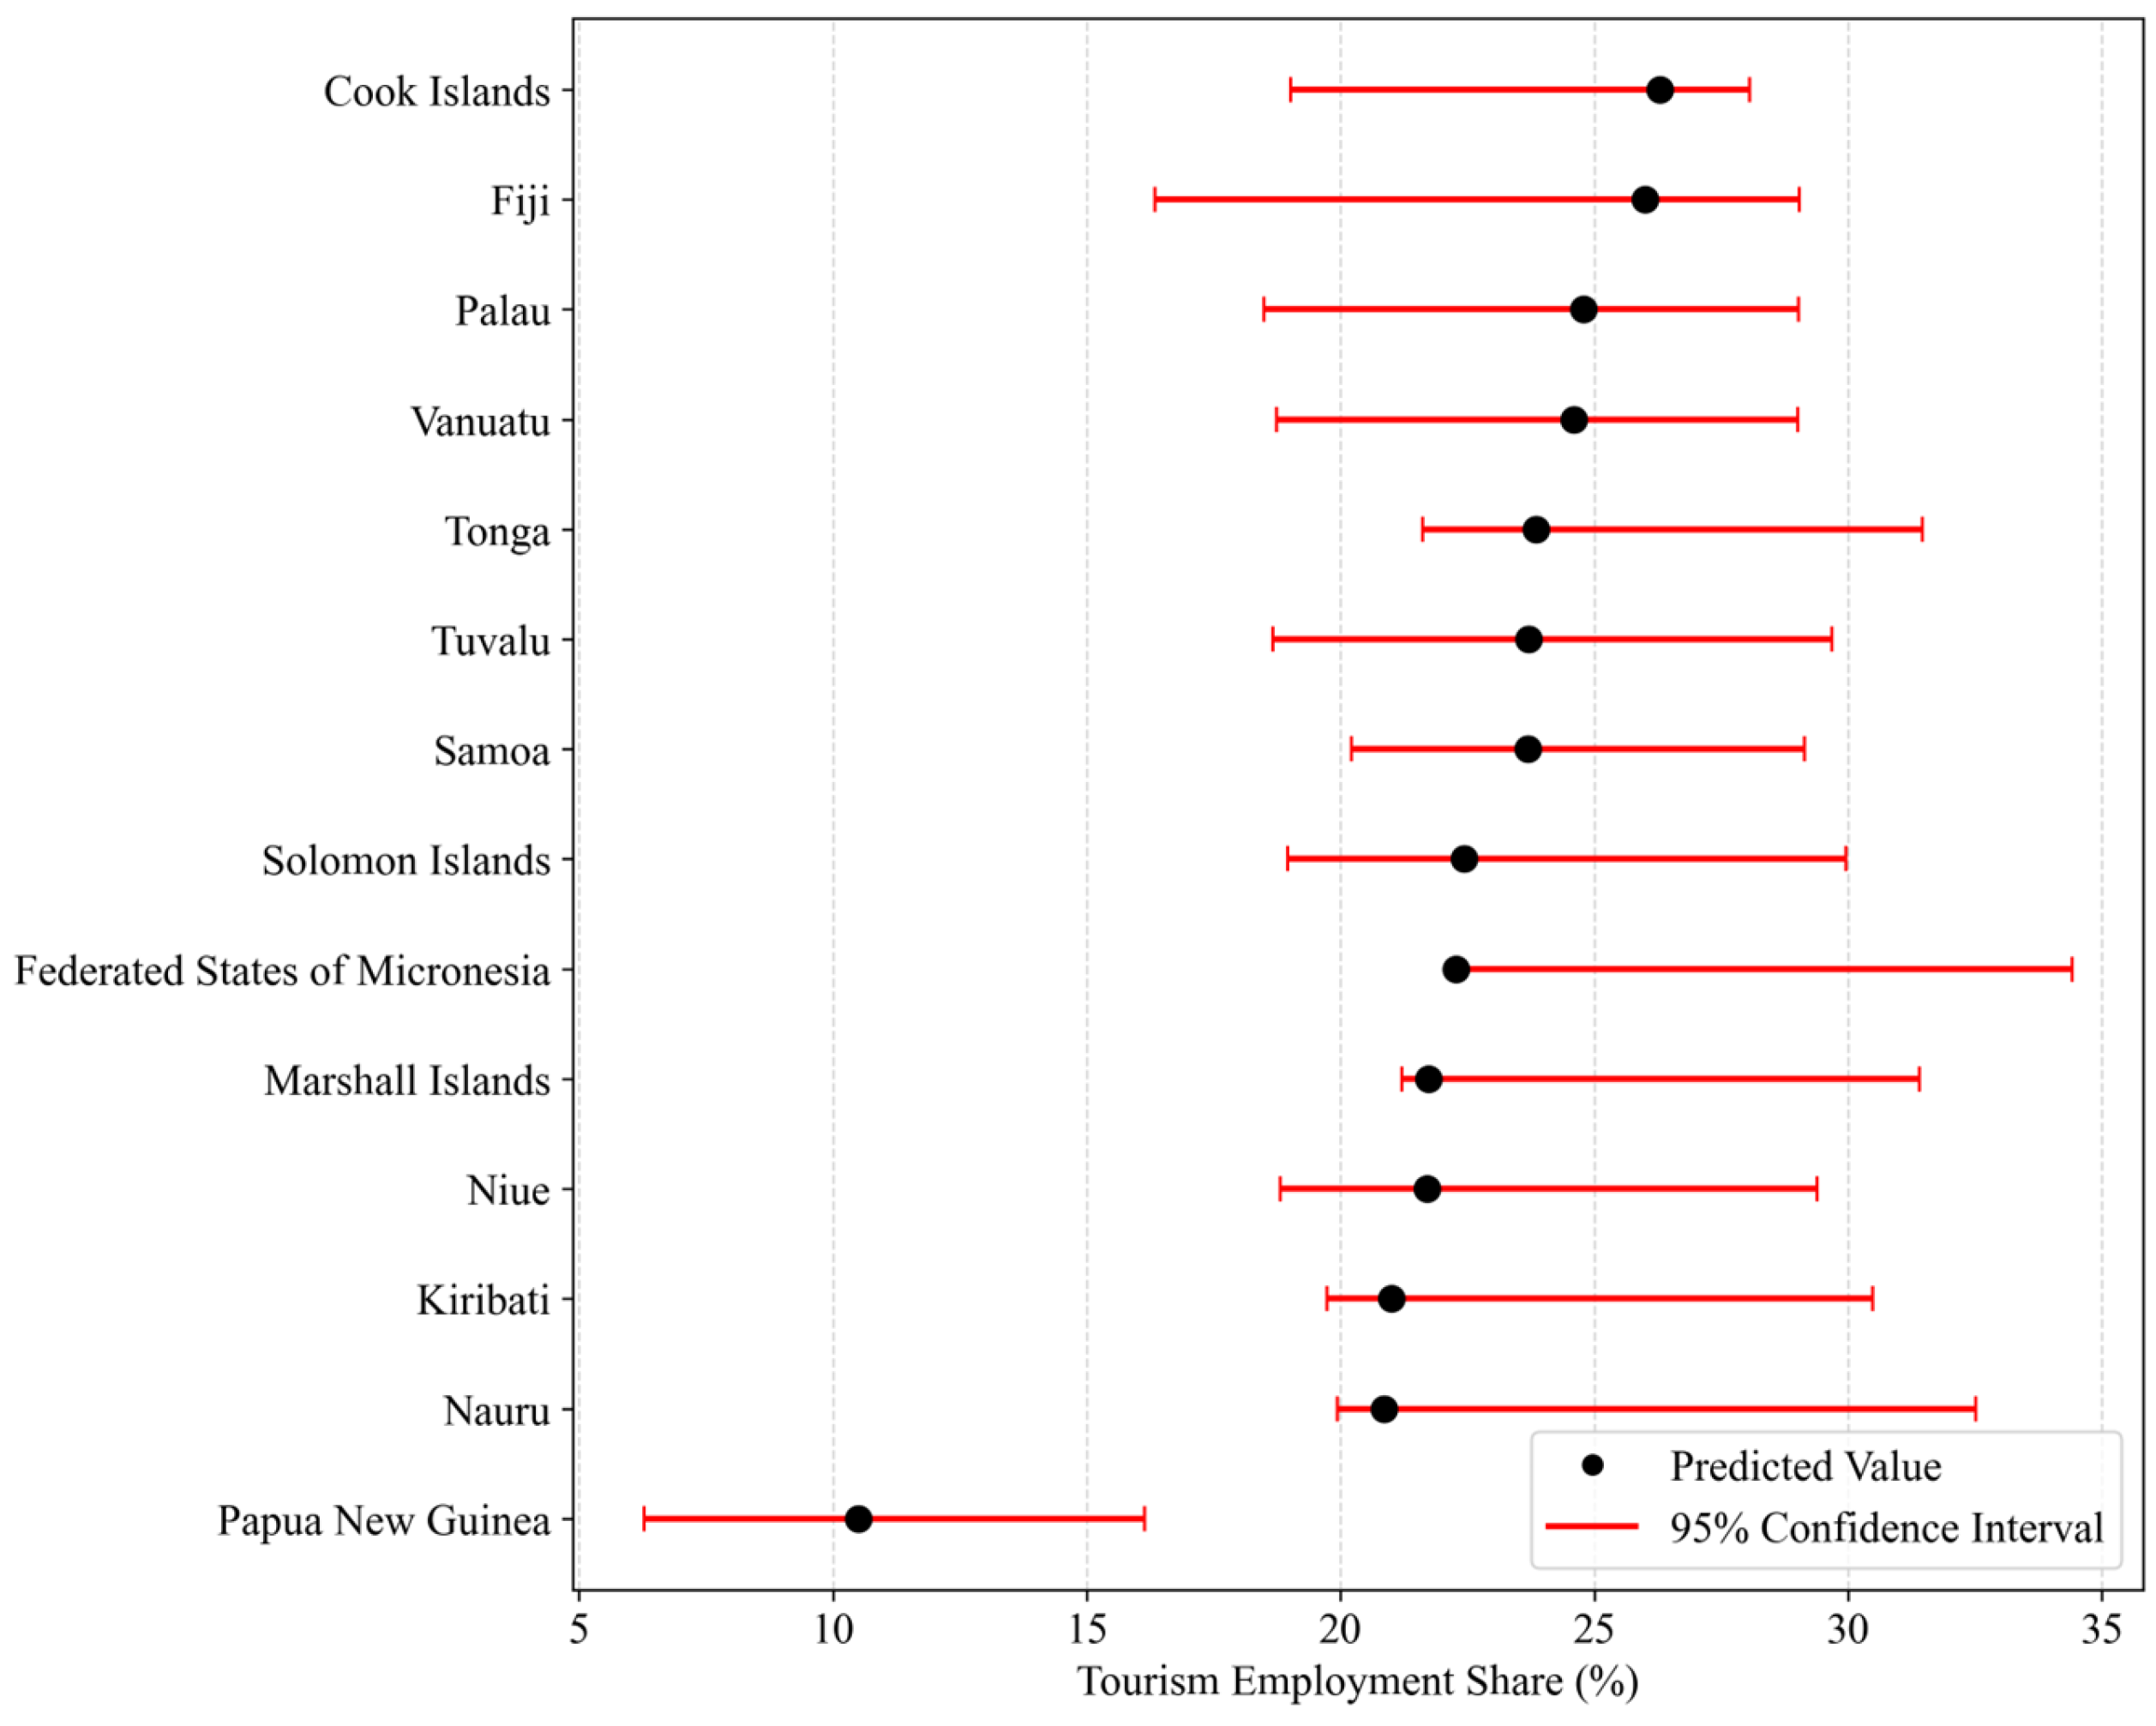
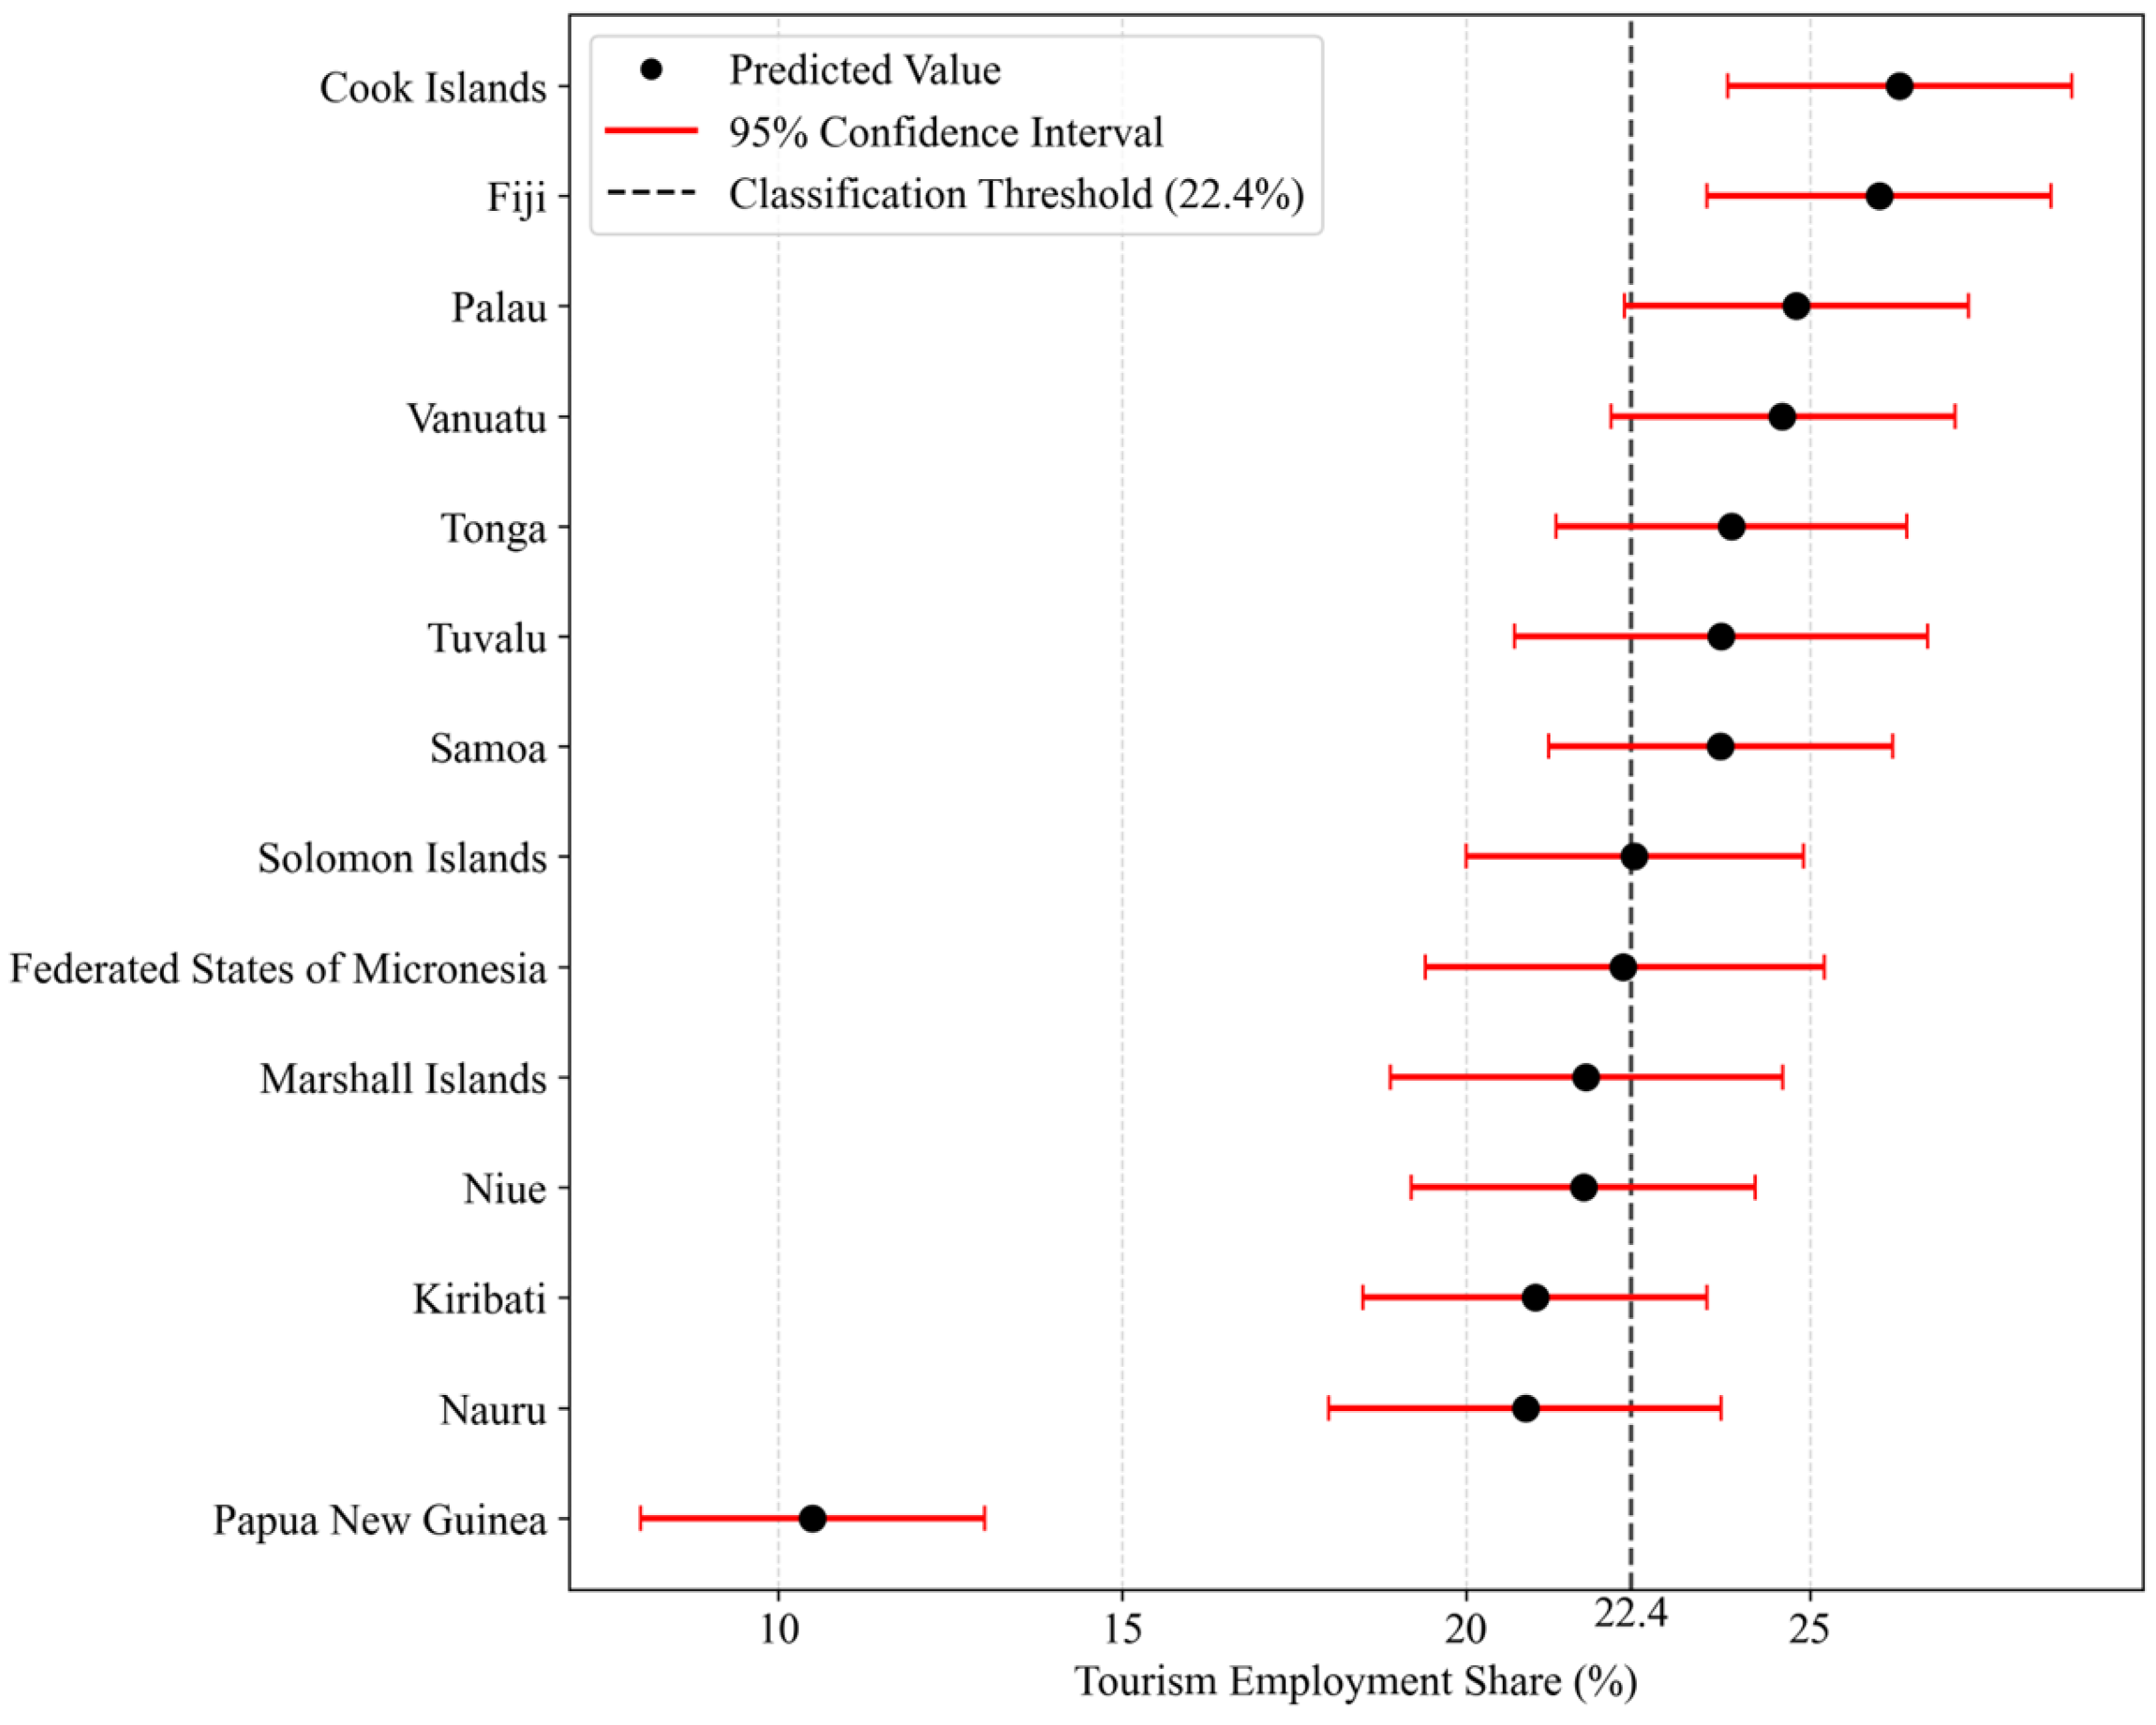
To ensure that model predictions were not significantly influenced by specific training samples, a robustness test was conducted using the Bootstrap resampling method [42]. This approach is particularly appropriate for this model, as it allows for a rigorous assessment of predictive stability and the quantification of uncertainty without requiring restrictive assumptions about the underlying data distribution, which is essential given the specific scale of the dataset. Specifically, one hundred resamples were generated by drawing 44 coastal cities with replacement from the total pool of 44 cities. This procedure ensured that each resample maintained the original sample size while introducing variation in the sample composition to evaluate the model’s sensitivity to specific data points. These resamples were then used to train the model and predict the proportion of tourism employees in Pacific Island Countries, and the 95% confidence intervals of the predictions were computed. As illustrated in Figure 11, all original predicted values for the countries fell within the confidence intervals, with standard deviations ranging from 2.48% to 3.72%. These numerical results indicate that the model was insensitive to changes in the training samples and that the predictions were robust.

3.4.3. Logical Consistency Test

Logical consistency testing is a critical step to ensure that empirical predictions align with foundational economic principles, particularly the causal mechanism where the scale of the labor force expands in response to growing market demand. To evaluate this, Spearman’s rank correlation analysis [43] was conducted, with the statistical results presented in Table 3. The analysis revealed that the number of tourism employees was significantly positively correlated with both inbound tourist arrivals and the density of tourism-related POIs (ρ = 0.714 and 0.736, respectively, p < 0.01). This significant correlation confirms that tourism employment is directly driven by the interplay between market demand and supply-side infrastructure. Furthermore, these results indicate the model’s accurate reflection of the tourism industry’s operation, validating its ability to capture the sector’s underlying economic logic.

3.4.4. Cross-Regional Transferability Validation of the Model

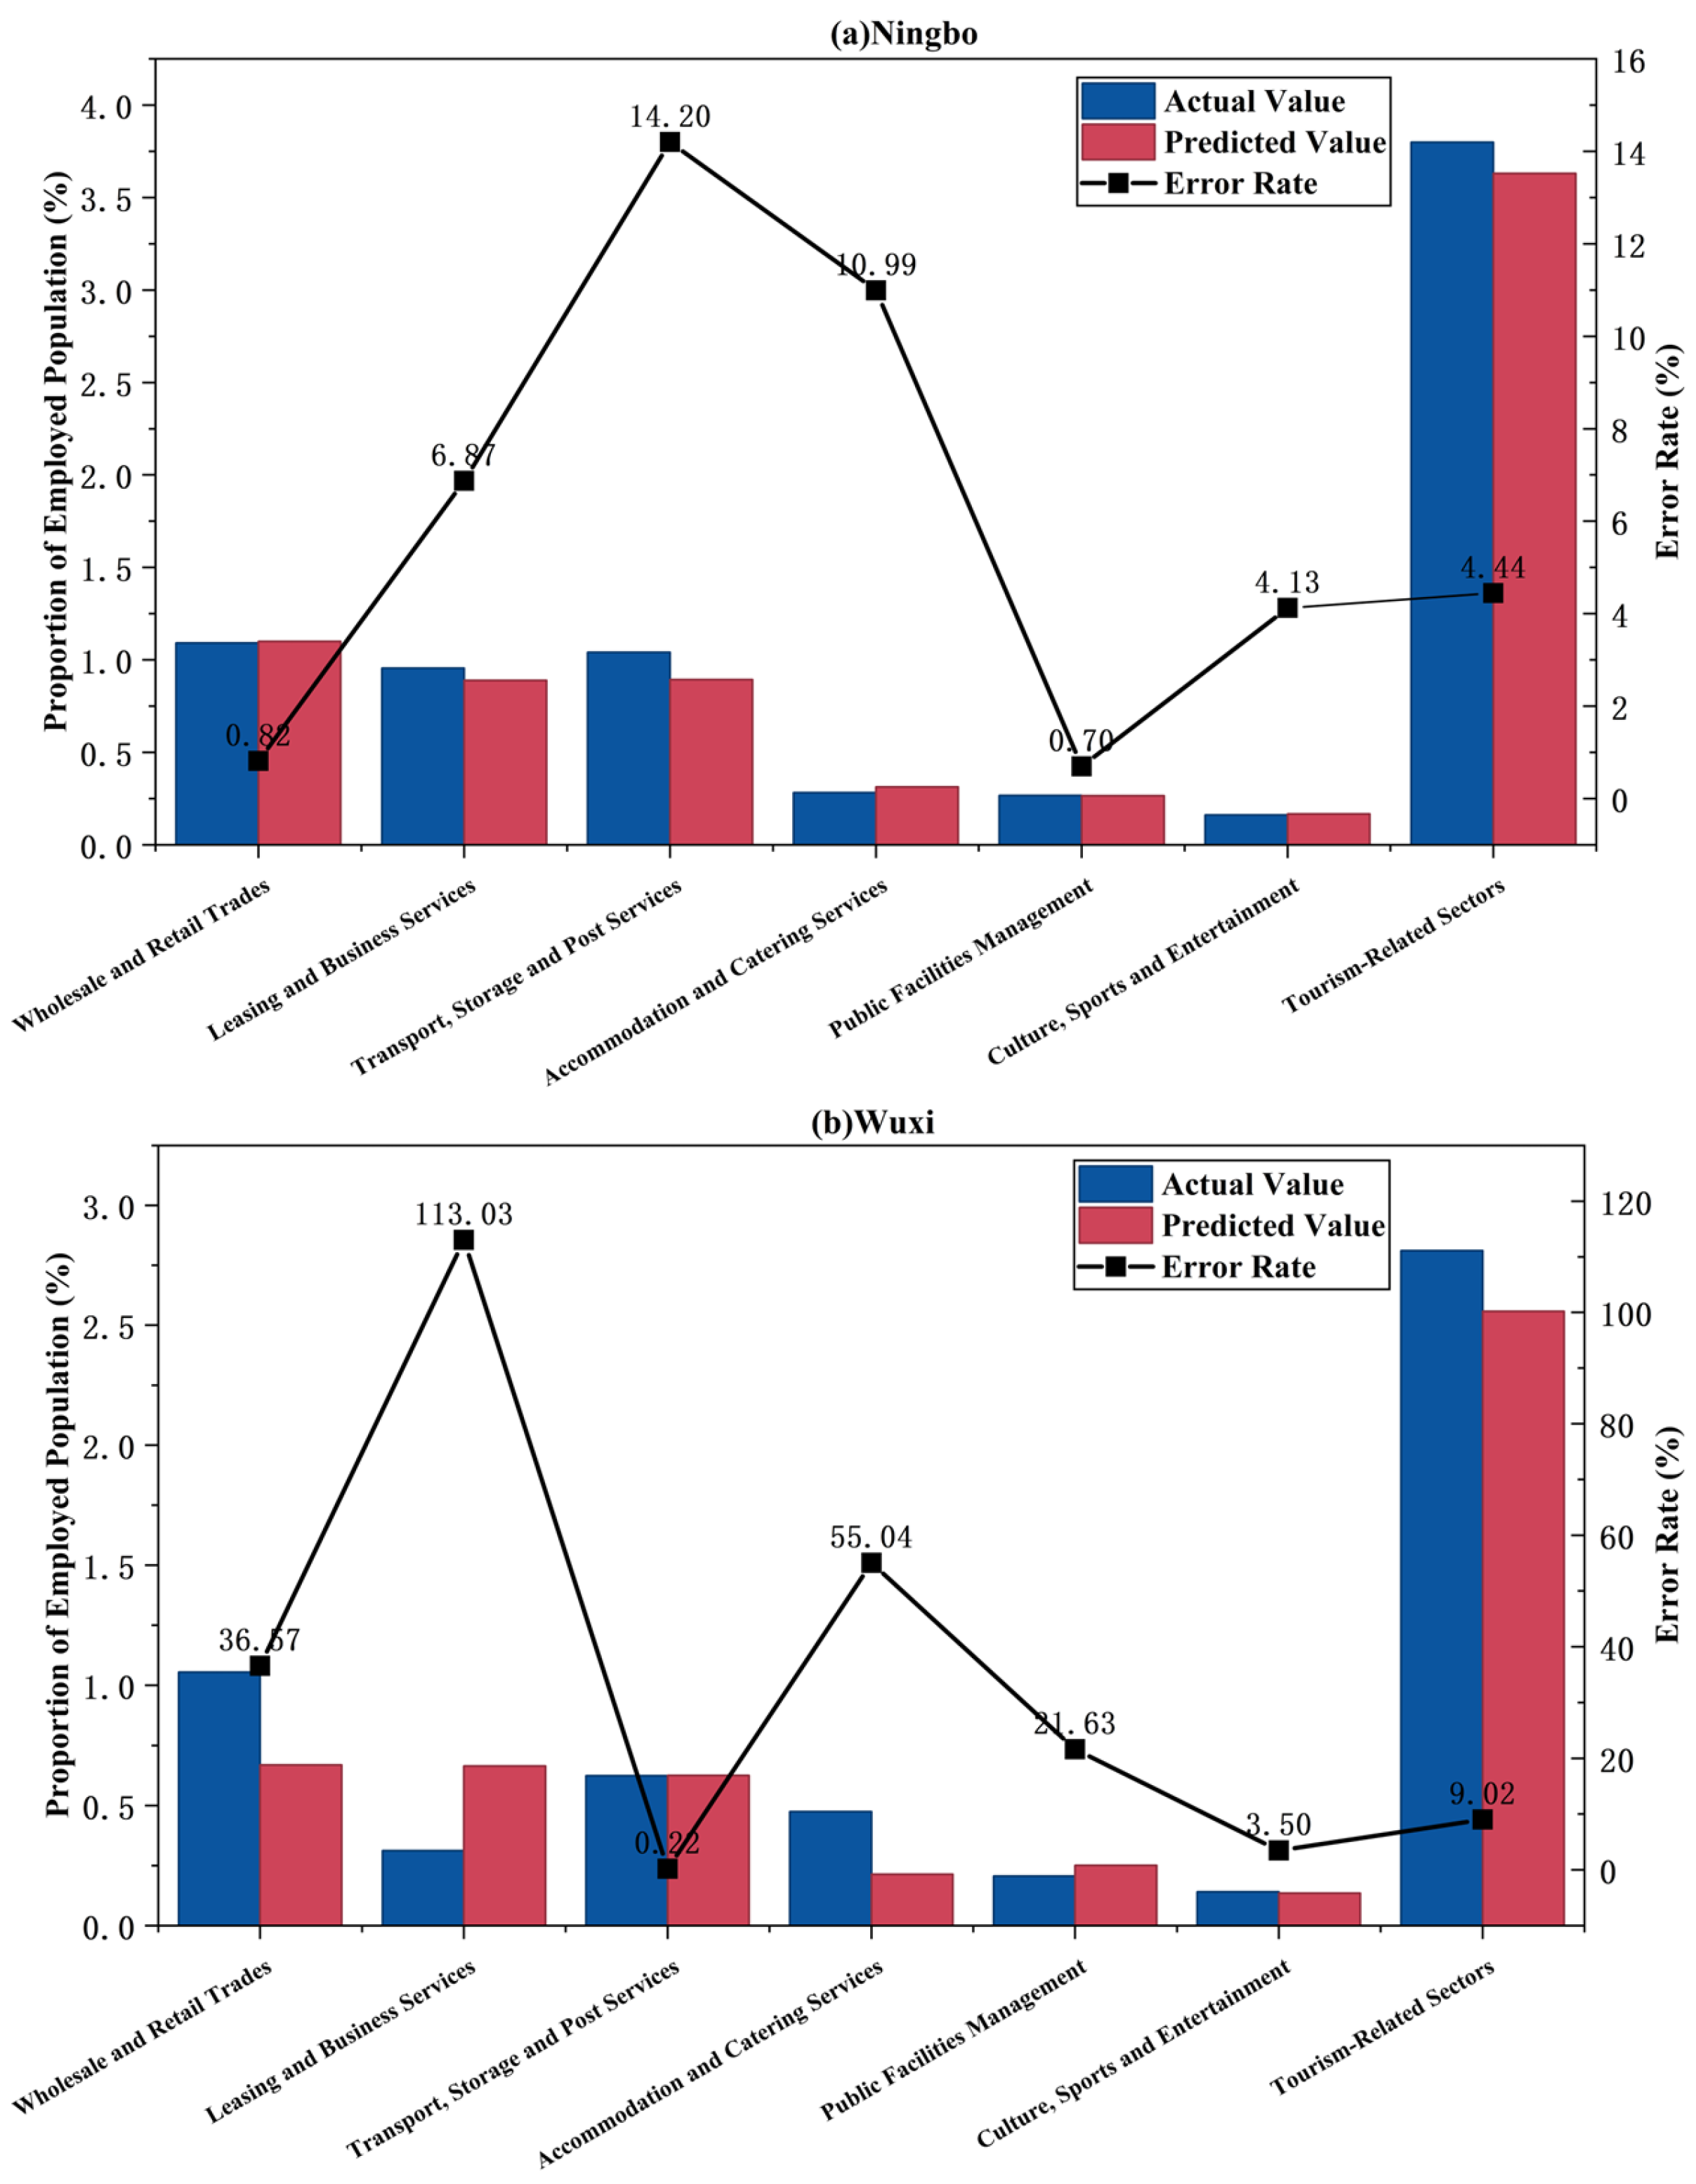
To rigorously evaluate the model’s cross-regional transferability, Ningbo and Wuxi were selected for a comparative analysis. Ningbo, a coastal city included in the training set, serves as a benchmark for internal fitting accuracy, while Wuxi, an inland city omitted from the training phase, was selected as an external validator due to its industrial structure closely mirroring that of coastal regions. The characteristic data for both cities were averaged over the period from 2012 to 2017. To establish a rigorous evaluation framework, a 10% error threshold was adopted as the benchmark for high-precision forecasting, a standard frequently utilized in regional economic modeling to distinguish reliable estimations from broader approximations.
The test results are presented in Table 4 and Figure 12. The aggregate error rate for the six tourism-related sectors in Ningbo was 4.44%, which is significantly below the 10% threshold, indicating that the model achieves exceptional fitting accuracy for cities within the training set. For Wuxi, the overall error rate was 9.02%, also remaining within the 10% margin, thereby demonstrating the model’s robust predictive capacity for cities with similar industrial compositions. At the sectoral level, prediction accuracy was notably high for Transport, Storage and Post Services (0.22%) and Culture, Sports and Entertainment (3.50%). However, larger discrepancies were observed in Leasing and Business Services (113.03%) and Accommodation and Catering Services (55.04%). These deviations reflect Wuxi’s status as a manufacturing-intensive city, where the employment structures of business services and catering diverge significantly from those of coastal tourism-oriented cities. While such structural inconsistencies may introduce sectoral volatility, they do not compromise the model’s fundamental reliability in estimating the aggregate magnitude of tourism employment. These findings imply that the model possesses strong cross-regional applicability at the macro level, though its sectoral precision remains sensitive to specific local economic specializations. This underscores the necessity of accounting for regional industrial heterogeneity when deploying the model for fine-grained sectoral analysis.
The internal performance evaluation reported in Section 3.1 established that the random forest model successfully captured stable POI-employment mapping relationships within the training domain, yielding coefficients of determination (R2) between 0.541 and 0.826 across twelve sectors, with root mean square errors (RMSE) and mean absolute errors (MAE) consistently below 0.026 and 0.018, respectively. Building upon these results, the four validation exercises presented in Section 3.4.1—aggregate consistency, Bootstrap robustness, logical consistency, and cross-regional transferability—constitute a systematic external validation framework. This framework substantiates and extends the internal findings along two primary dimensions.
On the one hand, external validation confirms the model’s macro-level robustness across different regions. The aggregate consistency test reveals that total employment prediction errors for all 14 PICs remain below the 10% threshold. Furthermore, the Bootstrap resampling test indicates that all predicted values fall within the 95% confidence intervals, with narrow standard deviations ranging from 2.48% to 3.72%. Logical consistency is evidenced by significant positive correlations between predicted tourism employment and both inbound tourist arrivals (ρ = 0.714, p < 0.01) and tourism-related POI counts (ρ = 0.736, p < 0.01). Additionally, cross-regional transferability tests show that error rates for tourism-related sectors in both in-sample (Ningbo, 4.44%) and out-of-sample (Wuxi, 9.02%) cities are well-contained within 10%. Collectively, these four lines of evidence corroborate the internal metrics, demonstrating that the model’s POI-employment associations generalize effectively to the target PICs.
On the other hand, external validation highlights sector-specific predictive sensitivities that are only latent in the internal evaluation. For example, Wuxi exhibited pronounced sectoral error rates in Leasing and Business Services (113.03%) and Accommodation and Catering Services (55.04%), sectors that previously showed moderate internal R2 values (approximately 0.60–0.65). This suggests that fitting uncertainties identified during internal evaluation can be significantly magnified when the model is transferred to regions with divergent industrial specialization. Wuxi, as a manufacturing-intensive hub, possesses employment structures in business and catering services oriented toward local industrial demand rather than tourism, representing a structural departure from the tourism-centric training cities. Such sensitivity underscores that while the model is robust at an aggregate level, its transferability is contingent upon the degree of industrial structural similarity between the training and target domains. Therefore, future applications of this framework to economically distinct regions should incorporate supplementary local calibration.

3.5. Assessment of Tourism Functions in Pacific Island Countries

3.5.1. Tourism Specialization Analysis

To assess the specialization degree of tourism functions, this study employs the Location Quotient (LQ) based on regional employment data. As illustrated in Table 5, the results reveal distinct tiers of specialization across the Pacific Island countries, indicating that tourism serves as a regional advantage for most nations.
Seven countries, including Samoa, Tonga, and The Cook Islands, exhibit high specialization with LQ values exceeding 1.30. In these nations, tourism functions are highly concentrated. This significant clustering of businesses and resources enhances their capacity to serve international markets, positioning tourism as a primary pillar of their national economies. A second group, including Tuvalu and Nauru, demonstrates a moderate level of specialization with LQ values ranging between 1.11 and 1.23. While the industry is competitive in these countries, it has not yet reached the level of dominance found in the high-specialization tier. Finally, countries such as Kiribati and The Federated States of Micronesia show a limited degree of specialization, with LQ values only slightly above 1.0. This suggests that while tourism provides a specialized advantage, its overall impact on the economic structure remains secondary.
Papua New Guinea stands as a notable exception to these trends. Despite accounting for 51.2% of the region’s total tourism employment by volume, it maintains an LQ of only 0.91. Its internal proportion of tourism employees is just 10.5%. This reflects the relatively limited role of tourism in its national economy. In this case, the sector does not yet function as a specialized regional advantage compared to the country’s other economic activities.

3.5.2. Nelson Method-Based Assessment of Urban Tourism Functions

The Nelson method assesses urban functions by measuring the deviation of specific indicators from the regional average, providing a comparative basis for evaluating the relative prominence and specialization of tourism sectors. Under this framework, tourism functions are analyzed across two dimensions: scale and intensity. “Functional scale” represents the absolute magnitude of tourism activity, categorized as “large,” “medium,” or “small” based on its volume relative to the regional mean. “Functional intensity” indicates the degree of “specialization,” defined as the extent to which a country’s tourism concentration exceeds the regional average; countries surpassing this average by a specific standard deviation are termed “specialized,” while those falling below are labeled “low-specialization.”
Based on the 2 × 3 classification framework (Figure 6), the Pacific Island Countries are provisionally grouped into three types, with the caveat that most assignments are subject to the classification uncertainties quantified below. The first category, medium-large specialized tourism island countries, comprises Fiji; The Cook Islands; Vanuatu; and Samoa. The second category, small specialized tourism island countries, includes Tuvalu; Palau; The Solomon Islands; and Tonga. The third category, low-specialization tourism island countries, consists of Papua New Guinea; Kiribati; The Federated States of Micronesia; Nauru; Niue; and The Marshall Islands. Specifically, the assessment results presented in Table 6 indicate that in terms of functional scale, Fiji is classified as large; four nations are medium; and nine are small. Regarding functional intensity, eight countries are classified as specialized, whereas six are identified as low-specialization. Overall, the tourism functions of most countries in this region remain at a small-to-medium scale and a low-specialization stage of development.
To assess the stability of the Nelson-based functional intensity classification, we employed 95% Bootstrap confidence intervals (CIs) to establish an explicit logic for categorization relative to the regional mean threshold of 22.4% (Figure 13). This approach ensures that classifications are not based on point estimates alone but account for model prediction uncertainty: countries are “robustly specialized” if their entire CI exceeds the threshold, “robustly low-specialization” if the entire CI remains below it, and “boundary cases” if the CI spans the threshold, indicating sensitivity to prediction variability. As illustrated in Figure 13, a pronounced gradient of classification robustness emerges. Fiji (26.00%, 95% CI [23.5%, 28.5%]) and The Cook Islands (26.29%, 95% CI [23.8%, 28.8%]) are the only two countries whose tourism specialization is unequivocally robust. This robust status is significant as it suggests a structural entrenchment of the tourism sector that persists even under pessimistic model estimates, marking these economies as resilient regional hubs. At the opposite end, Papua New Guinea (10.50%, 95% CI [8.0%, 13.0%]) is the sole country where a low-specialization status is indisputable, with its upper bound falling far short of the regional threshold. For the remaining 11 countries, the classification is inherently marginal. One group, comprising Vanuatu (24.59%), Palau (24.79%), Tonga (23.85%), and Samoa (23.69%), shows mean values exceeding the threshold with lower bounds falling short, indicating they are ‘likely specialized.’ Conversely, Nauru (20.86%) and Niue (21.70%) are ‘likely low-specialization’ because their upper bounds exceed the threshold, suggesting latent potential for functional upgrading. The most sensitive boundary cases—Tuvalu (23.70%), Solomon Islands (22.44%), Kiribati (21.00%), The Federated States of Micronesia (22.28%), and The Marshall Islands (21.74%)—straddle the 22.4% threshold almost symmetrically. For these five economies, the assignment to either category is highly susceptible to minor fluctuations in data and cannot be established with statistical certainty. The prevalence of such marginal cases necessitates a methodological caution: the tourism functional typology proposed here should be viewed as a continuous gradient rather than a set of absolute, mutually exclusive categories. Because nearly 80% of the sampled economies occupy transitional positions, the analysis indicates that only the extreme endpoints—represented by Fiji, The Cook Islands, and Papua New Guinea—constitute stable functional types. For the majority of PICs, the classification functions as a strategic guide for policy orientation instead of a fixed diagnostic label.

4. Discussion

By integrating Point of Interest (POI) data with a random forest algorithm, this study constructs an employment sectoral distribution model that effectively mitigates the persistent challenges of systematically assessing urban tourism functions in Pacific Island Countries (PICs). The pervasive scarcity of granular socio-economic statistics in the region has historically impeded the identification of spatial functional zones, thereby constraining the formulation of evidence-based tourism policies. The empirical results demonstrate that the model exhibits robust cross-regional transferability, ensuring its reliability across heterogeneous island contexts. By categorizing tourism functions into three distinct archetypes, the model reveals the nuanced spatial patterns of urban economic activities, providing a critical diagnostic foundation for regional strategic planning. Beyond establishing the technical applicability of this framework, it is essential to elucidate the mechanisms shaping these functional identities. Therefore, the following discussion explores the driving factors of tourism function differentiation, followed by an analysis of the study’s limitations and future research prospects.

4.1. Applicability of the Model in Data-Scarce Regions

Combining POI data with machine learning offers a robust framework for estimating economic structures in regions lacking comprehensive statistical data. The model achieved high prediction accuracy across Pacific Island Countries, with error rates for the total employed population in all 14 nations remaining below 10%. Specifically, the predicted volume of tourism employees exhibited a substantial positive correlation with both inbound tourist arrivals and tourism-related POI counts. These results demonstrate that POI data serve as reliable proxies for the intensity of regional economic activities because they represent the discrete physical locations and functional categories of socio-economic entities. For instance, the spatial density of commercial and service-oriented POIs correlates closely with employment clusters in the retail and hospitality sectors, providing a granular view of industrial concentration that traditional aggregate statistics often miss [19,44]. This novel methodological attempt for urban function research operates on the principle of cross-regional knowledge transfer: it extracts complex non-linear association patterns between multi-dimensional POI features and employment structures from data-rich coastal cities in China and applies these learned weights to data-scarce regions. By mapping observable physical infrastructure to latent socioeconomic functions, this approach bridges critical data gaps in areas where traditional census information is difficult to obtain.

4.2. Factors Influencing the Differentiation of Tourism Functions in Pacific Island Countries

To better understand the spatial and functional heterogeneity of tourism in the region, this analysis focuses on the specific tourism characteristics of individual Pacific Island Countries (PICs). These nations exhibit varying capacities to attract visitors, provide services, and stimulate industrial growth. Fiji, a leading medium-large specialized tourism country, received 969,000 international tourists in 2019. This represented 46.8% of the regional total. Its success is driven by a strong reception capacity supported by hub facilities like Nadi International Airport. A well-developed hotel system and sustained government investment further bolster its position [23,45,46]. Economies of scale reduce operating costs in Fiji, while high industry investment improves service quality to create a self-reinforcing virtuous cycle. In contrast, medium-sized specialized countries like Vanuatu face significant constraints. Although Vanuatu receives 256,000 visitors, shortages in hotels and professional guides limit its access to high-end markets [23,47,48]. Small specialized tourism countries like Palau rely on unique ecological resources, such as the Jellyfish Lake, for differentiated development. However, small-scale airports restrict their reception capacity and accessibility.
Papua New Guinea (PNG) represents a low-specialization tourism island country that is large in scale but limited in functional strength. While it possesses vast natural biodiversity and rich indigenous cultural heritage, its tourism sector remains underdeveloped. Historically, the country’s policy priorities and resource allocation have been oriented toward traditional pillar industries, such as mining and energy [49]. Consequently, its annual tourist arrivals reach only 21.7% of Fiji’s levels, and tourism employees constitute a mere 17.97% of its workforce. Finally, small low-specialization countries like Nauru face the dual pressures of resource depletion and climate change. The collapse of the phosphate economy has created severe fiscal constraints. Additionally, rising sea levels and coral bleaching threaten the territorial security and resource base essential for tourism [50].
The differentiation of tourism functions in PICs is driven by four core mechanisms. First, the virtuous cycle of scale and efficiency allows countries like Fiji to use international hubs and transnational hotel investments to improve industrial efficiency. Second, the dual constraints of dependence and vulnerability affect small specialized countries like Palau. Although tourism contributes over 40% of their GDP, a reliance on single-source markets and limited infrastructure makes them highly susceptible to external shocks. Third, structural lock-in and policy orientation hinder low-specialization countries like PNG. These nations have chronically underinvested in tourism, resulting in employment levels far below the regional average. Fourth, external environmental shocks pose direct threats to low-lying micro-island countries, such as Tuvalu and Nauru, where climate change undermines foundational tourism resources.

4.3. Differentiated Development Pathways

The functional typology identified in this study provides a provisional basis for tailoring policy recommendations to distinct national contexts, acknowledging the classification uncertainties discussed in Section 3.5.2.
For medium-to-large specialized countries, including Fiji, The Cook Islands, Vanuatu, and Samoa, policy emphasis should shift from expanding visitor volume to enhancing value retention and environmental sustainability. In the short term, these nations should establish carrying capacity monitoring and seasonal visitor caps at ecologically sensitive sites, complemented by sustainability certification and fiscal incentives for tourism operators. Medium-term strategies should redirect investment toward high-value, low-volume products, such as cultural immersion and wellness retreats, while strengthening backward linkages between hotels and local producers to increase domestic revenue retention. Long-term objectives involve creating a National Tourism Resilience Fund, financed by tourism levies and international climate finance, to buffer against external shocks and support ecosystem restoration.
Small specialized countries, such as Palau and Tonga, along with boundary cases like Tuvalu and the Solomon Islands, should prioritize value maximization within carrying capacity limits. For boundary cases where functional intensity is marginal, comprehensive diagnostic assessments must precede major infrastructure investments. Initial actions include developing precise national branding for high-value niche markets and collaborating with neighbors on curated island-hopping routes. Over the medium term, these nations should address critical infrastructure bottlenecks, such as runway extensions, under strict environmental safeguards while establishing community incubator funds for skills training. To ensure long-term stability, these countries must diversify source markets and build ring-fenced contingency funds to mitigate vulnerability to external shocks.
Low-specialization countries, including Papua New Guinea, Kiribati, Nauru, Niue, and boundary cases like The Federated States of Micronesia and The Marshall Islands, require rigorous diagnostic assessments before committing to large-scale development. These evaluations should specifically address extractive industry crowding-out effects in Papua New Guinea and sea-level rise exposure in atoll nations. For resource-rich countries, pilot “resources-for-tourism” policies can link mining or energy concessions to mandatory tourism infrastructure investments. In the medium term, initiating low-cost, community-based ecotourism—such as mangrove kayaking or climate education tours—can build conservation support and generate modest economic returns. A long-term strategy should integrate tourism planning into National Climate Adaptation Strategies, designing facilities that double as coastal protection infrastructure eligible for climate finance. These pathways are offered as structured entry points for national planning rather than prescriptive blueprints.

4.4. Limitations and Prospects

This study aims to develop a robust methodological framework for quantifying urban tourism functions in data-scarce Pacific Island Countries (PICs) by integrating Point of Interest (POI) data with machine learning algorithms. The primary objective is to bridge the critical information gap in regions where traditional statistical data are fragmented, providing a scalable tool for cross-border comparative analysis and evidence-based sustainable regional planning. This approach is significant not only for its technical innovation in transfer learning—evaluating functional diversity and spatial patterns from data-rich coastal regions to small island states—but also for establishing a vital empirical baseline for long-term tourism management and policy formulation in the Pacific.
The efficacy of this cross-regional extrapolation is, however, inherently shaped by data-driven and structural constraints. The applicability of the model is primarily limited by the representativeness of the China–PIC transfer corridor. While coastal cities provided a foundational training set, the current framework may not fully account for diverse global urban morphologies. To improve generalizability, future iterations should expand the training sample to include a broader variety of global coastal archetypes, particularly other small island developing states (SIDS). Furthermore, the transferability of the model relies on an assumption of structural parity between domains that is challenged by “residual geographic bias.” This bias, stemming from differences in land tenure systems and the prevalence of informal employment in PICs, specifically impacts the classification accuracy of local service-oriented functions and informal tourism sectors. These structural and cultural discrepancies necessitate empirical corroboration through additional validation studies in diverse island settings to refine the framework’s cross-border reliability.
The analysis is constrained by three sequential data-related limitations that impede the precise characterization of tourism functions. First, scale insensitivity—the inability to distinguish the economic weight of large-scale resorts from small family-run guesthouses—introduces systematic bias into predicted employment shares, particularly in sectors where firm size varies substantially. This directly affects the study’s objective of accurately weighting the economic contribution of specific points of interest (POIs). Second, the reliance on heterogeneous data sources (Baidu Maps for China and OpenStreetMap for PICs) introduces misalignments in tagging granularity and semantic depth. These discrepancies affect model parameters during feature mapping, potentially compromising the classification validity for specialized services in remote regions. Third, as the study utilizes a single snapshot of POI distributions, it remains a static analysis, unable to capture the dynamic evolution of tourism functions over time.
Beyond these data constraints, the methodological framework is characterized by an asymmetric measurement precision between its two primary dimensions: functional scale and functional intensity. This creates a structural imbalance in the comparative framework. A functional scale, derived from administrative records of inbound arrivals, maintains high precision with minimal measurement error. Conversely, functional intensity is operationalized through model-predicted employment shares, which are subject to non-trivial prediction errors. As the cross-regional validation in Section 3.4.4 demonstrates, sectoral errors can exceed 50% when the model is transferred to regions with divergent industrial structures. This asymmetry propagates uncertainty into the composite classification. The sensitivity analysis in Section 3.5.2 (Figure 13) confirms that while the core typology remains robust, boundary cases such as Tuvalu, The Federated States of Micronesia, and The Marshall Islands demonstrate classification volatility, fluctuating between “specialized” and “low-specialization” depending on the estimate employed. Consequently, intensity classifications for economies near the Nelson thresholds—the statistical benchmarks based on standard deviation increments used to define industry specialization [4]—should be regarded as provisional.
To address these intertwined limitations, future research should pursue multiple avenues of improvement. First, targeted local field surveys in selected PICs would provide essential ground-truth data to recalibrate the POI-employment mapping model. Second, the sensitivity analysis framework developed in Section 3.5.2 should be institutionalized as a standard component of the classification workflow to distinguish robust assignments from boundary cases. Third, a multi-source spatiotemporal framework should be adopted: high-resolution nighttime light imagery and building footprints could serve as proxies for enterprise scale, while real-time mobility data would capture the fluid dynamics currently obscured by static POI data.
Furthermore, to ensure thematic coherence, the classification framework must explicitly integrate climate and environmental variables as distinct functional layers. These variables, which are of existential relevance to Pacific tourism, should be operationalized across three dimensions: physical exposure (e.g., extreme weather frequency) to identify threats to coastal infrastructure; ecological vulnerability (e.g., coral reef health) to assess the degradation of natural appeal; and adaptive capacity. Finally, integrating quantitative infrastructural indicators, such as airport passenger throughput and inter-island connectivity, would allow the model to simulate how specific investments might shift a country’s functional classification. Such a comprehensive approach will provide a more rigorous foundation for the evidence-based development strategies advocated in this study.

5. Conclusions

The industrial composition of the employed population serves as the fundamental basis for urban function classification. This study utilized this core metric to address the systematic lack of statistical data in Pacific Island Countries. We innovatively constructed an employment sectoral distribution model by integrating Point of Interest (POI) data with the random forest algorithm. The model design process involved extracting spatial features from POIs and training the algorithm to map these features to specific employment sectors. This approach enabled a quantitative assessment of urban tourism functions by analyzing the distribution of the workforce.
The model demonstrated strong predictive performance and cross-regional transferability. Predicted error rates for the total employed population remained below 10%. Additionally, the estimated scale of tourism employment showed a significant positive correlation with inbound tourist arrivals and tourism-related POIs. These results validate the model’s applicability in data-scarce regions and offer a methodological reference for similar urban studies.
Pacific Island Countries (PICs) are provisionally organized along a gradient of functional specialization based on the intensity and scale of tourism employment. This framework yields three broad categories: medium-to-large specialized (Fiji, Cook Islands, Vanuatu, and Samoa), small specialized (Tuvalu, Palau, Solomon Islands, and Tonga), and low-specialization (Papua New Guinea, Kiribati, Federated States of Micronesia, Nauru, Niue, and Marshall Islands). Within these groupings, Fiji and The Cook Islands consistently exhibit robust specialization, while Papua New Guinea remains stably low-specialization; conversely, the remaining eleven countries occupy transitional positions where classification is inherently uncertain.
Development pathways should be differentiated accordingly, while remaining flexible for boundary cases where classification is uncertain. Fiji should continue optimizing the synergy between its scale and specialization. Medium-sized specialized countries need to focus on closing critical infrastructure gaps. Low-specialization nations, such as Papua New Guinea, should promote broader economic diversification. Finally, small tourism islands must coordinate sustainable growth while enhancing climate-resilient infrastructure and developing renewable energy alternatives. Through these methodological innovations, this study addresses the challenge of evaluating urban functions based on employment composition in data-scarce regions. By clarifying the characteristics of each state and adopting tailored pathways, Pacific Island Countries can promote regional development and strengthen their positions in global governance.

Author Contributions

Conceptualization, F.X. and S.S.C.; methodology, F.X.; software, F.X.; validation, F.X.; formal analysis, F.X.; investigation, F.X.; resources, S.S.C.; data curation, F.X.; writing—original draft preparation, F.X.; writing—review and editing, S.S.C.; visualization, F.X.; supervision, S.S.C.; project administration, S.S.C.; funding acquisition, S.S.C. All authors have read and agreed to the published version of the manuscript.

Funding

This research was funded by The National Natural Science Foundation of China (Grant No. 42161144003); National Key R&D Program of China (Grant No. 2018YFE0105900); Nanjing University of Information Science and Technology Talent Launch Fund and the Postgraduate Research & Practice Innovation Program of Jiangsu Province (Grant No. KYCX25_1618).

Data Availability Statement

The data presented in this study are derived from multiple open-access sources. Demographic and economic data for coastal cities in China were obtained from the China City Statistical Yearbook (2012–2017). POI data for Chinese coastal cities were collected from Baidu Maps (https://map.baidu.com, accessed on 15 September 2024) in September 2024. POI data for Pacific Island Countries were retrieved from OpenStreetMap (https://www.openstreetmap.org, accessed on 10 December 2024) in December 2024. Population and economic data for Pacific Island Countries were sourced from the World Bank (https://data.worldbank.org, accessed on 15 March 2025), official national statistical offices (e.g., Fiji Bureau of Statistics: https://www.statsfiji.gov.fj, accessed on 15 March 2025; Papua New Guinea National Statistical Office: https://www.nso.gov.pg, accessed on 15 March 2025), reports from the Population Division of the United Nations Department of Economic and Social Affairs (https://www.un.org/development/desa/pd, accessed on 15 March 2025), and the International Labour Organization (https://ilostat.ilo.org, accessed on 15 March 2025). Inbound tourist arrivals, GDP, and international tourism revenue data were obtained from the World Bank (https://data.worldbank.org, accessed on 15 March 2025).

Conflicts of Interest

The authors declare no conflicts of interest.

References

  1. Ma, X.L.; Zhang, C.Y. Zhangjiajie City Function Determination and Its Impact on Tourism Development. Econ. Geogr. 2014, 34, 167–173. [Google Scholar]
  2. Zeng, C.S.; Lin, M.S.; Zhan, D.S.; Lin, Y.; Wu, S. Progress and Prospect of Urban Function Characteristics and Formation Mechanism. Prog. Geogr. 2021, 40, 1956–1969. [Google Scholar] [CrossRef]
  3. Aurousseau, M. The distribution of population: A constructive problem. Geogr. Rev. 1921, 11, 563–592. [Google Scholar] [CrossRef]
  4. Nelson, H.J. A service classification of American cities. Econ. Geogr. 1955, 31, 189–210. [Google Scholar] [CrossRef]
  5. Webb, J.W. Basic Concepts in the Analysis of Small Urban Centers of Minnesota. Ann. Assoc. Am. Geogr. 1959, 49, 55–72. [Google Scholar] [CrossRef]
  6. Maxwell, J.W. A Functional Classification of Canadian Cities; University of British Columbia: Vancouver, BC, Canada, 1964. [Google Scholar]
  7. Berry, B.J.L. City Classification Handbook: Methods and Applications; John Wiley & Sons: New York, NY, USA, 1970. [Google Scholar]
  8. Sun, P.S.; Yang, T.X. The Functional Classification of Cities in Sichuan, Yunnan and Guizhou Provinces. Geogr. Res. 1984, 3, 17–28. [Google Scholar]
  9. Zhou, Y.X.; Sun, Z.X. A Further Discussion on the Functional Classification of Chinese Cities. Geogr. Res. 1997, 3, 11–22. [Google Scholar]
  10. Cao, G.Z.; Peng, R.X.; Liu, T. Characteristics and Evolution of Urban Functions in China, 2000–2020. City Plan. Rev. 2025, 49, 28–39. [Google Scholar]
  11. Qian, J.; Liu, Z.; Du, Y.; Liang, F.; Yi, J.; Ma, T.; Pei, T. Quantify city-level dynamic functions across China using social media and POIs data. Comput. Environ. Urban Syst. 2021, 85, 101552. [Google Scholar] [CrossRef]
  12. Chiesa, G.; Boffa, M.; Lanza, C.; Baldoni, V.; Fabiani, F.; Ravera, A. Automatic identification of urban functions via social mining. Cities 2023, 137, 104262. [Google Scholar] [CrossRef]
  13. Cheng, Y.W.; Zhang, H. Study on the Determination and Classification of Chinese Tourism Cities Based on Urban Function Theory. Mod. Urban Res. 2014, 2, 104–109. [Google Scholar]
  14. Bao, J.G.; Qu, M.Y. The Influence of Urban Basic and Non-Basic Functions on the Scale of Urban Tourism in Guangzhou. Econ. Geogr. 2023, 43, 23–34. [Google Scholar]
  15. Cai, M.Y.; Shi, J.Z.; He, X.R. From Tourism to Leisure: The Transformation Strategy of Tourism Cities in China. Econ. Geogr. 2022, 42, 225–231. [Google Scholar]
  16. Cui, F.J. The Development and Practice of Urban Tourism; China Travel & Tourism Press: Beijing, China, 2006; p. 65. [Google Scholar]
  17. Stephenson, M.L. Routledge Handbook on Tourism and Small Island States in the Pacific; AAG REVIEW: San Francisco, CA, USA, 2024; p. 20. [Google Scholar]
  18. Mirbach, C.; Pereira Santos, A.; Garschagen, M.; Hochschild, V.; Warth, G. Extracting socioeconomic information with the help of urban structure types indata-scarce environments. In Proceedings of the European Geosciences Union General Assembly 2024 (EGU24), Vienna, Austria, 14–19 April 2024; p. 21664. [Google Scholar]
  19. Wang, X.; Cheng, T.; Law, S.; Zeng, Z.; Yin, L.; Liu, J. Multi-modal contrastive learning of urban space representations from POI data. Comput. Environ. Urban Syst. 2025, 120, 102299. [Google Scholar] [CrossRef]
  20. Pan, C.; Wu, S.; Li, E.L.; Li, H.; Liu, X. Identification of urban functional zones in Macau Peninsula based on POI data and remote information sensors technology for sustainable development. Phys. Chem. Earth 2023, 131, 103447. [Google Scholar] [CrossRef]
  21. Niu, H.; Li, L.; Zhao, P. Analysing the dynamics of urban functional areas in a rapidly changing spatial structure: Using points of interest data. Cities 2025, 165, 106079. [Google Scholar] [CrossRef]
  22. Tang, Y.; Zhu, X.; Wu, Z.; Tang, Y. Identification and improvement of urban underground living center system based on POI data: A case study in Nanjing. Sustain. Cities Soc. 2025, 131, 106716. [Google Scholar] [CrossRef]
  23. Zhao, S.F.; Wang, Z.C.; Tian, Y. Report on the Development of Pacific Island Countries (2023); Social Sciences Academic Press: Beijing, China, 2024. [Google Scholar]
  24. Chen, X.C. A New Definition of the South Pacific Region: How Pacific Island Countries Constitute a Region. Pac. J. 2020, 28, 81–94. [Google Scholar]
  25. Wang, S.M.; Wang, Y.F. How to Define Pacific Island Countries. Pac. J. 2014, 22, 1–8. [Google Scholar]
  26. Wang, G.Y. Tourism Diplomacy Between China and Pacific Island Countries: Historical Basis, Realistic Motivation and Path Selection. Pac. J. 2021, 29, 83–94. [Google Scholar]
  27. Chen, X.C.; Lv, G.X. U.S. Strategy Towards Pacific Island Countries: Geopolitical Intentions and Limitations. Int. Stud. 2024, 6, 53–69. [Google Scholar]
  28. Wang, Y.M. Functional Classification and Analysis of Cities in Northern Xinjiang. Master’s Thesis, Xinjiang University, Urumqi, China, 2014. [Google Scholar]
  29. Liu, C.S.; Chen, Y.; Jian, Y.F.; Dong, R.T. Measurement and Spatio-Temporal Differences of Indirect Employment Driven by Tourism Industry in China. Acta Geogr. Sin. 2022, 77, 918–935. [Google Scholar]
  30. Fang, Y.P.; Peng, T.; Lu, L.X.; Bi, D.; Chen, Z. The Evolution Characteristics and Influencing Factors of Urban Functions in Guangdong-Hong Kong-Macao Greater Bay Area. Trop. Geogr. 2019, 39, 647–660. [Google Scholar]
  31. Zhang, L. Study on the Classification Standard of POI. Bull. Surv. Mapp. 2012, 10, 82–84. [Google Scholar]
  32. Liu, Y.J.; Zhang, X.L. Urban Functional Area Recognition and Its Mixed Degree Analysis Based on POI Data. J. Xi’an Univ. 2025, 28, 68–75. [Google Scholar]
  33. Belussi, A.; Cinelli, A.; Vecchia, A.D.; Migliorini, S.; Quaresmini, M.; Quintarelli, E. Forecasting POI occupation with contextual machine learning. In Proceedings of the European Conference on Advances in Databases and Information Systems; Springer International Publishing: Cham, Switzerland, 2022; pp. 361–376. [Google Scholar]
  34. Bollenbach, J.; Neubig, S.; Hein, A.; Keller, R.; Krcmar, H. Using Machine Learning to Predict POI Occupancy to Reduce Overcrowding//INFORMATIK 2022; Gesellschaft Für Informatik: Bonn, Germany, 2022; pp. 393–408. [Google Scholar]
  35. Zhang, L.; Wang, L.L.; Zhang, X.D.; Liu, S. The Basic Idea of Random Forest Algorithm and Its Application in Ecology: A Case Study of Pinus yunnanensis Distribution Simulation. Acta Ecol. Sin. 2014, 34, 650–659. [Google Scholar]
  36. Liu, Z.L.; Gui, Z.P.; Wu, H.Y.; Qin, K.; Wu, J.; Mei, Y.; Zhao, J. Fine-Scale Population Spatialization by Combining Buildings and POI Data. J. Geomat. 2021, 46, 102–106. [Google Scholar]
  37. Sing, T.F.; Yang, J.J.; Yu, S.M. Boosted tree ensembles for artificial intelligence based automated valuation models (AI-AVM). J. Real Estate Financ. Econ. 2022, 65, 649–674. [Google Scholar] [CrossRef]
  38. Zhang, C.; Zhang, H.; Wu, S.; Li, S. Fine-Scale spatial simulation and interpretation of occupational population distributions using big data and machine learning. Habitat Int. 2026, 170, 103756. [Google Scholar] [CrossRef]
  39. Feng, W.R. Research on Tourism Development in Yunnan Based on Location Quotient Analysis. China Collect. Econ. 2024, 23, 38–41. [Google Scholar]
  40. Zhou, Q.; Ye, X.; Gianoli, A.; Hou, W. Exploring the dual impact: Dissecting the impact of tourism agglomeration on low-carbon agriculture. J. Environ. Manag. 2024, 361, 121204. [Google Scholar] [CrossRef] [PubMed]
  41. Li, T.H. GDP Data Quality Assessment Based on Regional Industrial Structure Matching. Stat. Decis. 2013, 19, 4–7. [Google Scholar]
  42. Wang, L.Y.; Li, Z.Q. Accuracy Evaluation of Nonlinear Models Based on Bootstrap Method and Its Weighted Sampling Improvement. Acta Geod. Cartogr. Sin. 2021, 50, 863–878. [Google Scholar]
  43. da Mota, V.T.; Farías-Torbidoni, E.; Pickering, C. Visitation to National Parks: Harnessing user-created content from a citizen science platform to assess temporal and spatial patterns in tourism and recreation. J. Outdoor Recreat. Tour. 2025, 52, 100976. [Google Scholar] [CrossRef]
  44. Zhu, P.; Li, J.; Wang, Z. Identifying functional agglomerations and urban centers using open-source data and machine learning: Framework, applications and planning implications. J. Urban Manag. 2025, 14, 1099–1114. [Google Scholar] [CrossRef]
  45. Tyllianakis, E.; Grilli, G.; Gibson, D.; Ferrini, S.; Conejo-Watt, H.; Luisetti, T. Policy options to achieve culturally-aware and environmentally-sustainable tourism in Fiji. Mar. Pollut. Bull. 2019, 148, 107–115. [Google Scholar] [CrossRef]
  46. Pratt, S. Evaluating economic stimuli in SIDS: A CGE analysis of tourism, remittances, and hotel investments in Fiji. Ann. Tour. Res. Empir. Insights 2025, 6, 100193. [Google Scholar] [CrossRef]
  47. Wang, Z.F.; Zhang, Q.S. Spatial Heterogeneity and Driving Mechanism of High-Quality Development Level of Health and Wellness Tourism in China. Geogr. Geo-Inf. Sci. 2025, 41, 125–133. [Google Scholar]
  48. Fang, Y.L.; Zhu, Z.G.; Lu, H.Y. Spatio-Temporal Evolution and Influencing Factors of Tourism Eco-Efficiency in Urban Agglomerations: A Comparative Study of the Yangtze River Delta and Pearl River Delta Urban Agglomerations. Geogr. Geo-Inf. Sci. 2025, 41, 134–141. [Google Scholar]
  49. Pipike, J.K. Comparative study between Fiji and Papua New Guinea tourism development: Lessons to learn from Fiji. Procedia-Soc. Behav. Sci. 2012, 65, 192–198. [Google Scholar] [CrossRef][Green Version]
  50. Wang, G.Y. Development Situation of Tourism Industry in Pacific Island Countries in 2020. In Report on the Development of Pacific Island Countries (2021); Chen, D.Z., Zhao, S.F., Eds.; Social Sciences Academic Press: Beijing, China, 2022; pp. 120–136. [Google Scholar]
Figure 1. Methodological framework of the study.
Land 15 00831 g001
Figure 2. Research region.
Land 15 00831 g002
Figure 3. Industry consolidation and mapping between POI categories and national economic sectors.
Land 15 00831 g003
Figure 4. POI structure and employment structure of the training sample.
Land 15 00831 g004
Figure 5. POI share vs. employment share for the six tourism-related sectors. The red solid line and light red shading show the linear regression fit with its 95% confidence interval. The Spearman rank correlation coefficient (ρ) and corresponding p-value (two-tailed) are annotated in each panel. Note: * p < 0.05, ** p < 0.01, *** p < 0.001.
Land 15 00831 g005
Figure 6. Classification of tourism cities.
Land 15 00831 g006
Figure 7. Model accuracy evaluation based on the random forest algorithm.
Land 15 00831 g007
Figure 8. Feature importance analysis results of the prediction model.
Land 15 00831 g008
Figure 9. SHAP value distribution of feature variables.
Land 15 00831 g009
Figure 10. Predicted proportions of the employed population in tourism-related sectors in Pacific Island Countries.
Land 15 00831 g010
Figure 11. Bootstrap robustness test of prediction results.
Land 15 00831 g011
Figure 12. Prediction error analysis for tourism-related sectors.
Land 15 00831 g012
Figure 13. Sensitivity analysis of tourism functional intensity classification using Bootstrap 95% confidence intervals.
Land 15 00831 g013
Table 1. Model performance comparison: Multiple Linear Regression (MLR) vs. Random Forest (RF).
SectorRFMLR
R2RMSEMAER2RMSEMAE
Agriculture, Forestry, Animal Husbandry and Fishery0.8130.0080.0040.1820.0170.010
Energy Production and Extraction0.5410.0080.0040.1030.0110.007
Manufacturing0.6550.0260.018−0.2440.0480.038
Finance and Real Estate0.6550.0160.0100.0160.0280.020
Wholesale and Retail Trades0.5840.0070.0030.2110.0090.005
Leasing and Business Services0.8060.0010.0010.0650.0030.003
Transport, Storage and Postal Services0.5810.0050.0030.2840.0060.004
Accommodation and Catering Services0.7730.0050.0020.4960.0070.005
Education, Science and Technology0.5800.0050.0030.3430.0070.005
Public Facilities Management0.8260.0010.0010.5860.0010.001
Social Services0.5960.0020.0020.4060.0030.002
Culture, Sports and Entertainment0.6120.0010.0000.4730.0010.001
Government Agencies and Social Organizations0.7050.0030.0020.5280.0040.003
Table 2. Error test results for total employed population in Pacific Island Countries.
CountryPredicted Employed Population (104 Persons)Actual Employed Population (104 Persons)Error Rate (%)
Tuvalu0.51 0.47 9.38
Kiribati5.89 5.40 9.08
Federated States of Micronesia3.83 4.20 8.85
Papua New Guinea307.22 341.00 9.91
Palau0.79 0.74 7.08
Cook Islands0.80 0.73 9.81
Solomon Islands31.22 28.60 9.15
Fiji41.00 37.60 9.05
Tonga5.00 4.60 8.72
Nauru0.36 0.40 9.21
Vanuatu15.80 14.50 8.97
Niue0.09 0.08 8.64
Samoa11.39 10.40 9.52
Marshall Islands2.68 2.50 7.39
Table 3. Spearman’s rank correlation analysis results.
Variable 1Variable 2Correlation Coefficient (ρ)p-Value (Two-Tailed)Sample Size N
Number of tourism employeesInbound tourist arrivals0.714 ***0.00414
Number of tourism employeesNumber of tourism-related POIs0.736 ***0.00314
Note: *** p < 0.01 (two-tailed).
Table 4. Empirical validation results of model transferability.
CityPredicted Proportion in Tourism-Related Sectors (%)Actual Proportion in Tourism-Related Sectors (%)Error Rate for Tourism-Related Sectors (%)Error Rate for All Sectors (%)
Ningbo3.633.804.442.19
Xiamen10.0310.595.3223.03
Wuxi2.562.819.022.49
Changzhou2.162.4311.1933.51
Table 5. Location quotient (LQ) values by country.
CountryLQ ValueCountryLQ Value
Tuvalu1.2265Fiji1.3150
Kiribati1.0621Tonga1.3315
Federated States of Micronesia1.0621Nauru1.1521
Papua New Guinea0.9090Vanuatu1.3066
Palau1.3006Niue1.0252
Cook Islands1.3297Samoa1.3329
Solomon Islands1.3174Marshall Islands1.1127
Table 6. Assessment and classification of urban tourism functions in Pacific Island Countries.
CountryInbound Tourist Arrivals (104 Persons)Proportion of Tourism Employees (%)Functional ScaleFunctional Intensity
Fiji 96.90 26.00 Large Specialized
Cook Islands 18.72 26.29 Medium Specialized
Vanuatu 25.60 24.59 Medium Specialized
Samoa 18.09 23.69 Medium Specialized
Papua New Guinea 21.10 10.50 Medium Low-Specialization
Tuvalu 0.36 23.70 Small Specialized
Palau 9.40 24.79 Small Specialized
Solomon Islands 2.89 22.44 Small Specialized
Tonga 9.40 23.85 Small Specialized
Kiribati 1.20 21.00 Small Low-Specialization
Federated States of Micronesia 1.80 22.28 Small Low-Specialization
Nauru 0.02 20.86 Small Low-Specialization
Niue 1.00 21.70 Small Low-Specialization
Marshall Islands 0.61 21.74 Small Low-Specialization
Disclaimer/Publisher’s Note: The statements, opinions and data contained in all publications are solely those of the individual author(s) and contributor(s) and not of MDPI and/or the editor(s). MDPI and/or the editor(s) disclaim responsibility for any injury to people or property resulting from any ideas, methods, instructions or products referred to in the content.